Abstract
This research explores the torque–angle behavior of M2/M3 screws in automotive applications, focusing on ensuring component reliability and manufacturing precision within the recommended assembly specification limits. M2/M3 screws, often used in tight spaces, are susceptible to issues like stripped threads and inconsistent torque, which can compromise safety and performance. The study’s primary objective is to develop a comprehensive dataset of torque–angle measurements for these screws, facilitating the analysis of key parameters such as torque-to-seat, torque-to-fail, and process windows. By applying Gaussian curve fitting and Gaussian process regression, the research models and simulates torque behavior to understand torque dynamics in small fasteners and remarks on the potential of statistical methods in torque analysis, offering insights for improving manufacturing practices. As a result, it can be concluded that the proposed stochastics methodologies offer the benefit of fail-to-seat ratio improvement, allow inference, reduce the sample size needed in incoming test studies, and minimize the number of destructive test samples needed.
Dataset License: CC-BY-NC
1. Introduction
In the automotive industry, M2/M3 screws and torque study analysis are essential for ensuring vehicle safety, performance, and manufacturing precision. Space-constrained applications commonly use M2/M3 screws, with a nominal diameter of 2 mm and 3 mm, to secure delicate electronic components, sensors, and interior fittings. These small fasteners are crucial for maintaining the integrity of automotive systems such as engine control units and infotainment systems [1,2].
However, several typical problems can arise with M2/M3 screws and torque applications. One common issue is stripped threads, which can occur if the screw is over-tightened or if the material it is threaded into is too soft. Stripped threads compromise the fastening integrity and may require re-tapping or using a larger screw, which can be costly and time-consuming. Material fatigue is another concern; repeated stress or vibration can cause screws to loosen over time, potentially leading to component failure or unsafe conditions [3]. Torque control and measurement techniques play a vital role in ensuring the quality and reliability of automotive manufacturing processes; for that reason, the authors of [4] emphasize the significance of accurate torque application to prevent fastener loosening and joint failures.
Torque-related problems also include inconsistent torque application, which can result from using faulty or improperly calibrated torque tools. Inconsistent torque can lead to an uneven stress distribution across components, affecting their performance and longevity [5]. Over-tightening can also cause material deformation or damage, while under-tightening can lead to the loss of components that might vibrate or detach, posing safety risks [6]. Proper torque study analysis is crucial for addressing these issues. Ensuring that screws are tightened to the correct specifications helps to maintain component performance, durability, and safety, which is essential in high-stress areas like engine mounts and braking systems [6]. Consistent torque application is vital for quality control, reducing variability in assembly, and enhancing vehicle reliability [5].
Corrosion and thermal cycling have significant impacts on the performance and longevity of screws, particularly in harsh environments. Corrosion can dramatically reduce the mechanical properties of screws, especially in humid or chloride-rich conditions, as shown by [7]. Thermal cycling also affects screw behavior; torque tends to decrease logarithmically with increasing temperature due to changes in material properties and lubricant viscosity [8]. Studies on screws further suggest that specific environmental conditions, such as optimal temperature and humidity, can enhance screw longevity and performance [9]. However, while these factors are generally detrimental, certain materials like Mg-Zn-Zr alloys demonstrate controlled degradation, making them promising candidates for specific applications [10,11]. In addition, literature reports indicate that the presence of a zinc coating does not affect the static strength of galvanized elements, but there is a reduction in fatigue strength when compared to non-galvanized elements [12,13,14].
Torque–angle curves are essential for ensuring reliable assembly and optimal performance in engineering applications, particularly in the automotive industry. These curves graphically represent the relationship between the torque applied to a fastener and the angle of rotation, offering a precise method for achieving accurate tightening. By utilizing torque–angle curves, engineers can fine-tune the tightening process to avoid over-tightening, which could lead to material deformation, or under-tightening, which could result in loose or misaligned components [5]. This method enhances the consistency of the assembly process, reducing variability caused by differences in friction and material properties. Moreover, torque–angle curves help in optimizing fastener design and tightening procedures during the design phase, leading to improved component performance and durability [5]. In manufacturing, they serve as a critical quality control tool, ensuring that each fastener is tightened within the optimal range, thereby maintaining high standards of product reliability [6].
This study aims to develop a comprehensive dataset of torque–angle measurement for M2/M3 screws. The datasets will be analyzed to determine key torque parameters, including torque-to-seat, torque-to-fail, and the process window, with the goal of optimizing assembly processes in engineering and automotive applications. To enhance the analysis, Gaussian curve fitting and Gaussian process regression will be employed to model and simulate the torque–angle data. This approach will enable the generation of predicted values and the refinement of process parameters. The ultimate objective is to improve assembly recommendations through a more precise understanding of torque behavior, leading to more effective manufacturing processes.
2. Literature Review
The torque–angle curve is a fundamental aspect of understanding the mechanical behavior of threaded fasteners. Foundational studies by [15,16] explored the relationship between applied torque and the resulting tension or clamping force, emphasizing friction, thread pitch, and material properties. For smaller fasteners, such as M2/M3 screws, more recent research has been conducted; the authors of [17] examined the unique torque–angle behavior of small screws used in precision applications, highlighting their sensitivity to material properties and installation techniques. Similarly, the authors of [18] focused on the torque–angle curves of micro-fasteners, noting that these screws exhibit a sharp torque increase during tightening, followed by a plateau or slight decrease as threads engage.
Automotive applications present distinct challenges for M2/M3 screws due to the need for precise control of the clamping force to ensure safety and performance. Studies by [19,20] underscore the difficulty of achieving consistency in torque application across large-scale manufacturing. Variations in torque can lead to inconsistent clamping forces, increasing the risk of component failure.
Additionally, the interaction of different materials in automotive assemblies presents challenges. For example, fastening steel components to aluminum or plastic substrates can result in differential expansion due to thermal cycling, as discussed in research by [21]. This can alter the torque–angle curve, potentially loosening screws or causing failure.
In the context of installation factors, proper lubrication is essential in reducing friction, which directly impacts the torque required for adequately seating and tightening screws. Moreover, the surface finish plays a significant role in ensuring the smooth interaction between the screw and the material. Incorporating these factors into the analysis enables better accounting for variations in friction and material interaction, improving torque predictions and enhancing the model’s relevance to real-world applications. Advanced lubricants are proven to greatly reduce wear and friction in automotive contexts, leading to improved performance and extended lifespan [22]. The tribological properties of lubricants, such as plastic deformation and burnishing, are key to maintaining consistent friction during assembly [23]. Surface roughness affects the interaction between screw threads, with fractal theory providing a conceptual framework for analyzing these interactions [24]. Additionally, coatings and surface treatments can significantly reduce wear volume loss, emphasizing the importance of surface finish in optimizing friction performance [25].
Nonetheless, the integration of lubrication and surface finish considerations into torque–angle analysis in automotive assembly presents significant challenges, particularly in terms of increased costs. The use of Supplementary Materials, such as specialized lubricants or coatings, raises production expenses, especially in high-volume manufacturing settings. The introduction of these variables also complicates process control, as lubrication and surface finishes can be susceptible to inconsistencies during application, potentially resulting in defects or variations in torque performance. Furthermore, the application of lubrication or surface treatment often extends assembly cycle times, thereby reducing overall line efficiency. Additionally, the use of lubricants during assembly may necessitate additional downtime or specialized equipment, affecting both productivity and capital expenditure.
Characterizing the torque–angle curve is crucial for ensuring reliable automotive assemblies. Accurate characterization allows engineers to predict clamping force based on the applied torque, minimizing the risk of fastener failure. The authors of [26,27,28] emphasized the importance of understanding this relationship in developing torque control strategies, such as torque–angle control or torque-to-yield methods, which are widely used in automotive manufacturing.
Moreover, torque–angle curve characterization aids in designing torque tools and equipment for specific applications, as highlighted by [29,30,31]. This is particularly important in automotive manufacturing, where automation is prevalent, and any deviation from the desired torque can lead to defects. A study by [32] analyzed the torque measurement issues, and the authors of [33] identified the critical characteristics of fasteners at highly loaded bolt joins.
One emerging area of research is the application of curve-fitting techniques to describe the component behavior [34,35], particularly the usage of Gaussian process (GP) regression to predict torque–angle results. GP regression offers a probabilistic approach to modeling the torque–angle relationship, allowing for predictions with associated uncertainty estimates. Curve fitting with GP models is especially valuable because it enables the creation of a predictive model based on a limited number of experimental observations. Studies by [36,37,38,39] have demonstrated that GP models can effectively capture the complex, nonlinear relationships inherent in torque–angle curves.
The significance of this approach lies in its ability to make inferences about the torque–angle behavior under different conditions without the need for exhaustive testing. This is particularly beneficial in automotive applications, where reducing the number of test samples can lead to substantial cost and time savings. By accurately predicting the torque–angle curve, engineers can optimize fastening processes and ensure consistent performance across a wide range of scenarios.
Furthermore, the uncertainty quantification inherent in GP models provides insights into the reliability of predictions, which is critical for applications where safety and precision are paramount. In this context, the use of GP regression not only improves the efficiency of the testing process but also enhances confidence in the resulting torque–angle predictions.
Despite advances, several gaps remain in the understanding of torque–angle behavior for M2/M3 screws in automotive applications. A significant gap is the lack of comprehensive studies on the long-term effects of environmental exposure, such as corrosion and thermal cycling, on the torque–angle curve for small screws. The authors of [26] addressed these factors for larger fasteners; more research is needed for smaller screws. Another gap is the limited understanding of how installation variables, such as tightening speed, lubrication, and surface finish, affect the torque-time curve for M2/M3 screws. Studies by [40,41,42,43] suggest that these factors can significantly influence fastening outcomes, but they are often not fully accounted for in existing models.
Finally, the application of advanced statistical methods like Gaussian process regression in torque–angle analysis is still in its early stages. More research is needed to refine these models and explore their potential in automotive applications, particularly in terms of reducing the need for extensive experimental testing.
3. Materials and Methods
Understanding the torque characteristics for each screw joint is essential for designing a robust screw drive assembly process. This analysis captures the torque curve and quantifies the torque-to-seat, torque-to-fail, and seating torque values and their variations. This information is crucial for calculating the assembly process capability and selecting the appropriate driver. Figure 1 depicts a typical torque study analysis, with lines representing the statistical maximum and minimum torque curves. If the applied torque exceeds the upper specification limit (USL), there is a high likelihood of screw joint failure. Conversely, if the applied torque is below the lower specification limit (LSL), the screw may not be properly seated.
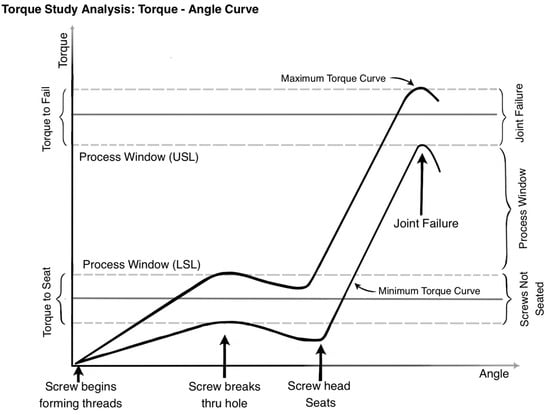
Figure 1.
Torque–angle curve characterization.
The area between the USL and LSL represents the process window, defined as the range of operating conditions within which a manufacturing or assembly process can produce acceptable results consistently. Within this range, screws are properly seated without causing joint failure. Operating within the process window ensures that the assembly process is both effective and reliable, minimizing defects and maximizing quality.
The steps to complete a torque study are listed below (Figure 2):
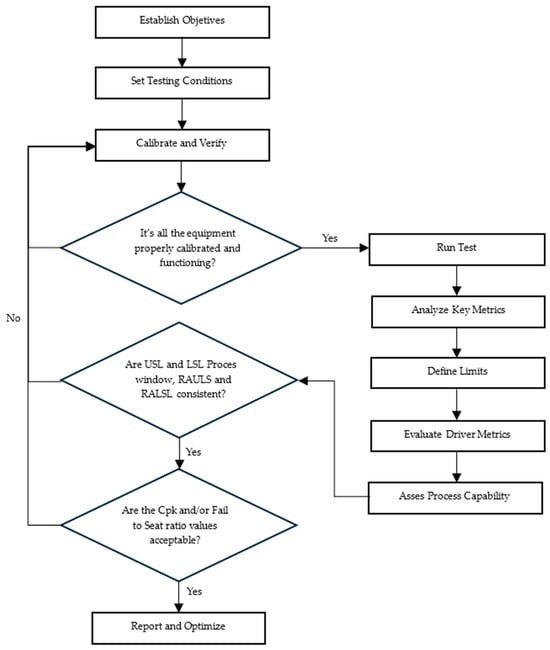
Figure 2.
Torque–angle study steps.
- Establish objectives: Define the purpose of the torque study based on product needs.
- Set testing conditions: Specify parameters such as screw type, material, and environment.
- Calibrate and verify: Ensure all equipment is properly calibrated and functioning.
- Run tests: Drive screws to failure under production conditions, gathering torque curve data.
- Analyze key metrics: Record and calculate important values like torque-to-seat, torque-to-fail, and statistical metrics (average and standard deviation).
- Define limits: Use collected data to calculate specification limits and recommended assembly torque ranges.
Specification limits (process window):
Recommended assembly specification limits:
where represents the safety proportion level, which will impact the USL process window and thereby determine the torque recommended assembly upper specification limit (RAUSL); indicates the unit factor to be used to obtain the torque recommended assembly range lower specification limit (RALSL) from the LSL process window.
- 7.
- Evaluate driver metrics: Analyze driver torque data for consistency and accuracy, calculating control metrics.
- 8.
- Assess process capability: Compute the fail-to-seat ratio, Cpk value, and review process capability.
- 9.
- Report and optimize: Summarize results and recommend improvements or adjustments.
Since the USL represents the point where the screw joint begins to fail, and the LSL represents the point where screws may not be fully seated, a fail-to-seat ratio can be calculated using the Equation (5). This ratio serves as a predictor of screw joint robustness, which are obtained from fail-to-seat studies, manufacturing assembly data [18] and from the experience of automotive industries:
- If fail-to-seat ratio > 2: Acceptable ratio, robust to minor assembly and material variation.
- If fail-to-seat ratio < 2: Unacceptable ratio, susceptible to assembly and material variation.
Additionally, to ensure process robustness and high-quality performance, it is essential to apply RAUSL and RALSL limits during the assembly process (with typical values used by the automotive industry and obtained from years of experience with manufacturing data and quality performance):
- Maintaining at least a 10% margin below the USL ensures sufficient clearance to prevent screw joint failures (α-value in Equation (3)).
- Keeping at least a 2X margin above the LSL ensures proper screw seating and supports a reliable torque–angle monitoring strategy for defect detection (β-value in Equation (4)).
Similar steps can be observed in [44,45]. Due the torque study is to measure the torque-to-seat and torque-to-fail values. The equipment should be adjusted to apply torque to the screws until it exceeds the joint’s failure point, typically resulting in a stripped screw or a broken fastener.
In torque–angle studies, a Gaussian model accurately captures the bell-shaped distribution of data due to material properties and tolerances. This model smooths the data curve, aiding in precise characterization, identifying peak performance, and predicting system behavior, thus enhancing reliability and optimizing design and control strategies. The steps to perform this analysis are as follows: (1) data collection, (2) initial visualization, (3) Gaussian function definition, (4) initial parameter estimation, (5) curve fitting, (6) quality fit evaluation, (7) plot the fitted curve.
Gaussian curve fitting is a highly effective technique for analyzing torque–angle curves in screw fasteners, significantly improving the understanding of their mechanical behavior. This method enables precise modeling of the torque–angle relationship, which is critical for optimizing fastening processes, especially when evaluating the performance of screws made from different materials. By extracting key features from experimental data—such as hardness, elasticity, and surface finish—Gaussian curve fitting provides a detailed understanding of how material properties influence torque variations, establishing clear relationships between torque and angle.
According to [46], Gaussian functions are widely used to model the behavior of various materials under torque, offering valuable insights into their mechanical properties. This approach has also emerged as a powerful tool for stochastic structural analysis, particularly when accounting for uncertainties in material properties and structural responses. It enhances both computational efficiency and the accuracy of predictions regarding structural behavior under varying conditions.
By leveraging Gaussian based models, engineers can make more informed material selections for specific applications, optimizing assembly processes by minimizing the risks of over-tightening, or under-tightening. Furthermore, stochastic modeling with Gaussian functions can accommodate uncertainties, such as variations in material composition or manufacturing inconsistencies, leading to more reliable torque predictions and improved fastening performance in real-world applications.
4. Data Description
4.1. Screw Specification and Dimensions
Torque tests were conducted on two screw types: M2 screws and M3 screws. The head dimensions conform to the Torx Plus round washer head specifications and Autosert requirements. The material follows the DIN 7500-1 [47] or JIS B 1060 [48] standards, and the screws feature a zinc plating finish. Figure 3 and Figure 4 illustrate the dimensions for each screw type.
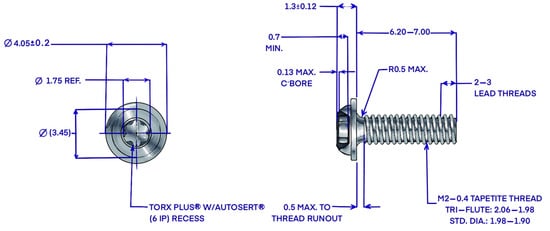
Figure 3.
M2 screw dimensions (mm).
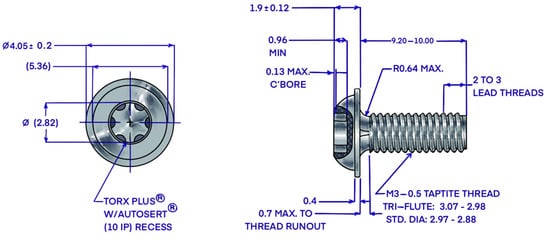
Figure 4.
M3 screw dimensions (mm).
4.2. Dataset Structure
The datasets containing the torque studies results are organized into two files, each labeled by their respective screw type, collected with the usage of auto-record data capture and an Atlas Copco screwdriver. The structure of each file is as follows:
| File Name (File S1): | M2_Screw_Dataset.xlsx |
| Total Screws: | 18 |
| Measurement rows: | 8727 |
| Test condition: | Test-to-failure |
| Failure mode observed: | Strip screw |
| File Name (File S2): | M3_Screw_Dataset.xlsx |
| Total Screws: | 35 |
| Measurement rows: | 667 |
| Test condition: | Test-to-failure |
| Failure mode observed: | Broken screw head |
Table 1 indicates the screwdriver parameters used for the data collection process, which include control strategy, torque parameters, angle parameters, speed and ramp settings, and time settings applied during the tightening procedure.

Table 1.
Screwdriver parameters for data collection.
Each dataset contains the following information: torque and angle screwdriver measurements, automatic data capture, torque and angle GP simulated data, statistical analysis results for screwdriver measurements, statistical analysis results for GP simulated data, and the MS Excel formulas used for the calculations.
Here is a summary of the variables included in the datasets:
- Angle: Peak/Final—this variable represents the angular displacement of the screw at the point when the maximum torque before failure or the final torque value is reached. It indicates the extent of rotational movement before reaching maximum torque capacity or failure.
- Angle: High Threshold Torque—this variable measures the angle when the torque reaches a predefined high threshold value, set just below the expected failure torque. This allows control of torque application and prevent unexpected failures.
- Angle: Low Threshold Torque—this variable measures the angle when the torque reaches a predefined low threshold value, set above the initial seating torque. This ensures the screw or fastener is properly seated before higher torques are applied.
- Angle: Final–Low Threshold Torque—this variable represents the angle difference between the final torque and the low threshold torque. It indicates the additional rotation needed after the initial seating torque to reach the final torque.
- Angle: Final–High Threshold Torque—this variable represents the angle difference between the final torque and the high threshold torque. It shows the additional rotation required to reach the final torque from the high threshold torque.
- Angle: High Threshold Torque–Low Threshold Torque—this variable represents the angle difference between the high threshold torque and the low threshold torque. It highlights the rotational movement between the two threshold torques.
- Peak/Fail Torque—this variable measures the maximum torque value recorded before the screw or joint fails, either by stripping the screw or breaking the fastener. It determines the maximum torque capacity of the joint.
- Seat Torque—this variable measures the torque value at which the screw is properly seated in the joint, indicating the completion of the initial fastening stage. It ensures the screw is securely fastened without over-torquing.
In addition, a third dataset is provided for researchers interested in replicating the results or using it in another study. The file has the following structure:
| File Name (File S3): | M2_Screw_Additional_Dataset.xlsx |
| Total Screws: | 30 |
| Measurement rows: | 5956 |
| Test condition: | Test-to-failure |
| Failure mode observed: | Strip screw |
5. Results
Figure 5 shows the results of the torque–angle curve for the test-to-failure samples of 18 M2 screw measurements (colored lines). The curve clearly shows the different sections and relevant indicators that constitute the study.
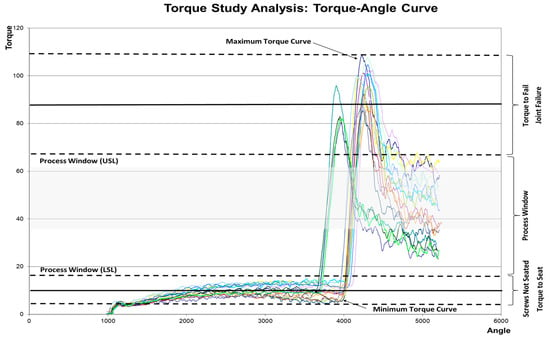
Figure 5.
Torque–angle curve for M2 screws.
The dataset, available in this document, includes all measurements obtained from the torque tests using an Atlas Copco screwdriver device plus auto-record data capture. Table 2 presents the descriptive statistics, including the average, standard deviation, maximum, and minimum values.

Table 2.
M2 screw average, standard deviation, maximum, and minimum values.
With these data, it is possible to calculate the process window upper specification limit (67.8949 Nm), lower specification limit (19.1736 Nm), and fail-to-seat ratio (3.54). The recommended assembly torque range is from 38.3671 Nm to 61.1049 Nm. These values are obtained using Equations (3) and (4), with and , and are represented in the shaded grey area shown in Figure 5.
Figure 6 shows the results of the torque–angle curve for the test-to-failure samples of 35 M3 screw measurements (colored lines). The curve clearly shows the different sections and relevant indicators that constitute the study.
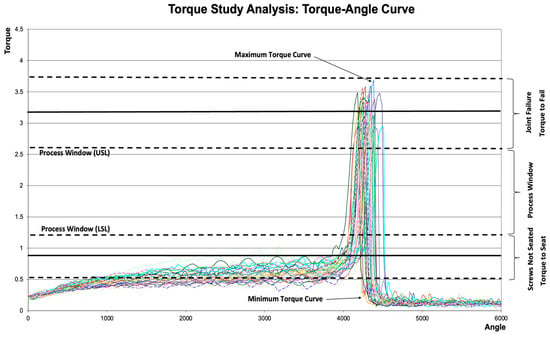
Figure 6.
Torque–angle curve for M3 screws.
All measurements from the torque tests are available in the dataset provided in this document. Table 3 displays the descriptive statistics, including the mean, standard deviation, maximum, and minimum values.

Table 3.
M3 screw average, standard deviation, maximum, and minimum values.
The process window’s upper specification limit, lower specification limit, and fail-to-seat ratio are 2.6008 Nm, 0.7604 Nm, and 2.09, respectively. The recommended assembly torque range is 2.4894 Nm to 2.3407 Nm—values obtained using Equations (3) and (4), with and . But this is clearly unrealistic to implement.
To mathematically model the experimental results presented in Table 1 and Table 2, the use of stochastic process analysis is proposed to identify the probability distribution that characterizes the torque–angle curve. Figure 7 and Figure 8 show the training results and curve fitting, which allow more precise estimation of the standard deviation and expected mean value calculations and display the response values with a 95% confidence interval.
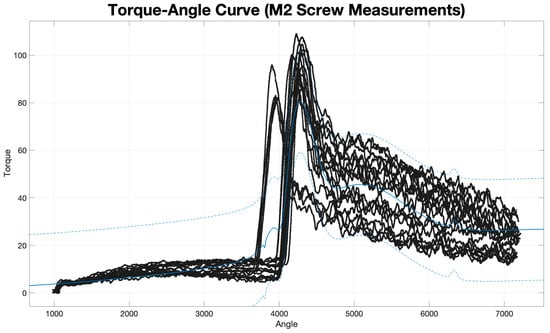
Figure 7.
Torque–angle curve for M2 screws with 95% confidence interval.
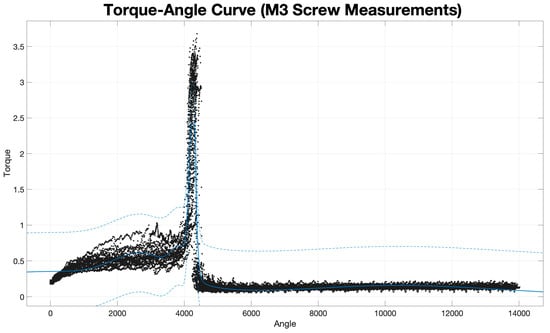
Figure 8.
Torque–angle curve for M3 screws with 95% confidence interval.
Graphs of the individual M2 and M3 screws measured are available in Appendix A and Appendix B, respectively, where the Gaussian model equation is as follows:
where is the amplitude, is the centroid location, and is the width of the peak; the values of the constants are available in Appendix A and Appendix B corresponding to the screw type. With these values, statistical metrics are calculated by computing the average and standard deviation for both torque-to-seat and torque-to-fail values. The results are available in the datasets included in Supplementary Materials (Files S1–S4). Process window specification limits are determined, and finally, the product assembly torque specification is defined. Table 4 and Table 5 show the descriptive statistics results using the GP simulated values.

Table 4.
M2 screw descriptive statistics from GP simulated values.

Table 5.
M3 screw descriptive statistics from GP simulated values.
The process window limits and recommended assembly torque range derived from the GP methodology are 23.8046 Nm to 67.1172 Nm and 47.6091 Nm to 60.4055 Nm, respectively, for the M2 screw, and 1.1394 Nm to 2.7352 Nm and 2.2789 Nm to 2.4617 Nm, respectively, for the M3 screw. These results closely match those obtained from direct measurement techniques. However, GP offers the added benefit of enabling inference and reducing the sample size needed for incoming test-to-fail studies, thereby minimizing the number of destructive test samples required. By employing GP, specifically Gaussian curve fitting, the data were successfully fitted to a curve with multiple peaks (in this case, n = 6). This fitting process enabled the prediction of values; and through regression analysis, the process indicators were recalculated (0.9907 average R-square value for the M2 screw and 0.9768 average R-square value for the M3 screw).
Table 6 presents the results for the fail-to-seat ratio, process window upper specification limit (USL), process window lower specification limit (LSL), recommended assembly upper specification limit (RAUSL), and recommended assembly lower specification limit (RALSL). It is evident that the fail-to-seat ratio was negatively impacted for the M2 screw; however, it is important to note that the value obtained from GP remains within the recommended parameters. In contrast, for the M3 screw, this ratio was positively affected; a critical point to consider is observed in the recommended assembly window limits; the calculations derived from direct measurements indicate inconsistent values for the RALSL and RAUSL. When such inconsistencies occur in field studies, adjustments to the testing processes are typically made, leading to additional testing and resource waste. However, when analyzing the results from the GP, this inconsistency is eliminated, allowing the usage of these results in the manufacturing process.

Table 6.
Process indicators for direct measurements and Gaussian curve fitting.
6. Conclusions
The datasets provided in this document, along with the accompanying analysis, enabled a comprehensive understanding and characterization of the torque–angle curve, facilitating the identification of its constituent elements. Additionally, this allowed for the determination of key process indicators essential for a manufacturing process, including the process window and the recommended assembly torque range (Figure 9).
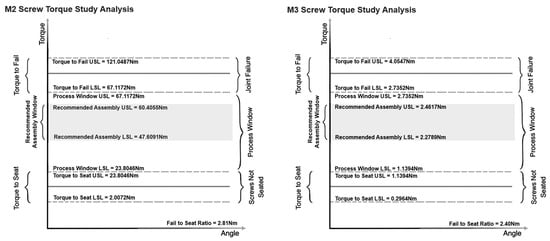
Figure 9.
Gaussian model process indicator results for M2 and M3 screws.
The study of torque–angle curves is critical for understanding the mechanical behavior of threaded fasteners, particularly in precision applications like those involving M2/M3 screws in automotive contexts. The literature review emphasizes the importance of characterizing these curves, with research demonstrating the significant impact of factors such as friction, material properties, thread pitch, and installation techniques on the relationship between torque and clamping force. The principal findings are as follows:
- Precise control over clamping forces is essential for ensuring component integrity and maintaining safety in automotive assemblies.
- Challenges arise from material interactions, such as differential expansion and variations in torque–angle behavior, which can result in performance degradation or component failure.
- Surface finish and lubrication in torque–angle analysis enhance torque consistency and minimize wear during fastening. However, they also present challenges, such as increased production costs, reduced efficiency, and greater complexities in process control.
The use of statistical methods, particularly curve fitting and GP regression, presents an innovative approach to reducing the need for large sample sizes in destructive testing. GP regression allows robust and accurate predictions of failure points and assembly performance, offering insights into system behavior under varying conditions. This is especially valuable in automotive applications, where safety and reliability are critical. However, the use of GP regression in this field remains in its early stages, requiring further research to refine its application and fully explore its potential.
The study highlights the importance of establishing specification limits to ensure proper seating and prevent joint failure. By quantifying key metrics such as torque-to-seat and torque-to-fail, the study contributes to the development of robust assembly processes that minimize failures. The introduction of Gaussian curve-fitting techniques enhances the understanding of the torque–angle relationship, allowing for the precise characterization of fasteners’ mechanical behavior. This reduces inconsistencies in torque values during direct measurements, particularly concerning the USL, LSL, RAUSL, and RALSL values.
Finally, the study acknowledges several gaps in the current understanding of torque–angle behavior, particularly for M2/M3 screws in automotive applications. These include the need for more comprehensive studies on environmental factors such as corrosion and thermal cycling, as well as the effects of installation variables like tightening speed, lubrication, and surface finish. Future research should aim to address these gaps while continuing to explore the use of advanced statistical methods to further optimize the performance and reliability of fastening systems in automotive and other precision-driven industries. Also, future research should expand to additional datasets and screw types, like M4, M5, and M6, to validate and further enhance the results’ generalizability.
Supplementary Materials
The following supporting information can be downloaded at: https://www.mdpi.com/article/10.3390/data9100115/s1, File S1: M2_Screw_Dataset.xlsx, File S2: M2_Screw_Dataset.xlsx, File S3: M2_Screw_Additional_Dataset.xlsx, File S4: M2 Screw & M3 Screw Gaussian Constant Values.xlsx.
Author Contributions
I.J.C.P.-O. and C.C.F.-G.; methodology, L.A.R.-P. and L.C.M.-G.; software, I.J.C.P.-O. and C.C.F.-G.; validation, I.J.C.P.-O., L.C.M.-G., and L.A.R.-P.; formal analysis, I.J.C.P.-O., C.C.F.-G., L.A.R.-P., and L.C.M.-G.; investigation, C.C.F.-G., I.J.C.P.-O., and L.C.M.-G.; resources, L.A.R.-P. and C.C.F.-G.; data curation, I.J.C.P.-O.; writing—original draft preparation, I.J.C.P.-O. and C.C.F.-G.; writing—review and editing, L.C.M.-G. and L.A.R.-P.; visualization, C.C.F.-G.; supervision, I.J.C.P.-O. and C.C.F.-G.; project administration, L.A.R.-P.; funding acquisition, L.C.M.-G. All authors have read and agreed to the published version of the manuscript.
Funding
This research received no external funding.
Institutional Review Board Statement
Not applicable.
Informed Consent Statement
Not applicable.
Data Availability Statement
The datasets and curve fitting figures are available in the Zenodo Data Repository (https://doi.org/10.5281/zenodo.13878636) accessed on 29 September 2024.
Conflicts of Interest
The authors declare no conflicts of interest.
Appendix A
Gaussian curve fit for M2 screw samples.

Table A1.
Gaussian model constant values for (n = 6) M2 Screws 1–9.
Table A1.
Gaussian model constant values for (n = 6) M2 Screws 1–9.
| Constant | Screw 1 | Screw 2 | Screw 3 | Screw 4 | Screw 5 | Screw 6 | Screw 7 | Screw 8 | Screw 9 |
|---|---|---|---|---|---|---|---|---|---|
| a1 | 5.29 × 101 | 4.60 × 101 | 5.60 × 101 | 5.02 × 101 | 5.39 × 101 | 5.07 × 101 | 3.72 × 101 | −1.97 × 10³ | 5.06 × 101 |
| b1 | 4.34 × 10³ | 4.25 × 10³ | 4.37 × 10³ | 3.88 × 10³ | 4.17 × 10³ | 4.23 × 10³ | 4.10 × 10³ | 4.23 × 10³ | 4.15 × 10³ |
| c1 | 1.51 × 10² | 1.07 × 10² | 1.22 × 10² | 1.01 × 10² | 9.92 × 101 | 8.96 × 101 | 7.42 × 101 | 8.83 × 101 | 8.01 × 101 |
| a2 | −2.71 × 101 | 5.03 × 101 | 3.56 × 101 | −2.72 × 101 | 6.85 × 101 | 2.79 × 101 | 6.23 × 101 | 1.77 × 101 | 4.54 × 101 |
| b2 | 4.08 × 10³ | 4.41 × 10³ | 4.57 × 10³ | 3.69 × 10³ | 4.31 × 10³ | 4.58 × 10³ | 4.21 × 10³ | 4.41 × 10³ | 4.29 × 10³ |
| c2 | 3.03 × 10² | 1.80 × 10² | 2.33 × 10² | 1.02 × 10³ | 1.44 × 10² | 2.17 × 10² | 1.34 × 10² | 5.96 × 101 | 1.45 × 10² |
| a3 | −2.11 × 101 | 2.14 × 101 | −3.09 × 101 | 4.01 × 101 | 3.39 × 101 | 2.37 × 101 | 2.27 × 101 | 2.95 × 101 | 3.07 × 101 |
| b3 | 3.62 × 10³ | 4.97 × 10³ | 4.21 × 10³ | 4.00 × 10³ | 4.59 × 10³ | 4.96 × 10³ | 4.87 × 10³ | 4.56 × 10³ | 4.61 × 10³ |
| c3 | 9.08 × 10² | 6.30 × 10² | 1.18 × 10³ | 1.56 × 10² | 1.77 × 10² | 4.46 × 10² | 4.92 × 10² | 2.97 × 10² | 3.68 × 10² |
| a4 | 2.42 × 101 | 3.76 × 101 | 2.58 × 101 | 1.53 × 101 | 3.65 × 101 | 6.29 × 101 | 3.56 × 101 | 2.14 × 101 | 2.19 × 100 |
| b4 | 4.44 × 10³ | 6.78 × 10³ | 4.98 × 10³ | 4.31 × 10³ | 5.00 × 10³ | 4.35 × 10³ | 4.45 × 10³ | 5.25 × 10³ | 5.14 × 10³ |
| c4 | 5.44 × 10² | 3.53 × 10³ | 5.49 × 10² | 3.79 × 10² | 5.16 × 10² | 1.09 × 10² | 2.09 × 10² | 7.82 × 10² | 6.50 × 100 |
| a5 | 3.64 × 101 | −1.71 × 10⁻¹ | 4.67 × 101 | 1.42 × 101 | 2.82 × 101 | 1.76 × 101 | 2.66 × 101 | 2.04 × 10³ | 3.94 × 101 |
| b5 | 4.22 × 10³ | 5.96 × 10³ | 4.25 × 10³ | 7.07 × 10³ | 5.82 × 10³ | 5.71 × 10³ | 5.77 × 10³ | 4.23 × 10³ | 5.39 × 10³ |
| c5 | 8.85 × 101 | 4.27 × 10⁻¹ | 7.76 × 101 | 1.00 × 10³ | 8.53 × 10² | 8.57 × 10² | 9.57 × 10² | 9.00 × 101 | 8.90 × 10² |
| a6 | 5.00 × 101 | −2.88 × 100 | 5.40 × 101 | 4.42 × 101 | 1.89 × 101 | 2.94 × 101 | 5.12 × 101 | 4.54 × 101 | 2.74 × 101 |
| b6 | 4.91 × 10³ | 6.59 × 10³ | 5.30 × 10³ | 4.16 × 10³ | 8.51 × 10³ | 1.00 × 10⁴ | 1.28 × 10⁴ | 1.31 × 10⁴ | 8.95 × 10³ |
| c6 | 2.28 × 10³ | 9.58 × 101 | 2.53 × 10³ | 1.84 × 10³ | 6.51 × 10³ | 7.20 × 10³ | 8.30 × 10³ | 7.72 × 10³ | 6.43 × 10³ |
| SSE | 2.34 × 10⁴ | 9.20 × 10⁴ | 2.05 × 10⁴ | 1.53 × 10⁴ | 4.59 × 10⁴ | 4.50 × 10⁴ | 3.63 × 10⁴ | 3.46 × 10⁴ | 6.56 × 10⁴ |
| R-Square | 9.96 × 10⁻¹ | 9.79 × 10⁻¹ | 9.97 × 10⁻¹ | 9.94 × 10⁻¹ | 9.93 × 10⁻¹ | 9.89 × 10⁻¹ | 9.93 × 10⁻¹ | 9.91 × 10⁻¹ | 9.88 × 10⁻¹ |
| DFE | 8.71 × 10³ | 8.71 × 10³ | 8.71 × 10³ | 8.71 × 10³ | 8.71 × 10³ | 8.71 × 10³ | 8.71 × 10³ | 8.71 × 10³ | 8.71 × 10³ |
| Adj R-Square | 9.96 × 10⁻¹ | 9.79 × 10⁻¹ | 9.97 × 10⁻¹ | 9.94 × 10⁻¹ | 9.93 × 10⁻¹ | 9.89 × 10⁻¹ | 9.93 × 10⁻¹ | 9.91 × 10⁻¹ | 9.88 × 10⁻¹ |
| RMSE | 1.64 × 100 | 3.25 × 100 | 1.53 × 100 | 1.32 × 100 | 2.30 × 100 | 2.27 × 100 | 2.04 × 100 | 1.99 × 100 | 2.74 × 100 |

Table A2.
Gaussian model constant values for (n = 6) M2 Screws 10–18.
Table A2.
Gaussian model constant values for (n = 6) M2 Screws 10–18.
| Screw 10 | Screw 11 | Screw 12 | Screw 13 | Screw 14 | Screw 15 | Screw 16 | Screw 17 | Screw 18 | |
|---|---|---|---|---|---|---|---|---|---|
| a1 | 7.22 × 101 | 5.70 × 101 | 5.57 × 101 | 2.87 × 101 | 6.89 × 100 | −3.69 × 101 | 1.68 × 101 | 3.80 × 101 | 7.42 × 10⁻¹ |
| b1 | 4.30 × 10³ | 4.32 × 10³ | 4.21 × 10³ | 4.15 × 10³ | 2.08 × 10³ | 3.87 × 10³ | 3.83 × 10³ | 4.22 × 10³ | 3.95 × 10³ |
| c1 | 2.14 × 10² | 1.50 × 10² | 1.33 × 10² | 9.62 × 101 | 9.16 × 10² | 2.32 × 10² | 8.99 × 101 | 1.31 × 10² | 3.69 × 100 |
| a2 | 1.87 × 101 | 2.05 × 101 | 3.05 × 101 | 6.05 × 101 | 3.57 × 101 | −8.27 × 100 | 5.88 × 101 | 5.88 × 101 | 6.30 × 101 |
| b2 | 4.86 × 10³ | 4.17 × 10³ | 4.08 × 10³ | 4.28 × 10³ | 4.48 × 10³ | 3.51 × 10³ | 3.96 × 10³ | 4.39 × 10³ | 3.94 × 10³ |
| c2 | 6.33 × 10² | 8.20 × 101 | 8.28 × 101 | 1.34 × 10² | 5.54 × 10² | 7.87 × 10² | 1.43 × 10² | 1.84 × 10² | 1.68 × 10² |
| a3 | −1.51 × 101 | 2.64 × 101 | 2.95 × 101 | 2.41 × 101 | −1.43 × 101 | 2.18 × 101 | 1.16 × 101 | 1.67 × 101 | 3.14 × 101 |
| b3 | 4.01 × 10³ | 4.58 × 10³ | 4.42 × 10³ | 4.58 × 10³ | 4.77 × 10³ | 4.21 × 10³ | 5.06 × 10³ | 5.01 × 10³ | 4.42 × 10³ |
| c3 | 9.21 × 101 | 3.12 × 10² | 2.34 × 10² | 2.27 × 10² | 1.37 × 10² | 4.92 × 10² | 7.97 × 10² | 2.21 × 10² | 3.59 × 10² |
| a4 | −2.91 × 101 | 2.19 × 101 | 1.90 × 101 | 1.13 × 101 | 6.27 × 101 | 8.36 × 101 | 2.06 × 101 | 2.64 × 101 | 1.05 × 101 |
| b4 | 4.05 × 10³ | 5.25 × 10³ | 4.82 × 10³ | 5.02 × 10³ | 4.23 × 10³ | 3.94 × 10³ | 4.28 × 10³ | 4.69 × 10³ | 5.05 × 10³ |
| c4 | 1.19 × 10³ | 7.92 × 10² | 5.98 × 10² | 1.04 × 10² | 1.55 × 10² | 1.77 × 10² | 2.74 × 10² | 1.64 × 10² | 6.87 × 10² |
| a5 | 1.22 × 101 | 2.57 × 100 | −1.68 × 101 | 3.02 × 101 | 3.50 × 101 | 4.51 × 100 | 7.86 × 100 | 3.20 × 101 | −1.46 × 101 |
| b5 | 4.67 × 10³ | 5.45 × 10³ | 4.02 × 10³ | 4.67 × 10³ | 5.87 × 10³ | 4.76 × 10³ | 4.71 × 10³ | 5.56 × 10³ | 4.53 × 10³ |
| c5 | 1.32 × 10² | 1.61 × 101 | 1.14 × 10³ | 2.44 × 10³ | 2.00 × 10³ | 2.85 × 101 | 1.24 × 10² | 8.89 × 10² | 1.70 × 10² |
| a6 | 4.72 × 101 | 3.12 × 101 | 3.02 × 101 | −2.14 × 101 | −2.51 × 101 | 2.43 × 101 | 1.65 × 101 | 5.63 × 10³ | 1.60 × 101 |
| b6 | 5.26 × 10³ | 1.42 × 10⁴ | 5.56 × 10³ | 3.77 × 10³ | 4.05 × 10³ | 5.11 × 10³ | 7.58 × 10³ | 4.15 × 10⁴ | 5.81 × 10³ |
| c6 | 2.53 × 10³ | 9.73 × 10³ | 3.05 × 10³ | 9.55 × 10² | 3.64 × 10² | 2.88 × 10³ | 5.30 × 10³ | 1.50 × 10⁴ | 4.22 × 10³ |
| SSE | 2.37 × 10⁴ | 3.24 × 10⁴ | 1.71 × 10⁴ | 3.75 × 10⁴ | 3.73 × 10⁴ | 2.02 × 10⁴ | 1.36 × 10⁴ | 6.57 × 10⁴ | 2.29 × 10⁴ |
| R-Square | 9.95 × 10⁻¹ | 9.89 × 10⁻¹ | 9.95 × 10⁻¹ | 9.85 × 10⁻¹ | 9.89 × 10⁻¹ | 9.91 × 10⁻¹ | 9.93 × 10⁻¹ | 9.87 × 10⁻¹ | 9.90 × 10⁻¹ |
| DFE | 8.71 × 10³ | 8.71 × 10³ | 8.71 × 10³ | 8.71 × 10³ | 8.71 × 10³ | 8.71 × 10³ | 8.71 × 10³ | 8.71 × 10³ | 8.71 × 10³ |
| Adj R-Square | 9.95 × 10⁻¹ | 9.89 × 10⁻¹ | 9.95 × 10⁻¹ | 9.85 × 10⁻¹ | 9.89 × 10⁻¹ | 9.91 × 10⁻¹ | 9.93 × 10⁻¹ | 9.86 × 10⁻¹ | 9.90 × 10⁻¹ |
| RMSE | 1.65 × 100 | 1.93 × 100 | 1.40 × 100 | 2.07 × 100 | 2.07 × 100 | 1.52 × 100 | 1.25 × 100 | 2.75 × 100 | 1.62 × 100 |
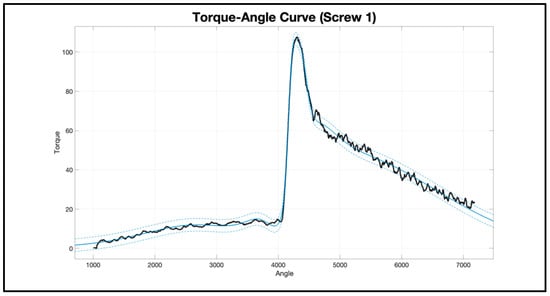
Figure A1.
Sample 1 data (black color) with 95% confidence interval (blue color).
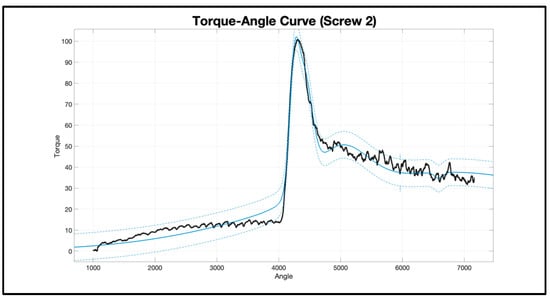
Figure A2.
Sample 2 data (black color) with 95% confidence interval (blue color).
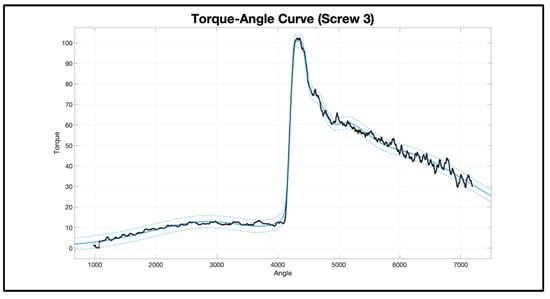
Figure A3.
Sample 3 data (black color) with 95% confidence interval (blue color).
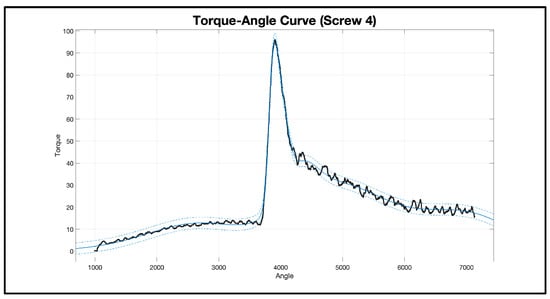
Figure A4.
Sample 4 data (black color) with 95% confidence interval (blue color).
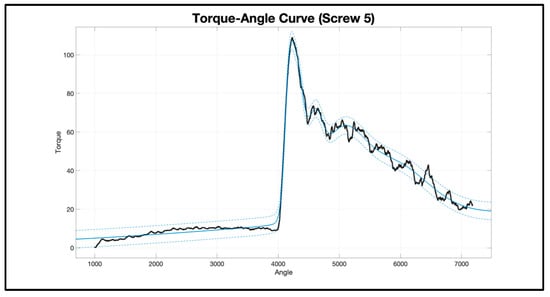
Figure A5.
Sample 5 data (black color) with 95% confidence interval (blue color).
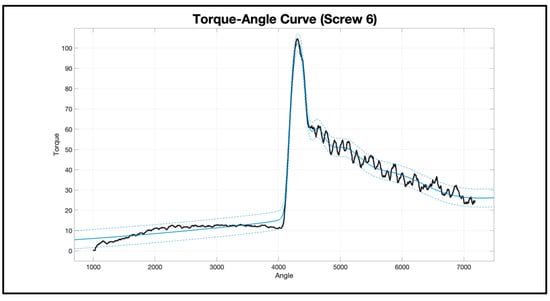
Figure A6.
Sample 6 data (black color) with 95% confidence interval (blue color).
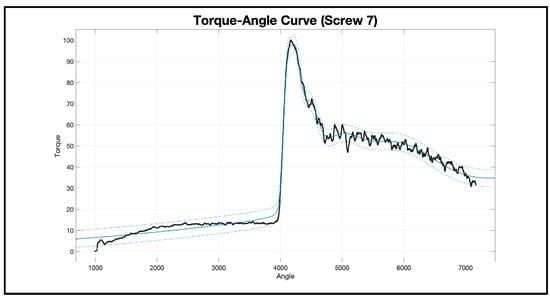
Figure A7.
Sample 7 data (black color) with 95% confidence interval (blue color).
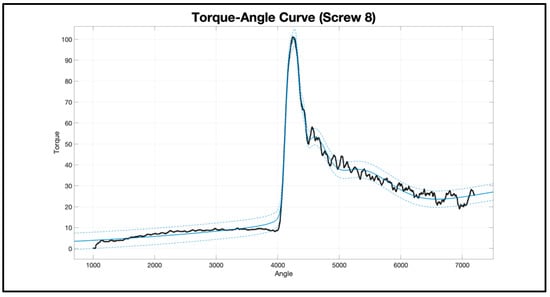
Figure A8.
Sample 8 data (black color) with 95% confidence interval (blue color).
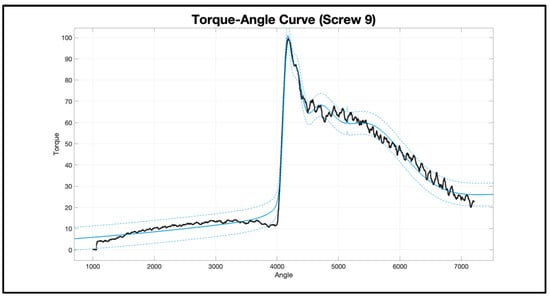
Figure A9.
Sample 9 data (black color) with 95% confidence interval (blue color).
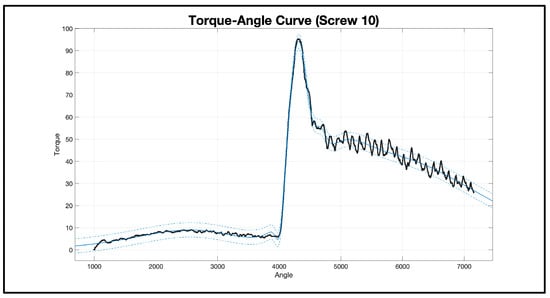
Figure A10.
Sample 10 data (black color) with 95% confidence interval (blue color).
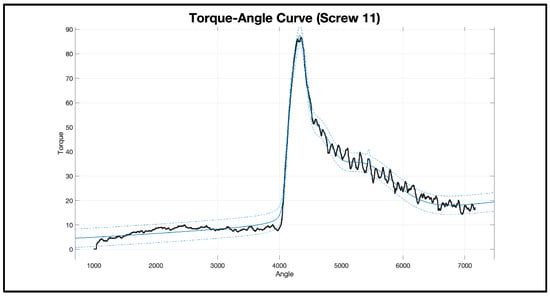
Figure A11.
Sample 11 data (black color) with 95% confidence interval (blue color).
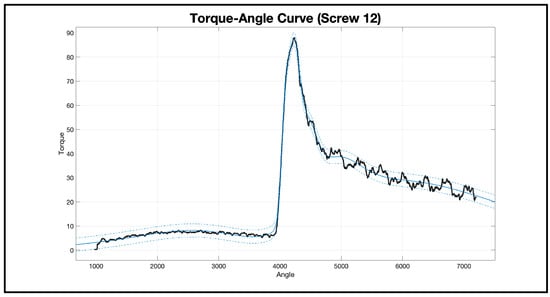
Figure A12.
Sample 12 data (black color) with 95% confidence interval (blue color).
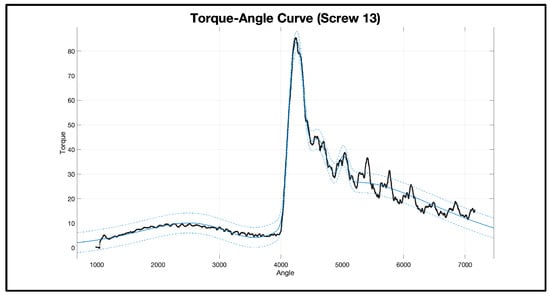
Figure A13.
Sample 13 data (black color) with 95% confidence interval (blue color).
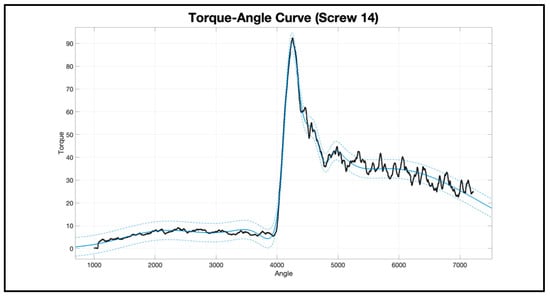
Figure A14.
Sample 14 data (black color) with 95% confidence interval (blue color).
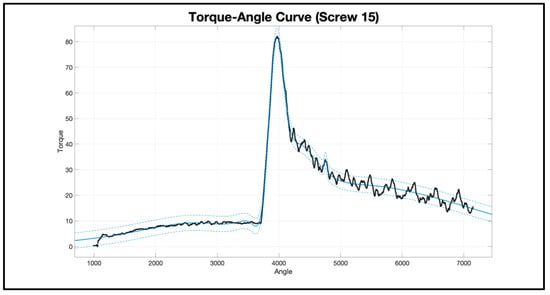
Figure A15.
Sample 15 data (black color) with 95% confidence interval (blue color).
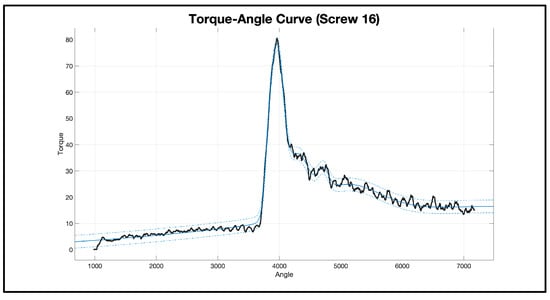
Figure A16.
Sample 16 data (black color) with 95% confidence interval (blue color).
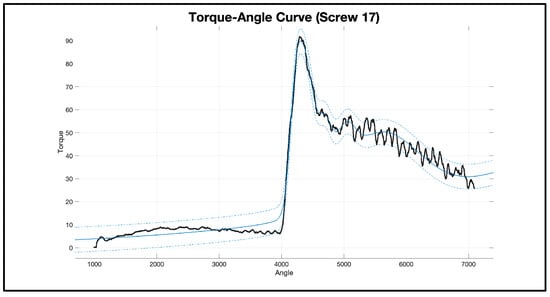
Figure A17.
Sample 17 data (black color) with 95% confidence interval (blue color).
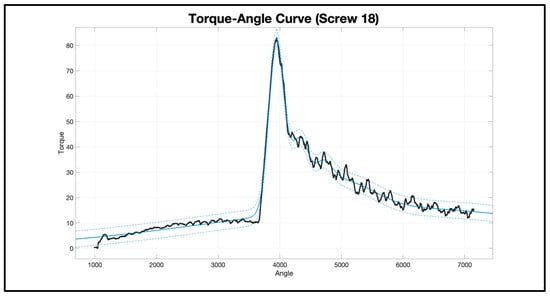
Figure A18.
Sample 18 data (black color) with 95% confidence interval (blue color).
Appendix B
Gaussian curve fit for M3 screw samples.

Table A3.
Gaussian model constant values for (n = 6) M3 Screws 1–9.
Table A3.
Gaussian model constant values for (n = 6) M3 Screws 1–9.
| Constants | Screw 1 | Screw 2 | Screw 3 | Screw 4 | Screw 5 | Screw 6 | Screw 7 | Screw 8 | Screw 9 |
|---|---|---|---|---|---|---|---|---|---|
| a1 | 2.29 × 100 | 2.47 × 100 | 2.15 × 100 | 2.82 × 100 | 2.75 × 100 | 1.85 × 100 | 2.71 × 100 | 2.98 × 100 | 1.53 × 100 |
| b1 | 4.33 × 10³ | 4.22 × 10³ | 4.37 × 10³ | 4.14 × 10³ | 4.27 × 10³ | 4.27 × 10³ | 4.29 × 10³ | 4.27 × 10³ | 4.23 × 10³ |
| c1 | 5.50 × 101 | 5.39 × 101 | 3.07 × 101 | 7.54 × 101 | 7.24 × 101 | 2.22 × 101 | 6.72 × 101 | 9.53 × 101 | 1.21 × 101 |
| a2 | 1.83 × 100 | 4.09 × 10⁻¹ | 2.82 × 100 | −1.08 × 10² | 7.07 × 10⁻¹ | 3.69 × 10⁻¹ | 4.71 × 10⁻¹ | 7.00 × 10⁻¹ | 1.61 × 100 |
| b2 | 4.28 × 10³ | 3.78 × 10³ | 4.30 × 10³ | 3.76 × 10³ | 4.02 × 10³ | 3.87 × 10³ | 3.10 × 10³ | 3.97 × 10³ | 4.20 × 10³ |
| c2 | 1.96 × 10² | 3.44 × 10² | 8.01 × 101 | 2.45 × 10² | 2.37 × 10² | 4.59 × 10² | 7.03 × 10² | 4.31 × 10² | 2.79 × 101 |
| a3 | −5.66 × 10⁻² | 1.22 × 10⁻¹ | 8.90 × 10⁻¹ | 3.88 × 10⁻¹ | 1.52 × 100 | 3.77 × 10⁻¹ | 5.02 × 10⁻¹ | 5.10 × 10⁻¹ | 2.33 × 100 |
| b3 | 3.26 × 10³ | 7.63 × 10³ | 1.97 × 10³ | 2.94 × 10³ | 2.41 × 10³ | 2.15 × 10³ | 1.61 × 10³ | 3.19 × 10³ | 4.14 × 10³ |
| c3 | 2.05 × 101 | 1.56 × 10⁴ | 1.58 × 10³ | 6.75 × 10² | 1.12 × 10³ | 1.67 × 10³ | 1.30 × 10³ | 5.53 × 10² | 6.13 × 101 |
| a4 | −6.46 × 10¹¹ | 3.81 × 10⁻¹ | −4.99 × 10⁻¹ | 6.55 × 10¹² | −1.10 × 100 | −7.68 × 10⁻² | 4.99 × 10⁻¹ | 5.51 × 10⁻¹ | 1.92 × 10⁻¹ |
| b4 | 1.78 × 10⁴ | 3.04 × 10³ | 1.89 × 10³ | −1.90 × 10⁵ | 2.34 × 10³ | 2.19 × 10³ | 3.83 × 10³ | 2.14 × 10³ | 3.41 × 10³ |
| c4 | 2.46 × 10³ | 7.63 × 10² | 1.11 × 10³ | 3.51 × 10⁴ | 8.02 × 10² | 1.46 × 10² | 3.15 × 10² | 8.31 × 10² | 5.85 × 10² |
| a5 | −1.57 × 100 | 9.71 × 10⁻¹ | 3.56 × 10⁻¹ | −1.15 × 100 | 4.15 × 10¹² | 2.64 × 100 | 7.83 × 10⁻¹ | 4.46 × 10⁻¹ | 4.44 × 10⁻¹ |
| b5 | 4.34 × 10³ | 4.14 × 10³ | 3.92 × 10³ | −1.24 × 10³ | −7.10 × 10⁵ | 4.22 × 10³ | 4.17 × 10³ | 8.25 × 10² | 1.81 × 10³ |
| c5 | 2.05 × 10² | 1.15 × 10² | 3.89 × 10² | 1.98 × 10³ | 1.28 × 10⁵ | 6.75 × 101 | 1.35 × 10² | 8.33 × 10² | 2.50 × 10³ |
| a6 | 9.22 × 10⁻¹ | 4.35 × 10⁻¹ | 1.43 × 10⁻¹ | 1.08 × 10² | 7.35 × 10⁻² | 6.60 × 10⁵ | 1.76 × 10⁻¹ | 6.07 × 10¹² | 3.95 × 10⁻¹ |
| b6 | 2.75 × 10³ | 1.48 × 10³ | 1.09 × 10⁴ | 3.76 × 10³ | 3.54 × 10² | −6.24 × 10⁵ | 9.33 × 10³ | 3.40 × 10⁵ | 4.02 × 10³ |
| c6 | 2.42 × 10³ | 1.35 × 10³ | 1.11 × 10⁴ | 2.46 × 10² | 5.16 × 10² | 1.61 × 10⁵ | 1.40 × 10⁴ | 5.88 × 10⁴ | 2.06 × 10² |
| SSE | 8.58 × 100 | 1.56 × 100 | 1.34 × 100 | 6.79 × 100 | 2.69 × 100 | 1.12 × 100 | 2.06 × 100 | 4.68 × 100 | 2.19 × 100 |
| R-Square | 9.52 × 10⁻¹ | 9.79 × 10⁻¹ | 9.88 × 10⁻¹ | 9.36 × 10⁻¹ | 9.69 × 10⁻¹ | 9.87 × 10⁻¹ | 9.76 × 10⁻¹ | 9.55 × 10⁻¹ | 9.93 × 10⁻¹ |
| DFE | 6.49 × 10² | 6.49 × 10² | 6.49 × 10² | 6.49 × 10² | 6.49 × 10² | 6.49 × 10² | 6.49 × 10² | 6.49 × 10² | 6.49 × 10² |
| Adj R-Square | 9.51 × 10⁻¹ | 9.78 × 10⁻¹ | 9.87 × 10⁻¹ | 9.35 × 10⁻¹ | 9.68 × 10⁻¹ | 9.87 × 10⁻¹ | 9.76 × 10⁻¹ | 9.54 × 10⁻¹ | 9.93 × 10⁻¹ |
| RMSE | 1.15 × 10⁻¹ | 4.90 × 10⁻² | 4.55 × 10⁻² | 1.02 × 10⁻¹ | 6.44 × 10⁻² | 4.15 × 10⁻² | 5.64 × 10⁻² | 8.49 × 10⁻² | 5.81 × 10⁻² |

Table A4.
Gaussian model constant values for (n = 6) M3 Screws 10–18.
Table A4.
Gaussian model constant values for (n = 6) M3 Screws 10–18.
| Constants | Screw 10 | Screw 11 | Screw 12 | Screw 13 | Screw 14 | Screw 15 | Screw 16 | Screw 17 | Screw 18 |
|---|---|---|---|---|---|---|---|---|---|
| a1 | 1.85 × 100 | 2.02 × 100 | 1.58 × 100 | 2.72 × 100 | 2.82 × 100 | 1.68 × 100 | 1.33 × 100 | 2.84 × 100 | 3.21 × 100 |
| b1 | 4.27 × 10³ | 4.20 × 10³ | 4.42 × 10³ | 4.33 × 10³ | 4.14 × 10³ | 4.27 × 10³ | 4.31 × 10³ | 4.28 × 10³ | 4.43 × 10³ |
| c1 | 2.22 × 101 | 1.71 × 101 | 2.67 × 101 | 9.13 × 101 | 7.54 × 101 | 2.04 × 101 | 3.57 × 101 | 7.44 × 101 | 8.94 × 101 |
| a2 | 3.69 × 10⁻¹ | 1.77 × 100 | 2.37 × 100 | 4.34 × 10⁻¹ | −1.08 × 10² | 2.22 × 100 | 1.41 × 100 | −5.63 × 10⁻² | 6.14 × 10⁻¹ |
| b2 | 3.87 × 10³ | 4.17 × 10³ | 4.36 × 10³ | 3.86 × 10³ | 3.76 × 10³ | 4.22 × 10³ | 4.34 × 10³ | 6.84 × 10³ | 4.12 × 10³ |
| c2 | 4.59 × 10² | 3.74 × 101 | 7.59 × 101 | 3.87 × 10² | 2.45 × 10² | 5.89 × 101 | 1.38 × 101 | 8.62 × 10² | 2.73 × 10² |
| a3 | 3.77 × 10⁻¹ | 4.24 × 10⁻¹ | 5.11 × 10⁻¹ | 7.12 × 10⁻² | 3.88 × 10⁻¹ | 7.32 × 10⁻¹ | 2.54 × 100 | 3.26 × 10⁻¹ | −1.03 × 10² |
| b3 | 2.15 × 10³ | 3.93 × 10³ | 4.13 × 10³ | 2.30 × 10³ | 2.94 × 10³ | 4.11 × 10³ | 4.24 × 10³ | 1.14 × 10³ | 8.82 × 10² |
| c3 | 1.67 × 10³ | 1.94 × 10² | 2.68 × 10² | 1.81 × 10² | 6.75 × 10² | 1.27 × 10² | 8.66 × 101 | 4.24 × 10² | 1.84 × 10³ |
| a4 | −7.68 × 10⁻² | 2.52 × 10⁻¹ | 0.00 × 100 | −1.08 × 100 | 6.55 × 10¹² | 4.13 × 10⁻¹ | 5.10 × 10⁻¹ | 3.56 × 10⁻¹ | 1.76 × 101 |
| b4 | 2.19 × 10³ | 3.39 × 10³ | 3.49 × 10³ | −5.64 × 10² | −1.90 × 10⁵ | 3.83 × 10³ | 4.05 × 10³ | 2.86 × 10³ | 1.60 × 10³ |
| c4 | 1.46 × 10² | 4.91 × 10² | 9.46 × 10⁻¹ | 1.50 × 10³ | 3.51 × 10⁴ | 2.77 × 10² | 1.96 × 10² | 1.18 × 10³ | 1.77 × 10³ |
| a5 | 2.64 × 100 | 1.58 × 100 | 2.15 × 10⁻¹ | 6.65 × 10¹² | −1.15 × 100 | 2.98 × 10⁻¹ | 2.37 × 10⁻¹ | 1.18 × 100 | 8.94 × 101 |
| b5 | 4.22 × 10³ | 4.12 × 10³ | 3.46 × 10³ | −1.83 × 10⁵ | −1.24 × 10³ | 3.22 × 10³ | 3.51 × 10³ | 4.17 × 10³ | 7.60 × 10² |
| c5 | 6.75 × 101 | 6.68 × 101 | 3.80 × 10² | 3.38 × 10⁴ | 1.98 × 10³ | 6.43 × 10² | 4.97 × 10² | 1.19 × 10² | 1.79 × 10³ |
| a6 | 6.60 × 10⁵ | 5.36 × 10⁻¹ | 5.27 × 10⁻¹ | 1.21 × 10⁻¹ | 1.08 × 10² | 5.92 × 10⁻¹ | 5.22 × 10⁻¹ | 2.20 × 10¹² | 1.79 × 10⁻¹ |
| b6 | −6.24 × 10⁵ | 1.90 × 10³ | 2.17 × 10³ | 5.76 × 10² | 3.76 × 10³ | 1.84 × 10³ | 2.11 × 10³ | −9.74 × 10⁵ | 1.14 × 10⁴ |
| c6 | 1.61 × 10⁵ | 2.31 × 10³ | 2.36 × 10³ | 5.85 × 10² | 2.46 × 10² | 2.04 × 10³ | 2.54 × 10³ | 1.78 × 10⁵ | 6.67 × 10³ |
| SSE | 1.12 × 100 | 2.48 × 100 | 3.94 × 100 | 7.03 × 100 | 6.79 × 100 | 3.42 × 100 | 1.51 × 100 | 2.92 × 100 | 3.62 × 100 |
| R-Square | 9.87 × 10⁻¹ | 9.91 × 10⁻¹ | 9.88 × 10⁻¹ | 9.09 × 10⁻¹ | 9.36 × 10⁻¹ | 9.89 × 10⁻¹ | 9.96 × 10⁻¹ | 9.72 × 10⁻¹ | 9.66 × 10⁻¹ |
| DFE | 6.49 × 10² | 6.49 × 10² | 6.49 × 10² | 6.49 × 10² | 6.49 × 10² | 6.49 × 10² | 6.49 × 10² | 6.49 × 10² | 6.49 × 10² |
| Adj R-Square | 9.87 × 10⁻¹ | 9.91 × 10⁻¹ | 9.87 × 10⁻¹ | 9.07 × 10⁻¹ | 9.35 × 10⁻¹ | 9.88 × 10⁻¹ | 9.95 × 10⁻¹ | 9.71 × 10⁻¹ | 9.65 × 10⁻¹ |
| RMSE | 4.15 × 10⁻² | 6.18 × 10⁻² | 7.79 × 10⁻² | 1.04 × 10⁻¹ | 1.02 × 10⁻¹ | 7.26 × 10⁻² | 4.82 × 10⁻² | 6.70 × 10⁻² | 7.47 × 10⁻² |

Table A5.
Gaussian model constant values for (n = 6) M3 Screws 19–27.
Table A5.
Gaussian model constant values for (n = 6) M3 Screws 19–27.
| Constants | Screw 19 | Screw 20 | Screw 21 | Screw 22 | Screw 23 | Screw 24 | Screw 25 | Screw 26 | Screw 27 |
|---|---|---|---|---|---|---|---|---|---|
| a1 | 2.12 × 100 | 1.54 × 100 | 1.83 × 100 | 3.02 × 100 | 3.32 × 100 | 1.78 × 100 | 1.90 × 100 | 1.90 × 100 | 2.68 × 100 |
| b1 | 4.23 × 10³ | 4.50 × 10³ | 4.29 × 10³ | 4.28 × 10³ | 4.31 × 10³ | 4.36 × 10³ | 4.39 × 10³ | 4.32 × 10³ | 4.29 × 10³ |
| c1 | 4.35 × 101 | 2.16 × 101 | 3.72 × 101 | 7.36 × 101 | 7.19 × 101 | 3.84 × 101 | 2.15 × 101 | 2.51 × 101 | 9.12 × 101 |
| a2 | 6.63 × 10⁻¹ | 2.23 × 100 | 2.96 × 100 | 7.84 × 10⁻¹ | −1.39 × 10⁻¹ | 2.27 × 100 | 2.63 × 100 | 2.69 × 100 | −1.29 × 100 |
| b2 | 3.27 × 10³ | 4.45 × 10³ | 4.21 × 10³ | 3.86 × 10³ | 4.53 × 10³ | 4.29 × 10³ | 4.34 × 10³ | 4.26 × 10³ | 4.37 × 10³ |
| c2 | 7.54 × 10² | 6.00 × 101 | 8.40 × 101 | 3.63 × 10² | 6.80 × 10² | 7.70 × 101 | 6.10 × 101 | 6.78 × 101 | 2.22 × 101 |
| a3 | −8.57 × 10⁻² | 3.65 × 10⁻¹ | 1.86 × 100 | 3.57 × 10⁻¹ | 4.64 × 10⁻¹ | 4.44 × 10⁻¹ | 6.65 × 10⁻¹ | −2.37 × 10⁻¹ | 8.08 × 10⁻¹ |
| b3 | 2.99 × 10³ | 4.36 × 10³ | 4.32 × 10³ | 3.12 × 10³ | 4.07 × 10³ | 1.73 × 10³ | 4.23 × 10³ | 4.43 × 10³ | 4.18 × 10³ |
| c3 | 1.35 × 10² | 8.88 × 101 | 1.44 × 101 | 3.81 × 10² | 2.20 × 10² | 1.68 × 10³ | 1.23 × 10² | 3.60 × 10² | 1.33 × 10² |
| a4 | 4.71 × 10⁻¹ | 3.08 × 10⁻¹ | 5.34 × 10⁻¹ | 3.39 × 10⁻¹ | 4.82 × 10⁻¹ | 5.20 × 10⁻¹ | 2.75 × 10⁻¹ | 6.20 × 10⁻¹ | 5.37 × 10⁻² |
| b4 | 1.97 × 10³ | 3.58 × 10³ | 3.97 × 10³ | 2.06 × 10³ | 2.57 × 10³ | 3.99 × 10³ | 3.78 × 10³ | 4.15 × 10³ | 2.93 × 10³ |
| c4 | 5.02 × 10² | 5.49 × 10² | 2.33 × 10² | 1.01 × 10³ | 2.05 × 10³ | 3.35 × 10² | 4.04 × 10² | 1.26 × 10² | 2.04 × 10² |
| a5 | 1.84 × 100 | 5.23 × 10⁻¹ | 4.90 × 10⁻² | −5.31 × 10⁻¹ | −7.08 × 10⁻² | 3.15 × 10⁻¹ | 1.39 × 10⁻¹ | 5.19 × 10⁻¹ | 2.68 × 10⁻¹ |
| b5 | 4.16 × 10³ | 4.19 × 10³ | 5.09 × 10³ | −3.13 × 10² | 9.87 × 10³ | 3.20 × 10³ | 3.13 × 10³ | 1.56 × 10³ | 3.67 × 10³ |
| c5 | 7.81 × 101 | 2.21 × 10² | 9.19 × 101 | 4.72 × 10² | 9.46 × 10³ | 7.15 × 10² | 1.36 × 10² | 1.66 × 10³ | 4.53 × 10² |
| a6 | 6.81 × 10¹² | 6.75 × 10⁻¹ | 4.84 × 10⁻¹ | 5.37 × 10¹² | 1.98 × 10⁻¹ | 1.63 × 10⁻¹ | 4.69 × 10⁻¹ | 4.70 × 10⁻¹ | 5.71 × 10⁻¹ |
| b6 | −6.48 × 10⁵ | 2.25 × 10³ | 2.06 × 10³ | −3.35 × 10⁵ | 1.35 × 10⁴ | 1.11 × 10⁴ | 2.04 × 10³ | 3.77 × 10³ | 2.03 × 10³ |
| c6 | 1.17 × 10⁵ | 2.31 × 10³ | 2.20 × 10³ | 6.11 × 10⁴ | 2.55 × 10⁴ | 1.60 × 10⁴ | 2.47 × 10³ | 1.07 × 10³ | 2.13 × 10³ |
| SSE | 2.59 × 100 | 2.40 × 100 | 2.76 × 100 | 5.28 × 100 | 2.35 × 100 | 1.18 × 100 | 3.27 × 100 | 4.04 × 100 | 6.50 × 100 |
| R-Square | 9.69 × 10⁻¹ | 9.89 × 10⁻¹ | 9.95 × 10⁻¹ | 9.44 × 10⁻¹ | 9.74 × 10⁻¹ | 9.86 × 10⁻¹ | 9.90 × 10⁻¹ | 9.90 × 10⁻¹ | 9.83 × 10⁻¹ |
| DFE | 6.49 × 10² | 6.49 × 10² | 6.49 × 10² | 6.49 × 10² | 6.49 × 10² | 6.49 × 10² | 6.49 × 10² | 6.49 × 10² | 6.49 × 10² |
| Adj R-Square | 9.69 × 10⁻¹ | 9.89 × 10⁻¹ | 9.95 × 10⁻¹ | 9.43 × 10⁻¹ | 9.73 × 10⁻¹ | 9.86 × 10⁻¹ | 9.90 × 10⁻¹ | 9.90 × 10⁻¹ | 9.83 × 10⁻¹ |
| RMSE | 6.31 × 10⁻² | 6.08 × 10⁻² | 6.52 × 10⁻² | 9.02 × 10⁻² | 6.02 × 10⁻² | 4.26 × 10⁻² | 7.10 × 10⁻² | 7.89 × 10⁻² | 1.00 × 10⁻¹ |

Table A6.
Gaussian model constant values for (n = 6) M3 Screws 28–35.
Table A6.
Gaussian model constant values for (n = 6) M3 Screws 28–35.
| Constants | Screw 28 | Screw 29 | Screw 30 | Screw 31 | Screw 32 | Screw 33 | Screw 34 | Screw 35 |
|---|---|---|---|---|---|---|---|---|
| a1 | 2.84 × 100 | 1.63 × 100 | 1.54 × 100 | 1.76 × 100 | 2.71 × 100 | 1.66 × 100 | 1.98 × 100 | 1.60 × 100 |
| b1 | 4.22 × 10³ | 4.27 × 10³ | 4.34 × 10³ | 4.29 × 10³ | 4.29 × 10³ | 4.37 × 10³ | 4.34 × 10³ | 4.27 × 10³ |
| c1 | 7.60 × 101 | 2.17 × 101 | 2.23 × 101 | 2.65 × 101 | 6.72 × 101 | 2.10 × 101 | 1.83 × 101 | 3.64 × 101 |
| a2 | 6.95 × 10⁻¹ | 2.36 × 100 | 2.33 × 100 | 2.63 × 100 | 4.71 × 10⁻¹ | 2.07 × 100 | 1.94 × 100 | 2.59 × 100 |
| b2 | 3.99 × 10³ | 4.23 × 10³ | 4.29 × 10³ | 4.22 × 10³ | 3.10 × 10³ | 4.33 × 10³ | 4.30 × 10³ | 4.20 × 10³ |
| c2 | 1.78 × 10² | 5.79 × 101 | 6.39 × 101 | 7.56 × 101 | 7.03 × 10² | 5.19 × 101 | 4.22 × 101 | 8.47 × 101 |
| a3 | 3.92 × 10⁻¹ | 7.70 × 10⁻¹ | 4.72 × 10⁻¹ | 4.71 × 10⁻¹ | 5.02 × 10⁻¹ | 6.47 × 10⁻¹ | 1.27 × 100 | 1.61 × 100 |
| b3 | 3.42 × 10³ | 4.14 × 10³ | 4.21 × 10³ | 4.05 × 10³ | 1.61 × 10³ | 4.21 × 10³ | 4.25 × 10³ | 4.31 × 10³ |
| c3 | 4.68 × 10² | 1.13 × 10² | 1.62 × 10² | 1.75 × 10² | 1.30 × 10³ | 1.44 × 10² | 7.63 × 101 | 1.48 × 101 |
| a4 | 4.23 × 10⁻¹ | 3.25 × 10⁻¹ | 1.76 × 10⁻¹ | 4.34 × 10⁻¹ | 4.99 × 10⁻¹ | 3.66 × 10⁻¹ | 2.33 × 10⁻¹ | 4.72 × 10⁻¹ |
| b4 | 2.27 × 10³ | 3.65 × 10³ | 3.87 × 10³ | 2.32 × 10³ | 3.83 × 10³ | 3.63 × 10³ | 3.24 × 10³ | 4.02 × 10³ |
| c4 | 1.14 × 10³ | 7.34 × 10² | 3.14 × 10² | 2.29 × 10³ | 3.15 × 10² | 6.40 × 10² | 7.02 × 10² | 4.43 × 10² |
| a5 | −1.08 × 10⁻² | 4.15 × 10⁻¹ | 9.97 × 10⁻² | −5.44 × 10⁻² | 7.83 × 10⁻¹ | 1.18 × 10⁻¹ | 4.67 × 10⁻¹ | −3.32 × 10⁻¹ |
| b5 | 2.10 × 10² | 1.82 × 10³ | 3.29 × 10³ | 2.48 × 10³ | 4.17 × 10³ | 7.38 × 10³ | 1.97 × 10³ | 4.38 × 10³ |
| c5 | 5.04 × 101 | 1.80 × 10³ | 6.12 × 10² | 4.82 × 101 | 1.35 × 10² | 4.44 × 10³ | 2.67 × 10³ | 3.06 × 10² |
| a6 | 5.18 × 10¹² | 1.15 × 10⁻¹ | 3.91 × 10⁻¹ | 1.05 × 10⁻¹ | 1.76 × 10⁻¹ | 5.87 × 10⁻¹ | 3.32 × 10⁻¹ | 5.65 × 10⁻¹ |
| b6 | −7.19 × 10⁵ | 1.12 × 10⁴ | 1.90 × 10³ | 6.02 × 10² | 9.33 × 10³ | 1.86 × 10³ | 3.95 × 10³ | 2.05 × 10³ |
| c6 | 1.30 × 10⁵ | 1.18 × 10⁴ | 2.52 × 10³ | 6.34 × 10² | 1.40 × 10⁴ | 2.04 × 10³ | 3.08 × 10² | 2.54 × 10³ |
| SSE | 2.63 × 100 | 4.13 × 10⁻¹ | 2.17 × 100 | 3.30 × 100 | 2.06 × 100 | 7.52 × 10⁻¹ | 2.30 × 100 | 1.78 × 100 |
| R-Square | 9.67 × 10⁻¹ | 9.95 × 10⁻¹ | 9.93 × 10⁻¹ | 9.88 × 10⁻¹ | 9.76 × 10⁻¹ | 9.93 × 10⁻¹ | 9.92 × 10⁻¹ | 9.95 × 10⁻¹ |
| DFE | 6.49 × 10² | 6.49 × 10² | 6.49 × 10² | 6.49 × 10² | 6.49 × 10² | 6.49 × 10² | 6.49 × 10² | 6.49 × 10² |
| Adj R-Square | 9.66 × 10⁻¹ | 9.95 × 10⁻¹ | 9.93 × 10⁻¹ | 9.88 × 10⁻¹ | 9.76 × 10⁻¹ | 9.93 × 10⁻¹ | 9.92 × 10⁻¹ | 9.95 × 10⁻¹ |
| RMSE | 6.36 × 10⁻² | 2.52 × 10⁻² | 5.79 × 10⁻² | 7.13 × 10⁻² | 5.64 × 10⁻² | 3.40 × 10⁻² | 5.95 × 10⁻² | 5.23 × 10⁻² |
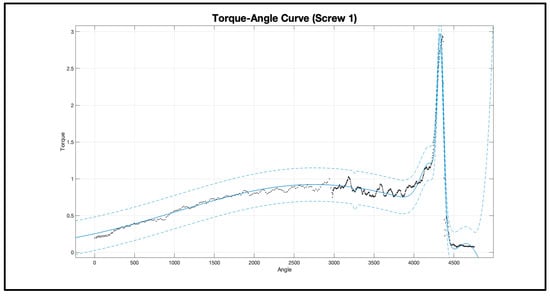
Figure A19.
Sample 1 data (black color) with 95% confidence interval (blue color).
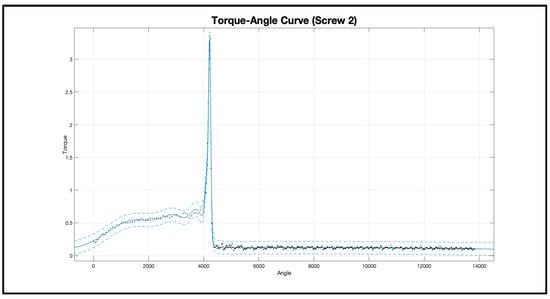
Figure A20.
Sample 2 data (black color) with 95% confidence interval (blue color).
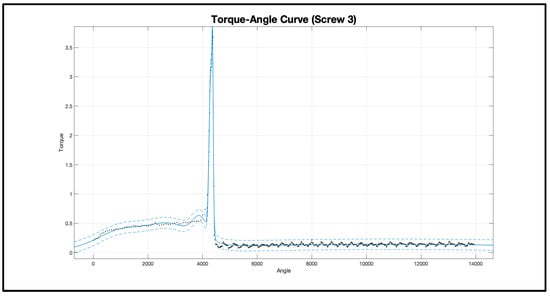
Figure A21.
Sample 3 data (black color) with 95% confidence interval (blue color).
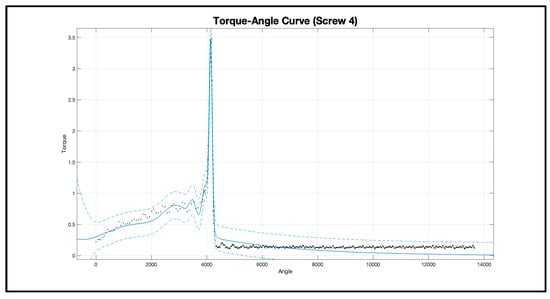
Figure A22.
Sample 4 data (black color) with 95% confidence interval (blue color).
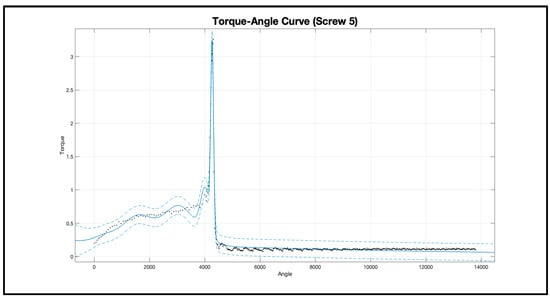
Figure A23.
Sample 5 data (black color) with 95% confidence interval (blue color).
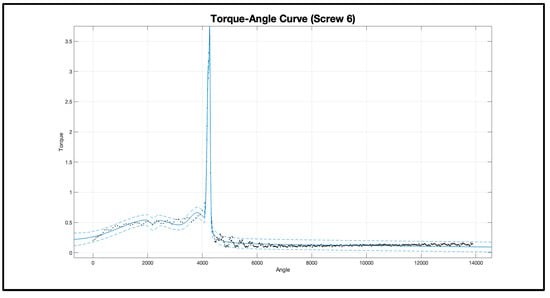
Figure A24.
Sample 6 data (black color) with 95% confidence interval (blue color).
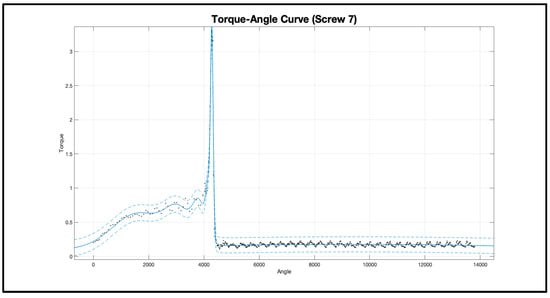
Figure A25.
Sample 7 data (black color) with 95% confidence interval (blue color).
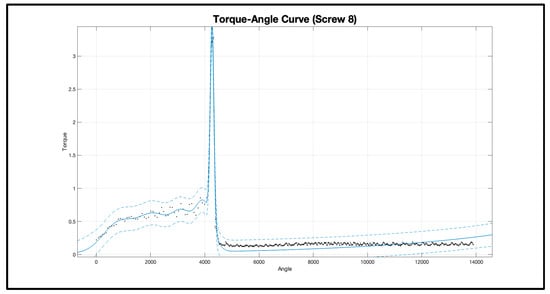
Figure A26.
Sample 8 data (black color) with 95% confidence interval (blue color).
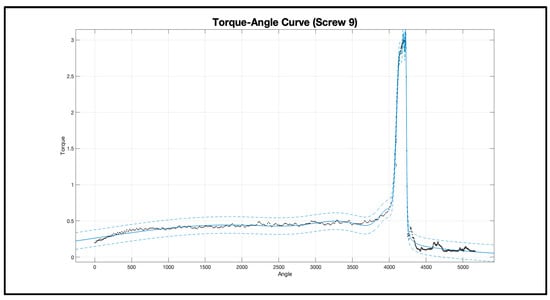
Figure A27.
Sample 9 data (black color) with 95% confidence interval (blue color).
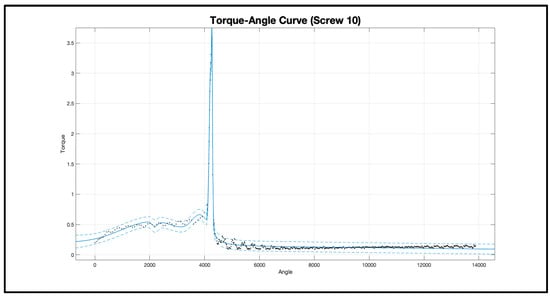
Figure A28.
Sample 10 data (black color) with 95% confidence interval (blue color).
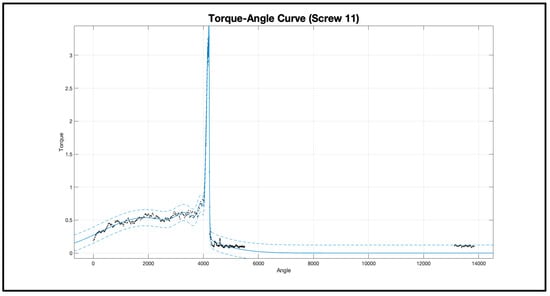
Figure A29.
Sample 11 data (black color) with 95% confidence interval (blue color).
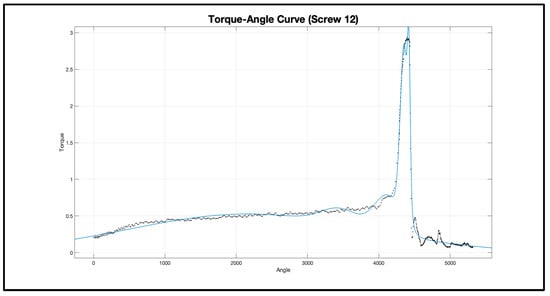
Figure A30.
Sample 12 data (black color) with 95% confidence interval (blue color).
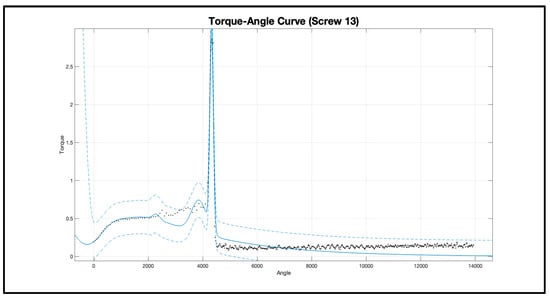
Figure A31.
Sample 13 data (black color) with 95% confidence interval (blue color).
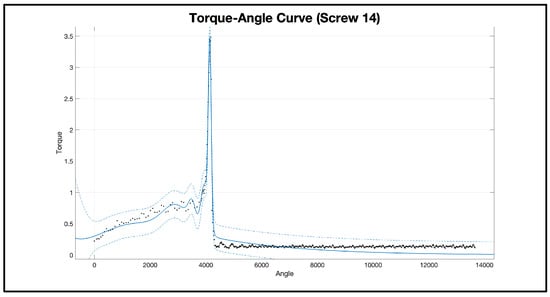
Figure A32.
Sample 14 data (black color) with 95% confidence interval (blue color).
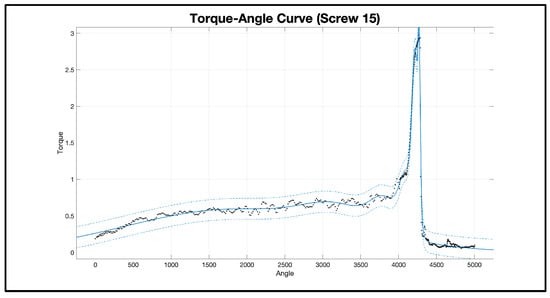
Figure A33.
Sample 15 data (black color) with 95% confidence interval (blue color).
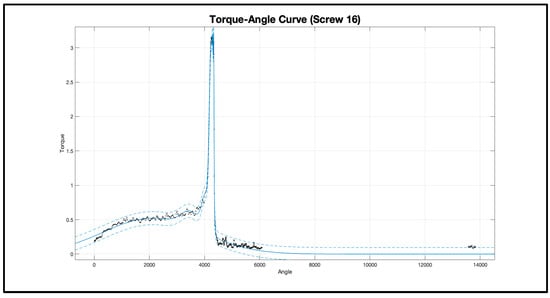
Figure A34.
Sample 16 data (black color) with 95% confidence interval (blue color).
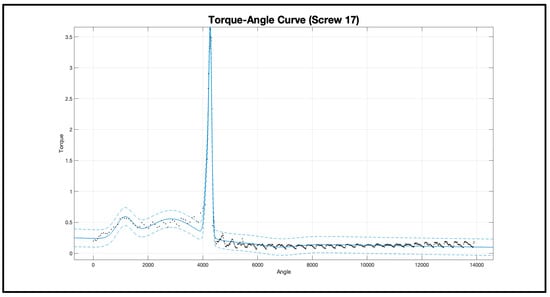
Figure A35.
Sample 17 data (black color) with 95% confidence interval (blue color).
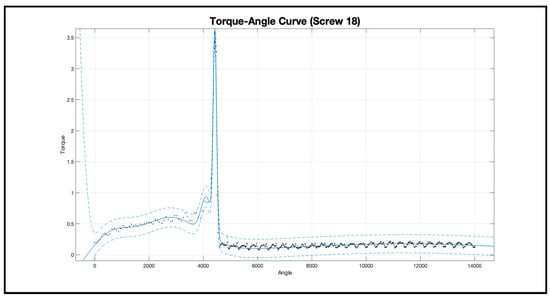
Figure A36.
Sample 18 data (black color) with 95% confidence interval (blue color).
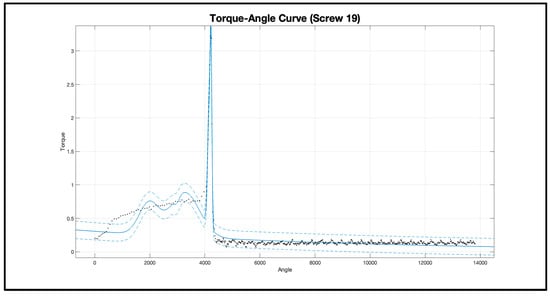
Figure A37.
Sample 19 data (black color) with 95% confidence interval (blue color).
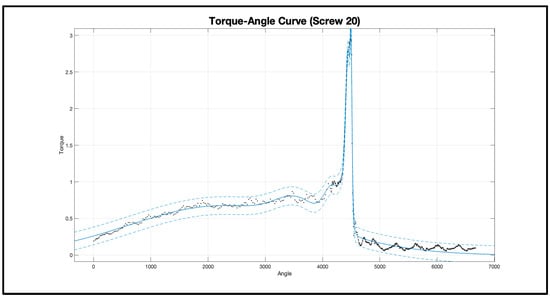
Figure A38.
Sample 20 data (black color) with 95% confidence interval (blue color).
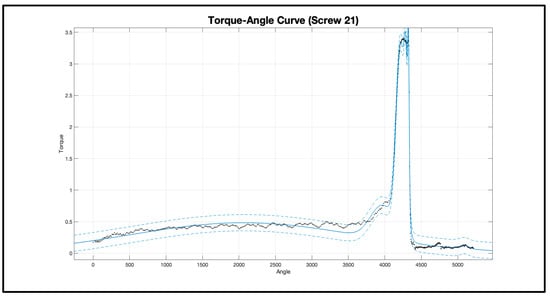
Figure A39.
Sample 21 data (black color) with 95% confidence interval (blue color).
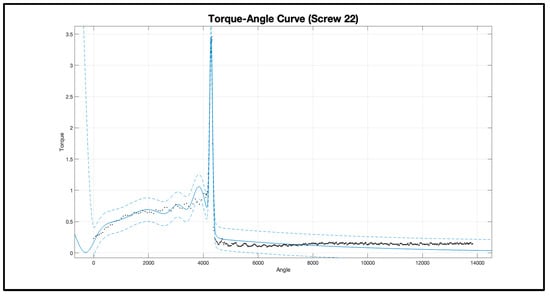
Figure A40.
Sample 22 data (black color) with 95% confidence interval (blue color).
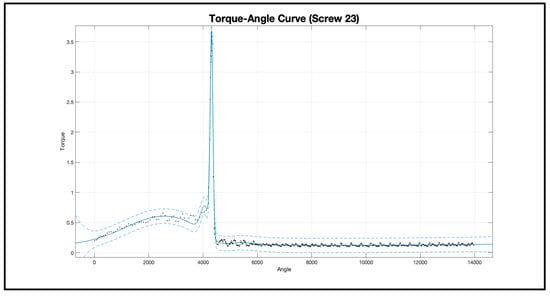
Figure A41.
Sample 23 data (black color) with 95% confidence interval (blue color).
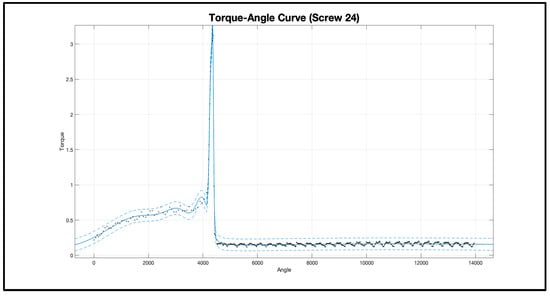
Figure A42.
Sample 24 data (black color) with 95% confidence interval (blue color).
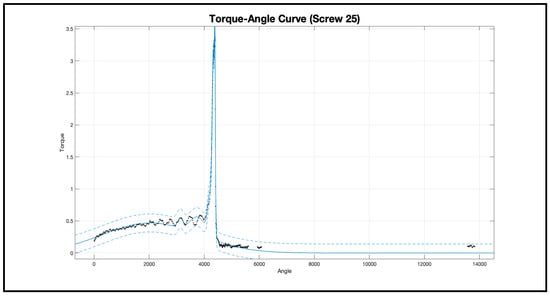
Figure A43.
Sample 25 data (black color) with 95% confidence interval (blue color).
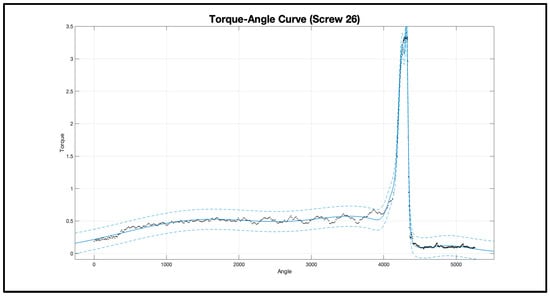
Figure A44.
Sample 26 data (black color) with 95% confidence interval (blue color).
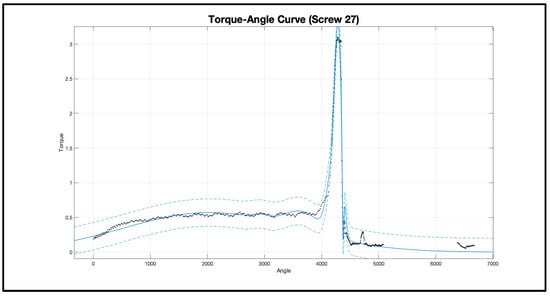
Figure A45.
Sample 27 data (black color) with 95% confidence interval (blue color).
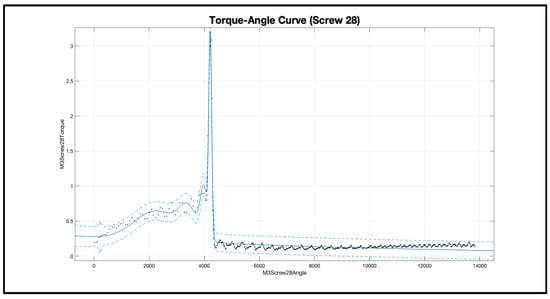
Figure A46.
Sample 28 data (black color) with 95% confidence interval (blue color).
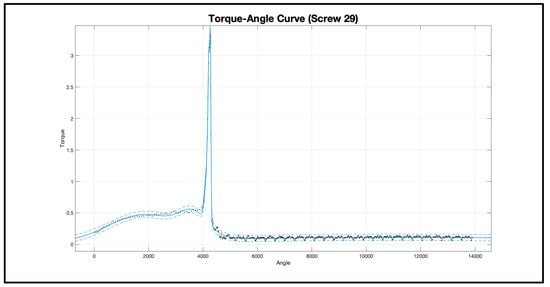
Figure A47.
Sample 29 data (black color) with 95% confidence interval (blue color).
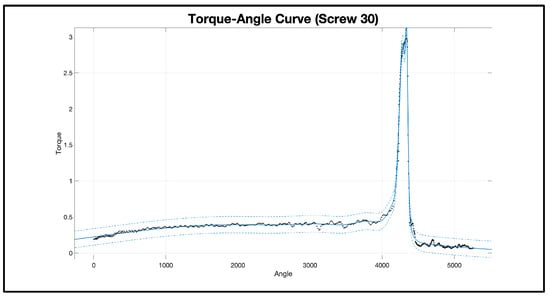
Figure A48.
Sample 30 data (black color) with 95% confidence interval (blue color).
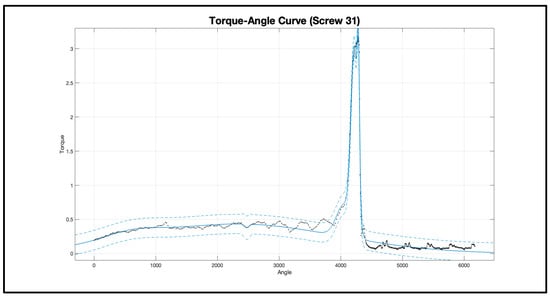
Figure A49.
Sample 31 data (black color) with 95% confidence interval (blue color).
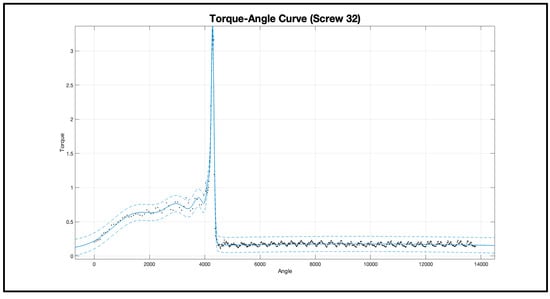
Figure A50.
Sample 32 data (black color) with 95% confidence interval (blue color).
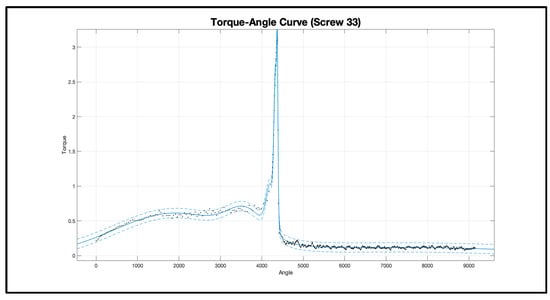
Figure A51.
Sample 33 data (black color) with 95% confidence interval (blue color).
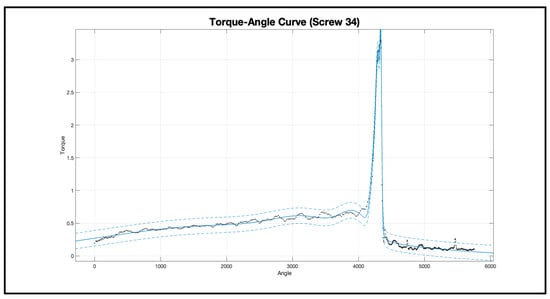
Figure A52.
Sample 34 data (black color) with 95% confidence interval (blue color).
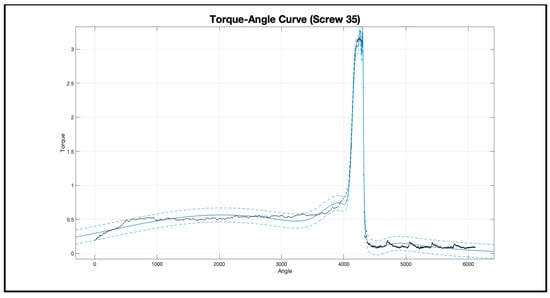
Figure A53.
Sample 35 data (black color) with 95% confidence interval (blue color).
References
- Lee, D.Y. Fastener for Vehicle. U.S. Patent Application No. 14/541,084, 25 June 2015. [Google Scholar]
- Lange, W.; Rosemann, F. Fasteners for automotive Components. U.S. Patent No. 8,371,788, 12 February 2013. [Google Scholar]
- Guggolz, D.; Manoharan, S.K.; Friedrich, C. Avoiding of self-loosening in components with multiple screw joints. In Proceedings of the ASME International Mechanical Engineering Congress and Exposition, Houston, TX, USA, 13–19 November 2015; Volume 57366, p. V02BT02A033. [Google Scholar] [CrossRef]
- Kulkarni, S.; Kulkarni, C.; Vimal, K.E.K.; Jayakrishna, K. Statistical Quality Control of Torque Wrenches Used in Automotive Assembly Department. In Advances in Manufacturing Technology; Springer: Berlin/Heidelberg, Germany, 2018. [Google Scholar] [CrossRef]
- Chen, C.-M.; Chang, H.-L.; Lee, C.-Y. An experimental study on the torsional stiffness and limit torque of a jaw coupling with consideration of spacer’s hardness and installation methods. J. Mech. 2022, 38, 195–203. [Google Scholar] [CrossRef]
- Wu, G.-Q.; Chen, J.; Zhu, W.-J. Performance analysis and improvement of flat torque converters using DOE method. Chin. J. Mech. Eng. 2018, 31, 60. [Google Scholar] [CrossRef]
- Roy, K.; Lau, H.H.; Fang, Z.; Masood, R.; Lim, J.B.P.; Lee, V.C.C. Effects of corrosion on the strength of self-drilling screw connections in cold-formed steel structures—Experiments and finite element modeling. Structures 2022, 36, 1080–1096. [Google Scholar] [CrossRef]
- Liu, D.-S.; Lin, P.-C.; Lin, J.-J.; Wang, C.-R.; Shiau, T.N. Effect of environmental temperature on dynamic behavior of an adjustable preload double-nut ball screw. Int. J. Adv. Manuf. Technol. 2019, 101, 2761–2770. [Google Scholar] [CrossRef]
- Tran, D.-T.; Pham, V.-H.; Le, D.-D.; Bui, T. A study on influence of environmental working conditions on wear of a ball screw based on tcvn7699-2-30. J. Appl. Eng. Sci. 2022, 20, 372–376. [Google Scholar] [CrossRef]
- Zeng, R.C.; Yin, Z.Z.; Chen, X.B.; Xu, D.K. Corrosion types of magnesium alloys. In Magnesium Alloys—Selected Issue; IntechOpen: London, UK, 2018; pp. 29–53. [Google Scholar]
- Khademian, N.; Peimaei, Y. Magnesium alloys and applications in automotive industry. In Proceedings of the 5th International Conference on Science and Development of Nanotechnology, Tbilisi, Georgia, 22 July 2021; pp. 1–23. [Google Scholar]
- Lachowicz, M.B.; Lachowicz, M.M. Influence of corrosion on fatigue of the fastening bolts. Materials 2021, 14, 1485. [Google Scholar] [CrossRef]
- Michailidis, N.; Stergioudi, F.; Maliaris, G.; Tsouknidas, A. Influence of galvanization on the corrosion fatigue performance of high-strength steel. Surf. Coat. Technol. 2014, 259, 456–464. [Google Scholar] [CrossRef]
- Wentzel, H.; Huang, X. Experimental characterization of the bending fatigue strength of threaded fasteners. Int. J. Fatigue 2015, 72, 102–108. [Google Scholar] [CrossRef]
- Bickford, J.H.; Nassar, S.A. Handbook of Bolts and Bolted Joints; Marcel Dekker: New York, NY, USA, 1998. [Google Scholar]
- Shigley, J.E.; Mischke, C.R. Mechanical Engineering Design, 5th ed.; McGraw-Hill: New York, NY, USA, 1989. [Google Scholar]
- Brown, K.H.; Morrow, C.W.; Durbin, S.; Baca, A. Guideline for Bolted Joint Design and Analysis: Version 1.0; U.S. Department of Energy: Washington, DC, USA, 2008. [CrossRef]
- AtlasCopco. Pocket Guide to Tightening Technique. 2015. Available online: https://www.atlascopco.com/content/dam/atlas-copco/industrial-technique/general/documents/pocketguides/Power%20Focus%206000%20Pocket%20Guide_.pdf (accessed on 1 September 2024).
- Goh, G.D.; Yeong, W.Y. 3D Printed Materials for High Torque Applications: Challenges and Potential. In Proceedings of the 2nd International Conference on Progress in Additive Manufacturing (Pro-AM 2016), Singapore, 16–19 May 2016; pp. 318–323. [Google Scholar]
- Kim, J.M.; Yoon, M.H.; Hong, J.P.; Kim, S.I. Analysis of cogging torque caused by manufacturing tolerances of surface-mounted permanent magnet synchronous motor for electric power steering. IET Electr. Power Appl. 2016, 10, 691–696. [Google Scholar] [CrossRef]
- Guo, K.; Zhang, T.; Yuan, H. Experimental and computational investigations of nonlinear frictional behavior in threaded fasteners. Tribol. Int. 2021, 154, 106737. [Google Scholar] [CrossRef]
- Adesoji, A.A.; Onu, P.; Afolalu, S.A.; Bello, K.A.; Lawal, S.L.; Monye, S.I.; Ogunniyi, O.J. Tribological Analysis of Advanced Lubricants in Automotive Engines. In Proceedings of the 2024 International Conference on Science, Engineering and Business for Driving Sustainable Development Goals (SEB4SDG), Omu-Aran, Nigeria, 2–4 April 2024. [Google Scholar] [CrossRef]
- Dyson, C.; Hopkins, W.; Aljeran, D.; Fox, M.; Priest, M. Tribological Considerations of Threaded Fastener Friction and the Importance of Lubrication. Tribol. Int. 2023, 191, 109162. [Google Scholar] [CrossRef]
- Zhang, Y.; Zhou, C.; Feng, H. A meticulous friction torque model for a lubricated ball screw considering the surface roughness. Tribol. Int. 2023, 190, 109014. [Google Scholar] [CrossRef]
- Ideris, M.H.; Kamaruddin, S.; Sulaiman, M.H.; Sukindar, N.A.; Azhar, A.Z.A.; Yasir, A.S.H.M. Effects of Coating and Lubrication on Friction and Wear for Metal-to Metal Application. J. Adv. Res. Appl. Mech. 2023, 110, 52–62. [Google Scholar] [CrossRef]
- Bickford, J.H. Introduction to the Design and Behavior of Bolted Joints, 4th ed.; CRC Press: Boca Raton, FL, USA, 2008. [Google Scholar]
- Tang, H.; Wang, Y.; Cheng, Z.; He, J.; Chen, C. A Study of Calibration Method for Fastener Dynamic Torque in Vehicle Durability Tests. In Proceedings of the 19th Asia Pacific Automotive Engineering Conference & SAE-China Congress 2017: Selected Papers; Springer: Berlin/Heidelberg, Germany, 2017. [Google Scholar] [CrossRef]
- Zhang, J.; Du, M.; Shao, Y.; Chen, J. Torsional vibration analysis of Fastening structure based on finite element method. In Proceedings of the 2015 IEEE International Conference on Mechatronics and Automation (ICMA), Beijing, China, 2–5 August 2015. [Google Scholar] [CrossRef]
- Karayel, D.; Yegin, V. Design and Prototype Manufacturing of a Torque Measurement System. Acta Phys. Pol. A 2016, 130, 272–275. [Google Scholar] [CrossRef]
- Oezkaya, E.; Biermann, D. Development of a geometrical torque prediction method (GTPM) to automatically determine the relative torque for different tapping tools and diameters. Int. J. Adv. Manuf. Technol. 2018, 97, 1465–1479. [Google Scholar] [CrossRef]
- Weck, M.; Hilbing, R.; Peschke, C. Precision Machine Tools. In Initiatives of Precision Engineering at the Beginning of a Millennium; Inasaki, I., Ed.; Springer: Berlin/Heidelberg, Germany, 2001; pp. 519–523. [Google Scholar] [CrossRef]
- Goszczak, J. Torque measurement issues. IOP Conf. Ser. Mater. Sci. Eng. 2016, 148, 012041. [Google Scholar] [CrossRef]
- Wani, P.R. Critical Fasteners, Highly Loaded Bolted Joints. In Design and Development of Heavy Duty Diesel Engines: A Handbook; Springer: Berlin/Heidelberg, Germany, 2020; pp. 509–523. [Google Scholar]
- Méndez-González, L.C.; Rodríguez-Picón, L.A.; Pérez-Olguin, I.J.C.; Pérez-Domínguez, L.A.; Luviano Cruz, D. The alpha power Weibull transformation distribution applied to describe the behavior of electronic devices under voltage stress profile. Qual. Technol. Quant. Manag. 2022, 19, 692–721. [Google Scholar] [CrossRef]
- Rodríguez-Picón, L.A.; Perez-Dominguez, L.; Mejia, J.; Perez-Olguin, I.J.; Rodríguez-Borbón, M.I. A deconvolution approach for degradation modeling with measurement error. IEEE Access 2019, 7, 143899–143911. [Google Scholar] [CrossRef]
- Rasmussen, C.E.; Williams, C.K.I. Gaussian Processes for Machine Learning; MIT Press: Cambridge, MA, USA, 2006. [Google Scholar]
- Biyik, A. Estimation of Loosening Rates of Fasteners Under Certain Transverse Vibration Conditions by Using Computational Intelligence Techniques. Master’s Thesis, Dokuz Eylul Universitesi, Konak/Izmir, Turkey, 2017. [Google Scholar]
- Bourne, D.; Dubrawski, A.; Mason, M.T. Data-Driven Classification of Screwdriving Operations. In Proceedings of the 2016 International Symposium on Experimental Robotics, Nagasaki, Japan, 3–6 October 2016; Volume 1, p. 244. [Google Scholar]
- Silva, A.; López-Navarrete, G.; García-Martos, C.; Muñoz-Guijosa, J.M. Automated resolution of the spiral torsion spring inverse design problem. Sci. Rep. 2024, 14, 2956. [Google Scholar] [CrossRef]
- Zou, Q.; Sun, T.S.; Nassar, S.A.; Barber, G.C.; Gumul, A.K. Effect of lubrication on friction and torque-tension relationship in threaded fasteners. In Proceedings of the International Joint Tribology Conference 2006, San Antonio, TX, USA, 23–25 October 2006; Volume 42592, pp. 591–602. [Google Scholar]
- Croccolo, D.; De Agostinis, M.; Vincenzi, N. Failure analysis of bolted joints: Effect of friction coefficients in torque–preloading relationship. Eng. Fail. Anal. 2011, 18, 364–373. [Google Scholar] [CrossRef]
- Grabon, W.A.; Osetek, M.; Mathia, T.G. Friction of threaded fasteners. Tribol. Int. 2018, 118, 408–420. [Google Scholar] [CrossRef]
- Croccolo, D.; De Agostinis, M.; Fini, S.; Khan, M.Y.; Mele, M.; Olmi, G. Optimization of Bolted Joints: A Literature Review. Metals 2023, 13, 1708. [Google Scholar] [CrossRef]
- Nguyen, P.V. Torque Coefficients in Automotive Bolted joint assembly. Master’s Thesis, Purdue University, West Lafayette, IN, USA, 2015. [Google Scholar]
- Güler, B.; Şengör, Ö.; Yavuz, O.; Öztürk, F. Prediction of Self-Loosening Mechanism and Behavior of Bolted Joints on Automotive Chassis Using Artificial Intelligence. Machines 2023, 11, 895. [Google Scholar] [CrossRef]
- Chen, B.; Shen, L.; Zhang, H. Gaussian Process Regression-Based Material Model for Stochastic Structural Analysis. ASCE-ASME J. Risk Uncertain. Eng. Syst. Part A Civ. Eng. 2021, 7, 04021025. [Google Scholar] [CrossRef]
- DIN 7500-1: 2021-07; Thread Forming Screws for ISO Metric Thread—Part 1: Technical Specifications for Case Hardened and Tempered Screws. German Institute for Standardisation (Deutsches Institut für Normung): Berlin, Germany, 2021.
- JIS B 1060; Mechanical and Performance Requirements of Case Hardened and Tempered Metric Thread Rolling Screws. Japanese Standards Association: Tokyo, Japan, 2003.
Disclaimer/Publisher’s Note: The statements, opinions and data contained in all publications are solely those of the individual author(s) and contributor(s) and not of MDPI and/or the editor(s). MDPI and/or the editor(s) disclaim responsibility for any injury to people or property resulting from any ideas, methods, instructions or products referred to in the content. |
© 2024 by the authors. Licensee MDPI, Basel, Switzerland. This article is an open access article distributed under the terms and conditions of the Creative Commons Attribution (CC BY) license (https://creativecommons.org/licenses/by/4.0/).