Abstract
The Montefeltro seismic network (FDSN Network code: 1S) was deployed in the Apennines area of northern Marche and southern Emilia-Romagna regions (central Italy). A temporary network was set up in December 2018 and continues to operate, with an array consisting of stations equipped with dynamic digitizers and three-component short/extended/broad band seismometers (Guralp CMG/20s and 30s, Lennartz 3D/5s, Sara SS20 3D/0.5s sensors). The network records in continuous mode at 100 sps. The data are used to analyze the seismic activity and the spatiotemporal evolution of small seismic sequences occurring in the considered area and surrounding zones, strongly clustered in time and space. The data of dataset files are mini-seed formatted and subdivided by the following tree: (1) the dataset is divided by years; (2) the dataset is then subdivided by stations; (3) finally, the data are divided by days of each year in every station folder.
Dataset License: CC-BY 4.0
1. Summary
In this work, we present the seismic monitoring of the area of Montefeltro and surroundings, an area located between the provinces of Rimini and of Pesaro-Urbino and extending from the northern Apennine chain towards the Adriatic coast to the borders of San Marino. The region that includes Montefeltro is not adequately monitored; this entails limits if one intends to analyze in detail the background seismicity. In order to locally integrate the coverage of the INGV National Seismic Network, a temporary seismic network with highly dynamic mobile stations was installed in December 2018 and it is still operative.
At the moment, the temporary network consists of four stations, MF01 in the Municipality of Auditore, MF02 in the Convent of the Capuchin Friars of Sant’Agata Feltria, MF03 in the astronomical observatory “Monte San Lorenzo” and MF04 in the Balze locality of the Municipality of Verghereto (Figure 1). The seismic network was operative from 2018 and will be integrated with other stations in the future. We will release data from 2020 for both currently operative and installation in progress stations. Table 1 summarizes the coordinates of the stations at each site. The network has been registered on the International Federation of Digital Seismograph Networks website (www.fdsn.org, accessed on 4 October 2022) with the code 1S (https://doi.org/10.7914/SN/1S_2018, accessed on 4 October 2022), entitled “Montefeltro Seismic Network (MF)”, while the stations have been registered on the International Registry of Seismograph Stations (http://www.isc.ac.uk, accessed on 4 October 2022).
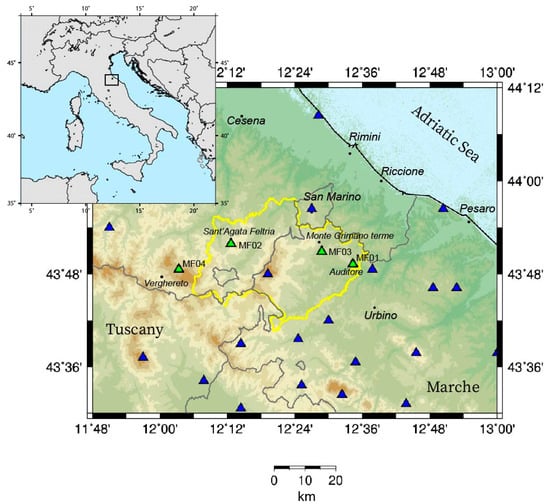
Figure 1.
Map of the RSN seismic network (blue triangles) in the Montefeltro area (yellow line) and surrounding areas. MF01, MF02, MF03 and MF04 (green triangles) are the four currently operative stations of the Montefeltro seismic network (MF).Map of the RSM seismic network (blue triangles) in the Montefeltro area (white line) and surrounding areas. Mappa della rete sismica RSM (triangoli blu) nell’area del Montefeltro (linea bianca) e zone limitrofe.Map of the RSM (blue triangles) seismic network in the Montefeltro area (white line) and surrounding areas.Mappa della rete sismica RSM (triangoli blu) nell’area del Montefeltro (linea bianca) e zone limitrofe.

Table 1.
Station data of the Montefeltro seismic network (MF).
The data acquisition of this mobile network would allow studying in detail the characteristics of the seismic patterns of Montefeltro [1,2], and improve the local 1D velocity model [3], with the aim to provide higher-quality hypocenter locations and, as consequence, delineation of the seismogenic structures in the area under study. Furthermore, the determination of the focal mechanisms of small-magnitude events would allow defining through their inversion the regional stress field [4], which is useful information for the study area framework from the seismotectonic point of view [5].
2. Data Description
The sites chosen for the seismic stations are public buildings that lie as far as possible from common sources of anthropogenic noise [6,7]. We placed all the equipment on a floor in contact with the ground, in the basement or on the ground level. At the same time, choosing to locate the stations inside buildings allows shelter from atmospheric agents.
The seismic stations consist of a digitizer, a three-component seismic sensor, a GPS receiver, a 12 V battery and an AC–DC converter connected to the electrical power mains. The different types of sensors and recorders for each station of the 1S temporary seismic network are listed in Table 2.

Table 2.
Instrumentation of MF stations. In the first part of the experiment, the MF01 station operated with a RefTek RT130 recorder, then, starting from October 2019, with a Sara SL06 recorder (MF01S).
The used seismic sensors are three-component seismometers with different periods: short band with the Sara SS20/0.5s (www.sara.pg.it, accessed on 4 October 2022), extended band with the Lennartz 3D/5s (www.lennartzelectronic.de, accessed on 4 October 2022) and broadband with the Guralp CMG at 20 s and 30 s (www.guralp.com, accessed on 4 October 2022). They were positioned on the ground, and the horizontal components were aligned towards N (indicated with an arrow on the sensor) and E; consequently the vertical components are positive upward. The sensors receive the signal of the seismic field and convert it into an electrical signal and send it to the recorder.
For this temporary network, we used two types of recorders, the RefTek RT130 (www.reftek.com, accessed on 4 October 2022) and the Sara SL06 (www.sara.pg.it, accessed on 4 October 2022). The acquisition mode was set in continuous with a sample rate of 100 sps, the preamplifier gain was set to 1, and the data format was compressed for storage. Each recorder was equipped with an external GPS providing the time for the synchronization of the internal clock and the geographic position reference; in detail, a Garmin GPS receiver for the Reftek 130 recorder and the GPS supplied for the Sara SL06 recorder.
Continuous data archiving was organized by dividing the recording into files in an hourly basis and they are downloaded on two compact flash (CF) cards, each with a capacity of 2 GB for the Reftek 130 recorder, and on USB solid state memories (pen drives) with a capacity of 2 GB–4 GB for the Sara recorder. With these configuration parameters, each station has collected an average of approximately 32 MB of raw data per day.
Figure 2 shows the images of the four station sites of the temporary network 1S; an example of equipment deployed within a site is shown in Figure 3.
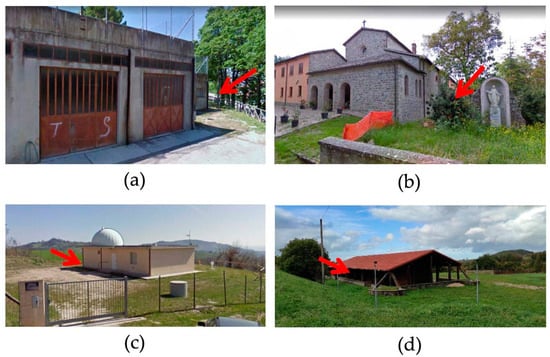
Figure 2.
MF01 (a), MF02 (b), MF03 (c) and MF04 (d) station sites. Red arrows indicate the station positions in the buildings.
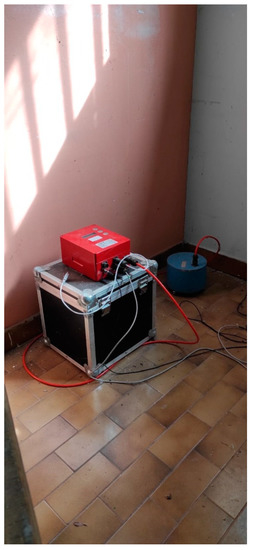
Figure 3.
MF01 station instrumentation installed from October 2019.
Raw data by the Reftek 130 recorder can be converted into seismic data formats of different types, SEG-Y [8], SAC (https://ds.iris.edu/files/sac-manual/sac_manual.pdf, accessed on 4 October 2022), mini-SEED [9] and others, while by the SARA SL06 recorder the raw data are converted only into miniSEED format. In this experiment we chose to set up the conversion in mini-SEED format for both recorders. The mini-SEED format contains digital time series data and some station information such as station and channel ID, sample rate and gain [10]. The miniSEED format contains digital time series data and some single station information such as station and channel ID, sample rate and gain [10]. Il formato miniSEED contiene dati di serie temporali digitali e alcune informazioni su una singola stazione come ID stazione e canale, frequenza di campionamento e guadagno [10]. To complete the information of a single station it is necessary to know the instrumental responses of the seismic sensor and of the datalogger, which is useful information for processing the data of the time series. To complete the information of a single station it is necessary to know the instrumental response of the seismic sensor and that of the data logger, useful information for processing the data of the time series. In the Zenodo repository, the data are organized using nesting folders into Year/Station/Year Julian-day (i.e., MF2018/MF01/2018333/). The Julian-day folder contains the seismograms of the events recorder in that day. Furthermore, we have deposited both the instrumental responses of each sensor and of each recorder.
3. Methods
Figure 4 and Figure 5 display the mini-SEED files for two events that occurred in the Montefeltro area recorded by two of the stations of the temporary network. The seismograms are plotted by a manual time window cut of 10–15 s from P-wave arrival time, to better point out the signal–noise ratio. The waveforms were created in the Passcal Quick Look version II (PQL II) program, also available at the download page of PASSCAL [11]. PQL is a program to view time series data in different formats (MSEED, SEGY, SAC), and allows us to zoom, filter and calculate fast Fourier spectra of seismic signals. It also allows for arrival time measurements (phase picking) and printing of the results to a user-defined file. The event shown in Figure 4 took place west of the Montefeltro area on 8 April 2020 at 9:11 p.m. with a magnitude ML = 2.8 and a depth of 48 km, and was recorded by the MF01 station about 20 km from the epicentral area.
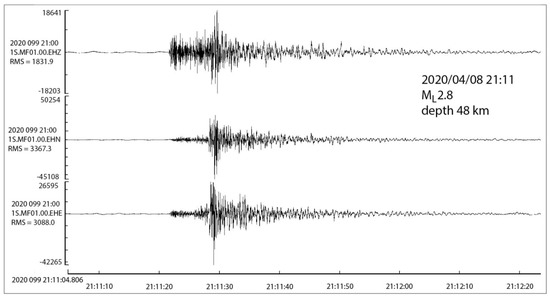
Figure 4.
Waveforms of PQL program showing the MF01 three-component recording of the event that occurred in the Municipality of Maiolo on 8 April 2020 (Julian day 99).
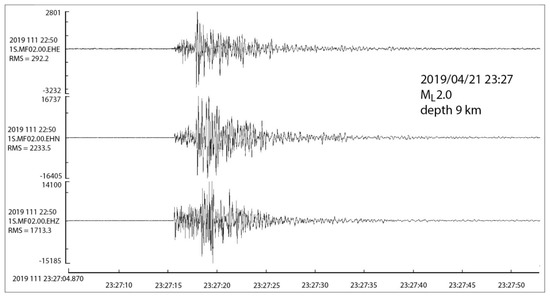
Figure 5.
Waveforms of PQL program showing the MF02 three-component recording for the event that occurred in the Municipality of Casteldelci on 21 April 2019 (Julian day 111).
Figure 5 shows the recording at the MF02 station of a shallow event that took place in the north of Montefeltro on 21 April 2019 at 11:27 p.m., with a magnitude ML = 2.0 and a depth of 9 km, whose epicenter distance was about 11 km. In this case, a low-pass filter with 2 poles and a cutoff frequency of 2.0 Hz has been applied as the original waveform contained high-frequency signals.
Author Contributions
Conceptualization: A.M. (Antonella Megna) and S.S.; data curation: A.M. (Antonella Megna), G.B.C., A.M. (Alessandro Marchetti) and N.M.P.; funding acquisition: S.S.; project administration: S.S.; resources: A.M. (Antonella Megna), A.M. (Alessandro Marchetti) and N.M.P.; supervision: A.M. (Antonella Megna), A.M. (Alessandro Marchetti) an S.S.; validation: A.M. (Antonella Megna) and A.M. (Alessandro Marchetti); writing—original draft: A.M. (Antonella Megna), A.M. (Alessandro Marchetti) and S.S.; writing—review and editing: A.M. (Antonella Megna) and S.S. All authors have read and agreed to the published version of the manuscript.
Funding
This research received no external funding.
Institutional Review Board Statement
Not applicable.
Informed Consent Statement
Not applicable.
Data Availability Statement
Data are available at the Zenodo repository: https://doi.org/10.5281/zenodo.7064384, accessed on 16 September 2022.
Acknowledgments
The authors are grateful to the editor for the support and to two anonymous reviewers for helpful and constructive comments.
Conflicts of Interest
The authors declare no conflict of interest.
References
- Megna, A.; Cimini, G.B.; Marchetti, A.; Santini, S. La sismicità del Montefeltro (Appennino settentrionale, Italia centrale) nel periodo 2005–2017. Quad. Geofis. 2019, 157, 1–26. [Google Scholar] [CrossRef]
- Megna, A.; Cimini, G.B.; Marchetti, A.; Santini, S.; Pagliuca, N. Small magnitude earthquake sequences and seismic swarms in the Northern Apennines (central Italy): New observations from the analysis of Montefeltro seismicity. In Proceedings of the AGU 2019 Fall Meeting, San Francisco, CA, USA, 9–13 December 2019. [Google Scholar] [CrossRef]
- Santini, S.; Saggese, F.; Megna, A.; Mazzoli, S. A note on central-northern Marche seismicity: New focal mechanisms for events recorded in years 2003–2009. Boll. Geofis. Teor. E Appl. 2011, 52, 639–649. [Google Scholar] [CrossRef]
- Macchiavelli, C.; Mazzoli, S.; Megna, A.; Saggese, F.; Santini, S.; Vitale, S. A note on central-northern Marche seismicity: New focal mechanisms for events recorded in years 2003–2009. Tectonophysics 2012, 580, 124–149. [Google Scholar] [CrossRef]
- Cimini, G.B.; Marchetti, A. Deep structure of peninsular Italy from seismic tomography and subcrustal seismicity. Ann. Geophys. 2006, 49 (Suppl. 1), 331–345. [Google Scholar]
- Trnkoczy, A.; Bormann, P.; Hanka, W.; Holcomb, L.G.; Nigbor, R.L.; Shinohara, M.; Suyehiro, K.; Shiobara, H. Site selection, preparation and installation of seismic stations. In New Manual of Seismological Observatory Practice (NMSOP-2); Bormann, P., Ed.; IASPEI, GFZ German Research Centre for Geosciences: Potsdam, Germany, 2012; pp. 1–139. [Google Scholar] [CrossRef]
- McNamara, D.E.; Boaz, R.I. Seismic Noise Analysis System Using Power Spectral Density Probability Density Functions: A Stand-Alone Software Package; USGS Open-File Report; USGS: Reston, VA, USA, 2005; p. 1438. Available online: https://pubs.usgs.gov/of/2005/1438/pdf/OFR-1438.pdf (accessed on 4 October 2022).
- Barry, K.M.; Cavers, D.A.; Kneale, C.W. Recommended standards for digital tape formats. Geophysics 1975, 40, 344–352. [Google Scholar] [CrossRef]
- Ahern, T.; Casey, R.; Barnes, D.; Benson, R.; Knight, T.; Trabant, C. SEED Reference Manual; Version 2.4; Incorporated Research Institutions for Seismology: Washington, DC, USA, 2009; Available online: http://www.fdsn.org/pdf/SEEDManual_V2.4.pdf (accessed on 4 October 2022).
- Ringler, A.T.; Evans, J.R. A quick SEED Tutorial, Seismol. Res. Lett. 2015, 86, 1717–1725. [Google Scholar] [CrossRef][Green Version]
- PASSCAL: Portable Array Seismic Studies of the Continental Lithosphere, Software Downloads: Passcal Quick Look Software (PQL). Available online: https://www.passcal.nmt.edu/content/pql-ii-program-viewing-data (accessed on 19 September 2022).
Publisher’s Note: MDPI stays neutral with regard to jurisdictional claims in published maps and institutional affiliations. |
© 2022 by the authors. Licensee MDPI, Basel, Switzerland. This article is an open access article distributed under the terms and conditions of the Creative Commons Attribution (CC BY) license (https://creativecommons.org/licenses/by/4.0/).