Emissions from Swine Manure Treated with Current Products for Mitigation of Odors and Reduction of NH3, H2S, VOC, and GHG Emissions

 ,
,  , , , ,
  and
and
Abstract
1. Summary
2. Data Description
2.1. Manure Properties
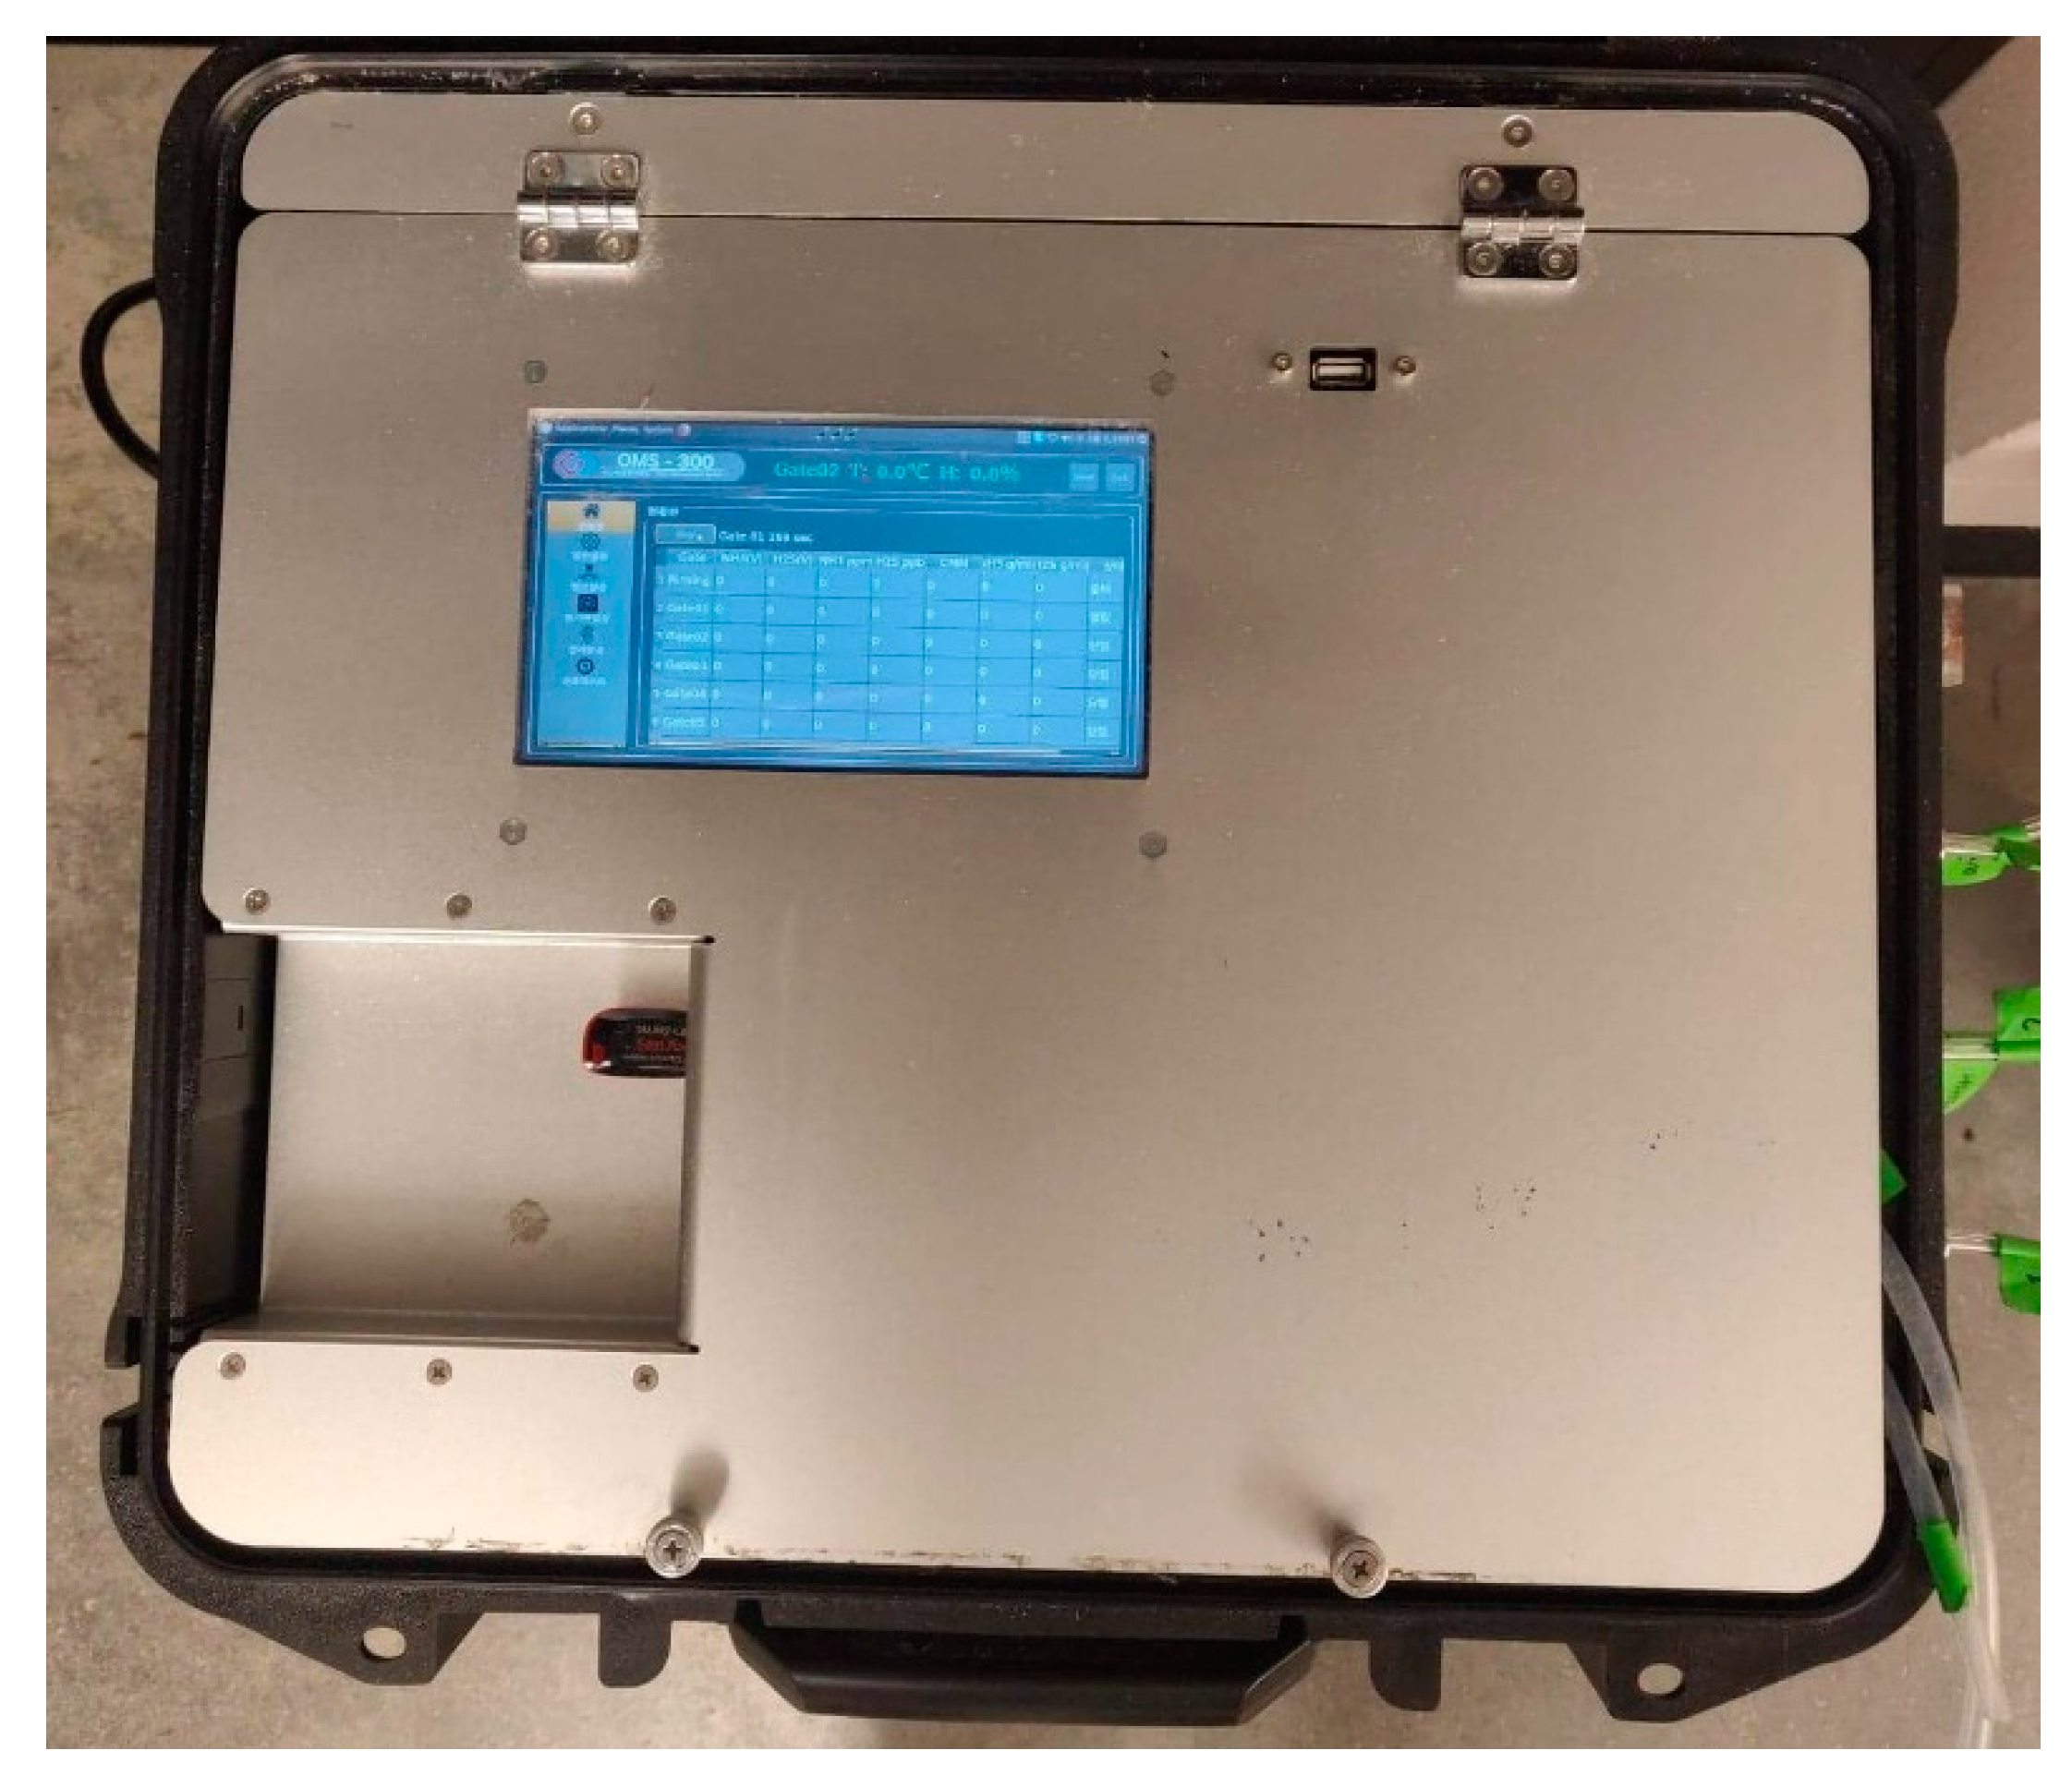
2.2. NH3 and H2S
2.3. GHG
2.4. Odor
2.5. VOCs
3. Methods
3.1. Odor
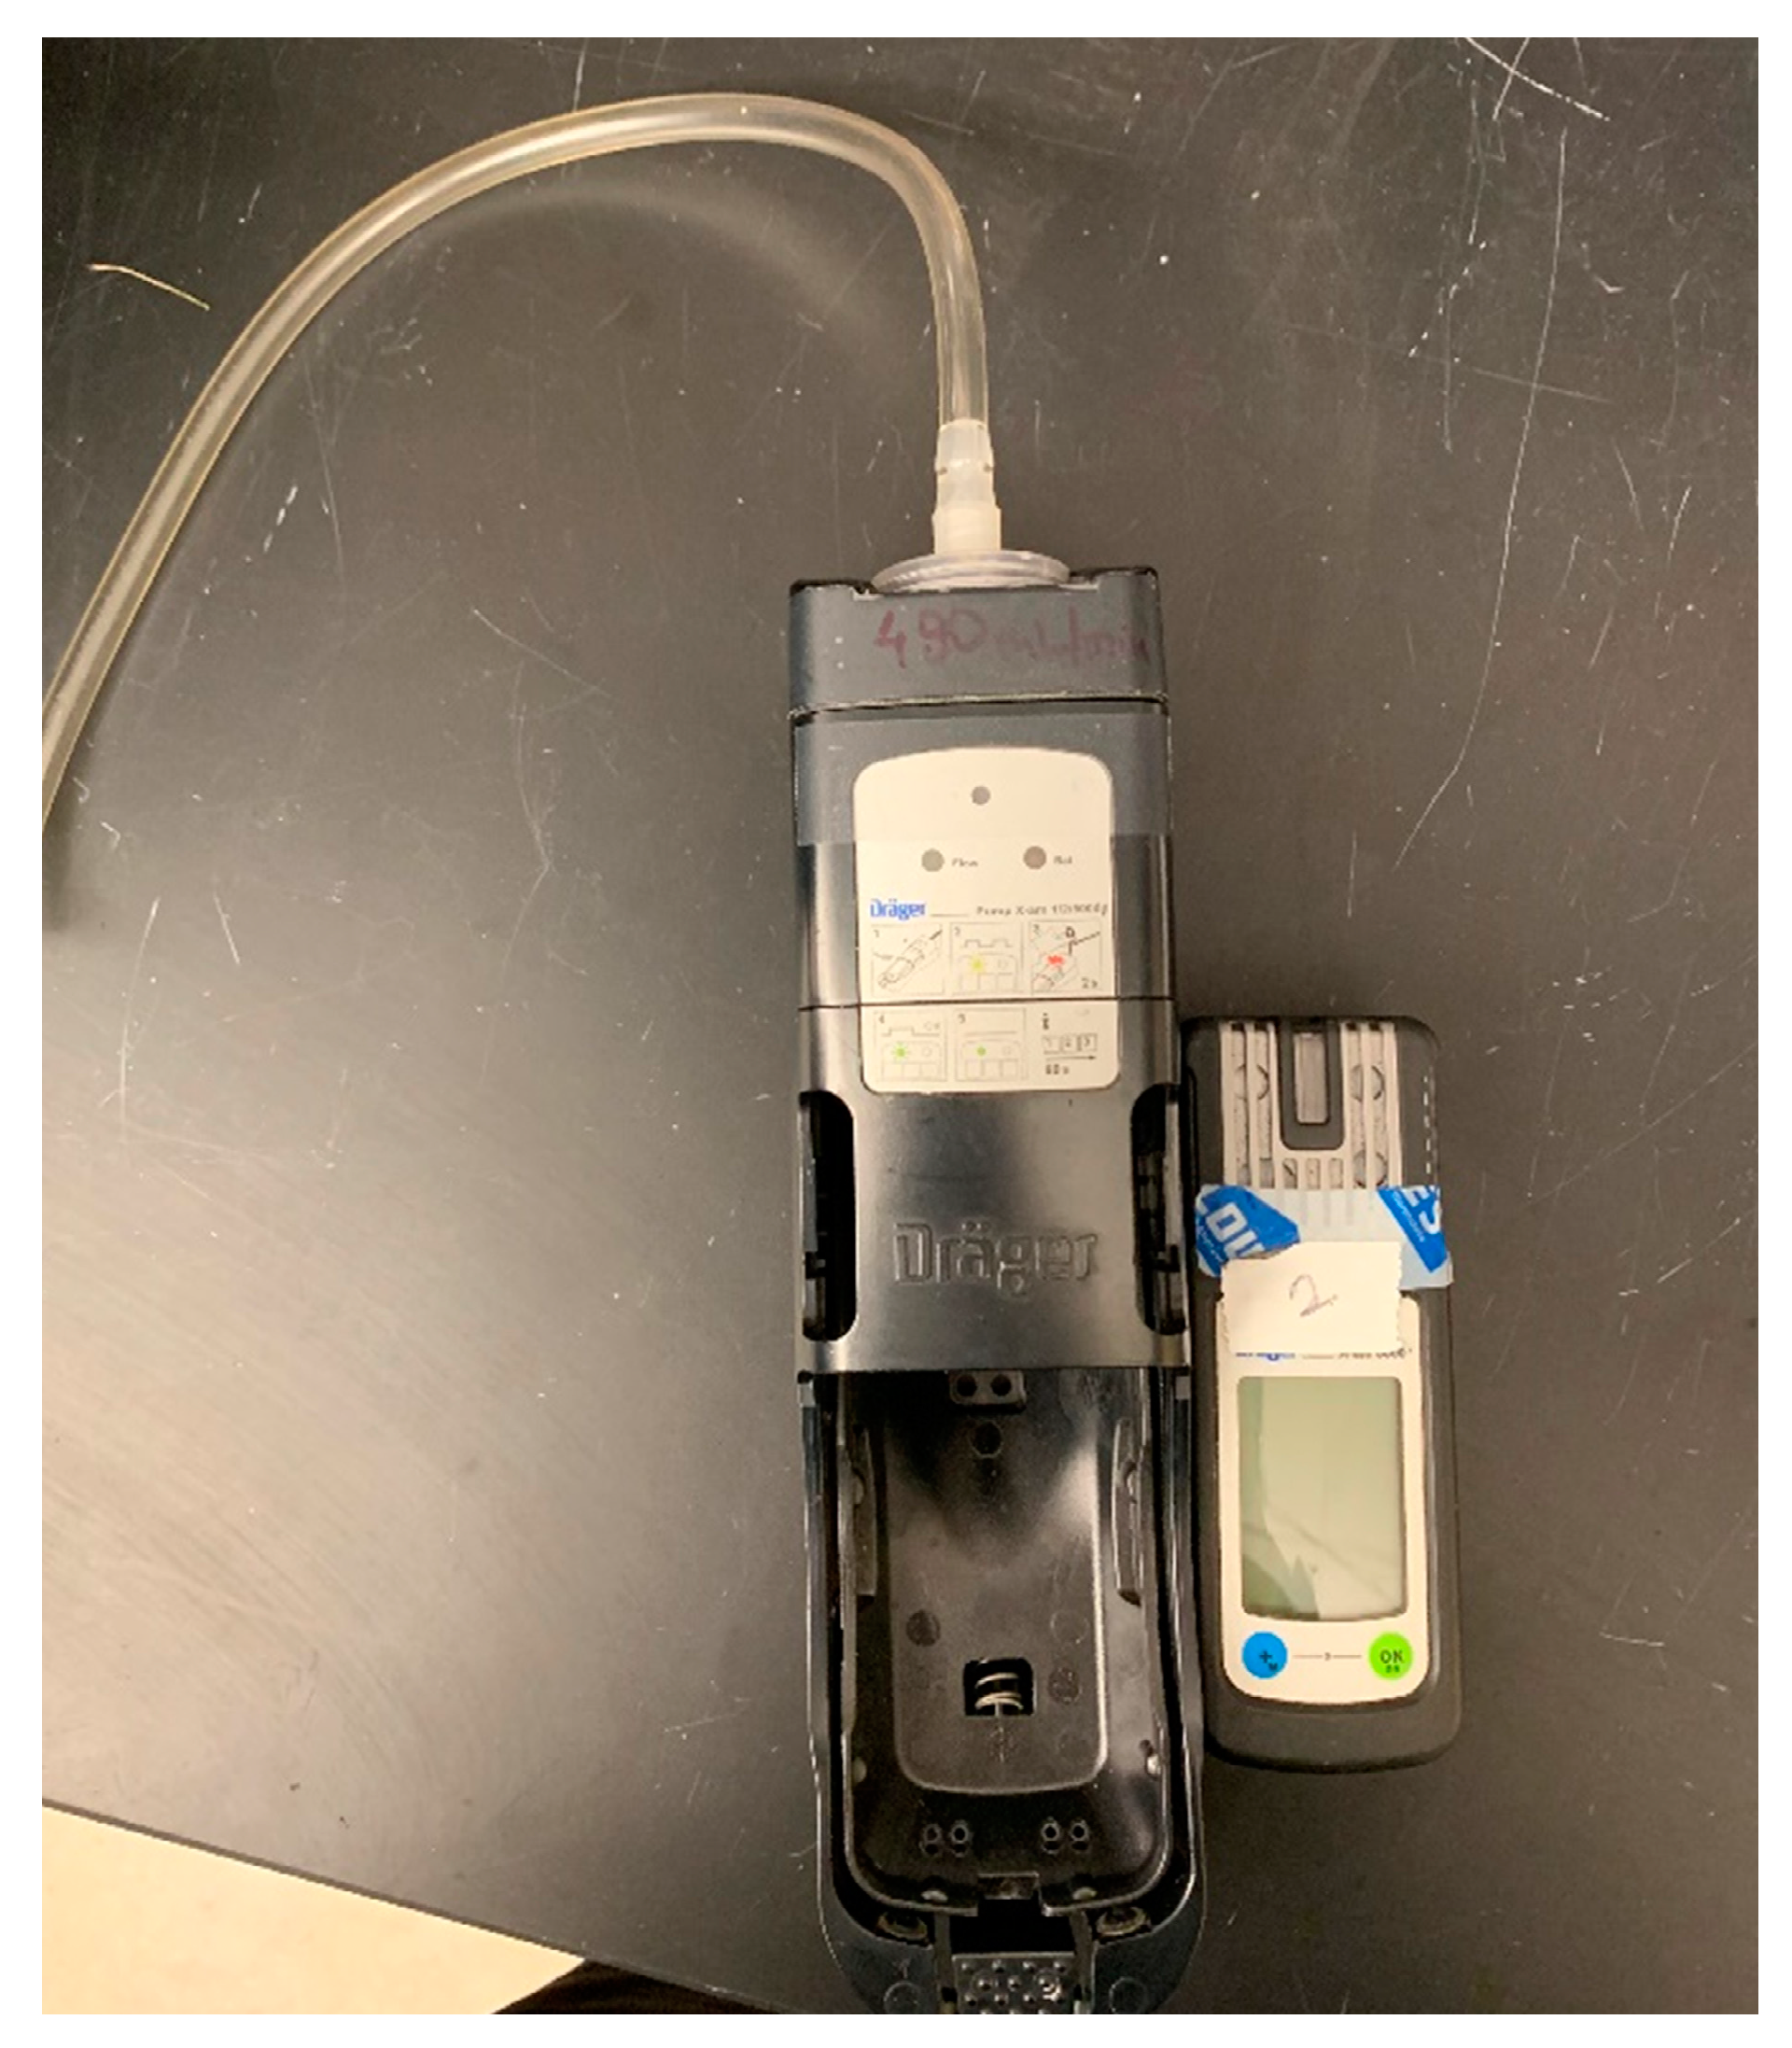
3.2. NH3 and H2S
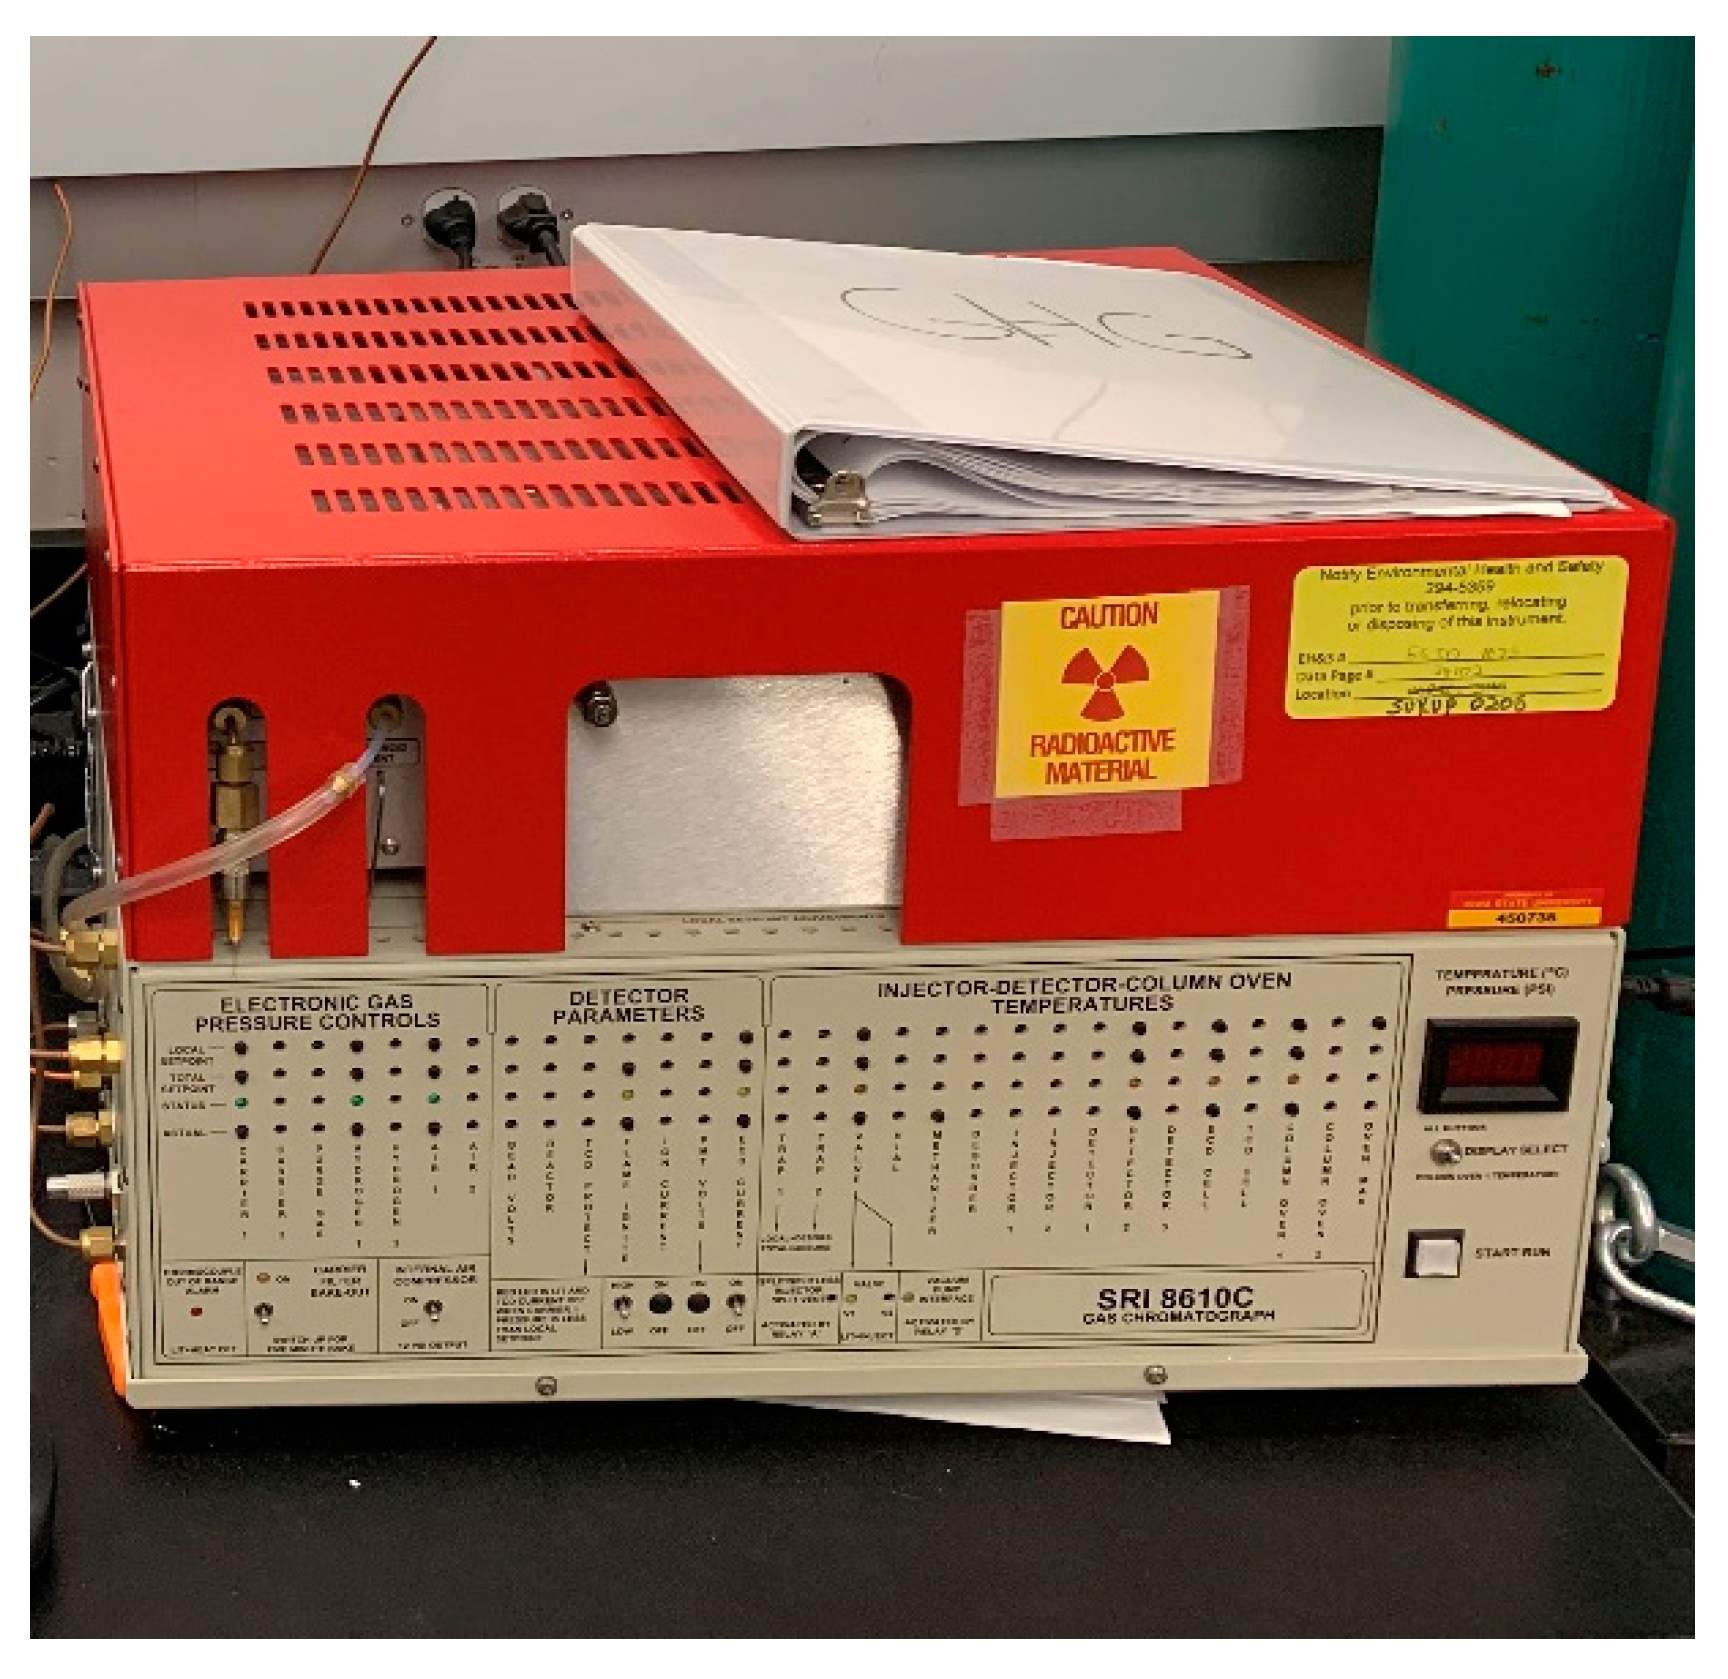
3.3. GHG
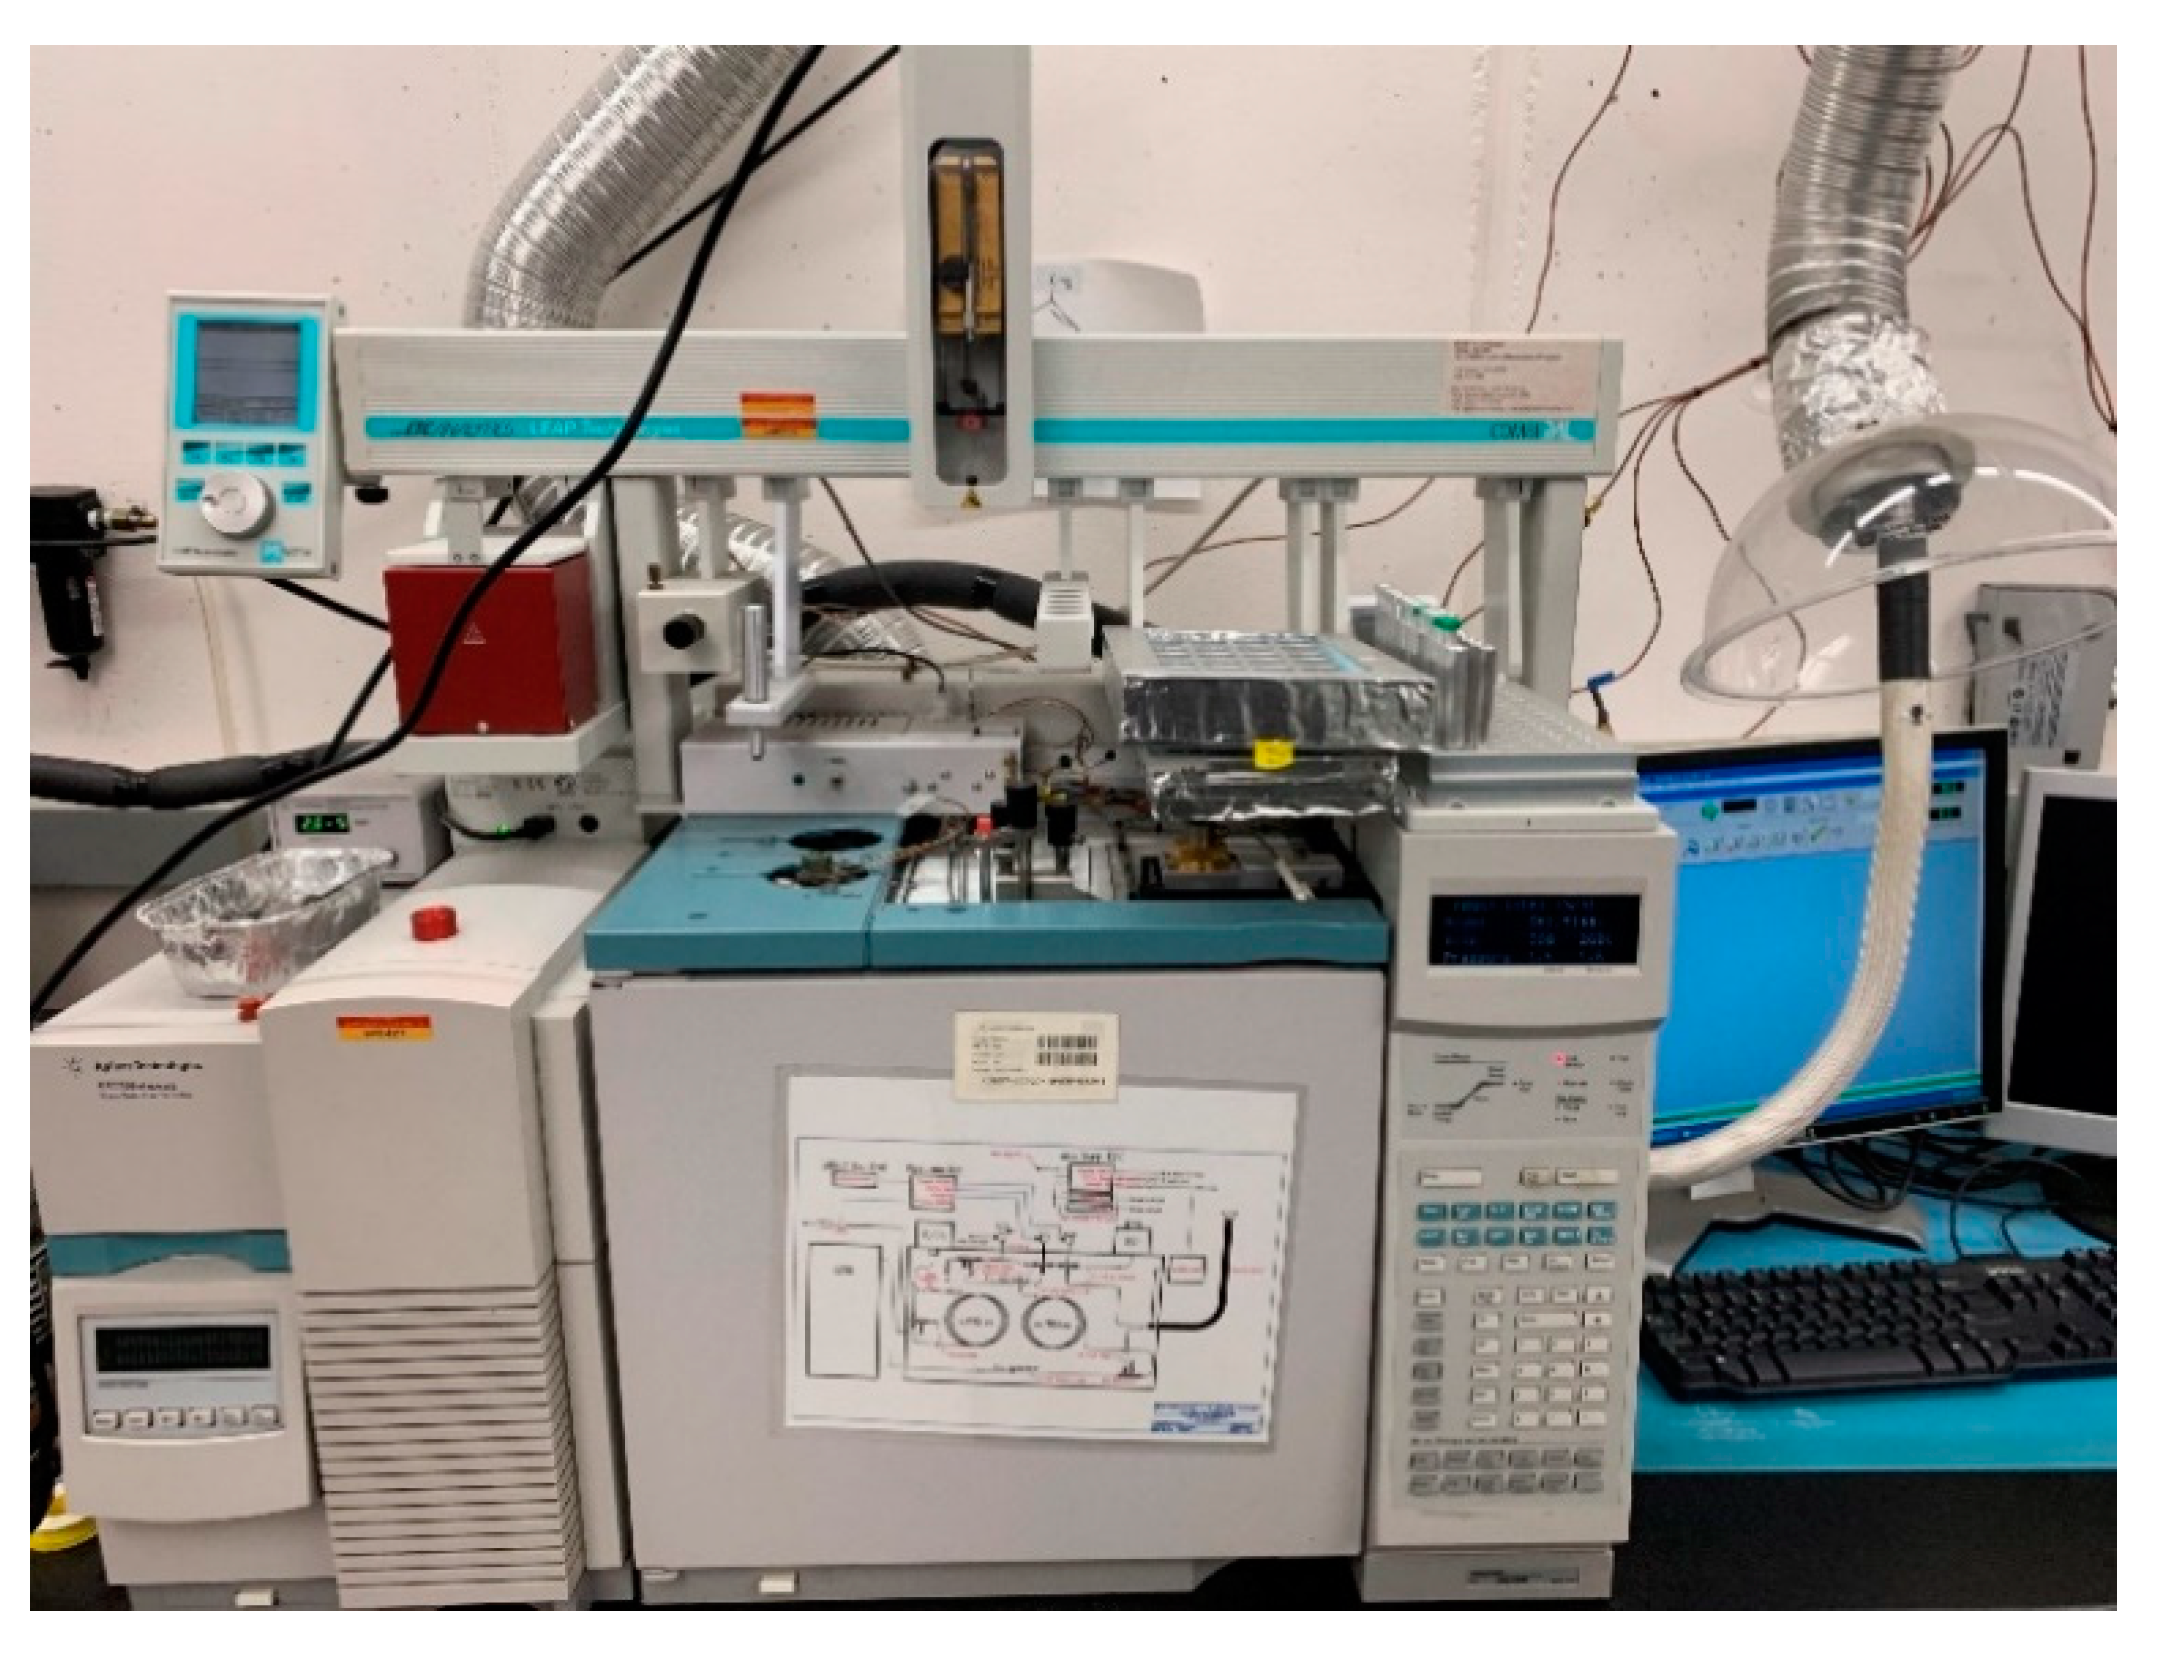
3.4. VOCs
3.5. Manure Properties
4. User Notes
| Excel Sheets | Content |
| Information | The code name of manure source, abbreviations of manure product, and parameters of the manure simulator. |
| Manure Properties | Manure properties have four sets of tables for four trials of experiments with percent total solids (TS), percent volatile solids (VS), total nitrogen content (TKN), the nitrogen content of ammonium (NH4-N), and total phosphorous (TP). |
| NH3 & H2S | This spreadsheet has the measured concentrations and fluxes of ammonia and hydrogen sulfide for each manure source and manure additive. |
| GHG | This spreadsheet summarizes measured concentrations and fluxes for carbon dioxide (CO2), methane (CH4), and nitrous oxide (N2O). |
| Odor | This spreadsheet summarizes the odor concentration measurement using a dilution olfactometer. |
| VOCs | The spreadsheet contains the information of volatile organic compounds (VOCs), i.e., compound names, selected ion used to identify the compound, CAS number, GC column retention time, and peak area counts. |
Supplementary Materials
Author Contributions
Funding
Acknowledgments
Conflicts of Interest
Appendix A


| Name of Product | Company | Claims | Types of Additive | Recommended Application Rate |
|---|---|---|---|---|
| Triune | Agrotech | Reduce odor, solids | Large, negatively charged molecules | 1 L per 30 tons of manure |
| Manure Master Plus | ProfitProAG | Enhance manure digestion and liquefaction, reduce barn and field odors, reduce top crusting and bottom solids | Bacteria | 40 gallons (151.4 L) for a million gallon (3.78 million L) of manure, each month adding additional 2.5 gallons (9.46 L) of the product |
| Confine N | AgXplore | Decrease odor and ammonia emissions, reduce biosolids, reduce foaming. | Chemical | First treatment application is five gallons (18.9 L) of Confine N concentrate per 250,000 gallons (946,353 L) of manure. Then, add 2.5 gallons (9.46 L) of Confine N concentrate per 250,000 gallons (946,353 L) of manure monthly |
| Sulfi-doxx Dry | Direct Biologicals | Removes organic and inorganic compounds | High surface area activated carbon | 25 lbs (11.3 kg) per 1000 finishers every six months |
| Waste Away | CXI | Control odor by converting anaerobic condition into aerobic condition* | Microorganisms | 8 ounces (227 g) of the product in 20 ounces (567 g) of lukewarm water (29.4~35 °C) of the initial treatment for each of the three manure storage simulators used for this product. Then, biweekly 4 ounces (113.4 g) in 20 ounces (567 g) of lukewarm water applied as a follow-up treatment |
| More Than Manure | VERDESIAN | Reduces farm odors | Polymer | 18 ounces (510 g) per acre (4047 m2) |
| Enviro Lagoon | Soutions4Earth | Heavier than water and acting where solids accumulated | Chemical | Once a week, nine gallons (34.1 L) per 1000 head swine for weeks 1 and 2, six gallons (22.7 L) per 1000 head for weeks 3 and 4, three gallons (11.3 L) per 1000 head for week 5+ |
| Oxydol | Agranco | Remediate landfills, wastewater treatment plants, and sewage | Bacteria, enzymes, and probiotics | 2 kg per 1000 pigs of the initial treatment, and then 1 kg per 1000 pigs per month |
| Sludge Away | Tomco Chemical | Removal of biological solids | Chemical | 10,000~20,000 gallons (37,854~75,708 L) of manure per three gallons (11.3 L) of the product as the initial treatment, followed by two quarts (1.89 L) for the next four weeks, and then three quarts (2.84 L) monthly |
| Penergetic g | Penergetic Solutions | Eliminates unpleasant ammonia and sulfur odors | Chemical | 3~4 lbs (1.36~1.81 kg) per (25,000 gallons) 94,635 L of manure as the initial treatment, then biweekly adding 1 lbs (0.45 kg) per 100,000 gallons (37,854 L) of manure |
| Manure Magic | Drylet | Turbo-charge the natural process of anaerobic digestion | Microbial cultures | 25 lbs (11.3 kg) per 1,000,000 gallons (3,785,411 L) of manure |
| LLMO-SST | General Environmental Science | Degrading waste and odorous compounds | Bacteria | 600 mL per 400 gallons (1514 L) of manure as the initial treatment and weekly adding 150 mL, per 400 gallons (1514 L) of manure |
References
- Schiffman, S.S. Livestock odors: Implications for human health and well-being. J. Anim. Sci. 1998, 76, 1343–1355. [Google Scholar] [CrossRef] [PubMed]
- Heber, A.J.; Stroik, M.; Faubion, J.M.; Willard, L.H. Size distribution and identification of aerial dust particles in swine finishing buildings. Trans. ASAE 1988, 31, 882–887. [Google Scholar] [CrossRef]
- Rahman, S.; Borhan, M.S. Typical odor mitigation technologies for swine production facilities: A review. J. Civil. Environ. Eng. 2012, 2. [Google Scholar] [CrossRef]
- Heber, A.J.; Ni, J.; Sutton, A.L.; Patterson, J.A.; Fakhoury, K.; Kelly, D.; Shao, P. Laboratory Testing of Commercial Manure Additives for Swine Odor Control; Final Report; USDA-ARS-National Swine Research and Information Center: Ames, IA, USA, 2001. [Google Scholar]
- Maurer, D.L.; Koziel, J.A.; Bruning, K.; Parker, D.B. Pilot-scale testing of renewable biocatalyst for swine manure treatment and mitigation of odorous VOCs, ammonia and hydrogen sulfide emissions. Atmos. Environ. 2017, 150, 313–321. [Google Scholar] [CrossRef]
- Da Silva Batista, A.P.; Van Weelden, M.; Andersen, D.S. Impact of temperature and mixing on methane production rates of swine manures obtained from deep pit storages. ASABE Paper 131619616. In Proceedings of the ASABE Annual International Meeting, Kansas City, MO, USA, 21–24 July 2013. [Google Scholar]
- Akdeniz, N.; Jacobson, L.D.; Hetchler, B.P.; Bereznicki, S.D.; Heber, A.J.; Koziel, J.A.; Cai, L.; Zhang, S.; Parker, D.B. Odor and odorous chemical emissions from animal buildings: Part 2. Odor emissions. Trans. ASABE 2012, 55, 2335–2345. [Google Scholar] [CrossRef]
- Maurer, D.L.; Koziel, J.A.; Bruning, K.; Parker, D.B. Farm-scale testing of soybean peroxidase and calcium peroxide for surficial swine manure treatment and mitigation of odorous VOCs, ammonia and hydrogen sulfide emissions. Atmos. Environ. 2017, 166, 467–478. [Google Scholar] [CrossRef]
- Lee, M.; Wi, J.; Koziel, J.A.; Ahn, H.; Li, P.; Chen, B.; Meiirkhanuly, Z.; Banik, C.; Jenks, W. Effects of UV-A Light Treatment on Ammonia, Hydrogen Sulfide, Greenhouse Gases, and Ozone in Simulated Poultry Barn Conditions. Atmosphere 2020, 11, 283. [Google Scholar] [CrossRef]
- Lo, Y.C.M.; Koziel, J.A.; Cai, L.; Hoff, S.J.; Jenks, W.S.; Xin, H. Simultaneous chemical and sensory characterization of volatile organic compounds and semi-volatile organic compounds emitted from swine manure using solid phase microextraction and multidimensional gas chromatography–mass spectrometry–olfactometry. J. Environ. Qual. 2008, 37, 521–534. [Google Scholar] [CrossRef]
- Spinhirne, J.P.; Koziel, J.A.; Chirase, N.K. Sampling and analysis of volatile organic compounds in bovine breath by solid-phase microextraction and gas chromatography–mass spectrometry. J. Chromatogr. A 2004, 1025, 63–69. [Google Scholar] [CrossRef]
- Spinhirne, J.P.; Koziel, J.A.; Chirase, N.K. A Device for Non-invasive On-site Sampling of Cattle Breath with Solid-Phase Microextraction. Biosyst. Eng. 2003, 8, 239–246. [Google Scholar] [CrossRef]
- Cai, L.; Koziel, J.; Lo, Y.; Hoff, S.J. Characterization of VOCs and odorants associated with swine barn particulate matter using SPME and gas chromatography–mass spectrometry-olfactometry. J. Chromatogr. A 2006, 1102, 60–72. [Google Scholar] [CrossRef]
- Cai, L.; Koziel, J.A.; Liang, Y.; Nguyen, A.T.; Xin, H. Evaluation of zeolite for control of odorants emissions from simulated poultry manure storage. J. Environ. Qual. 2007, 36, 184–193. [Google Scholar] [CrossRef]
- APHA; American Water Works Association; Water Environment Federation. Standard Methods for the Examination of Water and Wastewater; American Public Health Association: Washington, DC, USA, 1998. [Google Scholar]
- Chen, B. Evaluating the Effectiveness of Manure Ddditives on Mitigation of Gaseous Emissions from Deep Pit Swine Manure. Master’s Thesis, Iowa State University, Ames, IA, USA, 2019. Department of Agricultural and Biosystems Engineering. [Google Scholar]


| Trial 1 Manure after Eight Weeks | TS % | VS % | TKN mg∙L−1 | NH4-N mg∙L−1 | TP mg∙L−1 | ||
|---|---|---|---|---|---|---|---|
| Simulator # | Manure Sources | Treatment | |||||
| 1 | Deep pit 1 | Triune | 5.9 | 4.7 | 5500 | 4700 | 2376 |
| 2 | Outdoor | Confine | 3.6 | 3 | 3500 | 3200 | 1944 |
| 3 | Deep pit 2 | Confine | 7 | 5.7 | 4600 | 4000 | 3240 |
| 4 | Deep pit 2 | Triune | 6.9 | 5.6 | 4500 | 3800 | 3348 |
| 5 | Outdoor | MMP | 3.7 | 2.9 | 3100 | 2800 | 1620 |
| 6 | Deep pit 2 | MMP | 7 | 5.8 | 4600 | 3900 | 3024 |
| 7 | Deep pit 1 | Sulfi | 5.9 | 4.8 | 5400 | 4600 | 2592 |
| 8 | Deep pit 2 | Sulfi | 6.8 | 5.5 | 4800 | 4100 | 3456 |
| 9 | Deep pit 2 | Control | 6.9 | 5.7 | 4500 | 4000 | 2808 |
| 10 | Outdoor | Sulfi | 3.7 | 3 | 6100 | 5500 | 2160 |
| 11 | Deep pit 1 | Control | 5.7 | 4.6 | 5300 | 4500 | 2808 |
| 12 | Deep pit 1 | MMP | 5.6 | 4.6 | 5000 | 4300 | 2160 |
| 13 | Outdoor | Control | 3.8 | 3 | 3000 | 2700 | 1728 |
| 14 | Outdoor | Triune | 3.8 | 3 | 3400 | 3100 | 2160 |
| 15 | Deep pit 1 | Confine | 5.8 | 4.6 | 5200 | 4500 | 2592 |
| Simulator # | Trial | Treatment | Manure Sources | Time (day)* | H₂S (ppm) | NH₃ (ppm) | H₂S Flux (mg∙h−1∙m−2) | NH₃ Flux (mg∙h−1∙m−2) |
|---|---|---|---|---|---|---|---|---|
| 1 | 1 | Triune | Deep pit 1 | −6 | 0.00 | 55.28 | 0.00 | 111.76 |
| 2 | 1 | Confine | Outdoor storage | −6 | 0.50 | 41.48 | 0.91 | 75.80 |
| 3 | 1 | Confine | Deep pit 2 | −6 | 0.50 | 72.85 | 0.84 | 122.84 |
| 4 | 1 | Triune | Deep pit 2 | −6 | 0.00 | 69.51 | 0.00 | 136.74 |
| 5 | 1 | MMP | Outdoor storage | −6 | 0.60 | 54.84 | 1.08 | 98.50 |
| 6 | 1 | MMP | Deep pit 2 | −6 | 0.60 | 71.24 | 1.09 | 129.11 |
| 7 | 1 | Sulfdox | Deep pit 1 | −6 | 0.40 | 130.48 | 0.73 | 238.73 |
| 8 | 1 | Sulfdox | Deep pit 2 | −6 | 0.00 | 66.35 | 0.00 | 128.20 |
| 9 | 1 | Control | Deep pit 2 | −6 | 0.70 | 105.99 | 1.32 | 200.38 |
| 10 | 1 | Sulfdox | Outdoor storage | −6 | 0.60 | 17.47 | 1.11 | 32.40 |
| 11 | 1 | Control | Deep pit 1 | −6 | 0.50 | 96.39 | 0.88 | 170.47 |
| 12 | 1 | MMP | Deep pit 1 | −6 | 0.00 | 118.53 | 0.00 | 225.80 |
| 13 | 1 | Control | Outdoor storage | −6 | 0.60 | 44.85 | 1.13 | 84.68 |
| 14 | 1 | Triune | Outdoor storage | −6 | 0.00 | 50.54 | 0.00 | 98.63 |
| 15 | 1 | Confine | Deep pit 1 | −6 | 0.50 | 97.70 | 0.93 | 181.10 |
| Simulator # | Trial | Treatment | Manure Sources | Time (day) | CO₂ (ppm) | CH₄ (ppm) | N₂O (ppm) | CO₂ Flux (mg∙h−1∙m−²) | CH₄ (mg∙h−1∙m−²) | N₂O (mg∙h−1∙m−²) |
|---|---|---|---|---|---|---|---|---|---|---|
| 1 | 1 | Triune | Deep pit 1 | 2 | 799 | 42 | 0.226 | 3777 | 74 | 1.068 |
| 2 | 1 | Confine | Outdoor storage | 2 | 666 | 34 | 0.220 | 3148 | 60 | 1.040 |
| 3 | 1 | Confine | Deep pit 2 | 2 | 578 | 10 | 0.220 | 2732 | 18 | 1.040 |
| 4 | 1 | Triune | Deep pit 2 | 2 | 603 | 40 | 0.219 | 2851 | 70 | 1.035 |
| 5 | 1 | MMP | Outdoor storage | 2 | 518 | 30 | 0.205 | 2449 | 53 | 0.969 |
| 6 | 1 | MMP | Deep pit 2 | 2 | 438 | 16 | 0.216 | 2071 | 28 | 1.021 |
| 7 | 1 | Sulfdox | Deep pit 1 | 2 | 1223 | 94 | 0.207 | 5781 | 166 | 0.979 |
| 8 | 1 | Sulfdox | Deep pit 2 | 2 | 647 | 14 | 0.195 | 3058 | 25 | 0.922 |
| 9 | 1 | Control | Deep pit 2 | 2 | 561 | 15 | 0.242 | 2652 | 26 | 1.144 |
| 10 | 1 | Sulfdox | Outdoor storage | 2 | 450 | 47 | 0.190 | 2127 | 83 | 0.898 |
| 11 | 1 | Control | Deep pit 1 | 2 | 918 | 48 | 0.244 | 4340 | 85 | 1.154 |
| 12 | 1 | MMP | Deep pit 1 | 2 | 1047 | 68 | 0.207 | 4949 | 120 | 0.979 |
| 13 | 1 | Control | Outdoor storage | 2 | 433 | 30 | 0.225 | 2047 | 53 | 1.064 |
| 14 | 1 | Triune | Outdoor storage | 2 | 582 | 39 | 0.207 | 2751 | 69 | 0.979 |
| 15 | 1 | Confine | Deep pit 1 | 2 | 706 | 52 | 0.221 | 3337 | 92 | 1.045 |
| Simulator # | Trial | Treatment | Manure Source | Time (day) | Odor Concentration (OU∙m−3) |
|---|---|---|---|---|---|
| 1 | 1 | Triune | Deep pit 1 | 3 | 420 |
| 2 | 1 | Confine | Outdoor storage | 3 | 263 |
| 3 | 1 | Confine | Deep pit 2 | 3 | 960 |
| 4 | 1 | Triune | Deep pit 2 | 3 | 2262 |
| 5 | 1 | MMP | Outdoor storage | 3 | 479 |
| 6 | 1 | MMP | Deep pit 2 | 3 | 520 |
| 7 | 1 | Sulfdox | Deep pit 1 | 3 | 449 |
| 8 | 1 | Sulfdox | Deep pit 2 | 3 | 278 |
| 9 | 1 | Control | Deep pit 2 | 3 | 691 |
| 10 | 1 | Sulfdox | Outdoor storage | 3 | 2900 |
| 11 | 1 | Control | Deep pit 1 | 3 | 524 |
| 12 | 1 | MMP | Deep pit 1 | 3 | 1278 |
| 13 | 1 | Control | Outdoor storage | 3 | 3412 |
| 14 | 1 | Triune | Outdoor storage | 3 | 342 |
| 15 | 1 | Confine | Deep pit 1 | 3 | 797 |
| Simulator # | Trial | Treatment | Manure Source | Time (week)* | Compound Name | Ion Selected for Abundance | CAS # | GC Column Retention Time (min) | Peak Area Count (arbitrary units) |
|---|---|---|---|---|---|---|---|---|---|
| 1 | 1 | Triune | Deep pit 1 | −1 | Skatole | 130 | 83-34-1 | 29.16 | 1,289,970 |
| 2 | 1 | Confine | Outdoor storage | −1 | Skatole | 130 | 83-34-1 | 29.16 | 1,208,680 |
| 3 | 1 | Confine | Deep pit 2 | −1 | Skatole | 130 | 83-34-1 | 29.16 | 553,325 |
| 4 | 1 | Triune | Deep pit 2 | −1 | Skatole | 130 | 83-34-1 | 29.16 | 397,306 |
| 5 | 1 | MMP | Outdoor storage | −1 | Skatole | 130 | 83-34-1 | 29.16 | 1,482,050 |
| 6 | 1 | MMP | Deep pit 2 | −1 | Skatole | 130 | 83-34-1 | 29.16 | 578,592 |
| 7 | 1 | Sulfdox | Deep pit 1 | −1 | Skatole | 130 | 83-34-1 | 29.16 | 2,802,650 |
| 8 | 1 | Sulfdox | Deep pit 2 | −1 | Skatole | 130 | 83-34-1 | 29.16 | 747,174 |
| 9 | 1 | Control | Deep pit 2 | −1 | Skatole | 130 | 83-34-1 | 29.16 | 1,172,744 |
| 10 | 1 | Sulfdox | Outdoor storage | −1 | Skatole | 130 | 83-34-1 | 29.16 | 5,205,639 |
| 11 | 1 | Control | Deep pit 1 | −1 | Skatole | 130 | 83-34-1 | 29.16 | 704,348 |
| 12 | 1 | MMP | Deep pit 1 | −1 | Skatole | 130 | 83-34-1 | 29.16 | 1,529,776 |
| 13 | 1 | Control | Outdoor storage | −1 | Skatole | 130 | 83-34-1 | 29.16 | 364,090 |
| 14 | 1 | Triune | Outdoor storage | −1 | Skatole | 130 | 83-34-1 | 29.16 | 1,620,530 |
| 15 | 1 | Confine | Deep pit 1 | −1 | Skatole | 130 | 83-34-1 | 29.16 | 1,887,679 |
© 2020 by the authors. Licensee MDPI, Basel, Switzerland. This article is an open access article distributed under the terms and conditions of the Creative Commons Attribution (CC BY) license (http://creativecommons.org/licenses/by/4.0/).
Share and Cite
Chen, B.; Koziel, J.A.; Banik, C.; Ma, H.; Lee, M.; Wi, J.; Meiirkhanuly, Z.; Andersen, D.S.; Białowiec, A.; Parker, D.B. Emissions from Swine Manure Treated with Current Products for Mitigation of Odors and Reduction of NH3, H2S, VOC, and GHG Emissions. Data 2020, 5, 54. https://doi.org/10.3390/data5020054
Chen B, Koziel JA, Banik C, Ma H, Lee M, Wi J, Meiirkhanuly Z, Andersen DS, Białowiec A, Parker DB. Emissions from Swine Manure Treated with Current Products for Mitigation of Odors and Reduction of NH3, H2S, VOC, and GHG Emissions. Data. 2020; 5(2):54. https://doi.org/10.3390/data5020054
Chicago/Turabian StyleChen, Baitong, Jacek A. Koziel, Chumki Banik, Hantian Ma, Myeongseong Lee, Jisoo Wi, Zhanibek Meiirkhanuly, Daniel S. Andersen, Andrzej Białowiec, and David B. Parker. 2020. "Emissions from Swine Manure Treated with Current Products for Mitigation of Odors and Reduction of NH3, H2S, VOC, and GHG Emissions" Data 5, no. 2: 54. https://doi.org/10.3390/data5020054
APA StyleChen, B., Koziel, J. A., Banik, C., Ma, H., Lee, M., Wi, J., Meiirkhanuly, Z., Andersen, D. S., Białowiec, A., & Parker, D. B. (2020). Emissions from Swine Manure Treated with Current Products for Mitigation of Odors and Reduction of NH3, H2S, VOC, and GHG Emissions. Data, 5(2), 54. https://doi.org/10.3390/data5020054