Abstract
The amount of health expenditure at the household level is one of the most basic indicators of development in countries. In many countries, health expenditure increases relative to national income. If out-of-pocket health spending is higher than the income or too high, this indicates an economical alarm that causes a lower life standard, called catastrophic health expenditure. Catastrophic expenditure may be affected by many factors such as household type, property status, smoking and drinking alcohol habits, being active in sports, and having private health insurance. The study aims to investigate households with respect to catastrophic health expenditure by the clustering method. Clustering enables one to see the main similarity and difference between the groups. The results show that there are significant and interesting differences between the five groups. C4 households earn more but spend less money on health problems by the rate of 3.10% because people who do physical exercises regularly have fewer health problems. A household with a family with one adult, landlord and three people in total (mother or father and two children) in the cluster C5 earns much money and spends large amounts for health expenses than other clusters. C1 households with elementary families with three children, and who do not pay rent although they are not landlords have the highest catastrophic health expenditure. Households in C3 have a rate of 3.83% health expenditure rate on average, which is higher than other clusters. Households in the cluster C2 make the most catastrophic health expenditure.
1. Introduction
According to the World Health Organization (WHO), health is not only the absence of illness and disability in the individual’s body but also the human being in full, physical, spiritual and social sense [1]. Health services are carried out to ensure that individuals and society are healthy, long-lasting, and productive. When the statistics of the WHO are checked, it is seen that the estimation of current health expenditures including healthcare goods and services consumed in the World was 8.56% in 2000 while it was 10.02% in 2016 [2]. However, this ratio was expressed as 4.62% in 2000 and 4.31% in 2016 for Turkey [2].
The underlying reasons for the increase in health expenditures has been investigated in the relative literature. Yereli et al. [3] stated that technological developments in the health sector contributed to the increase of these expenditures. Additionally, Akar [4] stated that through technological developments, increasing health expenditures causes economics growth by affecting the life expectancy and quality of individuals. Sevinc et al. [5] expressed a different aspect by decomposing the health expenditures in Turkey. In the light of the findings, the correct use of resources is essential in the health sector. The increase in investment expenditures will contribute to economic growth by providing technological advancement in the health sector. Therefore, it is vital to examine the health expenditures in detail. The definition of catastrophic health expenditure is varied based on the certain amount of income level of households, such as 10% [6]. The World Health Organization states that approximately 44 million households are exposed to catastrophic financial expenditure each year when 40% of non-subsistence income is considered [7]. The threshold set for the definition of catastrophic health expenditure is central since it is a consideration for policy-making.
Puteh and Almualm [8] indicate that factors that affect households’ catastrophic health expenditures are the status of the households in urban or rural areas, their socio-demographic characteristics, the presence of any disease in households, the types of health institutions and types of providers. On the other hand, Yang et al. [9] found that catastrophic health expenditures have a high incidence among elderly households in China, and empty-nest households are at a higher risk for catastrophic health expenditures than non-empty-nest households. Moreover, Choi et al. [10] found that for South Korea by using panel data low-income families with members who had either lost a job or were already unemployed are more likely to incur catastrophic health expenditure than those with family members with a consistent job.
In this study, households are clustered in terms of socio-economic characteristics affecting health expenditures which are stated before in the literature, and both health and catastrophic health expenditures are examined through these clusters. At the end of the study, the following findings are obtained: A household with an elementary family with two children having their own house may spend less if they do regular exercises and do not smoke. On the other hand, a single mother/father with two children having their own house earns more money and spends more on health expenses than other clusters. Also, it is found that the number of children, smoking, drinking, and sports habit and property status are not statistically distinguishing factors on catastrophic healthcare expenditures. However, healthy habits such as regularly doing exercises, not drinking alcohol and smoking may decrease catastrophic healthcare expenditures. With the different clustering method approach, this study will contribute to the literature of catastrophic health expenditures.
2. Related Works
There are many studies on catastrophic health spending in the literature. One of them is an excellent example of the study because it covers many countries [11]. They used the data from household surveys of 59 countries on regression analysis. Catastrophic expenditure is defined as if the household health expenditure exceeds 40% of income. They state that catastrophic expenditure is not decreasing, even though policymakers have been considering catastrophic financial payments to protect people from high payments on healthcare. Besides, they find that health expenses widely varied between countries from lower than 0.01% for the Czech Republic and Slovakia to 10.5% in Vietnam. The developed countries such as Portugal, Greece, Switzerland, and the USA have more than 0.5% of households facing catastrophic health spending. For Namibia and Djibouti, the lower limit is found as less than 0.5%. The countries in transition, such as Azerbaijan, Ukraine, Vietnam, and Cambodia have high rates of catastrophic spending. Finally, they suggest implementing risk protection policies in developing countries rather than increasing the availability of health services. Xu et al. [12], in another study, investigate the catastrophic health expenditures considering several independent variables such as income group and population characteristics of countries, the rate of the population under age five, and the rate of the people above age 60 from 116 household surveys for the 1990–2003 period. They noticed that the Gini coefficient in household expenditure is highly correlated with financial catastrophe health expenditures in all income groups. Moreover, young and aging populations generally need more health services than others. Finally, they suggest that some conditions are required to reach social health insurance for countries such as economic growth, the structure of the economy, the geographical distribution of the population, the availability of administrative skills to run an insurance scheme or tax-based system, and social preferences for solidarity.
Apart from these studies, there are also examples of developing and low-income country studies. For instance, Su et al. [13] examined the catastrophic household expenditure and determinants of it for Nouna as a low-income district of Burkina Faso by using the data of 800 households for the 2000–2001 period with multivariate logistic regression method. They found that 6%–15% of total households in Nouna District have catastrophic health expenditure. The economic status of households and the presence of a member with chronic illness have a notable impact on catastrophic health expenditures. They suggest that different cut-off points should be used for catastrophic health comparisons. Similarly, Ekman [14] investigated the role of health insurance in the determinants of catastrophic health expenditures in Zambia as an example of a low-income country by using data of household level data for the year 1998. According to the results of multiple regression, health insurance does not provide financial protection to the risk of catastrophic expenditures; contrarily, insurance increases this risk. He suggests that quality assurance and service provision oversight of insurances should be considered.
When examining the literature for similar health systems in developing countries such as Turkey, the following work stands out. Jakovljevic et al. [15] analyzed the governmental, private and out-of-pocket health expenditures, which are based on WHO sources, in BRICS countries (Brazil, Russia, India, China and South Africa). They find that the per capita spending in Russia was the highest in 2013, while India’s health expenditure does not catch its economic growth. They foresee that Russia and China will have higher per capita healthcare spending in 2025. Additionally, Reshetnikov et al. [16] analyzed the financing of Russian health care over the past 100 years and indicate that after 2005 there was an increase in budget allocations, spending on healthcare reach 3.7% of GDP while there was no certain positive trend. Jakovljevic et al. [17] also tried to identify the bottleneck inefficiencies in non-communicable diseases attributable spending and propose sustainable health financing solutions. They indicate that catastrophic household health expenditure from out of pocket spending on non-communicable diseases could plunge almost 150 million people into poverty worldwide.
In some studies, health expenditures are examined in terms of expenditure groups and a significant difference between groups is observed. Fazaeli et al. [18] stated the awareness of some problems with finance healthcare expenditures of households through the increase in health care expenditures. They aimed to find the determinants of essential factors of catastrophic health expenditures in Iran by using the Bayesian logit model for the year 2010. Households who live rurally, households which have an elderly, illiterate or unemployed member, and households with a larger family size face with higher catastrophic health expenditures than the others. Variables of having health insurance, sex and marital status have little impact on catastrophic health expenditures. They indicated that the implemented policies have no meaningful effect on improving justice in financing in health systems. However, 2.1% of households have catastrophic health expenditures. Likewise, there is the following work for Iran. Kavosi et al. [19] investigated the change in household catastrophic health care expenditures and inequality in south-west Tehran by using the data of the World Health Survey in 2003 and 2008. They found that the rate of household catastrophic health expenditures had no significant change from 2003 to 2008 (12.6% in 2003 while 11.8% in 2008). Additionally, healthcare utilization and healthcare insurance status were found the critical determinants for both years. Finally, it is found that socio-economic status is the most significant contributor to inequality on catastrophic health care expenditures, whereas unequal utilization of dentistry and outpatient services had reduced the inequality in catastrophic healthcare expenditures among socio-economic groups defined according to expenditure groups.
Another study [20] is based on survey data conducted in five municipalities of Kathmandu Valley in Nepal between November 2011 and January 2012. They examined the out-of-pocket health expenditures on health which is over 10% of the household’s total spending. They assessed the distribution of it by using by the total expense of families using the concentration index. They found that the presence of illness in the household is the primary determinant by using Poisson regression.
As an example of a developed country study, Wyszewianski [21] indicated the distinctive households with catastrophic health expenditures by using the data from 1977 National Medical Care Expenditure Survey of USA according to 5, 10, and 20 percent of the family’s income. It was found that the presence of unemployed household head and someone 65 or older cause more catastrophic health expenditures according to descriptive statistics.
It is seen that there are also some studies on catastrophic health expenditure for Turkey. For instance, Yardim et al. [22] described the level of catastrophic health expenditure and its determinants in Turkey by using household budget survey of 2006. They found that the rate of households with catastrophic health expenditure was around 0.6% by using 40% or more of their monthly expenditures as a cut of point. By using the logistic model and Lorenz curve, they noticed that the probability of having catastrophic health expenditure increased as per capita expenditure increased. Furthermore, living in a rural area, having health insurance and the presence of an elderly or disabled person in the household increased risk of catastrophe. They suggested that the Turkish government should develop social health insurance, tax-based financing of health care mechanisms and to reduce the medical costs for poor groups.
For Turkey, Basar et al. [23] investigated the presence of catastrophic health expenditures and the factors which are associated with it by using the Turkish Household Budget Surveys from 2002 to 2008. They find that poor households are less likely to seek health care as compared to non-poor households. Yardim et al. [24] examined the effect of universal financial coverage as a part of the Health Transformation Programme, which was applied after 2008, on catastrophic health expenditures by using the data of 2003, 2006 and 2009 in Turkey. According to logistic and Ordinary Least Squares (OLS) regression results, there was a decreasing trend in catastrophic health expenditure of households in Turkey. They interpreted these effects as a positive impact of the Health Transformation Programme. Brown et al. [25] examined the presence of catastrophic out-of-pocket health expenditures in Turkey and found the crucial factors which had an impact on it by using the Turkish Household Budget Surveys for the 2003–2008 period. According to the different cut-off point of expenditure, they indicated that between 16% and 18% of households spent more than 2.5% of their income on healthcare, and between 1% and 2% of households spent more than 20% of their total expenditure for the 2003–2008 period. They considered 12 independent variables in the study. They found that low-income families had a lower probability of facing catastrophic health expenditure than non-poor households. Furthermore, having a disabled, ill or an elderly person and preschool child in the household had a significant effect on having high catastrophic health expenditure. Furthermore, living in an urban and having insurance coverage were found as protective factors against the risk. Finally, they showed that there was a significant adverse effect of household size on catastrophic health expenditure. Narci et al. [26] indicated the factors of catastrophic health expenditures and examined the poverty impact of out-of-pocket payments by using household budget survey from 2004 to 2010 in Turkey. They found that the rate of households who had catastrophic health expenditure increased from 2004 to 2010. Moreover, the presence of a 5-year-old child, disabled members, and health insurance were found as statistically significant factors of catastrophic health expenditures.
3. Methodology
The k-mode clustering method is another version of the k-means algorithm. The k-mode works on categorical data instead of numeric data like in the k-means. Huang [27] first developed the k-modes algorithm by making some changes in distance calculation, cluster center description and iterative algorithm process to the k-means algorithm [28,29].
Let be a set of data points. is represented as . If for , equas to . However, the equality of and does not indicate that they are the same data points in the real-world. It only means that they have equal similarities in attributes . K-modes algorithm minimizes the following objective function.
where U is the membership matrix, V is the cluster centers, and X is the data set to be clustered. is a binary variable that shows the membership value of the data point belonging to cluster k. d, which is calculated by Jaccard coefficient shown in Equation (2) is the distance function that describes the similarity measure an object and a cluster center .
The k-modes algorithm satisfies the following constraints.
The basic k-modes algorithm follows four steps:
Step 1: Random selection of k different data points as the initial cluster centers.
Step 2: Distance calculation between each data point and the cluster center.
Step 3: Assignment of data points. In this step, data points are assigned to the cluster whose center has the highest similarity to the object. Step 2 is repeated until all data points are assigned to one cluster.
Step 4: Selection of a new cluster center by calculating the mode average for each cluster. Then, the previous and current cluster modes are compared. If they are different, the algorithm returns to Step 2; otherwise, it stops.
4. Case Study
In the study, the household budget survey of Turkstat for the year 2017 was used. In addition to demographic characteristics of households and individuals, in this data monthly consumption expenditures by goods groups were also presented based on the survey month. After cleaning missing observations which had any consumption information, we obtained the data of 1021 households. In the clustering method k-modes that we used in the study works with mode average, balancing data was a critical step. Some dimensions for the variables in the dataset had eight or nine times greater than others. In that case, the algorithm selected mainly the high-frequency dimension.
Table 1 presents the variables and basic statistics for the analysis of k-mode clustering. We use the household type (hhtype) coded as follows: One: Elementary household with one child, 2: Elementary household with two children, 3: Elementary household with three and more children, 4: Elementary household with a childless couple, 5: Elementary household with a patriarchal or extended family, 6: Elementary household with one adult, and 7: Elementary household with students, workers, etc. living together; the property status of the household (property) was coded as follows: One: Landlord, 2: Tenant, 3: Public housing, 4: Not a landlord but does not pay rent; the size of households (hhsize) is not shown in the Table 1 and changes from 1 to 20 in the dataset; having any household member with smoking, cigar or tobacco habits (coded as yes/no); having any household member with drinking alcohol habit or not (coded as yes/no); being any household member as active (paid) in sports, entertainment, culture etc. (coded as yes/no); and having private health insurance of any household member or not.

Table 1.
Descriptive statistics of variables used in K-mode.
When the descriptive statistics are checked in Table 1, it is seen that there are relatively high frequencies of elementary households with one child and elementary households with two children. According to property status, landlords and tenants are dominants. In addition, the number of households with a habit of smoking is higher than the number of households with an alcohol habit. However, the number of households engaged in sports is not enough high. Having Private Health Insurance is also not high enough within households. 75.81% of the households do not do regular sports. Although ’insurance’ factor has a Yes value 389 times in the selected dataset, none of the cluster modes includes Yes value for ’insurance’, which shows that the value does not have a meaningful effect on clustering.
We ran the developed algorithm 20 times to decide the better cluster modes. Finally, we found cluster centers (modes) and the number of elements in each cluster like shown in Table 1. The cluster centers refer to variables hhtype, property, hhsize, smoking, alcohol, sport, and insurance, respectively. According to clustering results in Table 2, C1 cluster mode includes 3 (elementary family with three and more children), 4 (not a landlord but does not pay rent), 5 (size of households), 1 (smoking = yes), 1 (drink = yes), 2 (paid sport = no), and 2 (private health insurance = no). 206 households have a higher similarity to cluster C1 than other clusters.
Table 2.
Clustering results.
5. Results and Discussion
Figure 1 shows the clustered household details. The y-axis on expenditure figures indicates the spent amount in Turkish Liras (TL). Rates are calculated by dividing catastrophic health expenditures to total expenses in the month. All households’ average spends on health expenditure is 3%–4% of the total expenditure. C4, however, has the highest variability in health expenses since one of the households in C4 has almost no health expenses while one of them exceeds their income. The reason behind this might be that a severe medical operation a member of the household had that caused an increase in the catastrophic health expenditure. The fluctuation in C1 is less than others. They spend for health problems less than 3% on average and 40% at maximum. Households participating in the questionnaire have an average expense between 5000 TL and 6200 TL. Because some people, especially low-income households, do not want to share their incomes, so the health expense rates may not reflect the actual situation. Clustering of correctly given answers according to the seven attributes enables us to consider similar households. Thus, the average number of clusters eliminates the effects of the intentionally given wrong answer.
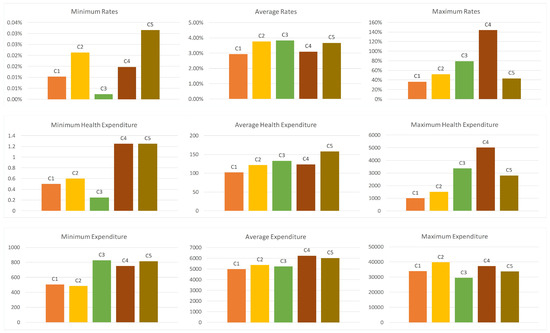
Figure 1.
Health expenditure details in clusters.
C3 households have health expenditure rate of 3.83% on average, which is higher than other clusters. The reason for the higher expenses may depends on the factors hhtype, property and hhsize because C3 cluster mode differ from other clusters with respect to these three factors. Since the elementary family with one child includes three people, hhtype and hhsize support each other. A household with an elementary family with one child, a tenant and a 3-person household (mother, father and one child) spends the highest money but not very much than others. For example, the rates in C2 and C5 are 3.77% and 3.68%, respectively.
Although cluster C5 is the third with respect to the average health expenditure rate, it has the highest expenditure amount with 157.56 TL on average. A household with family with one adult, landlord and 3-person household (mother or father and two children) earns more money and spends more for health expenses than other clusters. C4 households have the highest expenditure with 6237.23 TL. However, they spend less money for health problems because the health expenditure rate is 3.10%. Interestingly, the major difference of the C4 cluster mode compared to others is the factor of ‘sport’, which has “Yes” value only in the cluster C4. It may prove that people who do physical exercise regularly have less health problems. Additionally, ‘smoking’ is also another important factor that affects the health expenditure rates. C4 cluster has “No” value for the ‘smoking’ factor. A household with an elementary family with two children, a landlord and a 4-person household (mother, father and two children) may spend less if they do exercises regularly and do not smoke.
C1 cluster mainly includes households with elementary families with three children (hhtype = 3 and hhsize = 5) who are not tenant and are not landlord (property = 4). It is like C5 with respect to the factors of smoking (Yes), alcohol (Yes), sport (No), and insurance (No). Cluster C2 represents childless couples (hhtype = 4 and hhsize = 2) who have a house, do not smoke but drink, have no private health insurance, and have a habit of doing sport.
After the cluster analysis, we calculate the catastrophic health expenditures of each households in each cluster. The proposal developed by Feldstein [30] is used in this study in order to calculate the catastrophic health expenditures in Turkey for the year 2017. It is indicated that there was spending of more than 10 percent of annual income on catastrophic health expenditures. In this study, the capacity to pay is defined as the total expenditure of household minus food expenditures. We calculate the catastrophic health expenditures share of each household. We define dummy variable, which is also dependent variable, as “1” if out-of-pocket health expenditures are equal or exceed 10% of household’s capacity to pay, and “0” otherwise. Figure 2 shows the numbers of catastrophic health expenditures (1) and non-catastrophic health expenditures (0) in each cluster.
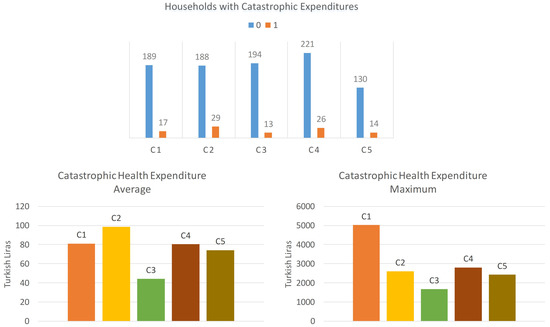
Figure 2.
Catastrophic health expenditures.
Catastrophic health expenditures of households in each cluster are examined, and their descriptive statistics are shown in Figure 2. When the average catastrophic health expenditures are examined, we see that the households in the cluster C2 make the most catastrophic health expenditure. On the other hand, households in the clusters C1 and C4 appear to be close in terms of average catastrophic expenditures, while the average catastrophic expenditures of the households in the C5 cluster are less than those in the two clusters. Finally, it is observed that the households in the C3 cluster have less catastrophic health expenditures on average.
As the maximum values are examined, it is seen that the highest catastrophic health expenditure values are seen at the cluster C1. The maximum values of C2, C3, and C5 are observed as close to each other. The maximum catastrophic expenditure value of the household in the C3 cluster is relatively small. Finally, the rate of catastrophic health expenditure C2 group is 13.36%, followed by C4 (10.53%), C5 (9.72%), C1 (8.25%) and C3 (6.28%).
6. Conclusions
Increasing healthcare expenditure is an essential challenge for researchers and policymakers to build more prosperous and developed societies. Therefore, this study investigates the determinants of catastrophic healthcare expenditures in Turkey. Since the dataset consists of categorical data, a k-modes clustering algorithm was developed for this study. Five clusters were constructed by taking into consideration household type, property status, smoking habits, drinking habits, sports habits and having private health insurance. First, the clusters were compared according to their health expenditures. The results of the clustering showed that a household with an elementary family with two children having their own house may spend less if they do regular exercises and do not smoke. On the other hand, single mother/father with two children having their own house earns more money and spends more on health expenses than other clusters.
Furthermore, catastrophic health expenditures of each cluster were examined. The results show that a family with one child, tenant, and smoking but no alcohol drinking and no paid sports habits make less catastrophic health expenditure on average. Furthermore, childless couples who are landlords, with no smoking or paid sports habit, but who drink alcohol make the most catastrophic health expenditure on average. In general, the number of children, smoking, drinking, and sports habit and property status are not statistically distinguishing factors on catastrophic healthcare expenditures. Although, healthy habits such as regularly doing exercises, not drinking alcohol and smoking may decrease catastrophic healthcare expenditures.
For future studies, survey data for the previous years should be used to observe changes in time and to find the significant determinants on catastrophic healthcare expenditures. Furthermore, this study investigated the catastrophic household expenditure for healthcare in Turkey, and survey data for the other developing countries should be analyzed to make a general overview for developing countries.
Author Contributions
This study is a collaborative development of all authors. O.D. are the main researcher and supervision of the study. G.K. has studied data curation and investigated previous studies. A.K. and H.B. have responsible for writing-review and editing. All authors have read, revised and approved the final manuscript.
Funding
This research received no external funding.
Conflicts of Interest
The authors declare no conflict of interest.
References
- Bickenbach, J. WHO’s definition of health: Philosophical analysis. In Handbook of the Philosophy of Medicine; Springer: Heidelberg, Germany, 2015; pp. 1–14. [Google Scholar]
- World Health Organization Statistics. Available online: https://data.worldbank.org/indicator/SH.XPD.CHEX.GD.ZS?most_recent_year_desc=true (accessed on 1 June 2019).
- Yereli, A.; Kobal, I.; Köktaş, A. Türkiye’de Sağlık Harcamalarını Arttıran Faktörler. Uluslararası Bilgi, Ekonomi ve Yönetim Kongresi 2016, 22, 28–31. [Google Scholar]
- Akar, S. Türkiye’de sağlık harcamaları, sağlık harcamalarının nisbi fiyatı ve ekonomik büyüme arasındaki ilişkinin incelenmesi. Yönetim ve Ekonomi: Celal Bayar Üniversitesi İktisadi ve İdari Bilimler Fakültesi Dergisi 2014, 21, 311–322. [Google Scholar]
- Sevinc, I.; Erisen, M.A.; Kirac, R. Türkiye’de 2003–2015 Yılları Arası Sağlık Harcamaları İstatistiklerinin Incelenmesi. ASOS J. 2017, 47, 496–509. [Google Scholar]
- Wagstaff, A.; Flores, G.; Hsu, J.; Smitz, M.F.; Chepynoga, K.; Buisman, L.R.; van Wilgenburg, K.; Eozenou, P. Progress on catastrophic health spending in 133 countries: A retrospective observational study. Lancet Glob. Health 2018, 6, e169–e179. [Google Scholar] [CrossRef]
- World Health Organization. Designing Health Financing Systems to Reduce Catastrophic Health Expenditure; Technical report; World Health Organization: Geneva, Switzerland, 2005. [Google Scholar]
- Puteh, S.E.; Almualm, Y. Catastrophic health expenditure among developing countries puteh. Health Res. Policy Syst. 2017, 4, 50. [Google Scholar]
- Yang, T.; Chu, J.; Zhou, C.; Medina, A.; Li, C.; Jiang, S.; Zheng, W.; Sun, L.; Liu, J. Catastrophic health expenditure: A comparative analysis of empty-nest and non-empty-nest households with seniors in Shandong, China. BMJ Open 2016, 6, e010992. [Google Scholar] [CrossRef] [PubMed]
- Choi, J.W.; Kim, T.H.; Jang, S.I.; Jang, S.Y.; Kim, W.R.; Park, E.C. Catastrophic health expenditure according to employment status in South Korea: A population-based panel study. BMJ Open 2016, 6, e011747. [Google Scholar] [CrossRef]
- Xu, K.; Evans, D.B.; Kawabata, K.; Zeramdini, R.; Klavus, J.; Murray, C.J. Household catastrophic health expenditure: A multicountry analysis. Lancet 2003, 362, 111–117. [Google Scholar] [CrossRef]
- Xu, K.; Evans, D.B.; Carrin, G.; Aguilar-Rivera, A.M.; Musgrove, P.; Evans, T. Protecting households from catastrophic health spending. Health Aff. 2007, 26, 972–983. [Google Scholar] [CrossRef]
- Su, T.T.; Kouyaté, B.; Flessa, S. Catastrophic household expenditure for health care in a low-income society: A study from Nouna District, Burkina Faso. Bull. World Health Organ. 2006, 84, 21–27. [Google Scholar] [CrossRef]
- Ekman, B. Catastrophic health payments and health insurance: Some counterintuitive evidence from one low-income country. Health Policy 2007, 83, 304–313. [Google Scholar] [CrossRef]
- Jakovljevic, M.; Potapchik, E.; Popovich, L.; Barik, D.; Getzen, T.E. Evolving health expenditure landscape of the BRICS nations and projections to 2025. Health Econ. 2017, 26, 844–852. [Google Scholar] [CrossRef] [PubMed]
- Reshetnikov, V.; Arsentyev, E.; Boljevic, S.; Timofeyev, Y.; Jakovljević, M. Analysis of the Financing of Russian Health Care over the Past 100 Years. Int. J. Environ. Res. Public Health 2019, 16, 1848. [Google Scholar] [CrossRef] [PubMed]
- Jakovljevic, M.; Jakab, M.; Gerdtham, U.; McDaid, D.; Ogura, S.; Varavikova, E.; Merrick, J.; Adany, R.; Okunade, A.; Getzen, T.E. Comparative financing analysis and political economy of noncommunicable diseases. J. Med. Econ. 2019, 22, 1–6. [Google Scholar] [CrossRef] [PubMed]
- Fazaeli, A.A.; Ghaderi, H.; Fazaeli, A.A.; Lotfi, F.; Salehi, M.; Mehrara, M. Main determinants of catastrophic health expenditures: A Bayesian logit approach on Iranian household survey data (2010). Glob. J. Health Sci. 2015, 7, 335. [Google Scholar] [CrossRef]
- Kavosi, Z.; Rashidian, A.; Pourreza, A.; Majdzadeh, R.; Pourmalek, F.; Hosseinpour, A.R.; Mohammad, K.; Arab, M. Inequality in household catastrophic health care expenditure in a low-income society of Iran. Health Policy Plan. 2012, 27, 613–623. [Google Scholar] [CrossRef] [PubMed]
- Saito, E.; Gilmour, S.; Rahman, M.M.; Gautam, G.S.; Shrestha, P.K.; Shibuya, K. Catastrophic household expenditure on health in Nepal: A cross-sectional survey. Bull. World Health Organ. 2014, 92, 760–767. [Google Scholar] [CrossRef]
- Wyszewianski, L. Families with catastrophic health care expenditures. Health Serv. Res. 1986, 21, 617. [Google Scholar]
- Yardim, M.S.; Cilingiroglu, N.; Yardim, N. Catastrophic health expenditure and impoverishment in Turkey. Health Policy 2010, 94, 26–33. [Google Scholar] [CrossRef]
- Basar, D.; Brown, S.; Hole, A.R. Out-of-pocket health care expenditure in Turkey: Analysis of the household budget surveys 2002–2008. Working paper. 2012. Available online: http://eprints.whiterose.ac.uk/74495/ (accessed on 28 July 2019).
- Yardim, N.; Cilingiroglu, N.; Yardim, M.S. Financial protection in health in Turkey: The effects of the Health Transformation Programme. Health Policy Plan. 2013, 29, 177–192. [Google Scholar] [CrossRef]
- Brown, S.; Hole, A.R.; Kilic, D. Out-of-pocket health care expenditure in Turkey: Analysis of the 2003–2008 Household Budget Surveys. Econ. Modell. 2014, 41, 211–218. [Google Scholar] [CrossRef]
- Narci, H.O.; Sahin, I.; Yildirim, H.H. Financial catastrophe and poverty impacts of out-of-pocket health payments in Turkey. Econ. Modell. 2015, 16, 255–270. [Google Scholar]
- Huang, Z. Extensions to the k-means algorithm for clustering large data sets with categorical values. Data Min. Knowl. Discov. 1998, 2, 283–304. [Google Scholar] [CrossRef]
- Huang, J.Z. Clustering categorical data with k-Modes. In Encyclopedia of Data Warehousing and Mining, Second Edition; IGI Global: Hershey, PA, USA, 2009; pp. 246–250. [Google Scholar]
- Dogan, O. Heuristic Approaches in Clustering Problems. In Handbook of Research on Applied Optimization Methodologies in Manufacturing Systems; IGI Global: Hershey, PA, USA, 2018; pp. 107–124. [Google Scholar]
- Feldstein, M.S. A new approach to national health insurance. Public Interest 1971, 23, 93. [Google Scholar]


© 2019 by the authors. Licensee MDPI, Basel, Switzerland. This article is an open access article distributed under the terms and conditions of the Creative Commons Attribution (CC BY) license (http://creativecommons.org/licenses/by/4.0/).