Systematic Review

Artificial Intelligence Approaches for Geographic Atrophy Segmentation: A Systematic Review and Meta-Analysis

by
Aikaterini Chatzara
1,†,
Eirini Maliagkani
1,†,
Dimitra Mitsopoulou
2,
Andreas Katsimpris
3,
Ioannis D. Apostolopoulos
4,
Elpiniki Papageorgiou
4,* and
Ilias Georgalas
1
1
1st Department of Ophthalmology, G. Gennimatas General Hospital, National and Kapodistrian University of Athens, 11527 Athens, Greece
2
Eye Unit, University Hospital Southampton, Southampton SO16 6HU, UK
3
Princess Alexandra Eye Pavilion, University of Edinburgh, Edinburgh EH3 9HA, UK
4
ACTA Lab, Department of Energy Systems, University of Thessaly, Gaiopolis Campus, 41500 Larisa, Greece
*
Author to whom correspondence should be addressed.
These authors contributed equally to this work.
Bioengineering 2025, 12(5), 475; https://doi.org/10.3390/bioengineering12050475
Submission received: 2 April 2025 / Revised: 26 April 2025 / Accepted: 28 April 2025 / Published: 30 April 2025
(This article belongs to the Section Biosignal Processing)

Abstract

Geographic atrophy (GA) is a progressive retinal disease associated with late-stage age-related macular degeneration (AMD), a significant cause of visual impairment in senior adults. GA lesion segmentation is important for disease monitoring in clinical trials and routine ophthalmic practice; however, its manual delineation is time-consuming, laborious, and subject to inter-grader variability. The use of artificial intelligence (AI) is rapidly expanding within the medical field and could potentially improve accuracy while reducing the workload by facilitating this task. This systematic review evaluates the performance of AI algorithms for GA segmentation and highlights their key limitations from the literature. Five databases and two registries were searched from inception until 23 March 2024, following the PRISMA methodology. Twenty-four studies met the prespecified eligibility criteria, and fifteen were included in this meta-analysis. The pooled Dice similarity coefficient (DSC) was 0.91 (95% CI 0.88–0.95), signifying a high agreement between the reference standards and model predictions. The risk of bias and reporting quality were assessed using QUADAS-2 and CLAIM tools. This review provides a comprehensive evaluation of AI applications for GA segmentation and identifies areas for improvement. The findings support the potential of AI to enhance clinical workflows and highlight pathways for improved future models that could bridge the gap between research settings and real-world clinical practice.

Graphical Abstract

1. Introduction

1.1. Age-Related Macular Degeneration—Geographic Atrophy Definition

Age-related macular degeneration (AMD) is a chronic degenerative disease of the retina and a leading cause of blindness in older adults. The prevalence of AMD is expected to rise due to the rapidly aging global population, making it a significant public health issue in the coming decades [1]. AMD is classified into two main forms: dry (nonexudative) AMD and wet (exudative or neovascular) AMD. Geographic atrophy (GA) is an advanced form of dry AMD and is characterized by the gradual loss of the retinal pigment epithelium (RPE), photoreceptors, and underlying choriocapillaris in roughly circular areas in the posterior pole, leading to severe central vision loss when the fovea is involved [2,3].
The term “geographic atrophy” was first reported in association with “senile macular degeneration” by J. Donald and M. Gass in 1972 [4]. Various classification systems were developed in the following years that defined GA as well-circumscribed hypopigmented retinal lesions exposing choroidal vessels, with a minimum diameter of 175 μm on color fundus imaging [5]. However, as modern imaging techniques have emerged, a more appropriate nomenclature has been proposed in order to catch up with the improved visualization methods and provide standardized terminology. The Classification of Atrophy Meetings (CAM*) consensus introduced four new terms to further classify AMD-related atrophy based on the optical coherence tomography (OCT) findings. Complete RPE and outer retinal atrophy (cRORA) is defined as an area of hypertransmission and RPE attenuation of >250 μm in the greatest diameter with overlying degeneration of the photoreceptor layer and no signs of an RPE tear. Incomplete RPE and outer retinal atrophy (iRORA), complete outer retinal atrophy (cORA), and incomplete outer retinal atrophy (iORA) describe earlier stages of the atrophic process in AMD [6]. Although the term GA is considered a subset of cRORA, it is still widely used in routine clinical practice and in the literature and is strongly associated with end-stage AMD atrophy, so, for the purpose of this review, we employed both terms to access a more comprehensive range of the literature [6]. Although OCT has been proposed as the “gold standard” imaging modality for GA identification and staging, other visualization approaches, like fundus autofluorescence (FAF), near-infrared reflectance (NIR), fluorescein angiography (FA), and color fundus photography (CFP), still offer useful clinical information and are routinely encountered in many clinical settings [6].
The early detection of GA is vital because it allows for timely referral and intervention before extensive retinal damage occurs [7]. Additionally, GA lesions often expand slowly, with enlargement rates ranging from 0.53 to 2.79 mm2 per year in the literature, making disease progression monitoring challenging [8]. At the same time, several clinical trials chose anatomic endpoints, like the GA lesion growth rate, to assess the efficacy of emerging therapies [9]. In order to track those subtle atrophic changes, assist clinicians in timely GA detection, and quantify lesion shape and size, accurate and reliable segmentation techniques are needed.

1.2. Geographic Atrophy Segmentation

Image segmentation is a valuable component of medical image analysis and involves the process of separating an image into multiple components and isolating the regions of interest (ROIs) [10]. In the context of GA segmentation, it relies on lesion partitioning from the surrounding healthy retinal tissue, which is crucial for monitoring lesions across different visits, predicting disease progression, and optimizing insights from multimodal imaging sources.
Based on the segmentation approach employed, it can be classified as manual, semi-automatic, or fully automatic [11]. Manual segmentation involving a human grader has traditionally been the gold standard (or “ground truth”—GT) due to its wide clinical application and an expert’s ability to interpret the fine details; however, it requires significant time and effort and is subject to variability among specialists or imaging modalities [12,13]. Semi-automatic segmentation combines manual annotations with computational assistance, with varying degrees of user intervention [11]. Lastly, fully automatic image segmentation has long been in the research spotlight with the hope of providing accurate, fast, and consistent results with minimal-to-no human interaction. Region-based methods, deformable models, and other approaches have been used for this purpose [14], as well as artificial intelligence (AI) techniques, which have received considerable attention as promising automatic segmentation tools for achieving impressive speed, consistency, and accuracy [15].

1.3. Artificial Intelligence

AI is a broad field encompassing various techniques that enable computers to mimic human intelligence and perform advanced tasks, like learning, problem-solving, and decision-making. In medical imaging, AI plays a crucial role in automating tasks, improving efficiency and precision, and providing insights that may not be readily apparent to human users [16]. Deep learning (DL) is a subfield of AI that utilizes deep structures, such as artificial neural networks with multiple layers (adding “depth”), to automatically learn from complex data. This data-driven approach allows DL models to achieve exceptional performance on various image analysis tasks by directly extracting the features from the raw image data, outclassing predecessor AI subfields like machine learning (ML) [17].
It is no surprise that AI algorithms have seen extensive application in ophthalmology. In the context of AMD, numerous models have been developed to tackle various aspects of medical image analysis, including disease detection, classification, segmentation, treatment response, progression, and prediction [18]. As these AI techniques have evolved, their application has become increasingly focused on GA assessment, particularly the segmentation of the relevant lesions, enabling a more precise delineation of the atrophic boundaries [15]. Several clinical trials investigating complement inhibitors for GA treatment have used the lesion area growth as the primary endpoint, and AI models that can segment GA lesions have served as valuable tools for monitoring patients and tracking these endpoints efficiently, often with pixel-level accuracy [19]. Moreover, the accurate contouring of GA lesion boundaries via automatic approaches is crucial for computer-aided diagnosis (CAD) and enhanced image interpretation, reduced clinical workload, and supported decision-making [20]. In line with these advancements, the first AI-driven approach for GA analysis to be certified under the European Union Medical Device Regulation is the RetInSight GA Monitor, a clinical decision support system (DSS) developed for integration into routine practice and patient monitoring [21].
The development of AI models for such tasks is a stepwise process that generally follows an established pipeline. A dataset with appropriate images is gathered and is later split into training, validation, and internal test sets. The first set is used to build the model with the optimal parameters that balance performance with overfitting, as determined by multiple iterations of the validation set. Then, an unseen test set is used for the evaluation of the final model’s performance and an assessment of generalizability. Very often, an independent, external test set is employed to assess its performance across different populations, robustness, and real-world applicability [22]. However, we should note that this process is a general outline of model development that may not apply to all AI algorithms (i.e., unsupervised models).
An integral part of AI algorithm development is the evaluation of the model outputs. Apart from a visual evaluation of the segmentation results, which offers a qualitative reassurance of a model’s performance, measurable indices must be employed in order to quantify and scale the performance of AI models. The most common metric for the evaluation of image segmentation outputs is the Dice similarity coefficient (DSC), which measures the correspondence between model outputs and expert annotations [15]. Other important metrics include the F1 score, accuracy, precision, positive predictive value (PPV), sensitivity (recall), specificity, absolute area difference (AAD), area under the curve (AUC), intersection over union (IoU), and overlap ratio (OR) [23,24,25]. These metrics can not only objectively assess the segmentation results and aid in comparisons of models, but also assist in parameter fine-tuning, appropriate algorithm selection, and qualitative dataset analysis [23].
It is also worth mentioning that the rapid development of AI-driven medical image analysis has quickly led to its expansion into decision-making processes, like diagnosis and treatment planning. However, even the most highly accurate and powerful algorithms cannot be integrated into clinical routines unless they provide a justification of their results, making them understandable by human users. Transparency and interpretability are essential before trusting a model with critical decision-making tasks, which is why the concept of explainable AΙ (XAI) has emerged to describe all the efforts and methodologies aimed at developing comprehensible and reliable AI systems [26]. To further address this issue, the European Union established the AI Act (AIA) in 2024, requiring healthcare AI DSSs to be explainable, either intrinsically or extrinsically, providing insights into the causal relationships between the inputs and outputs to enhance trustworthiness [27].
Despite the challenges arising along the way, AI continues to evolve at an unprecedented pace, reshaping ophthalmology, a specialty that is inherently dependent on medical imaging technologies. Within the vast field of AMD, GA segmentation holds great potential for AI applications, but this topic has yet to be addressed in a focused, comprehensive manner. In this work, we present a systematic review of the current literature on AI applications for GA lesion segmentation, charting the methodologies, datasets, performance metrics, and limitations of the AI algorithms used in this field. We critically analyze the various approaches with the aim of providing a clear picture of the state-of-the-art AI-driven segmentation methods for GA and identifying the gaps in the literature where further research is needed. This work serves as a foundation for advancing the application of AI technologies in ophthalmology and contributes to the growing body of knowledge about medical image analysis. To the best of our knowledge, no other systematic review has yet to address the concept of GA segmentation via AI methods, and our ambition is to provide confident insights into this rapidly evolving field while cautiously examining its potential for further development and clinical applicability.

2. Materials and Methods

2.1. Research Question

What are the accuracy and efficacy of AI tools for the segmentation of geographic atrophy lesions among ophthalmic imaging modalities?

2.2. Eligibility Criteria

This systematic review and meta-analysis was designed and conducted in accordance with the PRISMA guidelines (Preferred Reporting Items for Systematic Reviews and Meta-Analyses) [28], with the PRISMA checklist provided in Supplementary Table S1. A protocol was developed, but not registered, using the PICOS (Population, Intervention, Comparison, Outcomes, and Study Design) framework (Table 1) to define eligibility and address the research question [29]. To ensure a rigorous selection process, we established detailed inclusion and exclusion criteria, presented in Table 2.

2.3. Search Strategy and Study Selection

A systematic search was conducted of MEDLINE (via PubMed), Scopus, Google Scholar, Web of Science, Cochrane Library, ClinicalTrials.gov, and World Health Organization’s (WHO’s) International Clinical Trials Registry Platform (ICTRP) by two independent reviewers (A.C. and D.M.). Searches covered all available records until 23 March 2024. Since GA is often considered as late-stage AMD, we opted for broad, inclusive search algorithms that encompassed AI applications to AMD analysis in general, with the purpose of maximizing the eligible study results. The following key terms were used in various combinations: “deep learning”, “machine learning”, “artificial intelligence”, “AI”, “algorithm”, “late age-related macular degeneration”, “cRORA”, “geographic atrophy”, “GA”, and “automated segmentation”. Each reviewer (A.C. and D.M.) reassessed the suitability of the search strategy via multiple iterations until reaching a final consensus aligned with the research objective. The finalized search algorithms were then used for manual searches of each nominated database or registry. Detailed search algorithms and strategy are provided in Supplementary Table S2.
The retrieved literature was uploaded to EndNote (version x21.2) for efficient reference management. After automatic deduplication [30], the remaining papers were uploaded to the online reviewing platform “Rayyan” for accurate title and abstract screening [31]. The two reviewers (A.C. and D.M.) performed title and abstract screening blindly and independently, evaluating available literature against predefined inclusion and exclusion criteria (Table 2). Studies unrelated to AI applications for AMD/GA analysis were marked as “excluded”, while those with low/medium or high relevance were marked as “maybe” or “included”, respectively. Reviewer discrepancies were resolved through discussion, and the remaining records were re-exported to EndNote for full-text retrieval. A double, independent, comprehensive full-text screening was then performed, with documentation of the main exclusion reasons. Any disagreements were resolved by consensus, and the final group of included studies proceeded to the data extraction and risk-of-bias assessment phases.

2.4. Quality Assessment

To assess the quality of the included studies, two reviewers (A.C. and D.M.) independently applied the Quality Assessment of the Diagnostic Accuracy Studies-2 (QUADAS-2) [32] and the Checklist for Artificial Intelligence in Medical Imaging (CLAIM) [33] tools. Discrepancies were resolved through consensus with a senior researcher (E.M.). The combination of QUADAS-2 for diagnostic quality and CLAIM for reporting quality ensured that both the reliability of the results and the transparency of AI-specific methodologies were thoroughly assessed in a standardized and targeted manner.
The QUADAS-2 scale assesses risk of bias across four domains (patient selection, index test, reference standard, and flow and timing) and evaluates applicability concerns for three domains (patient selection, index test, and reference standard). The responses for each item are classified into five categories (i.e., yes, no, low, high, or unclear risk) according to specific questions within each component. The scale was used unmodified and regarding patient selection, emphasis was placed on ensuring a well-defined population of GA eyes without inappropriate exclusion of ambiguous or difficult-to-diagnose cases. The index test domain focused on the detail of description of the AI algorithm used for segmenting GA lesions with different ophthalmic imaging modalities. The reference standard domain assessed the reliability of the reference standard via manual delineation or other validated methods. Finally, the flow and timing domain evaluated the transparency, coherence, and reproducibility of the research process and patient management. Applicability concerns for each of the first 3 domains were rated for their relevance and agreement with the research question.
CLAIM offers a best practice checklist to promote transparency and reproducibility of medical imaging AI research. It consists of 44 items across key domains, including study design, dataset characteristics, reference standard, AI methodology, evaluation, and model performance. Each CLAIM item has three options: yes, no, and not applicable (N/A). “Yes” is assigned when all or most checklist requirements are met, allowing for minor omissions that do not affect reliability; “No” is assigned when key elements are missing, impacting quality, clarity, or replicability; and “Not Applicable” is assigned when an item is irrelevant to a study’s characteristics. We strictly adhered to CLAIM item directions, assessing each paper based on the specific structure and sectioning mandated by the checklist.

2.5. Data Extraction

Double independent extraction with mutual verification was performed by two reviewers (A.C and D.M.), with recorded information entered into a predefined Excel spreadsheet for later tabulation. Any discrepancies were resolved by a senior investigator (E.M.). A brief description of the categories of extracted data is presented in Table 3.

2.6. Statistical Analysis

We evaluated the performance of AI algorithms for the analysis of geographic atrophy using the DSC, a commonly used metric for assessing the overlap between predicted and reference segmentations. For the meta-analysis, we required the mean DSC values with their corresponding standard deviations (SDs) or 95% confidence intervals (CIs).
A random-effects model was employed to estimate the pooled DSC values, accounting for variability across the included studies. Forest plots were generated to visualize the individual studies’ effect sizes and their overall pooled performance. Heterogeneity among studies was assessed using the Cochrane Q test and the Higgins I2 statistic. An I2 value of 25–50% was considered low-to-moderate heterogeneity, while values exceeding 75% indicated substantial heterogeneity. A p-value of <0.05 on the Cochrane Q test was considered indicative of statistically significant heterogeneity.
All statistical analyses were conducted using R Statistical Software (v4.4.0; R Core Team 2024), and a two-sided p-value of <0.05 was deemed statistically significant.

3. Results

3.1. Study Selection

Our initial literature search yielded 2597 studies in total. After duplicate removal in EndNote, 1893 studies remained for title and abstract screening, leading to the exclusion of 1649 records, mainly due to an ineligible population (e.g., studies conducted in people without AMD) or ineligible intervention (e.g., AMD analysis without the use of AI tools). Among the 244 remaining records, we identified and manually removed 21 duplicates, ensuring consistency across the title, year, author, abstract, journal, and DOI. At this stage, we also performed a gray literature search of Google Scholar, adding the first 100 results to our final cohort. After a double, independent, full-text screening, 24 studies met all the eligibility criteria for the systematic review, and 15 were included in the meta-analysis. Forward and backward citation chasing (snowballing) did not yield additional studies. A detailed visual representation of the literature collection and screening process is provided in the PRISMA flowchart (Figure 1).

3.2. Risk of Bias, Applicability Concerns, and Reporting Quality

Figure 2 presents the findings of the quality assessment of the included studies using the QUADAS-2 tool, displayed as a traffic light plot for visual clarity. A more detailed analysis of the risk of bias and applicability concerns is provided in Supplementary Table S3.
Seven studies received a low score for the patient selection domain due to inappropriate exclusions, particularly related to poor image quality, unclear lesion borders, predefined lesion size thresholds, best-corrected visual acuity (BCVA) criteria, or non-random patient selection. These exclusions rejected a significant proportion of the patients (and their images) that are often encountered in everyday clinical practice, ultimately introducing bias and limiting real-world generalizability. For the index test domain, it was unclear whether a predefined threshold was used in 11 studies or if it was adjusted through trial-and-error or other non-standardized methods. Regarding the reference standard, potential sources of bias were identified in six studies, including the use of single-grader annotations, low or unreported inter-grader agreement, and a reliance on software or different imaging modalities as annotation proxies. The flow and timing domain showed a low risk of bias in 71% of the studies, but four studies had a high risk due to dissimilar reference standards among the patients (which can be partially attributed to the labor-intensive process of manual annotations) and the exclusion of patients along the study pipeline.
The applicability concerns were generally low, as the included studies highly matched our predefined GA population and AI intervention criteria and were meticulously selected from among a large pool of other automatic or semi-automatic GA segmentation studies, as dictated by our PICOS framework. However, the reference standard domain received an overall lower applicability score because it was often unclear whether the annotation process concluded in a GA ground truth that was reliable and consistent with our inclusion criteria.
Figure 3 presents a bar chart depicting the percentage compliance with the CLAIM checklist per study, by quantifying the number of positive answers for each of the 44 checklist items, while Supplementary Table S4 provides a detailed breakdown of the assessment results.
We strictly evaluated each study for its adherence to reporting guidelines and including the necessary information in the appropriate sections. There was a significant variation in their compliance, with the percentages ranging from approximately 23% to 80%. Only six studies achieved a compliance rate above 60%, with two of them exceeding 75%, indicating a better adherence to the reporting standards. In contrast, four studies had low compliance scores below 40%, suggesting possible gaps in their reporting quality. The common areas of poor performance included the justification of the testing sample size or reference standard selection, the inclusion of patient demographics and patient flow analysis, the description of the data anonymization techniques, the use of external testing, and the inclusion of the full study’s protocol links. Our overall evaluation aligns with the findings of other researchers, indicating that only a small percentage of the published literature on AI applications in medical imaging has adhered to the CLAIM checklist, providing documented evidence of self-reporting in accordance with the established standards, even among the studies that were published after the tool’s release [58].

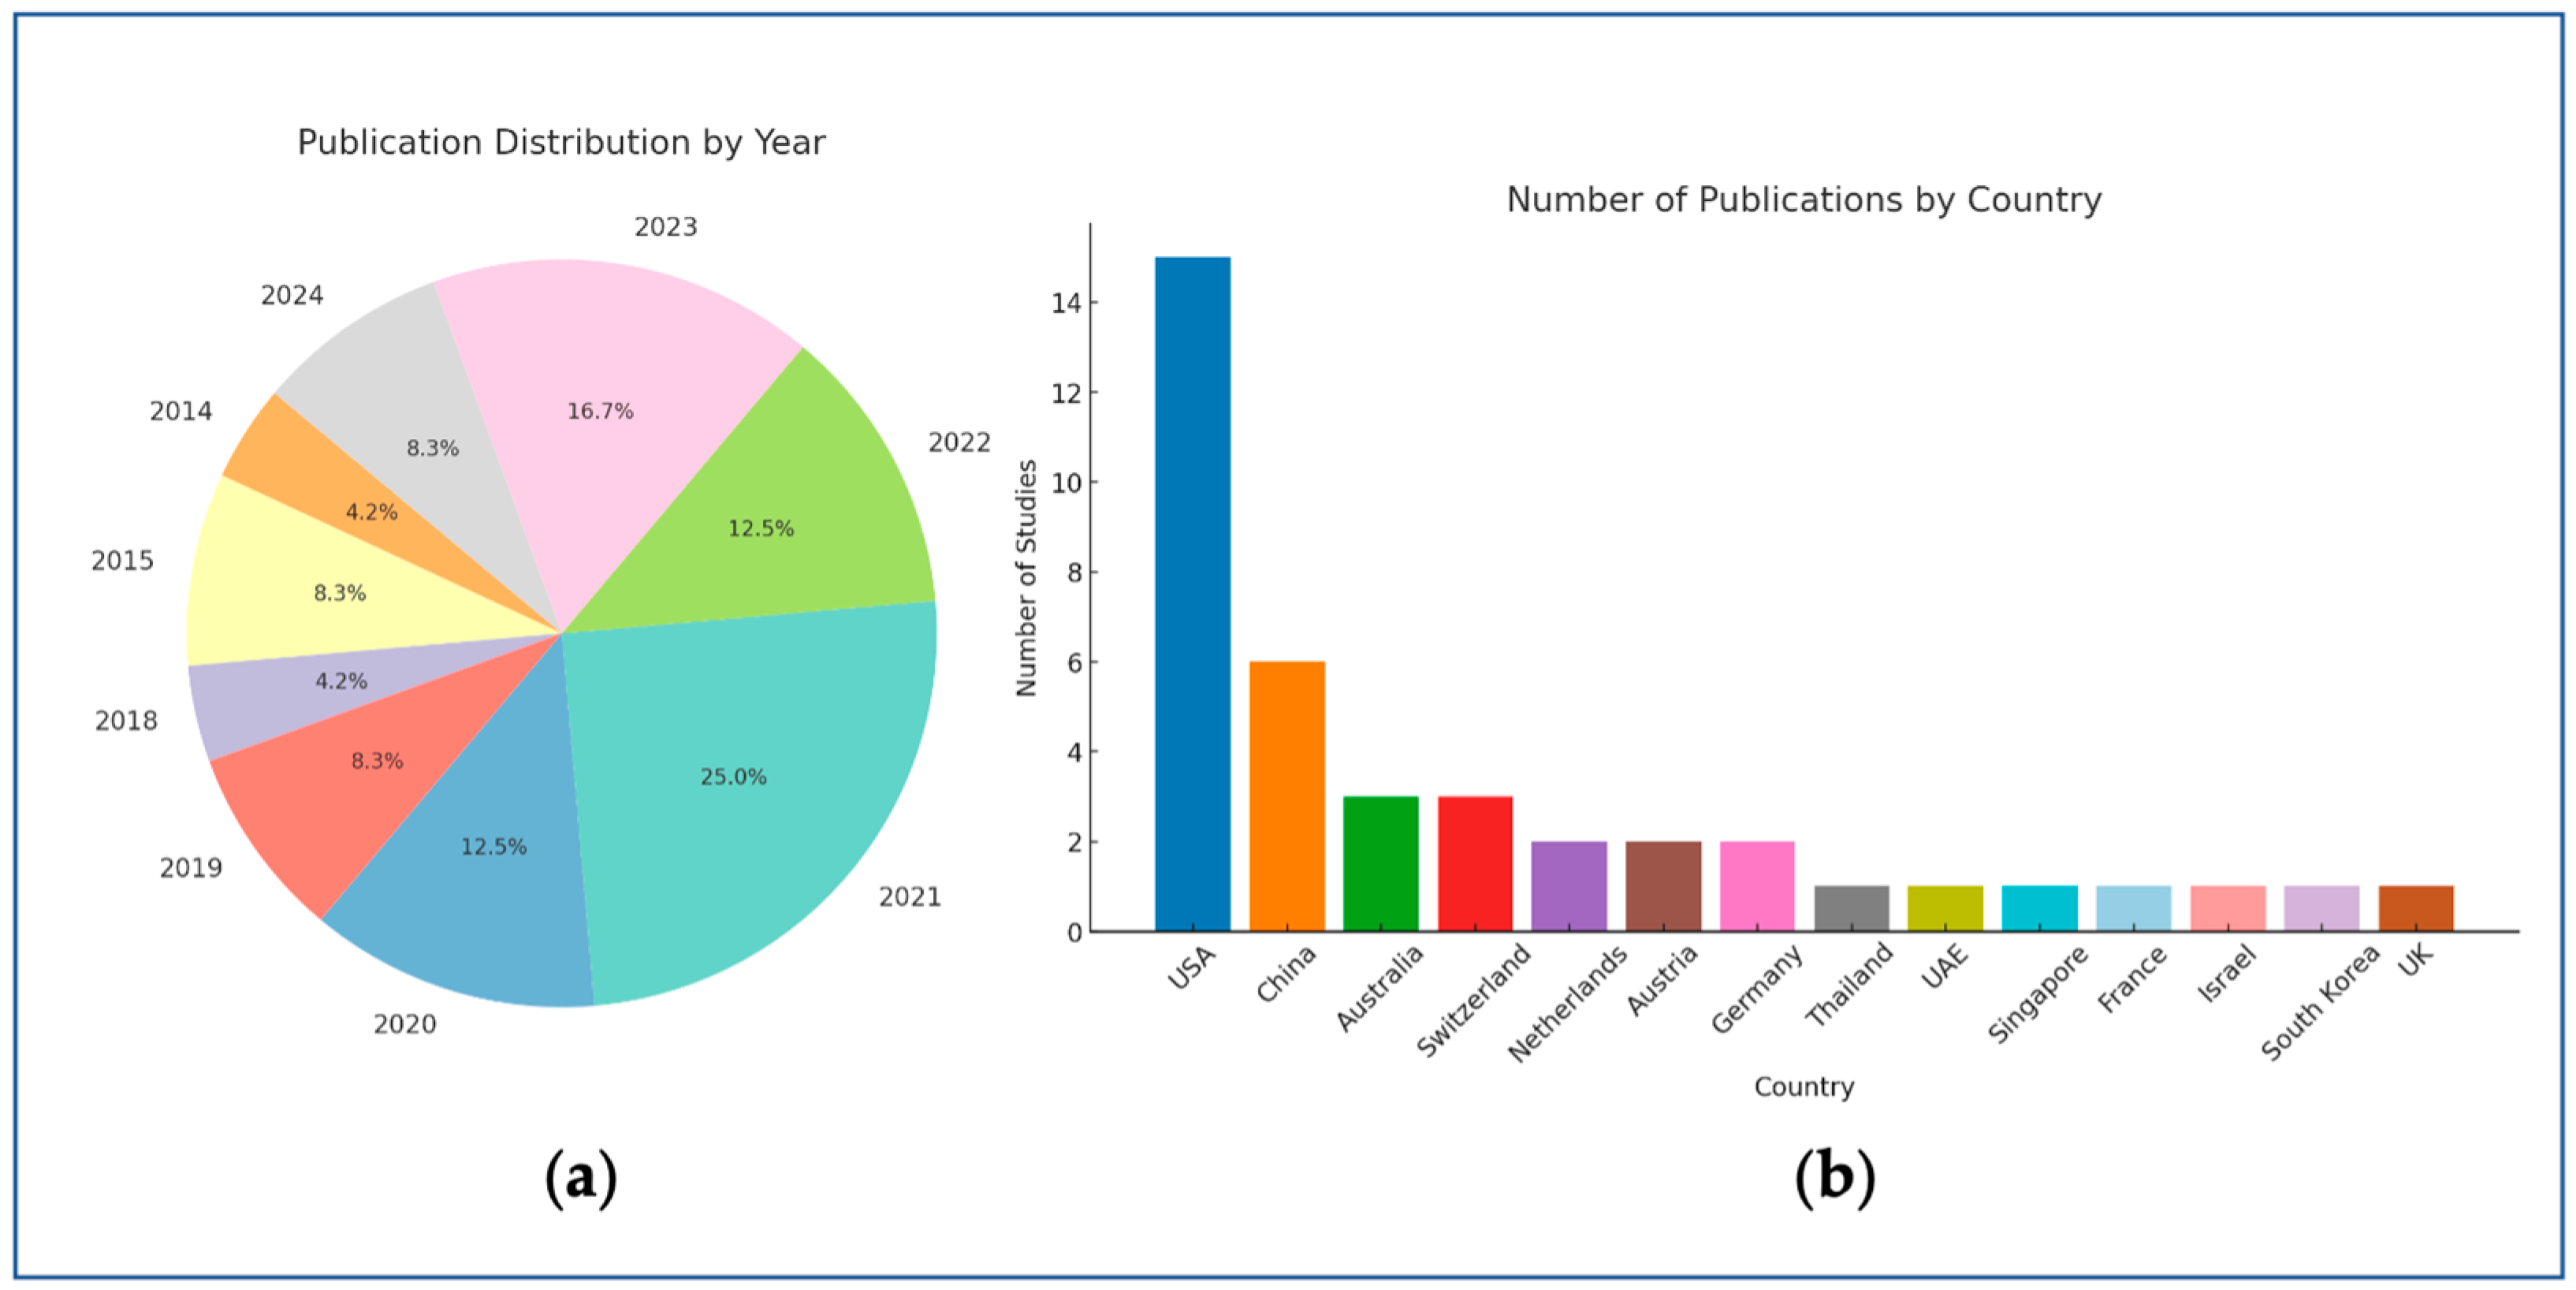
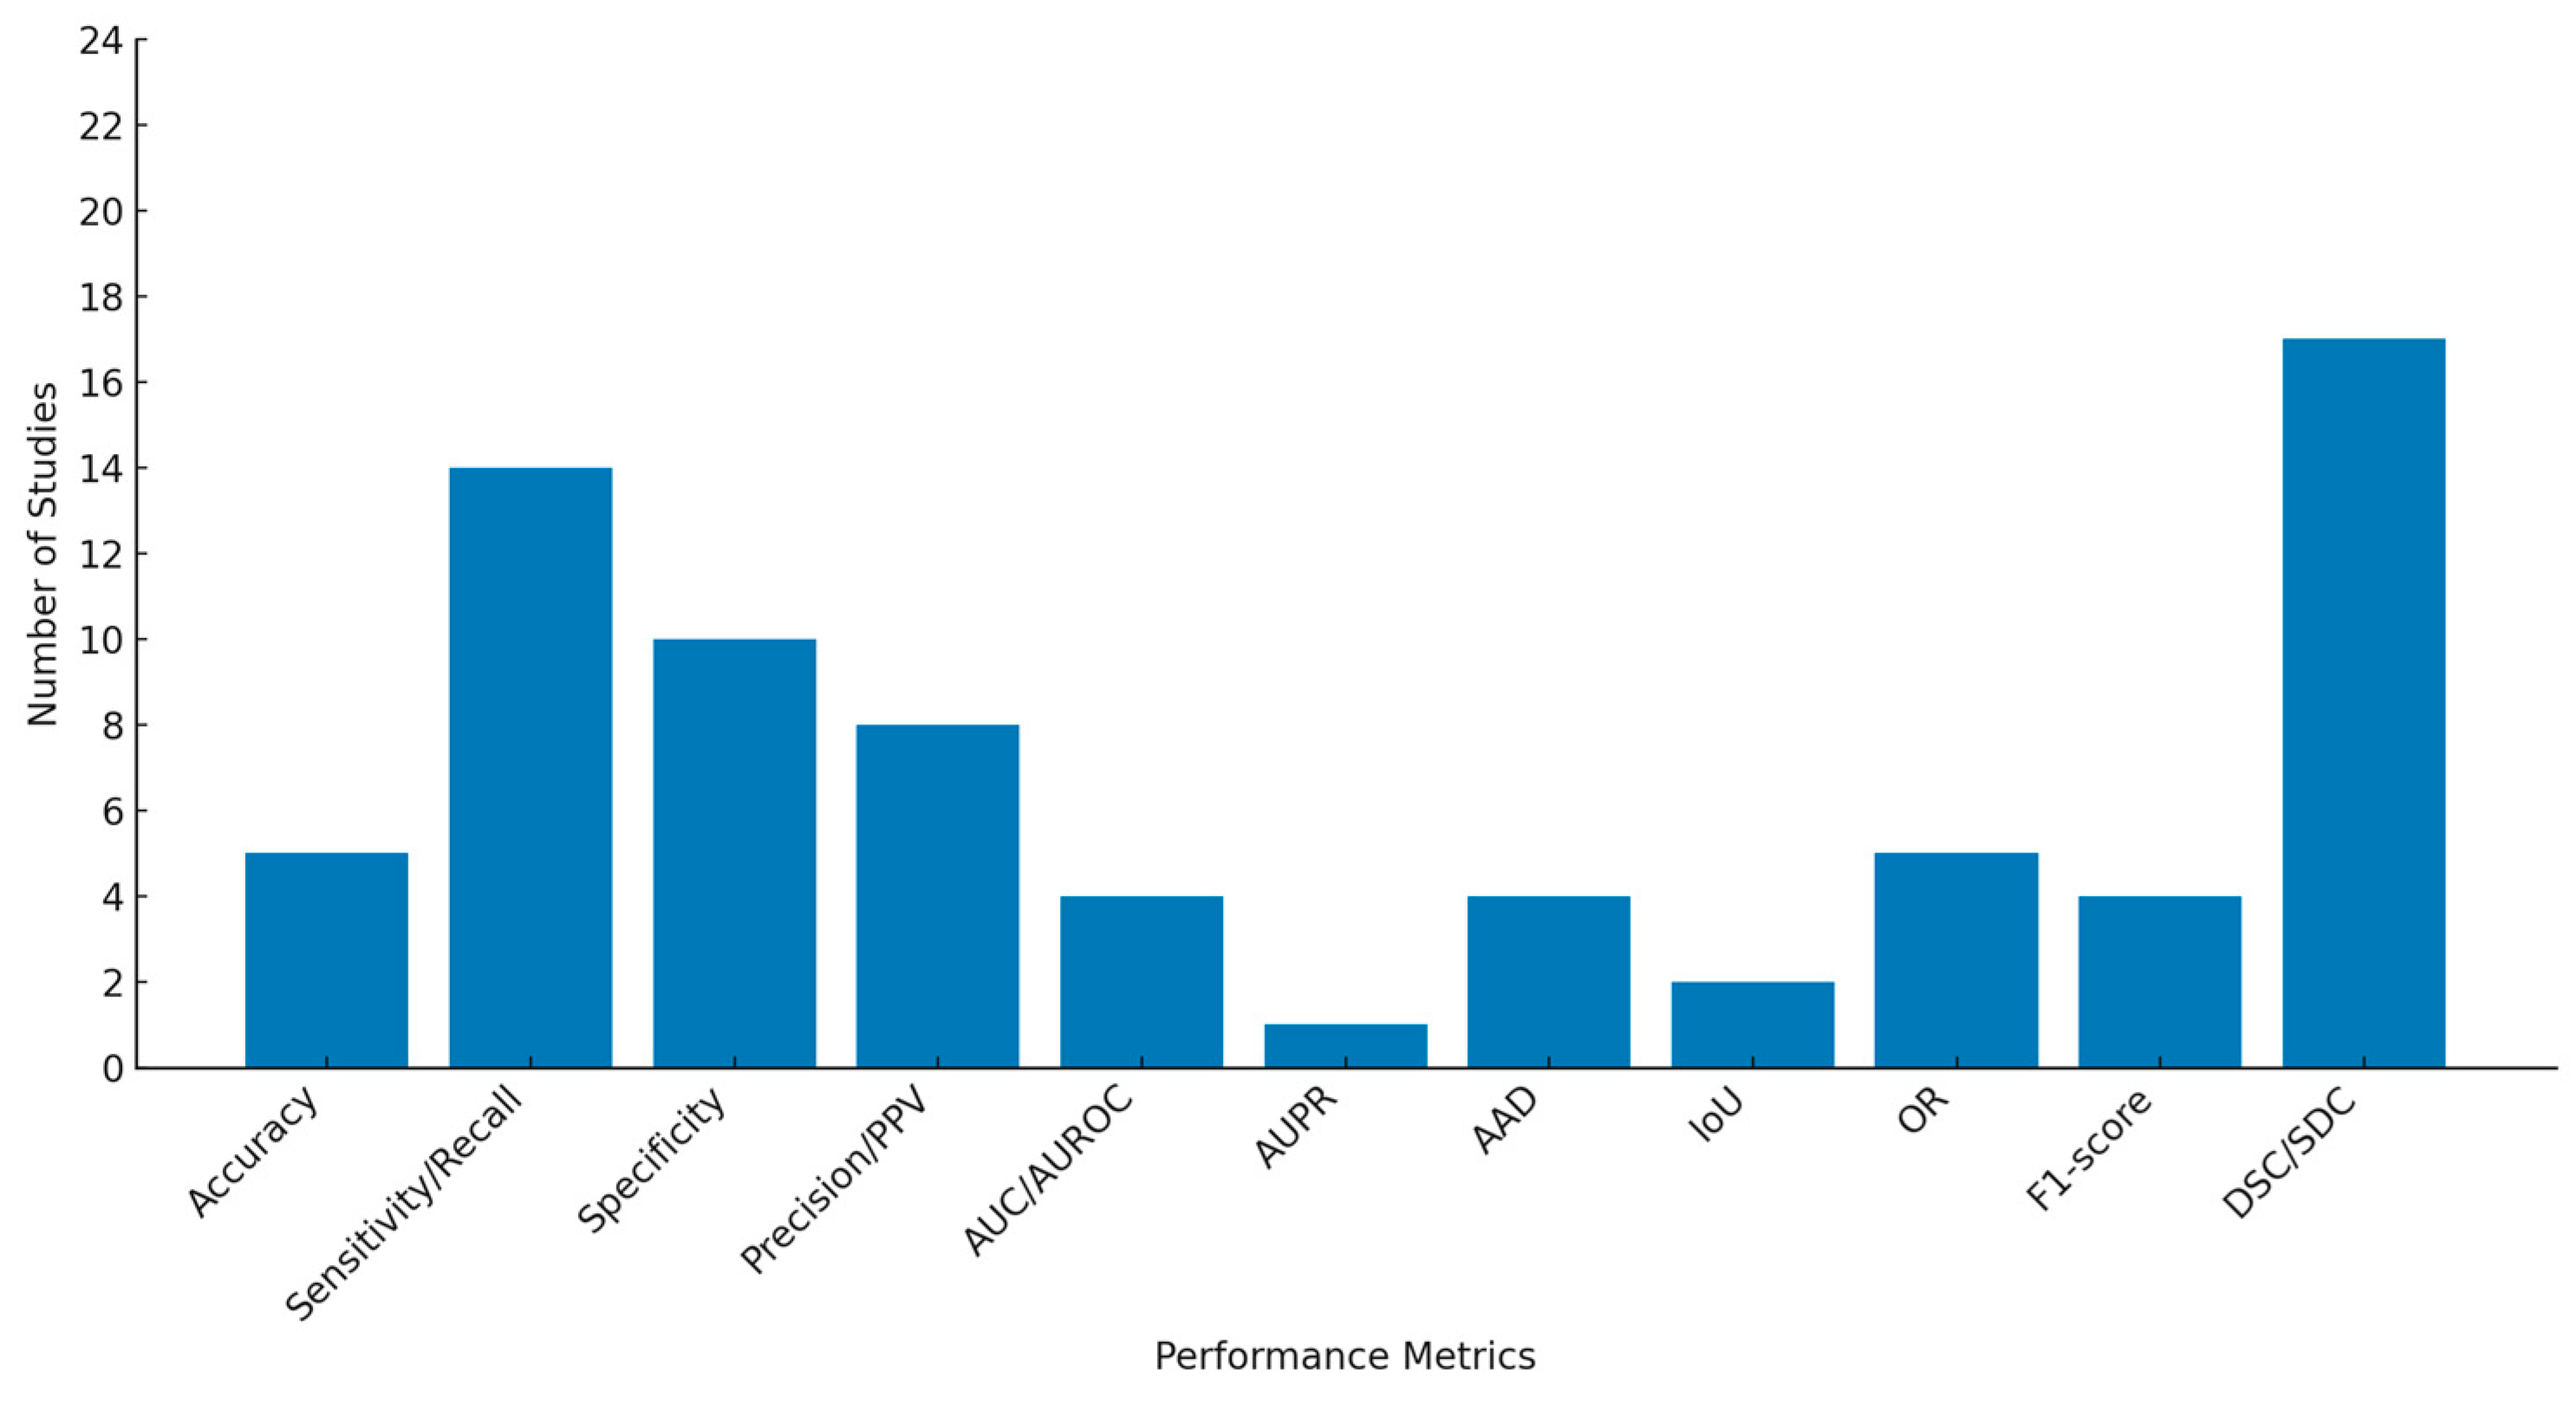
3.3. Characteristics of Included Studies

The 24 included studies, published between 2014 and 2024, show an overall increasing trend throughout the years (Figure 4a) and the vast geographical spread of AI research (Figure 4b). The studies’ authors are from 14 countries, with the largest contribution coming from the USA, followed by China.
Institutional or in-house datasets were used in 13 studies [34,35,36,37,38,39,40,41,42,43,44,45,46], while 3 other studies [47,48,49] relied on the frequently used datasets of Chen et al. [59]. The remaining studies [50,51,52,53,54,55,56] utilized subsets from different studies, randomized controlled trials (RCTs), or publicly available datasets and databases. One study [57] used both in-house patient data and a trial subcohort. Among the 24 studies analyzed, 19 [34,35,36,38,41,42,43,44,46,47,48,49,50,51,52,53,54,55,56] used datasets consisting of only GA images (with or without healthy controls), while the remaining studies [37,39,40,45,57] included datasets with a mix of GA cases and either earlier stages of AMD or other retinal diseases. Only five studies [35,36,39,44,56] adhered to the CAM* definitions of GA, incorporating the relevant prespecified imaging criteria into the model development process or distinguishing between the distinct atrophic stages.
We also observed that OCT and FAF were the two primary imaging modalities used in 15 [35,36,37,39,40,41,42,44,46,47,48,49,53,56,57] and 9 [34,38,42,45,46,50,53,54,55] of the studies, respectively, while CFPs were used in just 3 studies [51,52,54]. Only two studies [35,57] specified the use of swept-source optical coherence tomography (SS-OCT), while the rest utilized either spectral-domain optical coherence tomography (SD-OCT) [36,39,41,42,44,46,47,48,49,53,56] or did not clarify which type of OCT technology was employed [37,40]. A combination of modalities was identified in nine studies [41,42,44,46,47,48,53,54,55], three of which [41,47,48] used SD-OCT as the main imaging system and the corresponding FAF images as the GT annotation source, incorporating some degree of multimodality. Interestingly, three studies [37,39,52] used data from multiple manufacturers of the same imaging device type (various OCT or CFP models), providing valuable information on the generalizability across different technologies using the same modality, thus supporting broader applicability to a larger number of clinical settings.
The number of patients varied significantly, with one study recruiting only 10 patients [54], while another included 6953 patients with various retinal pathologies or healthy eyes, collected from an assemblage of different datasets [37]. Similarly, the dataset sizes fluctuated among the studies, ranging from 16 FAF images [38] to 100,266 OCT B-scans and 900 en face OCT images [39]. However, the datasets were not homogenous in type and contained different data formats (B-scan slices, images, OCT volumes, and cube scans), making absolute numerical comparisons futile and allowing for only broad stratification by size. The data partitioning in the training/validation/internal testing sets was not uniformly reported, with most of the included studies splitting the dataset either at the eye level, patient level, or image level, while four studies [43,46,48,54] provided no information on the division of the development data.
The ground-truth (reference standard) annotations were predominantly established manually by expert graders or ophthalmologists of varying expertise levels. We also documented several strategies to mitigate inter-grader variability and reduce the burden of manual high-volume annotation in a time- and cost-effective way. Those strategies include consensus-based grading, quantifying disagreement via several metrics (i.e., Cohen’s k, Intraclass Correlation Coefficient, Inter-grader DSC, etc.), delineating only selected B-scan slices from the OCT scan volumes, labeling the same images during two different sessions, and employing senior retina specialists to resolve discrepancies or correct the segmentation outcomes. One study used a previously validated ML model for retinal layer segmentation [39], while seven others [34,41,44,45,52,55,57] were assisted using segmentation software for distinct parts of the annotation process (RegionFinder, OCTAVO, Plex Elite Review, or an other non-commercial in-house software), often with a final reviewing and correction of the results by experts. The rest of the models relied solely on human-derived reference standards, with five studies [37,38,42,46,54] depending on single-grader annotations.
DL algorithms were the predominant approach in 87.5% of the studies, with convolutional neural networks (CNNs) employed in 19 studies [34,35,36,37,39,40,41,42,43,44,45,46,48,50,52,53,55,56,57]. U-Net and U-Net-like architectures were the most commonly adopted CNN variants, deployed with several modifications or adaptations in 12 studies [34,35,36,39,41,43,45,46,50,55,56,57]. Five studies did not rely on CNNs and utilized other custom ML/DL algorithms, like random forest classifiers [51], K-nearest neighbors (k-NN) [38], sparse autoencoders [47,49], or fuzzy c-means clustering [54].
While several studies included partially explainable features, like prediction maps or a feature importance analysis, comprehensive XAI techniques were reported in only five studies. These studies utilized class activation mapping (CAM)-based methods [40,48], saliency maps [48,50], probability maps [46], knowledge distillation-based anomaly localization heatmaps [40], and attention modules [45] to enhance the model’s post hoc interpretability.
Regarding the internal validation methods, k-fold cross-validation (k = 4, 5, or 8) was the most popular, encountered in 10 studies [34,36,38,41,44,45,48,50,52,57], followed by hold-out validation, which was applied in 8 studies [37,39,40,42,47,53,55,56]. At the same time, an external validation was conducted in 4 out of the 24 studies [41,50,52,56], with clinical study datasets being the most frequently employed. No real-world testing was performed in any of the included models.
The performance metrics varied across the studies, with the DSC and sensitivity (recall) being the most commonly reported, used in 17 [34,35,36,37,40,41,42,45,46,48,50,51,52,53,55,56,57] and 14 [34,35,36,37,38,39,41,43,44,45,51,54,56,57] studies, respectively, while the area under the precision-recall curve (AUPR), area under the receiver operating characteristic curve (AUROC), AUC, AAD, IoU, and F1 score were the least reported metrics.
The DSC values ranged from 0.680 to 0.978 for the internal testing and from 0.66 to 0.96 for the external testing. Among the four studies using external validation datasets, the performance tended to be higher compared to the internal validation results in three of the studies [41,50,56], suggesting that these models may have generalized well to the unseen data, or that the external datasets were more similar to the training data than expected. In contrast, the DSC in one study [52] remained almost unchanged between the internal and external testing datasets, but dropped significantly when non-GA cases were included in the unseen data cohort. The IoU and OR are two mathematically equivalent metrics for spatial overlap evaluation, offering a stricter assessment of over- or under-segmentation than the DSC [60]. These metrics were used in a total of seven studies [37,38,45,46,47,48,49], achieving a joint range of 0.606 to 0.9985.
The sensitivity values ranged from 47% to 100%; however, this metric may refer to either the GA segmentation, GA detection, or binary pixel classification. Most of the studies incorporated classification-related metrics (apart from strict segmentation evaluations), providing valuable additional information on model performance. Similarly, the overall specificity varied between 42% and 100%, and the accuracy ranged from 82% to 98%. The distribution frequencies of all the pre-selected evaluation metrics are depicted in Figure 5.
Table 4 presents the basic characteristics of each study regarding the datasets, imaging modalities, and annotation methods. Table 5 focuses on the segmentation methods, validation approaches, and data partitioning, and Table 6 displays the algorithm architecture, explainability, and performance evaluation of each model.

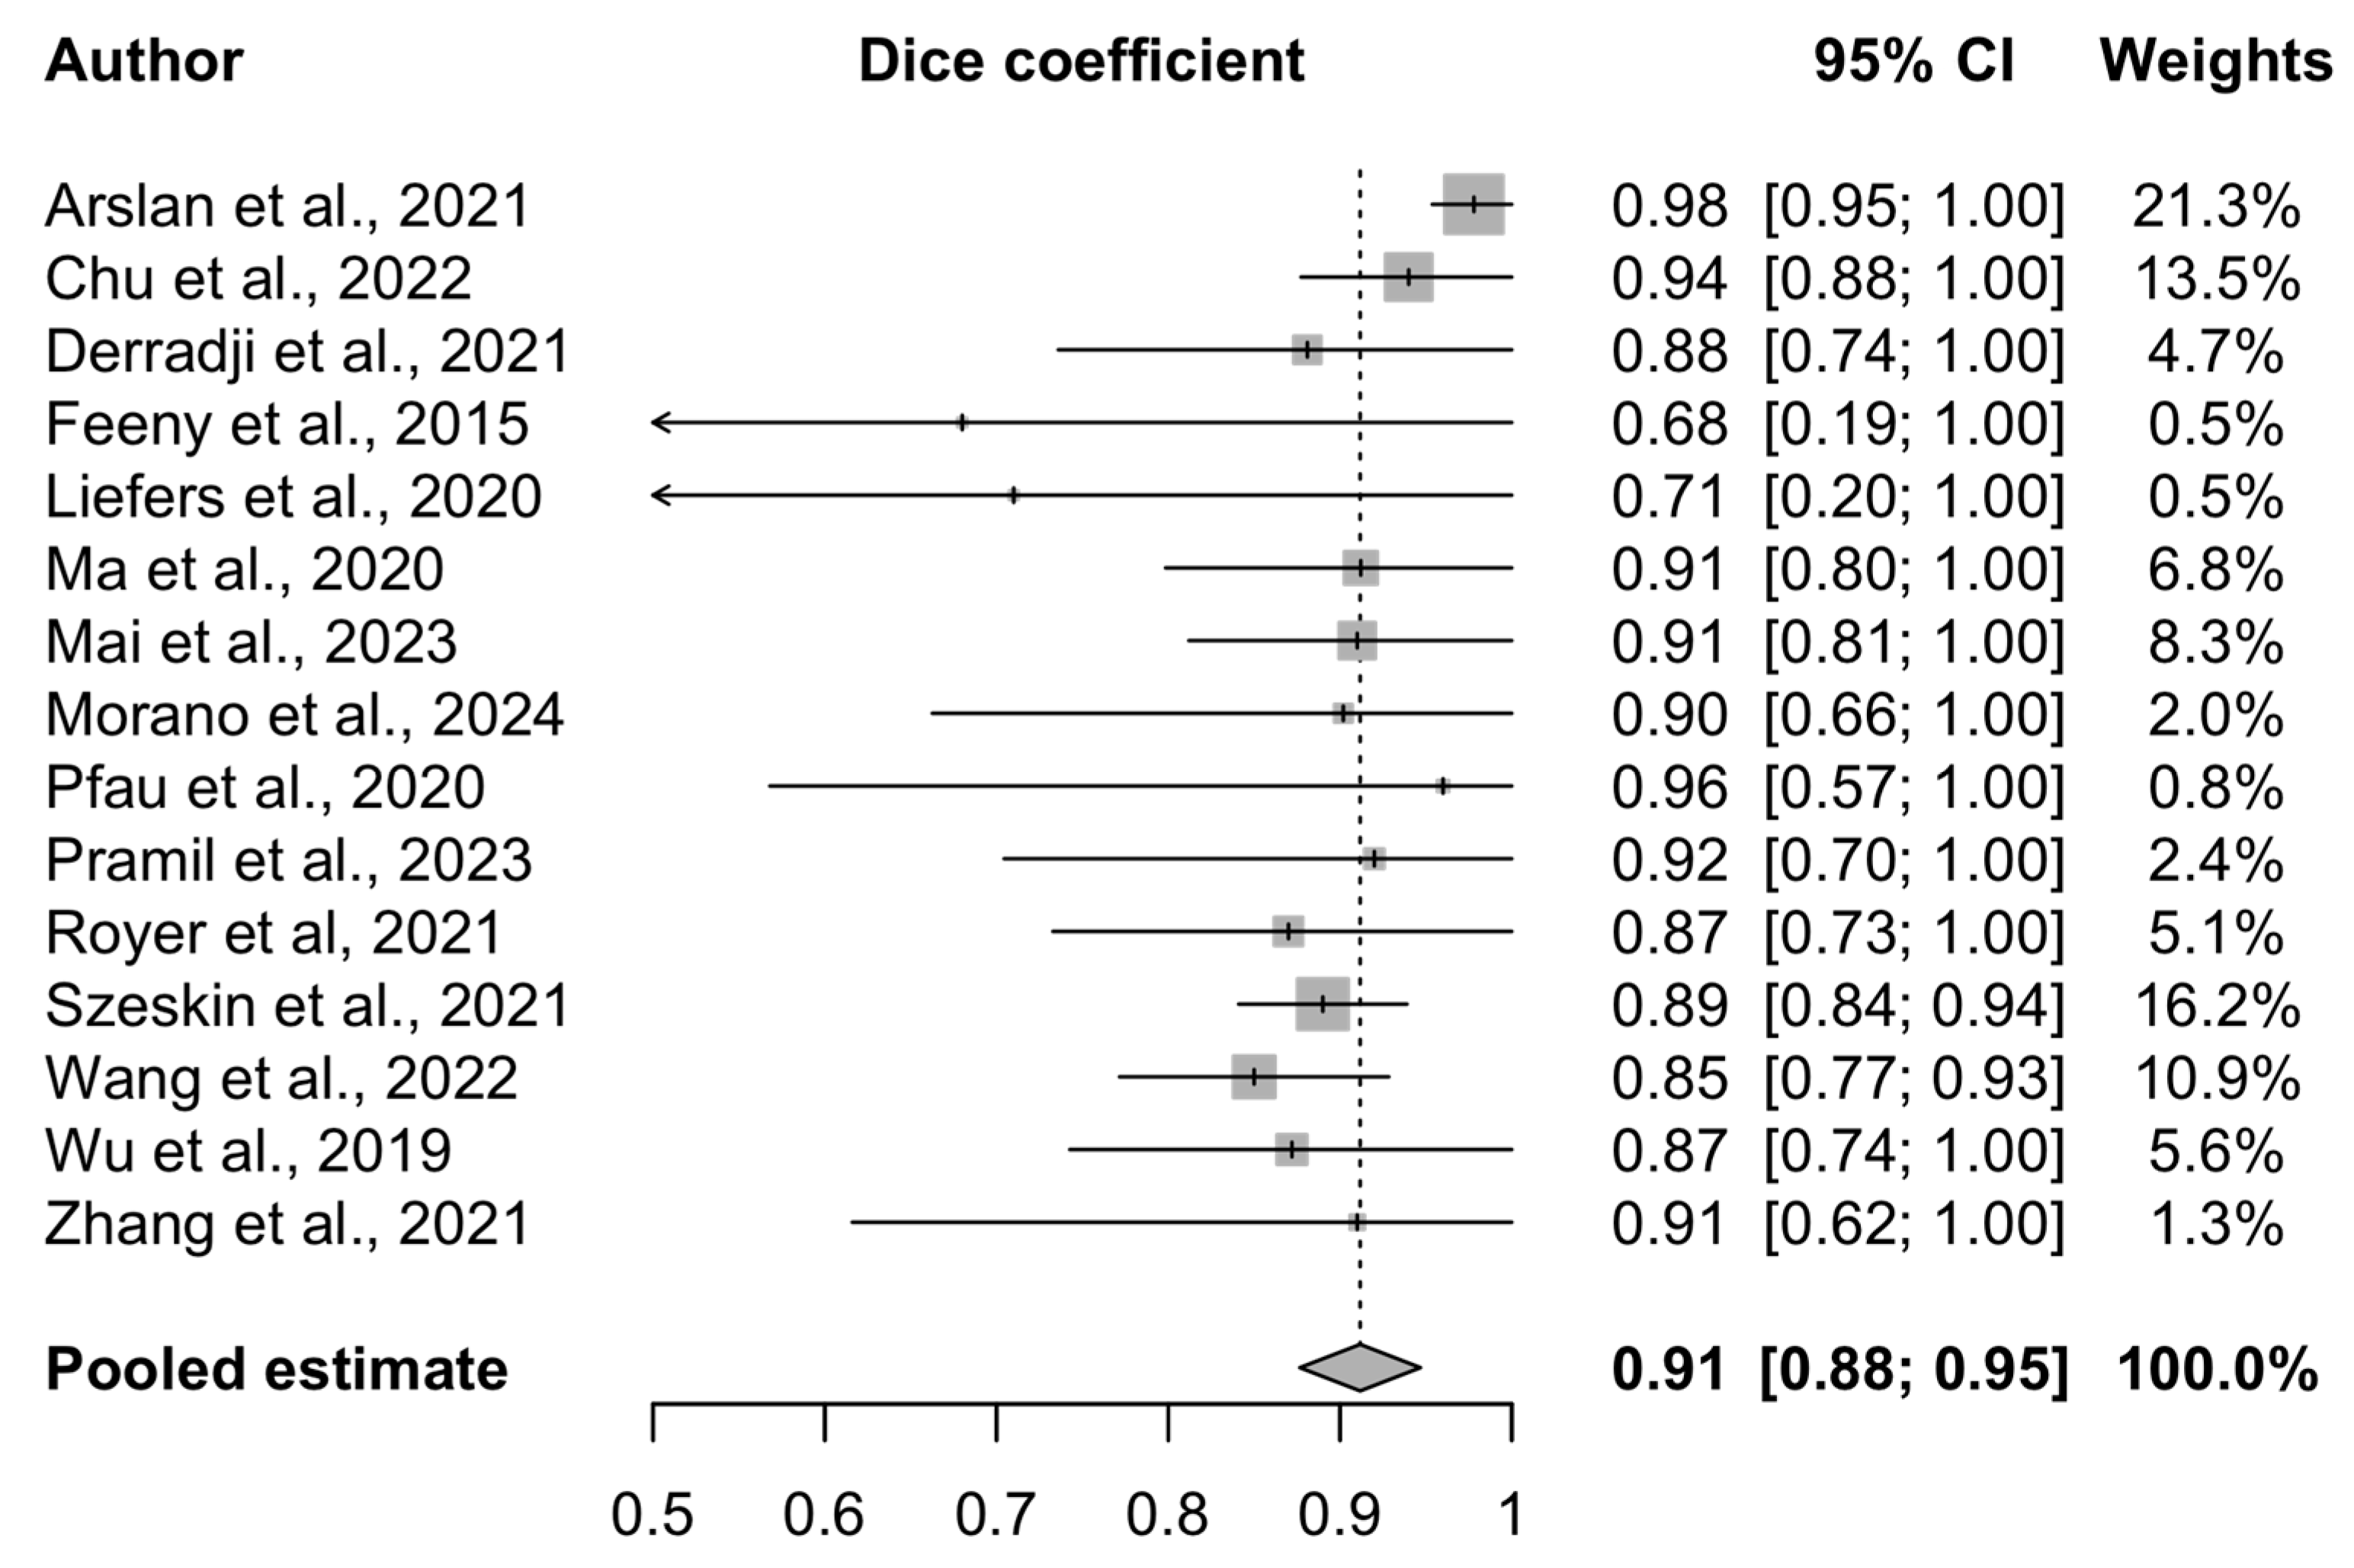
3.4. Meta-Analysis Results

The performance of the 15 AI models included in this analysis is presented in the forest plot (Figure 6). The pooled DSC is 0.91 (95% CI 0.88–0.95), indicating a high agreement between the predicted and reference segmentations. This high degree of overlap suggests that the AI algorithms perform at a clinically meaningful level and may support patient monitoring or assist in decision-making, particularly in high-volume clinical environments.
A random-effects model was used, and study weights were calculated using the inverse-variance method. This approach incorporates both the within-study variance (reflecting the sample size and standard error) and between-study heterogeneity (tau2), ensuring that the more precise studies exert a proportionally greater influence on the pooled estimate.
The Cochrane Q test yielded a value of 23.66 (p = 0.05), and the Higgins I2 statistic was 40.8% (95% CI 0–67.9%), suggesting moderate heterogeneity across the included studies. This likely reflects the differences in the AI architectures, imaging modalities, dataset sizes, and annotation practices. The study quality was not used as a weighting factor in the meta-analysis; however, the risk of bias was assessed separately and is presented in the corresponding section.

4. Discussion

GA segmentation is a valuable AI-driven innovation in both retinal research and clinical ophthalmic practice. The present systematic review summarizes the current literature and provides meaningful conclusions that will aid in advancing this evolving field lying at the intersection of medicine and technology.
A previous review by other researchers of AI-based approaches to GA evaluation identified 18 studies addressing GA segmentation [15]. The present systematic review excluded traditional image processing techniques and collected 24 pure AI models for further analysis. To the best of our knowledge, this is the first systematic review and meta-analysis focused on AI algorithms for GA segmentation. This comprehensive synthesis of performance metrics and model development strategies captures the current state-of-the-art, examines key challenges and limitations in the field, and proposes future directions for developing robust and clinically applicable models.
Although the earliest definitions of GA were based on CFP [5], only three studies [51,52,54] in our cohort presented AI models using this imaging modality, indicating that AI research is moving in parallel with newer imaging technologies that are better suited for GA assessment. The segmentation of atrophic lesions is suboptimal in CFP due to the low contrast or phenotypic variability [51], which allowed FAF to gain traction due to its inherent technological advantages, and ultimately become the preferred imaging modality in GA clinical trials [21]. Several of the studies included in our review highlight the notable differences in segmentation performance between CFP and FAF images. The literature generally indicates that CFP-based algorithms consistently show a lower performance due to media opacities, poor contrast, and variability in choroidal vessel presentation, which can hinder the clear delineation of atrophic lesions—even for expert graders [34,51,54]. In contrast, FAF provides a higher contrast between GA and the surrounding retina, enabling more accurate intensity-based segmentation [51]. However, FAF is not without limitations. Difficulties in assessing foveal involvement—due to natural autofluorescence suppression in the macula—and image artefacts, such as blurriness and shadowing, can impact segmentation accuracy [34,50,51]. Among the included studies, only one [54] directly compared segmentation outcomes using the same model applied to both CFP and FAF images, concluding that while FAF allowed for a more sensitive detection of GA, it introduced specific segmentation errors—particularly near the macular region—due to signal ambiguity. Future strategies combining CFP and FAF may enhance the delineation accuracy, particularly in parafoveal GA regions, by leveraging the complementary strengths of both modalities [51]. While most of the selected studies did not explicitly address the effect of the FAF wavelength on the segmentation performance, some reported reduced accuracy in the foveal regions, which may be partly attributed to macular pigment absorption—particularly relevant in short-wavelength (blue) FAF imaging acquired with confocal scanning laser ophthalmoscopy (cSLO) systems [34,54].
At the same time, the establishment of the CAM* criteria and the suggestion of OCT as the gold-standard modality for GA diagnosis and staging, along with its widespread clinical use, layer-by-layer analysis, and high sensitivity in the early atrophic stages [6], justify its dominance in our literature collection. As expected, all the included studies that adhered to the CAM* definitions and used OCT as the modality of choice were published after 2021, three years following the introduction of the consensus definitions in 2018 [6]. However, only five studies [35,36,39,44,56] followed the CAM* criteria, which may be attributed to the increased complexity of GA’s definition [4], along with the fact that the CAM* classification of GA subtypes relies exclusively on OCT B-scans, rendering it incompatible with models using FAF, CFP, or cSLO. Furthermore, studies have highlighted substantial inter-grader variability when the CAM* definitions are applied in real clinical settings, even among retina specialists, emphasizing the need for additional training before widespread implementation of the related terminology [61].
The majority of the included models were trained and evaluated on GA-exclusive datasets, likely to ensure precise segmentation performance without interference from other retinal pathologies. However, studies incorporating a broader range of conditions may provide insights into the models’ abilities to differentiate GA from other retinal abnormalities, which is crucial for real-world clinical applications. This highlights the trade-off between optimized segmentation performance in GA-only datasets and model generalizability in versatile datasets.
CNNs were the prevalent type of neural network architecture in 79.1% of the studies. They are widely used in many medical specialties for image localization tasks due to their efficient feature learning and extracting capabilities, which can often reach human-level accuracy [24]. U-Net, a well-established architecture for medical image analysis, was widely adopted in our literature cohort, either in its original, “vanilla” form [62], or one of its variants. Its simple structure, strong performance on small datasets, and ability to retain spatial details make it a popular choice for medical segmentation models [63].
The most frequently reported metric, the DSC, is considered the most suitable for evaluating the segmentation performance, as it quantifies the pixel-level degree of overlap between the predicted and ground-truth segmentation outputs [34]. Notably, when the DSC and F1 score—two numerically equivalent metrics that evaluate the spatial agreement between the predictions and reference standard [64]—are considered together, a combined total of 20 out of the 24 studies reported them, making overlap-based evaluation the predominant approach in assessing AI models for GA segmentation. The pooled DSC was 0.91 (0.88–0.95) among the studies included in this meta-analysis, indicating excellent AI model performance on GA segmentation, and suggesting its significant clinical and research promise. In everyday practice, however, there is significant variability in imaging results, lesion phenotypes, and patient characteristics. Therefore, even the strongest of models require rigorous validation before being widely adopted in healthcare. Identifying the weaknesses in current AI research on GA segmentation may facilitate the development of improved algorithms.
A commonly detected limitation was the relatively small dataset sizes, in terms of the number of images, patients, or eyes. Three studies [38,43,54] recruited 16 patients or fewer, and the smallest dataset sizes for each commonly used modality were noted in the three studies: one with 56 OCT volumes [46], one with 16 FAF images [38], and one with 26 FAF-CFP image pairs [54]. In general, the sample sizes have shown an increasing trend throughout the years, in line with the progress of AI technology and the need for scalable datasets for optimal performance; however, access to larger datasets is still limited. The scarcity of labeled GA imaging data could be addressed through several strategies, such as transfer learning, data augmentation, and synthetic data generation [65]. Additionally, collaboration between institutions using secure and nontraceable data-sharing frameworks could facilitate the collection of large, diverse datasets for robust AI model development [66].
In addition to dataset size, limitations related to GT quality and model validation practices were also observed. There was occasional reliance on single-grader GT establishment and a lack of inter-rater variability assessment, as five models [37,38,42,46,54] used annotations derived from one grader per image and three more studies [40,43,50] shared no information on the number of human graders involved. Six additional studies [35,39,45,49,51,53] utilized at least two graders/reviewers but did not calculate the inter- or intra-observer variability to assess the reliability of the GT. Manual delineations, across the medical imaging field, are known to be laborious and error-prone due to inter-rater disagreements, stressing the need for the measurable evaluation of the GT uncertainty during AI model development [67]. The reliance on annotations from a single grader or the absence of an inter-rater variability assessment can introduce biases into the training data, potentially leading AI models to learn subjective patterns. In an everyday routine, this could result in inconsistent performance across different scenarios, particularly when models encounter variations in the annotation styles of different clinicians.
Another important limitation was the low rate of external validation (only 16.7% of studies) [41,50,52,56], underlining the need for additional validation using unseen conditions. In real-world settings, segmentation tasks often encounter several challenges, like imaging artefacts, interfering noise, poor contrast, and GA lesions or general anatomic variability, raising the bar for algorithmic performance under difficult-to-segment conditions while maintaining reliable and accurate results [23]. AI models without external validation can be unreliable and clinically meaningless. We strongly encourage AI researchers to incorporate external testing into their work to overcome this significant limitation and produce robust and generalizable algorithms before exploiting their great clinical potential.
We also noted the limited use of XAI techniques, with only five studies [40,45,46,48,50] incorporating such methods. The overall lack of transparency in the AI literature on GA segmentation underscores the need for more XAI models in ophthalmology that, apart from performing impressively well, also demonstrate confidence, trustworthiness, and credibility. Overcoming this challenge is essential before these algorithms can be integrated into critical decision-making roles in clinical care [68]. Additionally, ambiguity in the XAI terminology, with no clear and consistent definitions across domains, makes the implementation and evaluation of such technologies challenging [27].
Furthermore, a lack of coherently reported evaluation metrics was also noted, with the studies using variable indices for model performance assessment. Four studies omitted the DSC or F1 [38,47,49,54], while three of them [38,47,49] used the overlap ratio for model–grader agreement evaluation. One study [54] showed inadequate evaluation reporting, mentioning only the sensitivity, specificity, false positives, and correct GA border identification, which is a non-standardized metric. The accuracy, AAD, precision, and AUC indices were insufficiently reported, potentially limiting the comparability of the segmentation studies. We strongly recommend the use of diverse evaluation metrics, as incorporating a range of measures offers a more comprehensive assessment of model performance, highlights the strengths and weaknesses, and promotes trust in AI-driven segmentation.
Another common limitation was the decline in model performance when evaluating small, irregular, extramacular, low-contrast, poorly illuminated, and blurry margin lesions, as well as in cases with drusen co-existence or interfering retinal blood vessels. These cases are common in routine practice and stress the importance of avoiding inappropriate exclusions or selecting “textbook examples” of GA for model development. Such models may struggle with borderline cases or overfit to ideal features. Again, we highlight the need for large, diverse GA datasets, as well as proper model training, validation, and external testing to overcome the aforementioned limitations [69].
Furthermore, our extensive CLAIM assessment results revealed inconsistencies among the studies. Future studies should adopt high reporting standards to enhance the reliability and reproducibility of their models. According to a 2019 systematic review of ML applications in medical imaging, only 2.4% of studies reported how they determined the sample size used [70], a limitation also observed in our study cohort. While the original review did not explore the reasons behind this omission, it underscores the need for standardized guidance on sample size justification in AI research. Clearly defining and reporting the sample size—particularly for the training, validation, and testing subsets—can support methodological rigor, and improve the efficiency and generalizability of AI models.
We also observed that only a small number of the studies incorporated patient demographic data or flowcharts detailing the inclusion/exclusion processes. While this information may seem redundant for training AI models, it contextualizes a dataset and exposes the underrepresented subpopulations. GA lesion variability among different ethnic groups has been documented [71]. Τherefore, epidemiological patient data are valuable for fair and unbiased medical AI models. At the same time, participant flow diagrams clarify the data selection process, help prevent data leakage, and contribute to overall transparency.
Another important aspect is the disclosure of patient data anonymization strategies, which were not comprehensively reported across the studies. The recent implementation of the AI Act [72] marks a significant effort towards regulating AI research while prioritizing personal safety and privacy. Especially in the case of healthcare-related models, the AI Act seeks to protect the potential leakage of patient medical records and, in conjunction with the General Data Protection Regulation (GDPR), obliges AI models to safeguard the fundamental rights of individuals and preserve their anonymity [73]. Other established regulatory efforts include the Health Insurance Portability and Accountability Act (HIPAA) and the European Health Data Space (EHDS), which also aim to preserve the security of patient records and promote responsible and transparent data handling [74]. AI models will henceforth be obliged to meet the requirements of these regulatory frameworks and employ strong de-identification strategies that protect sensitive patient data and other biometric information, while sharing the relevant details for enhanced reporting quality and transparency [33,75].
Equally important, the QUADAS-2 quality assessment indicated that AI developers should acknowledge that redundant exclusions may lower models’ real-world translation potential and present detailed model development information, especially any important standardization methods and performance cutoffs.
While the limitations of the included studies are evident, it is also important to acknowledge the limitations of our own review. This work presents a balanced report of the research efforts undertaken thus far on AI applications for GA segmentation, detailing 24 prominent studies and showcasing the impressive performance results of our meta-analysis while also charting the areas requiring further investigation or increased reporting attention. In terms of the quantitative synthesis, although moderate heterogeneity was observed across these studies, likely due to differences in the AI models and imaging sources, the random-effects model accounts for such variability. Future meta-analyses could benefit from subgroup analyses (e.g., by imaging modality or algorithm type) once a larger pool of standardized datasets and models becomes available. Regarding the broader review, we did not interrogate AI-targeted databases, such as IEEE Xplore or ACM Digital Library, potentially limiting the comprehensiveness of this review. However, our primary focus was on medical imaging for a specialized ophthalmic disease, GA, which was expected to be broadly referenced in the databases selected for this review. Furthermore, our manual search attempts did not yield additional relevant results. It is also important to acknowledge the possibility of publication bias, as studies reporting lower segmentation performance (e.g., lower DSC values) may be less likely to be published. This could lead to an overestimation of the pooled performance, despite our comprehensive and systematic search strategy. Another potential source of bias in our findings could be the lack of a clear GA definition and the concurrent introduction of the CAM* terminology. We chose not to focus solely on the retinal pigment epithelium and outer retinal atrophy (RORA), which—although precisely defined and structured as an imaging term—is still not widely utilized in everyday clinical practice, where GA remains the most frequent diagnosis. Our systematic review aimed to provide a concise summary of model performance under both GA and RORA umbrella terms, ultimately presenting findings with actual clinical value. We also recognize that the concept of segmentation in medical imaging can sometimes be mislabeled as “quantification” or “detection”, without a clear explanation of a model’s output and its agreement with our definition of GA segmentation. For this reason, we only included studies in which it was clearly evident that segmentation was correctly addressed. Lastly, at the time this review was conducted, no AI-specific quality assessment tools had been released and the tools we employed did not evaluate the integral parts of AI methodology, such as explainability or preprocessing bias.
Despite these limitations, the findings of our review highlight several important opportunities for the future advancement of AI-based GA segmentation. These approaches have the potential to deliver significant public health benefits by reducing clinical workloads, lowering the doctor-to-patient ratio, enhancing initial screening in remote areas, improving monitoring accuracy, and minimizing the risk of misdiagnoses or missed lesions. Additionally, AI models can optimize recruitment procedures for clinical trials with strict inclusion criteria and may assist in identifying novel biomarkers or endpoints, supporting the work of both clinicians and researchers.
To fully realize these benefits, several areas should be refined in future research. The development of GA-specific models trained on large, diverse, multicenter datasets is essential to ensure robust performance across real-world clinical scenarios. These datasets should encompass variability in image quality, GA phenotypes, and sociodemographic characteristics, and ideally be acquired through multimodal imaging platforms in accordance with local or international data protection regulations. External testing and clinical validation under unseen conditions are also critical for demonstrating the reliability and generalizability of AI models in clinical practice. Similarly, the challenge of manual labeling must be addressed through strategies, such as the creation of standardized annotation protocols, semi-automated labeling tools, or collaborative labeling efforts, which could improve the ground-truth quality while minimizing the time, cost, and labor.
While the primary focus of this review was not on predictive modeling or future progression algorithms, we recognize that the clinical value of segmentation models extends beyond static assessments. In particular, their utility in longitudinal studies—such as tracking GA progression and estimating annual growth rates—relies not only on segmentation accuracy but also on temporal consistency across serial scans. Advancing research in this area will be crucial for translating segmentation models into tools that can support long-term disease monitoring and structural endpoint assessments in drug trials.
Ongoing AI research is advancing at a high rate, with algorithms constantly improving and our understanding of their behavior steadily expanding. In addition to the current deep learning techniques, next-generation architectures, such as U-Net++ [76], V-Net [77], and diffusion models [78], are increasingly being explored and may lead to more refined and clinically applicable segmentation solutions. Moreover, explainable AI is becoming more common, helping make AI models easier to understand and more transparent, important features for gaining trust in clinical settings. The future of AI-based GA segmentation is highly promising, and the trajectory suggests it will significantly contribute to accurate, trustworthy, and high-precision ophthalmic care and research.

5. Conclusions

GA is a significant cause of compromised vision, and accurate lesion segmentation remains a complex and detailed process in both clinical and research contexts. AI offers the potential to automate, optimize, and scale this task, ultimately improving patient care. Our findings demonstrate the remarkable predictive capabilities of AI models for GA segmentation, highlighting the promising opportunities resulting from ongoing algorithmic advances. However, high performance alone is insufficient for clinical integration. Key challenges—including the need for improved explainability, robust external validation, and access to large, diverse datasets—must be addressed to ensure greater transparency, reliability, and generalizability. This review provides a comprehensive overview of the current capabilities and limitations of AI-based GA segmentation and offers a valuable foundation for future research. Addressing the current limitations will be essential for unlocking the full potential of AI in ophthalmology and facilitating its meaningful adoption in clinical care.

Supplementary Materials

The following supporting information can be downloaded at: https://www.mdpi.com/article/10.3390/bioengineering12050475/s1, Table S1: PRISMA 2020 checklist; Table S2: Database search terms and search strategy; Table S3: QUADAS-2* risk of bias and applicability assessment of included studies; Table S4: Assessment of AI reporting standards using CLAIM** checklist for included studies.

Author Contributions

Conceptualization, E.M.; methodology, E.M., A.C., and D.M.; validation, A.C. and E.M.; formal analysis, A.K.; investigation, A.C. and D.M.; writing—original draft preparation, AC; writing—review and editing E.M., A.C., and I.D.A.; graphical abstract, E.M.; visualization, E.M.; supervision, E.M., E.P., and I.G.; project administration, E.M. All authors have read and agreed to the published version of the manuscript.

Funding

This research received no external funding.

Acknowledgments

The authors would like to thank the reviewers for their valuable feedback and constructive comments, which helped improve the quality of this manuscript.

Conflicts of Interest

The authors declare no conflicts of interest.

Abbreviations

The following abbreviations are used in this manuscript:
AADAbsolute Area Difference
AIArtificial Intelligence
AIAAI Act
AMDAge-related Macular Degeneration
AUCArea Under the Curve
AUPRArea Under the Precision-Recall Curve
AUROCArea Under the Receiver Operating Characteristic Curve
BCVABest-Corrected Visual Acuity
CADComputer-Aided Diagnosis
CAMClass Activation Mapping
CAM*Classification of Atrophy Meetings
CFPColor Fundus Photography
CIConfidence Interval
CLAIMChecklist for Artificial Intelligence in Medical Imaging
CNNConvolutional Neural Network
cORAComplete Outer Retinal Atrophy
cRORAComplete Retinal Pigment Epithelium and Outer Retinal Atrophy
cSLOConfocal Scanning Laser Ophthalmoscopy
DLDeep Learning
DSCDice Similarity Coefficient
DSSDecision Support System
EHDSEuropean Health Data Space
FAFluorescein Angiography
FAFFundus Autofluorescence
GAGeographic Atrophy
GDPRGeneral Data Protection Regulation
GTGround Truth
HIPAAHealth Insurance Portability and Accountability Act
ICTRPInternational Clinical Trials Registry Platform
iORAIncomplete Outer Retinal Atrophy
IoUIntersection over Union
iRORAIncomplete Retinal Pigment Epithelium and Outer Retinal Atrophy
k-NNk-Nearest Neighbor
MLMachine Learning
NIRNear-Infrared Reflectance
OCTOptical Coherence Tomography
OROverlap Ratio
PICOSPopulation Intervention Comparator Outcome Study Design
PPVPositive Predictive Value
PRISMAPreferred Reporting Items for Systematic Reviews and Meta-Analyses
QUADAS-2Quality Assessment of the Diagnostic Accuracy Studies-2
RCTRandomized Controlled Trial
ROIRegion of Interest
RORARetinal Pigment Epithelium and Outer Retinal Atrophy
RPERetinal Pigment Epithelium
SDStandard Deviation
SD-OCTSpectral-Domain Optical Coherence Tomography
SS-OCTSwept-Source Optical Coherence Tomography
WHOWorld Health Organization

References

  1. Wong, W.L.; Su, X.; Li, X.; Cheung, C.M.; Klein, R.; Cheng, C.Y.; Wong, T.Y. Global prevalence of age-related macular degeneration and disease burden projection for 2020 and 2040: A systematic review and meta-analysis. Lancet Glob. Health 2014, 2, e106–e116. [Google Scholar] [CrossRef] [PubMed]
  2. Holz, F.G.; Strauss, E.C.; Schmitz-Valckenberg, S.; van Lookeren Campagne, M. Geographic Atrophy. Ophthalmology 2014, 121, 1079–1091. [Google Scholar] [CrossRef]
  3. Keenan, T.D.; Agrón, E.; Domalpally, A.; Clemons, T.E.; van Asten, F.; Wong, W.T.; Danis, R.G.; Sadda, S.; Rosenfeld, P.J.; Klein, M.L.; et al. Progression of Geographic Atrophy in Age-related Macular Degeneration. Ophthalmology 2018, 125, 1913–1928. [Google Scholar] [CrossRef]
  4. Schmitz-Valckenberg, S.; Sadda, S.; Staurenghi, G.; Chew, E.Y.; Fleckenstein, M.; Holz, F.G.; Group, C.A.M. GEOGRAPHIC ATROPHY: Semantic Considerations and Literature Review. Retina 2016, 36, 2250–2264. [Google Scholar] [CrossRef]
  5. Bird, A.C.; Bressler, N.M.; Bressler, S.B.; Chisholm, I.H.; Coscas, G.; Davis, M.D.; de Jong, P.T.; Klaver, C.C.; Klein, B.E.; Klein, R.; et al. An international classification and grading system for age-related maculopathy and age-related macular degeneration. The International ARM Epidemiological Study Group. Surv. Ophthalmol. 1995, 39, 367–374. [Google Scholar] [CrossRef] [PubMed]
  6. Sadda, S.R.; Guymer, R.; Holz, F.G.; Schmitz-Valckenberg, S.; Curcio, C.A.; Bird, A.C.; Blodi, B.A.; Bottoni, F.; Chakravarthy, U.; Chew, E.Y.; et al. Consensus Definition for Atrophy Associated with Age-Related Macular Degeneration on OCT: Classification of Atrophy Report 3. Ophthalmology 2018, 125, 537–548. [Google Scholar] [CrossRef]
  7. Kaiser, P.K.; Karpecki, P.M.; Regillo, C.D.; Baumal, C.; Ryan, E.H.; Ip, M.S.; Modi, Y.; Yeu, E.; Nijm, L.; Farid, M.; et al. Geographic Atrophy Management Consensus (GA-MAC): A Delphi panel study on identification, diagnosis and treatment. BMJ Open Ophthalmol. 2023, 8. [Google Scholar] [CrossRef]
  8. Shen, L.L.; Sun, M.; Ahluwalia, A.; Park, M.M.; Young, B.K.; Del Priore, L.V. Local Progression Kinetics of Geographic Atrophy Depends Upon the Border Location. Investig. Ophthalmol. Vis. Sci. 2021, 62, 28. [Google Scholar] [CrossRef] [PubMed]
  9. Schaal, K.B.; Rosenfeld, P.J.; Gregori, G.; Yehoshua, Z.; Feuer, W.J. Anatomic Clinical Trial Endpoints for Nonexudative Age-Related Macular Degeneration. Ophthalmology 2016, 123, 1060–1079. [Google Scholar] [CrossRef]
  10. Azad, R.; Aghdam, E.K.; Rauland, A.; Jia, Y.; Avval, A.H.; Bozorgpour, A.; Karimijafarbigloo, S.; Cohen, J.P.; Adeli, E.; Merhof, D. Medical Image Segmentation Review: The Success of U-Net. IEEE Trans. Pattern Anal. Mach. Intell. 2024, 46, 10076–10095. [Google Scholar] [CrossRef]
  11. Mharib, A.M.; Ramli, A.R.; Mashohor, S.; Mahmood, R.B. Survey on liver CT image segmentation methods. Artif. Intell. Rev. 2011, 37, 83–95. [Google Scholar] [CrossRef]
  12. Li, J.; Udupa, J.K.; Tong, Y.; Wang, L.; Torigian, D.A. Segmentation evaluation with sparse ground truth data: Simulating true segmentations as perfect/imperfect as those generated by humans. Med Image Anal. 2021, 69, 101980. [Google Scholar] [CrossRef] [PubMed]
  13. Philip, M.M.; Watts, J.; Moeini, S.N.M.; Musheb, M.; McKiddie, F.; Welch, A.; Nath, M. Comparison of semi-automatic and manual segmentation methods for tumor delineation on head and neck squamous cell carcinoma (HNSCC) positron emission tomography (PET) images. Phys. Med. Biol. 2024, 69, 095005. [Google Scholar] [CrossRef] [PubMed]
  14. Alzahrani, Y.; Boufama, B. Biomedical Image Segmentation: A Survey. SN Comput. Sci. 2021, 2, 310. [Google Scholar] [CrossRef]
  15. Arslan, J.; Samarasinghe, G.; Benke, K.K.; Sowmya, A.; Wu, Z.; Guymer, R.H.; Baird, P.N. Artificial Intelligence Algorithms for Analysis of Geographic Atrophy: A Review and Evaluation. Transl. Vis. Sci. Technol. 2020, 9, 57. [Google Scholar] [CrossRef]
  16. Arabahmadi, M.; Farahbakhsh, R.; Rezazadeh, J. Deep Learning for Smart Healthcare-A Survey on Brain Tumor Detection from Medical Imaging. Sensors 2022, 22, 1960. [Google Scholar] [CrossRef] [PubMed]
  17. Akkus, Z.; Galimzianova, A.; Hoogi, A.; Rubin, D.L.; Erickson, B.J. Deep Learning for Brain MRI Segmentation: State of the Art and Future Directions. J. Digit. Imaging 2017, 30, 449–459. [Google Scholar] [CrossRef]
  18. Paul, S.K.; Pan, I.; Sobol, W.M. A Systematic Review of Deep Learning Applications for Optical Coherence Tomography in Age-Related Macular Degeneration. Retina 2022, 42, 1417–1424. [Google Scholar] [CrossRef]
  19. Riedl, S.; Vogl, W.D.; Mai, J.; Reiter, G.S.; Lachinov, D.; Grechenig, C.; McKeown, A.; Scheibler, L.; Bogunovic, H.; Schmidt-Erfurth, U. The Effect of Pegcetacoplan Treatment on Photoreceptor Maintenance in Geographic Atrophy Monitored by Artificial Intelligence-Based OCT Analysis. Ophthalmol. Retin. 2022, 6, 1009–1018. [Google Scholar] [CrossRef]
  20. Chan, H.P.; Hadjiiski, L.M.; Samala, R.K. Computer-aided diagnosis in the era of deep learning. Med. Phys. 2020, 47, e218–e227. [Google Scholar] [CrossRef]
  21. Enzendorfer, M.L.; Schmidt-Erfurth, U. Artificial intelligence for geographic atrophy: Pearls and pitfalls. Curr. Opin. Ophthalmol. 2024, 35, 455–462. [Google Scholar] [CrossRef]
  22. Xu, Y.; Goodacre, R. On Splitting Training and Validation Set: A Comparative Study of Cross-Validation, Bootstrap and Systematic Sampling for Estimating the Generalization Performance of Supervised Learning. J. Anal. Test 2018, 2, 249–262. [Google Scholar] [CrossRef]
  23. Vlăsceanu, G.V.; Tarbă, N.; Voncilă, M.L.; Boiangiu, C.A. Selecting the Right Metric: A Detailed Study on Image Segmentation Evaluation. BRAIN Broad Res. Artif. Intell. Neurosci. 2024, 15, 295–318. [Google Scholar] [CrossRef]
  24. Sarvamangala, D.R.; Kulkarni, R.V. Convolutional neural networks in medical image understanding: A survey. Evol. Intell. 2022, 15, 1–22. [Google Scholar] [CrossRef] [PubMed]
  25. Oliveira, J.; Pereira, S.; Goncalves, L.; Ferreira, M.; Silva, C.A. Multi-surface segmentation of OCT images with AMD using sparse high order potentials. Biomed. Opt. Express 2017, 8, 281–297. [Google Scholar] [CrossRef] [PubMed]
  26. Adadi, A.; Berrada, M. Peeking Inside the Black-Box: A Survey on Explainable Artificial Intelligence (XAI). IEEE Access 2018, 6, 52138–52160. [Google Scholar] [CrossRef]
  27. Freyer, N.; Gross, D.; Lipprandt, M. The ethical requirement of explainability for AI-DSS in healthcare: A systematic review of reasons. BMC Med. Ethics 2024, 25, 104. [Google Scholar] [CrossRef]
  28. Page, M.J.; McKenzie, J.E.; Bossuyt, P.M.; Boutron, I.; Hoffmann, T.C.; Mulrow, C.D.; Shamseer, L.; Tetzlaff, J.M.; Akl, E.A.; Brennan, S.E.; et al. The PRISMA 2020 statement: An updated guideline for reporting systematic reviews. BMJ 2021, 372, n71. [Google Scholar] [CrossRef]
  29. Methley, A.M.; Campbell, S.; Chew-Graham, C.; McNally, R.; Cheraghi-Sohi, S. PICO, PICOS and SPIDER: A comparison study of specificity and sensitivity in three search tools for qualitative systematic reviews. BMC Health Serv. Res. 2014, 14, 579. [Google Scholar] [CrossRef]
  30. Bramer, W.M.; Milic, J.; Mast, F. Reviewing retrieved references for inclusion in systematic reviews using EndNote. J. Med. Libr. Assoc. 2017, 105, 84–87. [Google Scholar] [CrossRef]
  31. Ouzzani, M.; Hammady, H.; Fedorowicz, Z.; Elmagarmid, A. Rayyan-a web and mobile app for systematic reviews. Syst. Rev. 2016, 5, 210. [Google Scholar] [CrossRef] [PubMed]
  32. Whiting, P.F.; Rutjes, A.W.; Westwood, M.E.; Mallett, S.; Deeks, J.J.; Reitsma, J.B.; Leeflang, M.M.; Sterne, J.A.; Bossuyt, P.M.; QUADAS-2 Group. QUADAS-2: A revised tool for the quality assessment of diagnostic accuracy studies. Ann. Intern. Med. 2011, 155, 529–536. [Google Scholar] [CrossRef]
  33. Tejani, A.S.; Klontzas, M.E.; Gatti, A.A.; Mongan, J.T.; Moy, L.; Park, S.H.; Kahn, C.E., Jr.; Panel, C.U. Checklist for Artificial Intelligence in Medical Imaging (CLAIM): 2024 Update. Radiol. Artif. Intell. 2024, 6, e240300. [Google Scholar] [CrossRef] [PubMed]
  34. Arslan, J.; Samarasinghe, G.; Sowmya, A.; Benke, K.K.; Hodgson, L.A.B.; Guymer, R.H.; Baird, P.N. Deep Learning Applied to Automated Segmentation of Geographic Atrophy in Fundus Autofluorescence Images. Transl. Vis. Sci. Technol. 2021, 10, 2. [Google Scholar] [CrossRef] [PubMed]
  35. Chu, Z.; Wang, L.; Zhou, X.; Shi, Y.; Cheng, Y.; Laiginhas, R.; Zhou, H.; Shen, M.; Zhang, Q.; de Sisternes, L.; et al. Automatic geographic atrophy segmentation using optical attenuation in OCT scans with deep learning. Biomed. Opt. Express 2022, 13, 1328–1343. [Google Scholar] [CrossRef]
  36. Derradji, Y.; Mosinska, A.; Apostolopoulos, S.; Ciller, C.; De Zanet, S.; Mantel, I. Fully-automated atrophy segmentation in dry age-related macular degeneration in optical coherence tomography. Sci. Rep. 2021, 11, 21893. [Google Scholar] [CrossRef]
  37. Hassan, B.; Qin, S.; Hassan, T.; Ahmed, R.; Werghi, N. Joint Segmentation and Quantification of Chorioretinal Biomarkers in Optical Coherence Tomography Scans: A Deep Learning Approach. IEEE Trans. Instrum. Meas. 2021, 70, 2508817. [Google Scholar] [CrossRef]
  38. Hu, Z.; Medioni, G.G.; Hernandez, M.; Sadda, S.R. Automated segmentation of geographic atrophy in fundus autofluorescence images using supervised pixel classification. J. Med. Imaging 2015, 2, 014501. [Google Scholar] [CrossRef]
  39. Kalra, G.; Cetin, H.; Whitney, J.; Yordi, S.; Cakir, Y.; McConville, C.; Whitmore, V.; Bonnay, M.; Lunasco, L.; Sassine, A.; et al. Machine Learning-Based Automated Detection and Quantification of Geographic Atrophy and Hypertransmission Defects Using Spectral Domain Optical Coherence Tomography. J. Pers. Med. 2022, 13, 37. [Google Scholar] [CrossRef]
  40. Liu, X.; Liu, Q.; Zhang, Y.; Wang, M.; Tang, J. TSSK-Net: Weakly supervised biomarker localization and segmentation with image-level annotation in retinal OCT images. Comput. Biol. Med. 2023, 153, 106467. [Google Scholar] [CrossRef]
  41. Mai, J.; Lachinov, D.; Riedl, S.; Reiter, G.S.; Vogl, W.D.; Bogunovic, H.; Schmidt-Erfurth, U. Clinical validation for automated geographic atrophy monitoring on OCT under complement inhibitory treatment. Sci. Rep. 2023, 13, 7028. [Google Scholar] [CrossRef]
  42. Morano, J.; Aresta, G.; Grechenig, C.; Schmidt-Erfurth, U.; Bogunovic, H. Deep Multimodal Fusion of Data With Heterogeneous Dimensionality via Projective Networks. IEEE J. Biomed. Health Inform. 2024, 28, 2235–2246. [Google Scholar] [CrossRef] [PubMed]
  43. Royer, C.; Sublime, J.; Rossant, F.; Paques, M. Unsupervised Approaches for the Segmentation of Dry ARMD Lesions in Eye Fundus cSLO Images. J. Imaging 2021, 7, 143. [Google Scholar] [CrossRef] [PubMed]
  44. Szeskin, A.; Yehuda, R.; Shmueli, O.; Levy, J.; Joskowicz, L. A column-based deep learning method for the detection and quantification of atrophy associated with AMD in OCT scans. Med. Image Anal. 2021, 72, 102130. [Google Scholar] [CrossRef]
  45. Wang, Z.; Sadda, S.R.; Lee, A.; Hu, Z.J. Automated segmentation and feature discovery of age-related macular degeneration and Stargardt disease via self-attended neural networks. Sci. Rep. 2022, 12, 14565. [Google Scholar] [CrossRef]
  46. Wu, M.; Cai, X.; Chen, Q.; Ji, Z.; Niu, S.; Leng, T.; Rubin, D.L.; Park, H. Geographic atrophy segmentation in SD-OCT images using synthesized fundus autofluorescence imaging. Comput. Methods Programs Biomed. 2019, 182, 105101. [Google Scholar] [CrossRef]
  47. Ji, Z.; Chen, Q.; Niu, S.; Leng, T.; Rubin, D.L. Beyond Retinal Layers: A Deep Voting Model for Automated Geographic Atrophy Segmentation in SD-OCT Images. Transl. Vis. Sci. Technol. 2018, 7, 1. [Google Scholar] [CrossRef] [PubMed]
  48. Ma, X.; Ji, Z.; Niu, S.; Leng, T.; Rubin, D.L.; Chen, Q. MS-CAM: Multi-Scale Class Activation Maps for Weakly-Supervised Segmentation of Geographic Atrophy Lesions in SD-OCT Images. IEEE J. Biomed. Health Inform. 2020, 24, 3443–3455. [Google Scholar] [CrossRef]
  49. Xu, R.; Niu, S.; Chen, Q.; Ji, Z.; Rubin, D.; Chen, Y. Automated geographic atrophy segmentation for SD-OCT images based on two-stage learning model. Comput. Biol. Med. 2019, 105, 102–111. [Google Scholar] [CrossRef]
  50. Domalpally, A.; Slater, R.; Linderman, R.E.; Balaji, R.; Bogost, J.; Voland, R.; Pak, J.; Blodi, B.A.; Channa, R.; Fong, D.; et al. Strong versus Weak Data Labeling for Artificial Intelligence Algorithms in the Measurement of Geographic Atrophy. Ophthalmol. Sci. 2024, 4, 100477. [Google Scholar] [CrossRef]
  51. Feeny, A.K.; Tadarati, M.; Freund, D.E.; Bressler, N.M.; Burlina, P. Automated segmentation of geographic atrophy of the retinal epithelium via random forests in AREDS color fundus images. Comput. Biol. Med. 2015, 65, 124–136. [Google Scholar] [CrossRef] [PubMed]
  52. Liefers, B.; Colijn, J.M.; Gonzalez-Gonzalo, C.; Verzijden, T.; Wang, J.J.; Joachim, N.; Mitchell, P.; Hoyng, C.B.; van Ginneken, B.; Klaver, C.C.W.; et al. A Deep Learning Model for Segmentation of Geographic Atrophy to Study Its Long-Term Natural History. Ophthalmology 2020, 127, 1086–1096. [Google Scholar] [CrossRef] [PubMed]
  53. Pfau, M.; von der Emde, L.; de Sisternes, L.; Hallak, J.A.; Leng, T.; Schmitz-Valckenberg, S.; Holz, F.G.; Fleckenstein, M.; Rubin, D.L. Progression of Photoreceptor Degeneration in Geographic Atrophy Secondary to Age-related Macular Degeneration. JAMA Ophthalmol. 2020, 138, 1026–1034. [Google Scholar] [CrossRef] [PubMed]
  54. Ramsey, D.J.; Sunness, J.S.; Malviya, P.; Applegate, C.; Hager, G.D.; Handa, J.T. Automated image alignment and segmentation to follow progression of geographic atrophy in age-related macular degeneration. Retina 2014, 34, 1296–1307. [Google Scholar] [CrossRef]
  55. Spaide, T.; Jiang, J.; Patil, J.; Anegondi, N.; Steffen, V.; Kawczynski, M.G.; Newton, E.M.; Rabe, C.; Gao, S.S.; Lee, A.Y.; et al. Geographic Atrophy Segmentation Using Multimodal Deep Learning. Transl. Vis. Sci. Technol. 2023, 12, 10. [Google Scholar] [CrossRef]
  56. Zhang, G.; Fu, D.J.; Liefers, B.; Faes, L.; Glinton, S.; Wagner, S.; Struyven, R.; Pontikos, N.; Keane, P.A.; Balaskas, K. Clinically relevant deep learning for detection and quantification of geographic atrophy from optical coherence tomography: A model development and external validation study. Lancet Digit. Health 2021, 3, e665–e675. [Google Scholar] [CrossRef]
  57. Pramil, V.; de Sisternes, L.; Omlor, L.; Lewis, W.; Sheikh, H.; Chu, Z.; Manivannan, N.; Durbin, M.; Wang, R.K.; Rosenfeld, P.J.; et al. A Deep Learning Model for Automated Segmentation of Geographic Atrophy Imaged Using Swept-Source OCT. Ophthalmol. Retin. 2023, 7, 127–141. [Google Scholar] [CrossRef]
  58. Kocak, B.; Keles, A.; Akinci D’Antonoli, T. Self-reporting with checklists in artificial intelligence research on medical imaging: A systematic review based on citations of CLAIM. Eur. Radiol. 2024, 34, 2805–2815. [Google Scholar] [CrossRef]
  59. Chen, Q.; de Sisternes, L.; Leng, T.; Zheng, L.; Kutzscher, L.; Rubin, D.L. Semi-automatic geographic atrophy segmentation for SD-OCT images. Biomed. Opt. Express 2013, 4, 2729–2750. [Google Scholar] [CrossRef]
  60. Muller, D.; Soto-Rey, I.; Kramer, F. Towards a guideline for evaluation metrics in medical image segmentation. BMC Res. Notes 2022, 15, 210. [Google Scholar] [CrossRef]
  61. Chandra, S.; Rasheed, R.; Sen, P.; Menon, D.; Sivaprasad, S. Inter-rater reliability for diagnosis of geographic atrophy using spectral domain OCT in age-related macular degeneration. Eye 2022, 36, 392–397. [Google Scholar] [CrossRef] [PubMed]
  62. Ronneberger, O.; Fischer, P.; Brox, T. U-net: Convolutional networks for biomedical image segmentation. In Proceedings of the Medical Image Computing and Computer-Assisted Intervention–MICCAI 2015: 18th International Conference, Munich, Germany, 5–9 October 2015; pp. 234–241. [Google Scholar]
  63. Siddique, N.; Paheding, S.; Elkin, C.P.; Devabhaktuni, V. U-Net and Its Variants for Medical Image Segmentation: A Review of Theory and Applications. IEEE Access 2021, 9, 82031–82057. [Google Scholar] [CrossRef]
  64. Asgari Taghanaki, S.; Abhishek, K.; Cohen, J.P.; Cohen-Adad, J.; Hamarneh, G. Deep semantic segmentation of natural and medical images: A review. Artif. Intell. Rev. 2020, 54, 137–178. [Google Scholar] [CrossRef]
  65. Piffer, S.; Ubaldi, L.; Tangaro, S.; Retico, A.; Talamonti, C. Tackling the small data problem in medical image classification with artificial intelligence: A systematic review. Prog. Biomed. Eng. 2024, 6, 032001. [Google Scholar] [CrossRef] [PubMed]
  66. Dow, E.R.; Keenan, T.D.L.; Lad, E.M.; Lee, A.Y.; Lee, C.S.; Loewenstein, A.; Eydelman, M.B.; Chew, E.Y.; Keane, P.A.; Lim, J.I.; et al. From Data to Deployment: The Collaborative Community on Ophthalmic Imaging Roadmap for Artificial Intelligence in Age-Related Macular Degeneration. Ophthalmology 2022, 129, e43–e59. [Google Scholar] [CrossRef]
  67. Yang, F.; Zamzmi, G.; Angara, S.; Rajaraman, S.; Aquilina, A.; Xue, Z.; Jaeger, S.; Papagiannakis, E.; Antani, S.K. Assessing Inter-Annotator Agreement for Medical Image Segmentation. IEEE Access 2023, 11, 21300–21312. [Google Scholar] [CrossRef] [PubMed]
  68. Chaddad, A.; Peng, J.; Xu, J.; Bouridane, A. Survey of Explainable AI Techniques in Healthcare. Sensors 2023, 23, 634. [Google Scholar] [CrossRef]
  69. Eche, T.; Schwartz, L.H.; Mokrane, F.Z.; Dercle, L. Toward Generalizability in the Deployment of Artificial Intelligence in Radiology: Role of Computation Stress Testing to Overcome Underspecification. Radiol. Artif. Intell. 2021, 3, e210097. [Google Scholar] [CrossRef]
  70. Balki, I.; Amirabadi, A.; Levman, J.; Martel, A.L.; Emersic, Z.; Meden, B.; Garcia-Pedrero, A.; Ramirez, S.C.; Kong, D.; Moody, A.R.; et al. Sample-Size Determination Methodologies for Machine Learning in Medical Imaging Research: A Systematic Review. Can. Assoc. Radiol. J. 2019, 70, 344–353. [Google Scholar] [CrossRef]
  71. Teo, K.Y.C.; Fujimoto, S.; Sadda, S.R.; Kokame, G.; Gomi, F.; Kim, J.E.; Cheng, M.F.S.; Corradetti, G.; Amornpetchsathaporn, A.; Chainakul, M.; et al. Geographic Atrophy Phenotypes in Subjects of Different Ethnicity: Asia-Pacific Ocular Imaging Society Work Group Report 3. Ophthalmol. Retin. 2023, 7, 593–604. [Google Scholar] [CrossRef]
  72. European Parliament. EU AI Act: First Regulation on Artificial Intelligence (n.d.); European Parliament: Strasbourg, France, 2023; Available online: https://www.europarl.europa.eu/topics/en/article/20230601STO93804/eu-ai-act-first-regulation-on-artificial-intelligence (accessed on 31 March 2025).
  73. Aboy, M.; Minssen, T.; Vayena, E. Navigating the EU AI Act: Implications for regulated digital medical products. NPJ Digit. Med. 2024, 7, 237. [Google Scholar] [CrossRef] [PubMed]
  74. Ho, C.H. Secondary Use of Health Data for Medical AI: A Cross-Regional Examination of Taiwan and the EU. Asian Bioeth. Rev. 2024, 16, 407–422. [Google Scholar] [CrossRef] [PubMed]
  75. Kondylakis, H.; Catalan, R.; Alabart, S.M.; Barelle, C.; Bizopoulos, P.; Bobowicz, M.; Bona, J.; Fotiadis, D.I.; Garcia, T.; Gomez, I.; et al. Documenting the de-identification process of clinical and imaging data for AI for health imaging projects. Insights Imaging 2024, 15, 130. [Google Scholar] [CrossRef] [PubMed]
  76. Zhou, Z.; Siddiquee, M.M.R.; Tajbakhsh, N.; Liang, J. UNet++: A Nested U-Net Architecture for Medical Image Segmentation. In Deep Learning in Medical Image Analysis and Multimodal Learning for Clinical Decision Support; Stoyanov, D., Taylor, Z., Carneiro, G., Syeda-Mahmood, T., Eds.; Lecture Notes in Computer Science; Springer: Cham, Switzerland, 2018; Volume 11045, pp. 3–11. [Google Scholar]
  77. Minaee, S.; Boykov, Y.; Porikli, F.; Plaza, A.; Kehtarnavaz, N.; Terzopoulos, D. Image Segmentation Using Deep Learning: A Survey. IEEE Trans. Pattern Anal. Mach. Intell. 2022, 44, 3523–3542. [Google Scholar] [CrossRef]
  78. Liu, Z.; Ma, C.; She, W.; Xie, M. Biomedical Image Segmentation Using Denoising Diffusion Probabilistic Models: A Comprehensive Review and Analysis. Appl. Sci. 2024, 14, 632. [Google Scholar] [CrossRef]
Figure 1. PRISMA flowchart of study selection process.
Bioengineering 12 00475 g001
Figure 2. QUADAS-2 traffic light plot for risk of bias and applicability assessment of the included studies [34,35,36,37,38,39,40,41,42,43,44,45,46,47,48,49,50,51,52,53,54,55,56,57].
Bioengineering 12 00475 g002
Figure 3. CLAIM checklist compliance per included study (%) [34,35,36,37,38,39,40,41,42,43,44,45,46,47,48,49,50,51,52,53,54,55,56,57].
Bioengineering 12 00475 g003
Figure 4. Publication trends by year (a) and country (b).
Bioengineering 12 00475 g004
Figure 5. Distribution of performance metrics across included studies.
Bioengineering 12 00475 g005
Figure 6. Forest plot of included studies [34,35,36,41,42,43,44,45,46,48,51,52,53,56,57] assessing AI model performance for geographic atrophy segmentation.
Bioengineering 12 00475 g006
Table 1. PICOS criteria for study selection.
PICOSDescription
PopulationAdult patients with geographic atrophy due to advanced dry age-related macular degeneration.
InterventionArtificial intelligence algorithms for the segmentation of geographic atrophy. Various AI tools trained to
automatically delineate geographic atrophy lesions using different retinal imaging modalities (CFP, OCT, FAF, etc.).
ComparatorAlternative segmentation methods: manual segmentation performed by human experts, validated
semi-automated segmentation techniques, or other software-assisted methods.
OutcomesAccuracy and efficacy of artificial intelligence techniques for segmenting geographic atrophy
as measured through performance metrics (sensitivity, specificity, AUC, F1 score, IoU, DSC, etc.).
Study DesignStudies included observational studies, randomized clinical trials, and registry/database studies.
Additional DetailsLanguage: English.
Time frame: from inception to 23 March 2024.
Location: worldwide.
AUC (area under the curve); CFP (color fundus photography); DSC (Dice similarity coefficient); FAF (fundus autofluorescence); IoU (intersection over union); OCT (optical coherence tomography).
Table 2. Eligibility criteria for study selection.
Inclusion CriteriaExclusion Criteria
Observational studies, randomized clinical trials,
registry/database studies.
Systematic reviews, meta-analyses, narrative reviews, scoping reviews,
opinion pieces, surveys, editorials, commentary letters, case reports,
book chapters, conference abstracts, proceedings, or presentations.
Studies using artificial intelligence techniques.Studies using traditional image processing techniques.
Studies including eyes of adult patients.Studies including pediatric patients, geographic atrophy due to
neovascular age-related macular degeneration, or non-human studies.
Studies addressing geographic atrophy lesion segmentation with the use of artificial intelligence segmentation techniques.Studies addressing solely geographic atrophy diagnosis,
classification, progression, future prediction, treatment response,
area quantification, or retinal layer-by-layer segmentation.
Studies reporting at least one of the following metrics:
accuracy, sensitivity/recall, specificity, precision/PPV,
F1 score, AUC/AUROC, AUPR, IoU/OR, DSC/SDC, or AAD.
Studies without clear documentation of the purpose, dataset,
data sources, patient distribution, methods, results, or conclusions.
Articles published in English language.Ineligible population and ineligible outcome.
Articles with full text unavailable.
AAD (absolute area difference); AUC (area under the curve); AUPR (area under the precision-recall curve); AUROC (area under the receiver operating characteristic curve); DSC (Dice similarity coefficient); IoU (intersection over union); OR (overlap ratio); PPV (positive predictive value); SDC (symmetric Dice coefficient).
Table 3. Categories of extracted data.
Category Description
Study information
  • Author
  • Year
  • Country (affiliations of all contributing authors)
Dataset and annotation methods
  • Diseases (all diseases included in the datasets)
  • CAM* (adherence to CAM* consensus definitions of geographic atrophy) [6]
  • Dataset (datasets used for model development)
  • Imaging modality (main imaging devices used by the model, specifying those used for model development and those used for ground truth establishment, including manufacturer details when reported)
  • Total patients/eyes (number of patients and eyes used for model development)
  • Total sample size (size and type of data contained in the datasets)
  • GA sample size (% of dataset) (size of geographic atrophy segmentation subset and its percentage relative to the entire development dataset)
  • Ground truth (strategy used for reference standard establishment)
AI model characteristics and validation strategy
  • AI type (deep learning or machine learning)
  • AI algorithm (basic model architecture)
  • Segmentation technique (brief description of the geographic atrophy segmentation method)
  • XAI (use of explainable AI techniques and the approach applied)
  • Internal validation method (approach used during model training to evaluate performance and prevent overfitting, such as k-fold cross-validation, hold-out validation, etc.)
  • Training set/validation set/internal test set (size and type of data partitioning for each geographic atrophy segmentation model)
  • External test set (use of an unseen independent dataset, including dataset name and size when reported)
Model performance evaluation
  • Performance metrics for internal and external testing (reporting of accuracy, sensitivity/recall, specificity, precision/PPV, F1 score, AUC/AUROC, AUPR, IoU/OR, DSC/SDC, and AAD for geographic atrophy segmentation)
AAD (absolute area difference); AUC (area under the curve); AUPR (area under the precision-recall curve); AUROC (area under the receiver operating characteristic curve); CAM* (Classification of Atrophy Meetings); DSC (Dice similarity coefficient); GA (geographic atrophy); IoU (intersection over union); OR (overlap ratio); PPV (positive predictive value); SDC (symmetric Dice coefficient); XAI (explainable artificial intelligence).
Table 4. Study characteristics of datasets and annotation methods.
Author
(Year)
CountryDiseasesCAM*DatasetImaging
Modality
Total
pts/Eyes
Total
Sample Size
GA Sample Size
(% of Dataset)
Ground Truth
Arslan
(2021) [34]
AustraliaGA
secondary
to dry AMD
NoInstitutional
dataset
(Centre for Eye
Research
Australia)
and private
dataset
FAF
(Heidelberg Spectralis)
51/99 702
FAF images
702
FAF images
(100% of dataset)
Manual annotation of FAF by principal grader, additional grading of subset by
senior grader for GT evaluation,
and RegionFinder software
outputs for comparison.
Chu
(2022) [35]
USAGA and HealthyYesInstitutional
dataset
(part of the
University
of Miami)
SS-OCT
(PLEX Elite 9000 Carl Zeiss)
115/140184
OCT scans
124
OCT scans
(67.3% of dataset)
Manual annotation by 2 independent graders
reaching consensus on the en face subRPE
OCT images (with senior adjudicator).
Derradji
(2021) [36]
Switzerland Atrophic AMD with RORA and Healthy YesInstitutional
dataset
(JG Eye Hospital
Medical Retinal
Department)
SD-OCT
(Heidelberg Spectralis)
57/6262
OCT volumes
(3595 B-scans)
2085
B-scans with RORA
(58% of dataset)
Manual annotation by 2 expert graders
(senior and junior).
Domalpally
(2024) [50]
USAGANoAREDS2 subsetFAF
(Heidelberg
Spectralis HRA)
271/362 601
FAF images
601
FAF images
(100% of dataset)
Manual GA demarcation by certified graders.
Feeny
(2015) [51]
USA
Thailand
GANoAREDS dbGAP subsetCFPNR/55143
CFP images
143
CFP images
(100% of dataset)
Manual delineation by 1 retina specialist and
review/correction by retina specialist team.
Hassan
(2021) [37]
China,
UAE
11 CRBMs from a pool of
datasets
containing AMD, ME, CSCR, MH, DR, CNV, and Healthy
No7 OCT datasets
spread over 4 DBs
(Isfahan University of Medical
Sciences,
Duke University,
University of
Waterloo, and
Guangzhou
Medical
University)
OCT
(Spectralis,
Cirrus, Topcon,
and Bioptigen)
6953/NR7000
OCT scans
500
OCT scans
(7.1% of dataset)
Manual pixel-wise annotations of
11 biomarkers by 3 retina
specialists (1 grader per scan).
Hu
(2015) [38]
USAGANoInstitutional FAF
dataset (University of Southern
California
Retina Clinics)
FAF
(Heidelberg cSLO
Spectralis HRA + OCT)
16/1616
FAF images
16
FAF images
(100% of dataset)
Manual delineation by certified grader.
Ji
(2018) [47]
China,
USA
Advanced non-
exudative AMD
with GA
No2 datasets
previously
described and used [59]
SD-OCT
(Cirrus Carl Zeiss)
FAF
(for GT annotations)
62/6651
SD-OCT cube scans (DS1);
54
SD-OCT cube scans (DS2)
and corresponding FAF images
105
SD-OCT cube scans
(100% of DS1
and DS2)
DS1: manual outline average of 2 independent
experts from 2 sessions, based on B-scans.
DS2: manual outline based on FAF images and manual registering to projection images.
Kalra
(2022) [39]
USANonexudative AMD with or without GA
(including iRORA and cRORA)
YesInstitutional OCT
dataset (Cole Eye
Institute of the
Cleveland Clinic)
SD-OCT
(Heidelberg Spectralis HRA + OCT and Cirrus HD-OCT Zeiss)
341/NR100.266
SD-OCT
B-scans and 900
en face SD-OCT images
NRB-scan model: Retinal layer segmentation masks by previously validated ML model, corrected by expert reader, reviewed by senior expert, and adjudicated by analysis
director. Binary GA masks in areas
of outer layer attenuation overlap.
En face model: generated from assembled
B-scan masks.
Liefers
(2020) [52]
The Netherlands,
Australia,
Singapore,
Switzerland
AMD with GANoBMES and RS
cohorts I, II, and III
CFI
(Zeiss, Canon CF-60 Dsi, Topcon TRV-50VT/TRC 50EX, and Sony DXC-950P)
175/238409
CFI images
409
CFI images
(100% of dataset)
Manual delineation by 4 expert graders for BMES and at least 2 expert graders for RS
using in-house software and final consensus grading. Consultation with additional
multimodal data when available.
Liu
(2023) [40]
China,
USA
GA, Healthy, and
other CRBMs (IRF/DME, DRUSEN, CNV, PED, HF, and SRF)
NoPrivate retinal
biomarker dataset from Wuhan
Aier Eye
Hospital and
Kermany’s public dataset
OCT
Triton DRI for DS1,
NR for DS2)
NR/NR30.850
B-scans
700
B-scans
(2.27% of dataset)
Previously published manual annotations
for IRF/DRUSEN and ophthalmologist
annotations for CNV.
Annotation methods for GA are not reported.
Ma
(2020) [48]
China,
USA
Advanced non-
exudative AMD
with GA
No2 datasets previously
described and used [59]
SD-OCT
(Cirrus Carl Zeiss)
FAF
(for GT annotations)
62/66105
SD-OCT cube scans
105
SD-OCT cube scans
(100% of dataset)
DS1: manual outline by 2 independent experts
from 2 sessions based on B-scans.
DS2: manual outline by 1 expert based on FAF
images and mapping to projection image.
Mai
(2023) [41]
Austria GANoInstitutional
dataset
(Medical
University
of Vienna)
SD-OCT
(Heidelberg Spectralis)
FAF
(for GT annotations)
100/184967
OCT volumes
967
OCT volumes
(100% of dataset)
Manual annotation of FAF by 2 trained
graders using OCTAVO software,
with automatic NIR registration and
final 2D en face OCT annotations.
Morano
(2024) [42]
Austria GANoInstitutional dataset
(Medical University
of Vienna)
OCT, SLO, and FAF
(Heidelberg Spectralis)
100/184967
OCT
volumes,
including OCT B-Scans, SLO, and FAF images
967
OCT volumes,
including OCT B-Scans, SLO, and FAF images
(100% of dataset)
En face masks annotated by 1 retinal expert on FAF, additional annotations on 35 OCT samples by retinal experts, with automatic
co-registration of OCT-SLO and FAF-SLO.
Pfau
(2020) [53]
USA,
Germany
GA and HealthyNoDirectional spread in GA 2 study
dataset
FAF, IR, and SD-OCT
(Spectralis
HRA + OCT2)
182/251UCUCB-scan and en face manual segmentation by
2 readers on test set (3 B-scans per patient).
Pramil
(2023) [57]
USA,
Australia
GA, Early AMD,
Intermediate AMD, and Healthy
NoStudy OCT dataset (“SWAGGER” cohort)
and institutional dataset from New England
Eye Center
(Tufts Medical Center)
SS-OCT
(PLEX Elite 9000
Carl Zeiss)
138/198351
OCT scans
273
OCT scans
(77.7% of dataset)
Plex Elite Review software layer
segmentation, then manual annotations on generated en face images by 1 expert grader for development set and 2 expert graders
during 2 separate sessions for test set
(ophthalmology research fellows), with grader training and annotation verification
by retina specialist.
Ramsey
(2014) [54]
USAGANoFenretinide study subsetFAF and CFP10/NR26
FAF-CFP
image pairs
26
FAF-CFP
image pairs
(100% of dataset)
Manual delineation by expert grader.
Royer
(2021) [43]
FranceGANoInstitutional
dataset
(Clinical Imaging Center, Quinze-Vingts Hospital)
cSLO13/NR328
cSLO images
328
cSLO images
(100% of dataset)
GA delineation by ophthalmologists.
Spaide
(2023) [55]
USA,
Germany
GANoProxima A and Proxima B study datasetsFAF and NIR
(Spectralis cSLO)
337/3371437
FAF-NIR
image pairs
1437
FAF-NIR
image pairs
(100% of dataset)
Semi-automatic delineation on FAF by trained
graders using RegionFinder software. DS1 later assessed by 2 junior graders with senior adjudicator. DS2 later assessed by junior and senior grader with optional second senior grader involvement. Total of 384 images
used for GT.
Szeskin
(2021) [44]
IsraelcRORA and
Macular atrophy (cRORA, iRORA, cORA, and iORA)
Yes2 institutional
datasets (Hadassah University Medical Center)
OCT and IR
(Heidelberg Spectralis)
34/NR106
OCT scans + IR (5.207 slices) (DS1);
19
OCT scans + IR
(829 slices) (DS2)
2952
slices
(56.70% of DS1);
829
slices
(100% of DS2)
DS1: multistep manual annotation of OCT by
2 technical co-authors and 2 ophthalmologists
(of which one was senior reviewer).
DS2: Manual delineation on IR image by
medical student and projection onto OCT.
Both DSs used in-house OCT-E GUI software.
Wang
(2022) [45]
USAAMD GA and
Stargardt atrophy
NoIn-house datasetsFAF
(Spectralis HRA + OCT)
217/296180
FAF images
(AMD GA DS);
412
FAF images
(Stargardt DS)
90
FAF images
(50% of AMD
GA dataset)
(15.2% of both
datasets)
Manual delineation/labeling of FAF by
certified grader using RegionFinder software and reviewed by senior grader with
senior adjudicator.
Wu
(2019) [46]
China,
USA,
South Korea
Advanced non-
neovascular AMD with GA
NoIn-house datasetSD-OCT
(Cirrus Carl Zeiss)
FAF
(Heidelberg Spectralis)
56/NR56
SD-OCT
volumes
56
SD-OCT volumes
(100% of dataset)
Manual segmentation of FAF images and
manual registration on en face OCT by
fellowship-trained retinal specialist.
Xu
(2019) [49]
China,
USA
GANo2 datasets
previously
described and used [59]
SD-OCT
(Carl Zeiss)
64/NR55
SD-OCT
cubes (DS1);
56
SD-OCT
cubes with corresponding FAF
images (DS2)
111
SD-OCT cubes
(100% of DS1
and DS2)
DS1: manual outline of OCT cubes by
2 ophthalmologists during 2 sessions.
DS2: manual outline based on FAF image
by ophthalmologist and registered
to projection image.
Zhang
(2021) [56]
UK,
the Netherlands,
Switzerland
GA (including cRORA and iRORA)YesFILLY datasetOCT
(Heidelberg Spectralis OCT + HRA)
200/399984
OCT volumes
(5049 B-scans)
984
OCT volumes
(100% of dataset)
Manual annotation of 5 B-scans per
OCT volume by 3 expert graders.
AMD (age-related macular degeneration); AREDS (age-related eye disease study); BMES (Blue Mountains eye study); CAM* (Classification of Atrophy Meetings); CFI (color fundus image); CFP (color fundus photography); CNV (choroidal neovascularization); cORA (complete outer retinal atrophy); cRORA (complete retinal pigment epithelium and outer retinal atrophy); CRBM (chorioretinal biomarker); CSCR (central serous chorioretinopathy); cSLO (confocal scanning laser ophthalmoscopy); DB (database); DME (diabetic macular edema); DR (diabetic retinopathy); DS (dataset); FAF (fundus autofluorescence); GA (geographic atrophy); GT (ground truth); GUI (graphical user interface); HD-OCT (high-definition optical coherence tomography); HF (hyperreflective foci); iORA (incomplete outer retinal atrophy); IR (infrared reflectance); IRF (intraretinal fluid); iRORA (incomplete retinal pigment epithelium and outer retinal atrophy); ME (macular edema); MH (macular hole); NIR (near-infrared reflectance); NR (not reported); OCT (optical coherence tomography); PED (pigment epithelial detachment); RORA (retinal pigment epithelium and outer retinal atrophy); RS (Rotterdam study); SD-OCT (spectral-domain optical coherence tomography); SLO (scanning laser ophthalmoscopy); SRF (subretinal fluid); SS-OCT (swept-source optical coherence tomography); subRPE (sub-retinal pigment epithelium); UC (unclear).
Table 5. Segmentation methods and validation approaches of selected studies.
Author
(Year)
Segmentation TechniqueInternal Validation MethodTraining SetValidation SetInternal Test Set External Test Set
Arslan
(2021) [34]
Pixel prediction and classification—binary
classification problem.
5-fold cross-validation5 sets of 140 or 142
FAF images each
5 sets of 140 or 142
FAF images each
5 sets of 140 or 142
FAF images each
NR
Chu
(2022) [35]
2 models (trained on OAC false-color en face
images or OCT subRPE en face images).
train–test split80% of all eyes
(89 eyes—133 OCT scans)
20% of training set
(23 eyes—23 OCT scans)
20% of all eyes
(28 eyes—28 OCT scans)
NR
Derradji
(2021) [36]
CNN trained using single 2D B-scan as
input and producing corresponding 2D RORA
probability mask as output.
5-fold cross-validation
on the merged training
and validation sets
2301 OCT B-scans256 OCT B-scans1038 OCT B-scansNR
Domalpally
(2024) [50]
Weakly labeled model for GA measurement
and strongly labeled model for GA measurement
and pixel-level segmentation.
5-fold cross-validation80% of dataset
(~481 FAF images)
for each iteration
20% of dataset
(~120 FAF images)
for each iteration
NR156 FAF images
from GSK BAM114341
study dataset
Feeny
(2015) [51]
52 features computed per pixel for
binary classification (GA vs. not-GA).
Leave-one-out cross-validation142 CFP images
for each iteration
NR1 CFP image
for each iteration
NR
Hassan
(2021) [37]
Asymmetric encoder–decoder structure for joint
segmentation and quantification of 11 CRBMs
with preprocessing, feature map utilization, and
postprocessing stages.
Hold-out validation4200 OCT B-scans
(352 for GA) from
University of Waterloo DB and Guangzhou Medical
University DB
1400 OCT B-scans in total
(75 for GA)
1400 OCT B-scans in total (73 for GA)
from Isfahan University of Medical Sciences DB and Duke University DB
NR
Hu
(2015) [38]
Supervised pixel classification employing image
texture features.
8-fold cross-validation8 rotating FAF image sets NR8 rotating FAF image sets NR
Ji
(2018) [47]
Deep voting model with 5 layers. A-scans labeled
with 1024 features fed into the network and a soft-max
classifier determined pixel-level labels. 10 trained
models. No retinal layer segmentation.
Hold-out validation10.000 GA-positive
OCT A-scans and
10.000 GA-negative OCT A-scans for each dataset
(~5% and ~9% of
total data)
NRNRNR
Kalra
(2022) [39]
2 models (B-scan and en face) for binary detection
of GA presence and pixel-wise lesion segmentation.
Hold-out validation80% of total patients10% of total patientsUnseen 10% of
patients
NR
Liefers
(2020) [52]
Ensemble of 20 models obtained during 5-fold
cross-validation with average of pixel-wise
predictions used to form a single binary image.
5-fold cross-validation~254 CFI images
for each model
(60% of data)
NRNR50 random CFIs
from AREDS subset
Liu
(2023) [40]
3 stages: a supervised, contrastive learning-based
pre-training; a fine-tuning module combining two
loss functions; and a knowledge distillation-based
teacher–student network for anomaly localization.
Hold-out validation500 GA OCT B-scans100 GA OCT B-scans100 GA OCT B-scansNR
Ma
(2020) [48]
Stage 1: B-scan denoising, RPE segmentation, flattening. Stage 2: B-scans input into weakly supervised network
to generate attention maps.
Stage 3: Segmentation masks by graph-based algorithm
using positive/negative seeds.
5-fold cross-validation NRNRNRNR
Mai
(2023) [41]
Patch-based training, 3D to 2D image segmentation.5-fold cross-validation~695 OCT volumes
(90% of development set)
~77 OCT volumes
(10% of development set)
~193 OCT volumes226 OCT volumes from
FILLY dataset
Morano
(2024) [42]
Multimodal Late Fusion and Multiscale Fusion
approaches with 2 branches to extract and project
features from different modalities and dimensions
(3D OCT and 2D FAF or SLO images) onto a
common feature subspace, enabling their joint
use for segmentation tasks.
Hold-out validation~580 OCT volumes
(B-scans, SLO, and FAF)
(60% of DS)
~97 OCT volumes
(B-scans, SLO, and FAF)
(fixed 10% of DS)
~290 OCT volumes
(B-scans, SLO, and FAF)
(fixed 30% of DS)
NR
Pfau
(2020) [53]
1st CNN for 6-layer retinal segmentation, and multimodal
input stacking into 2nd CNN for en face GA segmentation.
Hold-out validation135 eyes for en face
GA segmentation
45 eyes for en face
GA segmentation
75 OCT B-scans of
25 patients with GA
NR
Pramil
(2023) [57]
Encoding of OCT-derived GA features onto a
pseudocolor image using RGB channels for RPE loss,
hypertransmission, and retinal thinning, respectively.
5-fold cross-validation126 OCT scans~25 OCT scans
(~20% of training set)
225 OCT scansNR
Ramsey
(2014) [54]
Image registration, digital vessel subtraction, user-defined ROI, soft FCM segmentation, user selection
of relevant topographies, and final GA quantification.
NRNRNRNRNR
Royer
(2021) [43]
Unsupervised fully convolutional autoencoder trained on 2 loss functions (reconstruction error and soft N-cut loss) and 3 classes to segment GA by maximizing pixel intensity
and spatial dissimilarity.
8 different random
combinations of 12 series for training and 6 for
testing
NRNRNRNR
Spaide
(2023) [55]
Single encoder–decoder architecture for pixel prediction and classification (UNet), two encoder branches to
encode FAF and NIR images separately, and one joint
decoder to decode the embeddings (Ynet).
Hold-out validation748 FAF-NIR image
pairs from DS2
192 FAF-NIR image
pairs from DS2
497 FAF-NIR image
pairs from DS1
NR
Szeskin
(2021) [44]
CNN that classified light-scattering patterns in 2D and
3D columns of vertical pixel-wide vectors (A-scans)
on atrophic OCT B-scans, utilizing the BCE and
F1 loss functions without layer segmentation.
4-fold cross-validation93 OCT scans for cRORA; 10 OCT scans for macular atrophy for training and cross-validation93 OCT scans for cRORA; 10 OCT scans for macular atrophy for training and cross-validation12 OCT scans for cRORA; 9 OCT scans for macular atrophy for testingNR
Wang
(2022) [45]
Integrated soft-labeled self-attended deep CNN
system and binary pixel classification producing
feature maps.
8-fold cross-validation70 AMD FAF images
(in each fold)
10 fixed AMD FAF
images
10 AMD FAF images
(in each fold)
NR
Wu
(2019) [46]
FAF image synthesis from generated en face OCT
by GA RA-CGAN; image fusion net and
segmentation net refined with SFCM.
Leave-four-out cross-validation NRNRNRNR
Xu
(2019) [49]
Offline learning phase to capture common features
from training samples and self-learning phase to
identify discriminative features and reduce FPs.
Fusion of both outputs for final segmentation.
Independent dataset
validation
Random 100.000 axial data with GA and 100.000 without GA for each DSNR111 3D OCT cubes in total
from both DSs
NR
Zhang
(2021) [56]
2 approaches: direct GA segmentation or individual
segmentation of overlapping features (RPE loss,
photoreceptor degeneration, and hypertransmission).
Hold-out validation582 OCT volumes
(3024 B-scans)
(60% of dataset)
191 OCT volumes
(958 B-scans)
(20% of dataset)
211 OCT volumes
(1067 B-scans)
(20% of dataset)
192 OCT volumes
(884 B-scans)
from Moorfields Eye
Hospital institutional dataset
AMD (age-related macular degeneration); AREDS (age-related eye disease study); BCE (binary cross-entropy); CFI (color fundus image); CFP (color fundus photography); CNN (convolutional neural network); cRORA (complete retinal pigment epithelium and outer retinal atrophy); CRBM (chorioretinal biomarker); DB (database); DS (dataset); FAF (fundus autofluorescence); FCM (fuzzy c-means clustering); FP (false positive); GA (geographic atrophy); NIR (near-infrared reflectance); NR (not reported); OAC (optical attenuation coefficient); OCT (optical coherence tomography); RA-CGAN (region-aware conditional generative adversarial network); RGB (red–green–blue); ROI (region of interest); RORA; (retinal pigment epithelium and outer retinal atrophy); RPE (retinal pigment epithelium); SFCM (spatial fuzzy c-means clustering); SLO (scanning laser ophthalmoscopy); subRPE (sub-retinal pigment epithelium).
Table 6. Performance evaluation, explainability, and architecture of AI models.
Author
(Year)
AI
Type
AI
Algorithm
XAIPerformance Metrics
(Internal Testing)
Performance Metrics
(External Testing)
Arslan
(2021) [34]
DLU-NetNRAccuracy: 0.9774; Sensitivity: 0.9903;
Specificity: 0.7498; Precision: 0.9837; DSC: 0.9780
NR
Chu
(2022) [35]
DLU-NetNROAC composite model:
GA Identification Sensitivity: 100%
GA Identification Specificity: 100%; DSC: 0.940
OCT en face subRPE model:
GA Identification Sensitivity: 100%
GA Identification Specificity: 100%; DSC: 0.889
NR
Derradji
(2021) [36]
DLU-Net style network with
EfficientNet-b3 architecture
NRModel with prior layer:
Sensitivity (grader 1): 0.850; Sensitivity (grader 2): 0.915
Precision (grader 1): 0.928; Precision (grader 2): 0.799
DSC (grader 1): 0.881; DSC (grader 2): 0.844
Model without prior layer:
Sensitivity (grader 1): 0.765; Sensitivity (grader 2): 0.845
Precision (grader 1): 0.955; Precision (grader 2): 0.845
DSC (grader 1): 0.841; DSC (grader 2): 0.831
NR
Domalpally
(2024) [50]
DLEfficientNet-B5
(weakly labeled model)
Feature Pyramid Network with EfficientNet-B5 encoder (strongly labeled model)
Saliency mapsStrongly labeled model:
DSC: 0.885
Strongly labeled model:
DSC: 0.918
Feeny
(2015) [51]
MLRandom forest classifierNRSensitivity: 0.65; Specificity: 0.99;
PPV: 0.82; DSC: 0.68
NR
Hassan
(2021) [37]
DLRASP-Net NRGA detection:
Sensitivity: 0.904; Specificity: 0.930;
Precision: 0.853
GA segmentation:
IoU: 0.606; DSC: 0.755
NR
Hu
(2015) [38]
MLk-NN NRAccuracy: 0.94; Sensitivity: 0.87;
Specificity: 0.96; PPV: 0.80; OR: 0.72
NR
Ji
(2018) [47]
DLDeep voting model
(sparse autoencoders)
NRDS1:
AAD (mm2): 0.67; AAD (%): 11.49; OR: 0.8694
DS2:
AAD (mm2): 0.34; AAD (%): 8.30; OR: 0.8166
NR
Kalra
(2022) [39]
DLU-NetNRB-scan model:
Detection Accuracy: 0.91; Pixel-wise Accuracy: 0.94
Detection Sensitivity: 0.86; Pixel-wise Sensitivity: 0.90
Detection Specificity: 0.94; Pixel-wise Specificity: 0.90
Detection f-score: 0.87; Pixel-wise f-score: 0.71
En face model:
Detection Accuracy: 0.82; Pixel-wise Accuracy: 0.96
Detection Sensitivity: 0.97; Pixel-wise Sensitivity: 0.95
Detection Specificity: 0.42; Pixel-wise Specificity: 0.93
Detection f-score: 0.88; Pixel-wise f-score: 0.82
NR
Liefers
(2020) [52]
DLDeep encoder–decoder
structure with residual blocks and shortcut connections
NRDSC: 0.72DSC: 0.66 (total cases);
DSC: 0.71 (pure GA cases)
Liu
(2023) [40]
DLTSSK-Net with ResNet-18 backboneCAM-based techniques
(Grad-CAM, LayerCAM, and MS-CAM) and knowledge distillation-based anomaly
localization (heatmaps)
GA Segmentation:
AUC: 0.9704; DSC: 0.4504
NR
Ma
(2020) [48]
DLVGG16 backboneSaliency maps (MS-CAM)DS1:
AAD (mm2): 0.63; AAD (%): 12.87; AUC: 0.9417;
OR: 0.8430; DSC: 0.9121
DS2:
AAD (mm2): 0.78; AAD (%): 14.99; AUC: 0.9326;
OR: 0.7441; DSC: 0.847
NR
Mai
(2023) [41]
DLDL model based on U-Net
architecture
NRRecall: 0.87; Precision: 0.87;
DSC (mean): 0.86; DSC (median): 0.90
Recall: 0.93; Precision: 0.90;
DSC: 0.91; DSC (mean): 0.91;
DSC (median): 0.93
Morano
(2024) [42]
DLFCNN NR100% of training data
Multiscale OCT + FAF:
AUROC: 0.996; AUPR: 0.9895; DSC: 0.9019
Multiscale OCT + SLO:
AUROC: 0.9939; AUPR: 0.984; DSC: 0.8915
Late OCT + FAF:
AUROC: 0.9948; AUPR: 0.9859; DSC: 0.8991
Late OCT + SLO:
AUROC: 0.9933; AUPR: 0.9822; DSC: 0.8908
NR
Pfau
(2020) [53]
DLDeeplabv3 model with
ResNet-50 backbone
NRDSC: 0.96NR
Pramil
(2023) [57]
DLU-NetNRGA detection:
Sensitivity: 0.95; Specificity: 0.91
GA segmentation:
SDC (grader 1): 0.92; SDC (grader 2): 0.91;
SDC (after BM correction): 0.97
NR
Ramsey
(2014) [54]
MLFCMNRSensitivity (FAF): 0.94; Sensitivity (CFP): 0.47
Specificity (FAF): 0.98; Specificity (CFP): 0.98
NR
Royer
(2021) [43]
DLW-net (autoencoder)NRSensitivity: 0.85; Precision: 0.90; F1 score: 0.87NR
Spaide
(2023) [55]
DLY-Net
and U-Net
NRDSC: 0.90–0.92NR
Szeskin
(2021) [44]
DLCustom column-based CNNNRcRORA:
Mean Detection Recall: 0.67;
Mean Detection Precision: 0.70;
(F1-3D) avg. Precision: 0.68;
AUC (F1-3D): 0.937; F1 score: 0.78
Macular atrophy:
Mean Detection Recall: 0.91;
Mean Detection precision: 0.72;
F1-3D avg. Precision: 0.83;
AUC: 0.970; F1 score: 0.89
NR
Wang
(2022) [45]
DLSelf-attended U-NetAttention modulesBaseline:
Accuracy: 0.98; Sensitivity: 0.85; Specificity: 0.99;
IoU: 0.77; DSC: 0.85
Month 12:
Accuracy: 0.95; Sensitivity: 0.75; Specificity: 0.98;
IoU: 0.68; DSC: 0.78
NR
Wu
(2019) [46]
DLU-NetProbability mapAAD: 11.0; OR: 0.779; DSC: 0.87NR
Xu
(2019) [49]
DLStacked sparse autoencoderNRDS1 with training data:
AAD (mm2): 0.18; AAD (%): 3.67; OR: 0.9985
DS1 without training data:
AAD (mm2): 0.21; AAD (%): 4.79; OR: 0.9979
DS2 with training data:
AAD (mm2): 0.48; AAD (%): 11.09; OR: 0.8455
DS2 without training data:
AAD (mm2): 0.4418; AAD (%): 11.09; OR: 0.8448
NR
Zhang
(2021) [56]
DLModified U-NetNRGA approach 1:
DSC median: 0.84; DSC mean: 0.75
GA approach 2:
DSC median: 0.83; DSC mean: 0.75
GA approach 1:
Accuracy: 0.91; Sensitivity: 0.99;
Specificity: 0.54; F1 score: 0.94;
DSC median: 0.96; DSC mean: 0.91
GA approach 2:
Accuracy: 0.94; Sensitivity: 0.98;
Specificity: 0.76; F1 score: 0.96;
DSC median: 0.95; DSC mean: 0.87
iRORA/cRORA approach 1:
Accuracy: 0.89; Sensitivity: 0.90;
Specificity: 0.68; F1 score: 0.94
iRORA/cRORA approach 2:
Accuracy: 0.87; Sensitivity: 0.90;
Specificity: 0.68; F1 score: 0.93
AAD (absolute area difference); AUC (area under the curve); AUPR (area under the precision-recall curve); AUROC (area under the receiver operating characteristic curve); BM (Bruch’s membrane); CAM (class activation map); CNN (convolutional neural network); cRORA (complete retinal pigment epithelium and outer retinal atrophy); DL (deep learning); DS (dataset); DSC (Dice similarity coefficient); FAF (fundus autofluorescence); FCM (fuzzy c-means clustering); FCNN (fully convolutional neural network); GA (geographic atrophy); Grad-CAM (gradient-weighted class activation map); IoU (intersection over union); iRORA (incomplete retinal pigment epithelium and outer retinal atrophy); k-NN (K-nearest neighbors); LayerCAM (layer-wise class activation map); ML (machine learning); MS-CAM (multiscale class activation map); NR (not reported); OAC (optical attenuation coefficient); OCT (optical coherence tomography); OR (overlap ratio); PPV (positive predictive value); SDC (symmetric Dice coefficient); SLO (scanning laser ophthalmoscopy); subRPE (sub-retinal pigment epithelium); TSSK-Net (teacher–student self-supervised knowledge distillation network); XAI (explainable artificial intelligence). Bold formatting is used to differentiate performance metrics across datasets, models, and approaches for clearer comparison.
Disclaimer/Publisher’s Note: The statements, opinions and data contained in all publications are solely those of the individual author(s) and contributor(s) and not of MDPI and/or the editor(s). MDPI and/or the editor(s) disclaim responsibility for any injury to people or property resulting from any ideas, methods, instructions or products referred to in the content.

