

Amide Proton Transfer-Weighted Imaging Combined with ZOOMit Diffusion Kurtosis Imaging in Predicting Lymph Node Metastasis of Cervical Cancer

 , , , , and
Abstract
1. Introduction
2. Materials and Methods
2.1. Patient Population
2.2. MR Imaging Protocol
2.3. Image Analysis
2.4. Statistical Analysis
3. Results
3.1. Participant Characteristics
3.2. Interobserver Reliability Analysis
3.3. Comparisons of APTw, MK, and MD between Different Histopathological Parameters
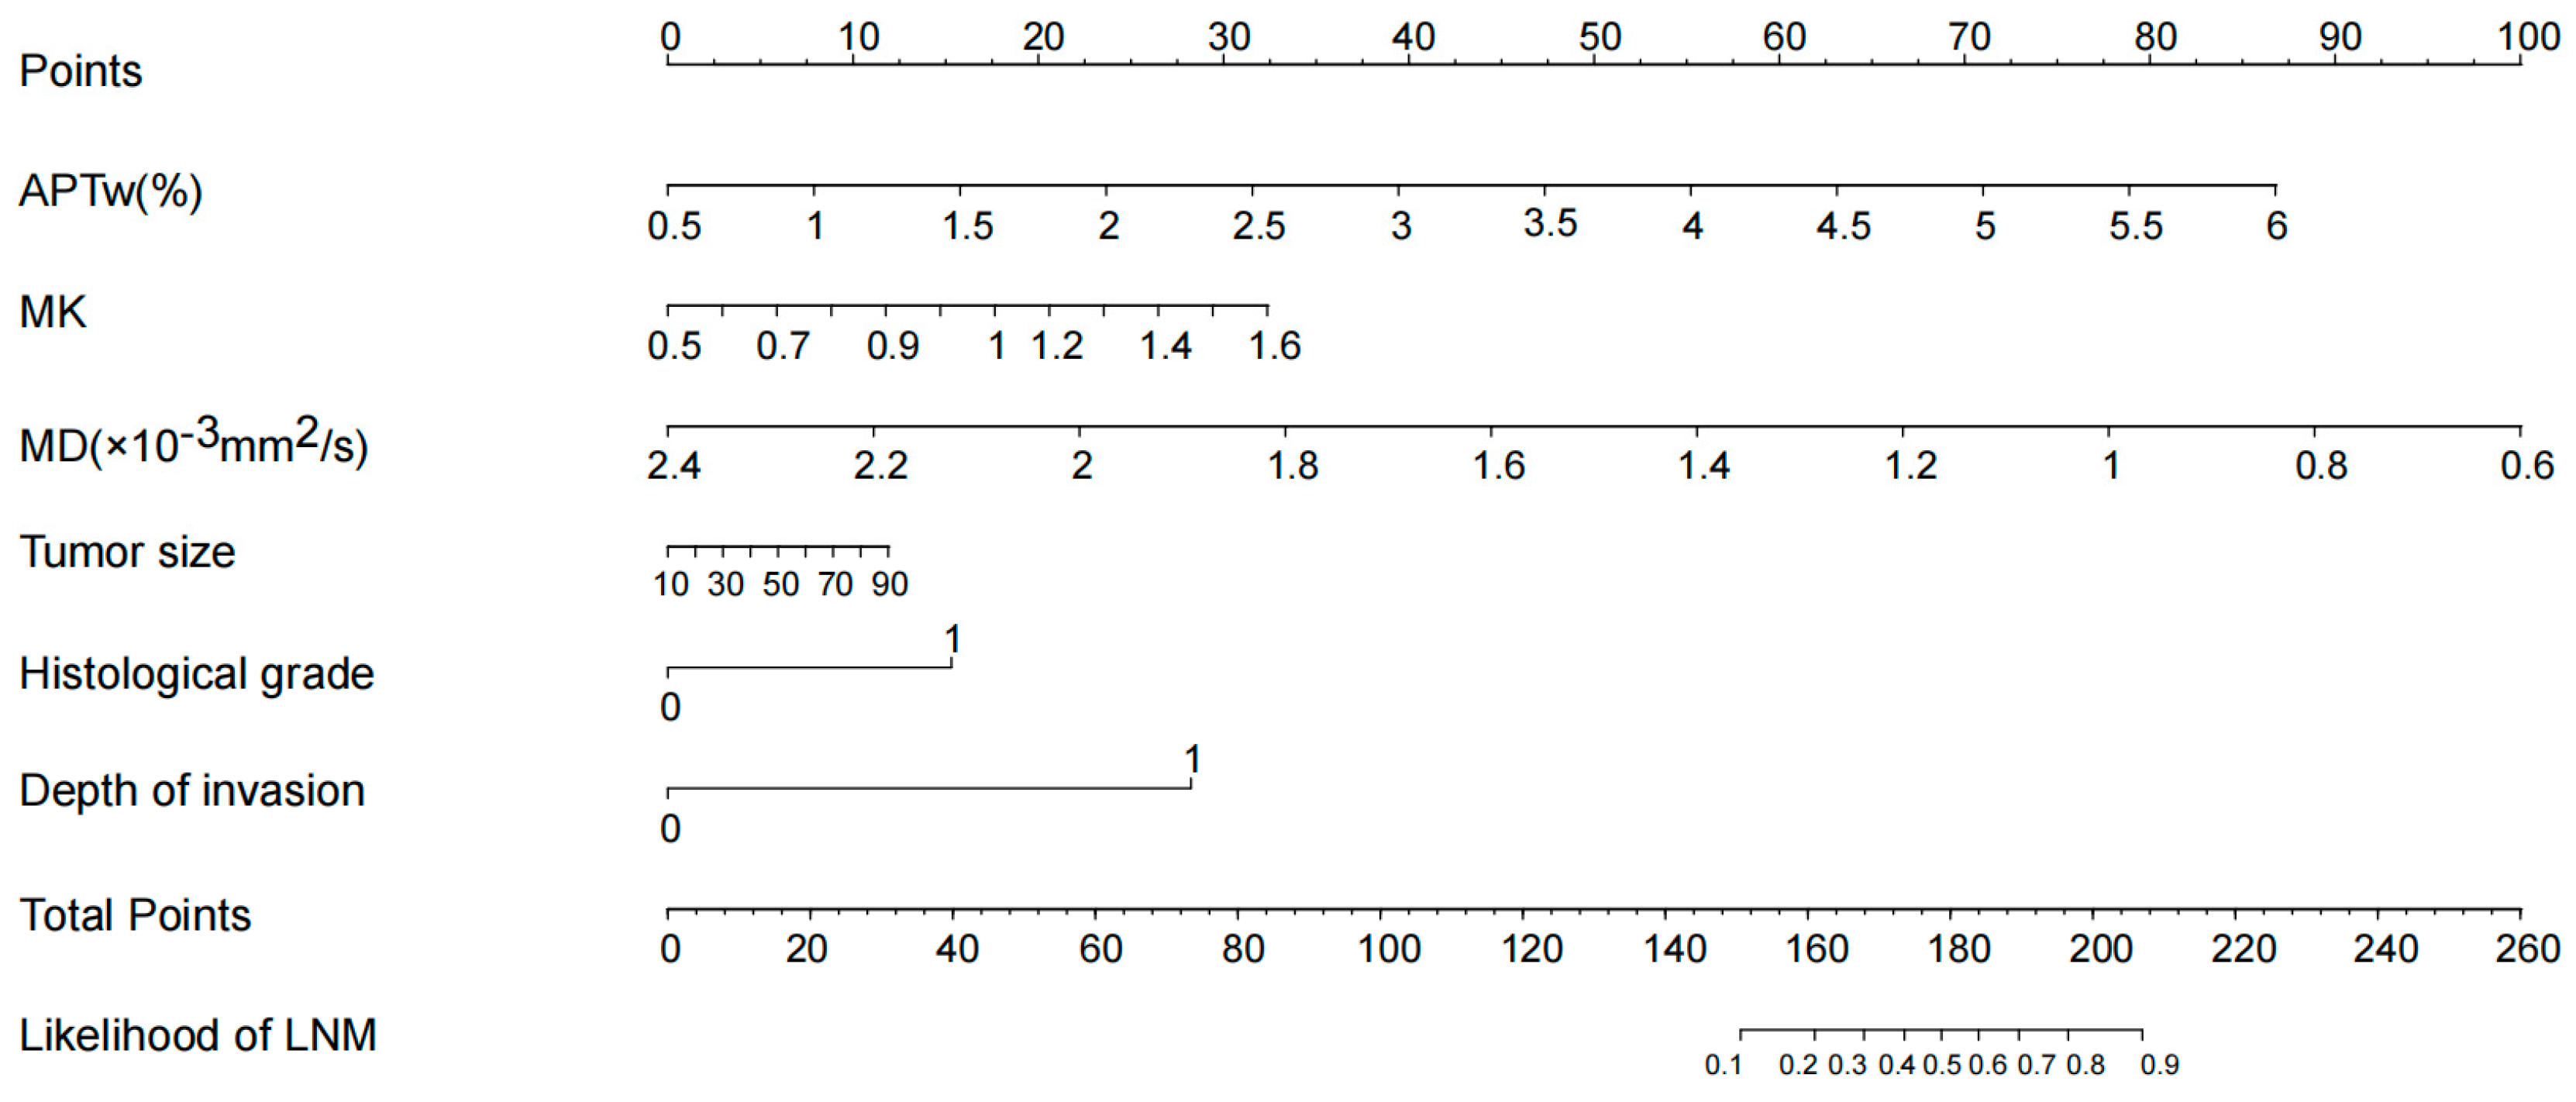
3.4. Univariate and Multivariate Logistic Regression Analyses
3.5. Diagnostic Performance of the APTw, MK, and MD in Predicting Lymph Node Status
4. Discussion
5. Conclusions
Author Contributions
Funding
Institutional Review Board Statement
Informed Consent Statement
Data Availability Statement
Acknowledgments
Conflicts of Interest
References
- Bray, F.; Ferlay, J.; Soerjomataram, I.; Siegel, R.L.; Torre, L.A.; Jemal, A. Global cancer statistics 2018: GLOBOCAN estimates of incidence and mortality worldwide for 36 cancers in 185 countries. CA Cancer J. Clin. 2018, 68, 394–424. [Google Scholar] [CrossRef] [PubMed]
- Olawaiye, A.B.; Baker, T.P.; Washington, M.K.; Mutch, D.G. The new (Version 9) American Joint Committee on Cancer tumor, node, metastasis staging for cervical cancer. CA Cancer J. Clin. 2021, 71, 287–298. [Google Scholar] [CrossRef] [PubMed]
- Koh, W.J.; Abu-Rustum, N.R.; Bean, S.; Bradley, K.; Campos, S.M.; Cho, K.R.; Chon, H.S.; Chu, C.; Clark, R.; Cohn, D.; et al. Cervical Cancer, Version 3.2019, NCCN Clinical Practice Guidelines in Oncology. J. Natl. Compr. Cancer Netw. 2019, 17, 64–84. [Google Scholar] [CrossRef]
- Landoni, F.; Maneo, A.; Colombo, A.; Placa, F.; Milani, R.; Perego, P.; Favini, G.; Ferri, L.; Mangioni, C. Randomised study of radical surgery versus radiotherapy for stage Ib-IIa cervical cancer. Lancet 1997, 350, 535–540. [Google Scholar] [CrossRef] [PubMed]
- Haldorsen, I.S.; Lura, N.; Blaakær, J.; Fischerova, D.; Werner, H.M.J. What Is the Role of Imaging at Primary Diagnostic Work-Up in Uterine Cervical Cancer? Curr. Oncol. Rep. 2019, 21, 77. [Google Scholar] [CrossRef] [PubMed]
- Woo, S.; Atun, R.; Ward, Z.J.; Scott, A.M.; Hricak, H.; Vargas, H.A. Diagnostic performance of conventional and advanced imaging modalities for assessing newly diagnosed cervical cancer: Systematic review and meta-analysis. Eur. Radiol. 2020, 30, 5560–5577. [Google Scholar] [CrossRef]
- Xiao, M.; Yan, B.; Li, Y.; Lu, J.; Qiang, J. Diagnostic performance of MR imaging in evaluating prognostic factors in patients with cervical cancer: A meta-analysis. Eur. Radiol. 2020, 30, 1405–1418. [Google Scholar] [CrossRef]
- Chen, M.; Feng, C.; Wang, Q.; Li, J.; Wu, S.; Hu, D.; Deng, B.; Li, Z. Comparison of reduced field-of-view diffusion-weighted imaging (DWI) and conventional DWI techniques in the assessment of Cervical carcinoma at 3.0 T: Image quality and FIGO staging. Eur. J. Radiol. 2021, 137, 109557. [Google Scholar] [CrossRef]
- Li, S.; He, K.; Yuan, G.; Yong, X.; Meng, X.; Feng, C.; Zhang, Y.; Kamel, I.R.; Li, Z. WHO/ISUP grade and pathological T stage of clear cell renal cell carcinoma: Value of ZOOMit diffusion kurtosis imaging and chemical exchange saturation transfer imaging. Eur. Radiol. 2022. [Google Scholar] [CrossRef]
- Lin, G.; Ho, K.C.; Wang, J.J.; Ng, K.K.; Wai, Y.Y.; Chen, Y.T.; Chang, C.J.; Ng, S.H.; Lai, C.H.; Yen, T.C. Detection of lymph node metastasis in cervical and uterine cancers by diffusion-weighted magnetic resonance imaging at 3 T. J. Magn. Reson. Imaging 2008, 28, 128–135. [Google Scholar] [CrossRef]
- Jensen, J.H.; Helpern, J.A.; Ramani, A.; Lu, H.; Kaczynski, K. Diffusional kurtosis imaging: The quantification of non-gaussian water diffusion by means of magnetic resonance imaging. Magn. Reson. Med. 2005, 53, 1432–1440. [Google Scholar] [CrossRef]
- Jensen, J.H.; Helpern, J.A. MRI quantification of non-Gaussian water diffusion by kurtosis analysis. NMR Biomed. 2010, 23, 698–710. [Google Scholar] [CrossRef]
- Li, Q.; Cao, B.; Tan, Q.; Liu, K.; Jiang, S.; Zhou, J. Prediction of muscle invasion of bladder cancer: A comparison between DKI and conventional DWI. Eur. J. Radiol. 2021, 136, 109522. [Google Scholar] [CrossRef]
- Yamada, I.; Oshima, N.; Wakana, K.; Miyasaka, N.; Wakabayashi, A.; Sakamoto, J.; Saida, Y.; Tateishi, U.; Kobayashi, D. Uterine Cervical Carcinoma: Evaluation Using Non-Gaussian Diffusion Kurtosis Imaging and Its Correlation with Histopathological Findings. J. Comput. Assist. Tomogr. 2021, 45, 29–36. [Google Scholar] [CrossRef] [PubMed]
- Chen, W.; Li, L.; Yan, Z.; Hu, S.; Feng, J.; Liu, G.; Liu, B.; Liu, X. Three-dimension amide proton transfer MRI of rectal adenocarcinoma: Correlation with pathologic prognostic factors and comparison with diffusion kurtosis imaging. Eur. Radiol. 2021, 31, 3286–3296. [Google Scholar] [CrossRef] [PubMed]
- Dou, W.; Lin, C.E.; Ding, H.; Shen, Y.; Dou, C.; Qian, L.; Wen, B.; Wu, B. Chemical exchange saturation transfer magnetic resonance imaging and its main and potential applications in pre-clinical and clinical studies. Quant. Imaging Med. Surg. 2019, 9, 1747–1766. [Google Scholar] [CrossRef] [PubMed]
- Takayama, Y.; Nishie, A.; Togao, O.; Asayama, Y.; Ishigami, K.; Ushijima, Y.; Okamoto, D.; Fujita, N.; Sonoda, K.; Hida, T.; et al. Amide Proton Transfer MR Imaging of Endometrioid Endometrial Adenocarcinoma: Association with Histologic Grade. Radiology 2018, 286, 909–917. [Google Scholar] [CrossRef] [PubMed]
- He, Y.L.; Li, Y.; Lin, C.Y.; Qi, Y.F.; Wang, X.; Zhou, H.L.; Yang, J.J.; Xiang, Y.; Xue, H.D.; Jin, Z.Y. Three-dimensional turbo-spin-echo amide proton transfer-weighted mri for cervical cancer: A preliminary study. J. Magn. Reson. Imaging 2019, 50, 1318–1325. [Google Scholar] [CrossRef]
- Park, J.E.; Kim, H.S.; Park, S.Y.; Jung, S.C.; Kim, J.H.; Heo, H.Y. Identification of Early Response to Anti-Angiogenic Therapy in Recurrent Glioblastoma: Amide Proton Transfer-weighted and Perfusion-weighted MRI compared with Diffusion-weighted MRI. Radiology 2020, 295, 397–406. [Google Scholar] [CrossRef]
- Meng, N.; Wang, X.; Sun, J.; Han, D.; Bai, Y.; Wei, W.; Wang, Z.; Jia, F.; Wang, K.; Wang, M. A comparative study of the value of amide proton transfer-weighted imaging and diffusion kurtosis imaging in the diagnosis and evaluation of breast cancer. Eur. Radiol. 2021, 31, 1707–1717. [Google Scholar] [CrossRef]
- Jia, G.; Abaza, R.; Williams, J.D.; Zynger, D.L.; Zhou, J.; Shah, Z.K.; Patel, M.; Sammet, S.; Wei, L.; Bahnson, R.R.; et al. Amide proton transfer MR imaging of prostate cancer: A preliminary study. J. Magn. Reson. Imaging 2011, 33, 647–654. [Google Scholar] [CrossRef]
- Nishie, A.; Takayama, Y.; Asayama, Y.; Ishigami, K.; Ushijima, Y.; Okamoto, D.; Fujita, N.; Tsurumaru, D.; Togao, O.; Manabe, T.; et al. Amide proton transfer imaging can predict tumor grade in rectal cancer. Magn. Reson. Imaging 2018, 51, 96–103. [Google Scholar] [CrossRef]
- Wang, H.J.; Cai, Q.; Huang, Y.P.; Li, M.Q.; Wen, Z.H.; Lin, Y.Y.; Ouyang, L.Y.; Qian, L.; Guo, Y. Amide Proton Transfer-weighted MRI in Predicting Histologic Grade of Bladder Cancer. Radiology 2022, 305, 127–134. [Google Scholar] [CrossRef] [PubMed]
- Liu, R.; Zhang, H.; Qian, Y.; Hsu, Y.C.; Fu, C.; Sun, Y.; Wu, D.; Zhang, Y. Frequency-stabilized chemical exchange saturation transfer imaging with real-time free-induction-decay readout. Magn. Reson. Med. 2021, 85, 1322–1334. [Google Scholar] [CrossRef]
- Liu, R.; Zhang, H.; Niu, W.; Lai, C.; Ding, Q.; Chen, W.; Liang, S.; Zhou, J.; Wu, D.; Zhang, Y. Improved chemical exchange saturation transfer imaging with real-time frequency drift correction. Magn. Reson. Med. 2019, 81, 2915–2923. [Google Scholar] [CrossRef]
- Minosse, S.; Marzi, S.; Piludu, F.; Vidiri, A. Correlation study between DKI and conventional DWI in brain and head and neck tumors. Magn. Reson. Imaging 2017, 42, 114–122. [Google Scholar] [CrossRef]
- Hou, M.; Song, K.; Ren, J.; Wang, K.; Guo, J.; Niu, Y.; Li, Z.; Han, D. Comparative analysis of the value of amide proton transfer-weighted imaging and diffusion kurtosis imaging in evaluating the histological grade of cervical squamous carcinoma. BMC Cancer 2022, 22, 87. [Google Scholar] [CrossRef]
- Nakai, G.; Matsuki, M.; Inada, Y.; Tatsugami, F.; Tanikake, M.; Narabayashi, I.; Yamada, T. Detection and evaluation of pelvic lymph nodes in patients with gynecologic malignancies using body diffusion-weighted magnetic resonance imaging. J. Comput. Assist. Tomogr. 2008, 32, 764–768. [Google Scholar] [CrossRef] [PubMed]
- Yamada, I.; Sakamoto, J.; Kobayashi, D.; Miyasaka, N.; Wakana, K.; Oshima, N.; Wakabayashi, A.; Saida, Y.; Tateishi, U.; Eishi, Y. Diffusion kurtosis imaging of endometrial carcinoma: Correlation with histopathological findings. Magn. Reson. Imaging 2019, 57, 337–346. [Google Scholar] [CrossRef] [PubMed]
- Meng, N.; Wang, X.; Sun, J.; Han, D.; Ma, X.; Wang, K.; Wang, M. Application of the amide proton transfer-weighted imaging and diffusion kurtosis imaging in the study of cervical cancer. Eur. Radiol. 2020, 30, 5758–5767. [Google Scholar] [CrossRef]
- Meng, N.; Wang, X.; Sun, J.; Huang, Z.; Yang, Z.; Shang, J.; Bai, Y.; Wei, W.; Han, D.; Han, H.; et al. Evaluation of amide proton transfer-weighted imaging for endometrial carcinoma histological features: A comparative study with diffusion kurtosis imaging. Eur. Radiol. 2021, 31, 8388–8398. [Google Scholar] [CrossRef] [PubMed]
- Meng, X.; Tian, S.; Ma, C.; Lin, L.; Zhang, X.; Wang, J.; Song, Q.; Liu, A.L. APTw combined with mDixon-Quant imaging to distinguish the differentiation degree of cervical squamous carcinoma. Front. Oncol. 2023, 13, 1105867. [Google Scholar] [CrossRef] [PubMed]
- Li, B.; Sun, H.; Zhang, S.; Wang, X.; Guo, Q. Amide proton transfer imaging to evaluate the grading of squamous cell carcinoma of the cervix: A comparative study using (18) F FDG PET. J. Magn. Reson. Imaging 2019, 50, 261–268. [Google Scholar] [CrossRef] [PubMed]
- Li, B.; Sun, H.; Zhang, S.; Wang, X.; Guo, Q. The utility of APT and IVIM in the diagnosis and differentiation of squamous cell carcinoma of the cervix: A pilot study. Magn. Reson. Imaging 2019, 63, 105–113. [Google Scholar] [CrossRef]
- Van Cauter, S.; Veraart, J.; Sijbers, J.; Peeters, R.R.; Himmelreich, U.; De Keyzer, F.; Van Gool, S.W.; Van Calenbergh, F.; De Vleeschouwer, S.; Van Hecke, W.; et al. Gliomas: Diffusion kurtosis MR imaging in grading. Radiology 2012, 263, 492–501. [Google Scholar] [CrossRef] [PubMed]


| Characteristics | Total | Non-LNM | LNM | p | |
|---|---|---|---|---|---|
| No. of Patients | 61 | 44 | 17 | ||
| Age (years) a | 51 ± 12 (28–78) | 50 ± 12 (28–78) | 52 ± 12 (29–70) | 0.513 | |
| Tumor size (mm) a | 36 ± 21 (13–105) | 31 ± 17 (15–72) | 44 ± 19 (13–105) | 0.009 | |
| Menopausal status | 0.437 * | ||||
| No | 30 (49.2) | 23 (52.3) | 7 (41.2) | ||
| Yes | 31 (50.8) | 21 (47.7) | 10 (58.8) | ||
| Histological classification | 0.423 * | ||||
| CSC | 52 (85.2) | 36 (81.8) | 16 (94.1) | ||
| CA | 9 (14.8) | 8 (18.2) | 1 (5.9) | ||
| FIGO stage | <0.001 * | ||||
| Early stage (IB-IIA) | 32 (52.5) | 31 (70.5) | 1 (5.9) | ||
| Advanced stage (IIB-IV) | 29 (47.5) | 13 (29.5) | 16 (94.1) | ||
| Histologic grade | 0.009 * | ||||
| Low grade | 32 (52.5) | 28 (63.6) | 4 (23.5) | ||
| High grade | 29 (47.5) | 16 (36.4) | 13 (76.5) | ||
| Depth of invasion | <0.001 * | ||||
| <2/3 of cervical wall | 27 (44.3) | 26 (59.1) | 1 (5.9) | ||
| ≥2/3 of cervical wall | 34 (55.7) | 18 (40.9) | 16 (94.1) | ||
| SCC-Ag level | 0.133 * | ||||
| ≤1.5 ng/mL | 21 (34.4) | 18 (40.9) | 3 (17.6) | ||
| >1.5 ng/mL | 40 (65.6) | 26 (59.1) | 14 (82.4) | ||
| Vascular invasion | 0.421 * | ||||
| No | 44 (72.1) | 33 (75.0) | 11 (64.7) | ||
| Yes | 17 (27.9) | 11 (25.0) | 6 (35.3) | ||
| Variables | APTw (%) | p | MK | p | MD (×10−3 mm2/s) | p | |
|---|---|---|---|---|---|---|---|
| Lymph node status | <0.001 | 0.005 | 0.035 * | ||||
| Non-LNM (n = 44) | 2.4 ± 1.0 | 0.909 ± 0.189 | 1.193 ± 0.337 | ||||
| LNM (n = 17) | 3.7 ± 1.1 | 1.065 ± 0.185 | 0.989 ± 0.195 | ||||
| Tumor size | 0.319 | 0.009 | 0.005 * | ||||
| <4 cm (n = 39) | 2.6 ± 1.2 | 0.903 ± 0.191 | 1.219 ± 0.336 | ||||
| ≥4 cm (n = 22) | 3.0 ± 1.1 | 1.040 ± 0.187 | 0.990 ± 0.213 | ||||
| Histological classification | 0.447 | 0.471 | 0.014 * | ||||
| CSC (n = 52) | 2.8 ± 1.2 | 0.960 ± 0.191 | 1.076 ± 0.230 | ||||
| CA (n = 9) | 2.5 ± 1.2 | 0.908 ± 0.247 | 1.485 ± 0.501 | ||||
| FIGO stage | 0.002 | <0.001 | <0.001 * | ||||
| Early-stage (n = 32) | 2.3 ± 1.0 | 0.857 ± 0.186 | 1.285 ± 0.345 | ||||
| Advanced-stage (n = 29) | 3.2 ± 1.1 | 1.058 ± 0.157 | 0.973 ± 0.171 | ||||
| Histological grade | 0.117 | 0.016 | 0.142 * | ||||
| Low grade (n = 32) | 2.5 ± 1.0 | 0.895 ± 0.195 | 1.193 ± 0.371 | ||||
| High grade (n = 29) | 3.0 ± 1.2 | 1.016 ± 0.187 | 1.074 ± 0.232 | ||||
| Depth of invasion | 0.001 | <0.001 | 0.011 * | ||||
| <2/3 of cervical wall (n = 27) | 2.2 ± 0.9 | 0.845 ± 0.175 | 1.270 ± 0.381 | ||||
| ≥2/3 of cervical wall (n = 34) | 3.2 ± 1.2 | 1.038 ± 0.176 | 1.031 ± 0.202 | ||||
| Vascular invasion | 0.140 | 0.210 | 0.394 * | ||||
| No (n = 44) | 2.6 ± 1.0 | 0.933 ± 0.215 | 1.132 ± 0.345 | ||||
| Yes (n = 17) | 3.1 ± 1.4 | 1.004 ± 0.142 | 1.148 ± 0.234 | ||||
| Variable | Univariate Analysis | Multivariate Analysis | ||
|---|---|---|---|---|
| Odds Ratio (95 % CI) | p | Odds Ratio (95 % CI) | p | |
| APTw (%) | 3.523 (1.676, 7.404) | 0.001 | 3.115 (1.059, 9.162) | 0.039 |
| MK | 1.005 (1.001, 1.008) | 0.011 | 1.000 (0.991, 1.008) | 0.911 |
| MD (×10−3 mm2/s) | 0.997 (0.994, 1.000) | 0.029 | 0.998 (0.990, 1.005) | 0.503 |
| Age | 1.017 (0.968, 1.068) | 0.507 | ||
| Tumor size | 1.041 (1.008, 1.075) | 0.016 | 0.949 (0.878, 1.025) | 0.184 |
| Menopausal status | 1.565 (0.504, 4.856) | 0.439 | ||
| Histological classification | 0.281 (0.032, 2.440) | 0.250 | ||
| Histologic grade | 5.687 (1.585, 20.414) | 0.008 | 1.628 (0.207, 12.781) | 0.643 |
| Depth of invasion | 23.111 (2.808, 190.202) | 0.003 | 25.473 (1.351, 480.376) | 0.031 |
| SCC-Ag level | 3.231 (0.809, 12.896) | 0.097 | ||
| Vascular invasion | 1.636 (0.490, 5.467) | 0.424 | ||
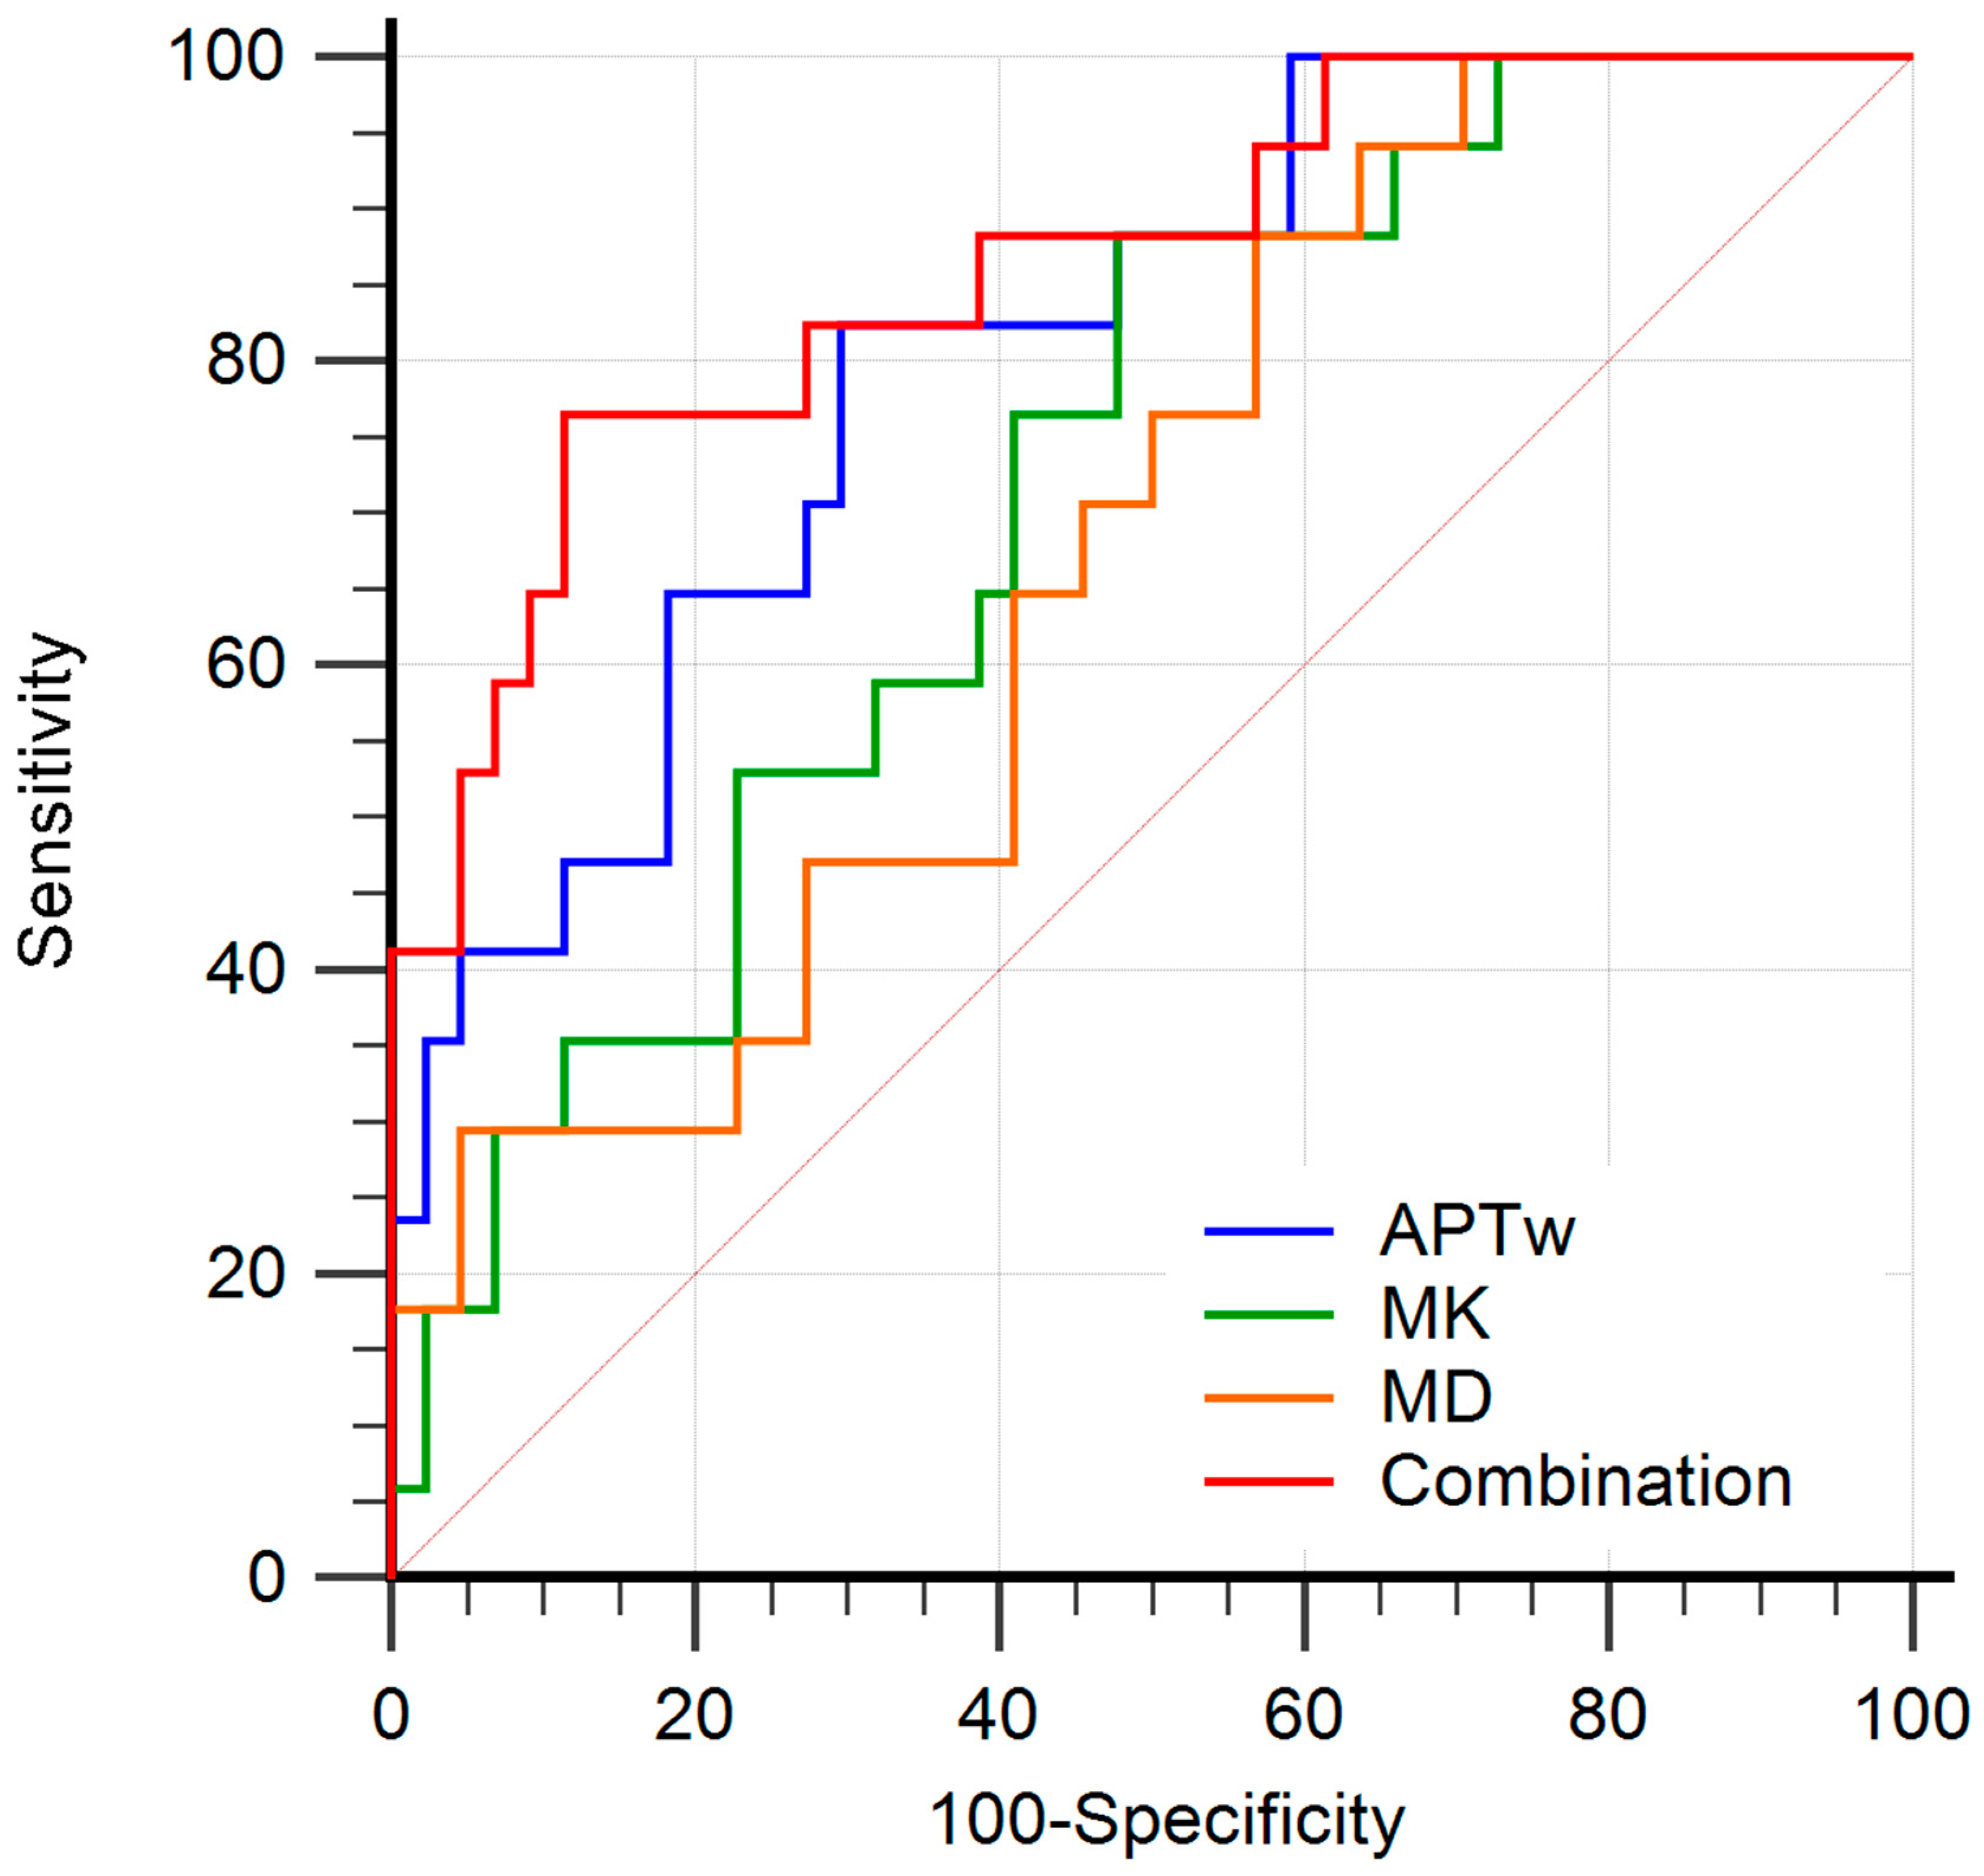
| Parameters | Cutoff | AUC (95% CI) | Sensitivity (%) | Specificity (%) | p | p for Comparison |
|---|---|---|---|---|---|---|
| APTw (%) | 2.856 | 0.807 (0.686–0.897) | 82.4 | 70.5 | <0.001 | 0.132 |
| MK | 0.932 | 0.715 (0.585–0.823) | 88.2 | 52.3 | 0.002 | 0.053 |
| MD (×10−3 mm2/s) | 1.171 | 0.675 (0.543–0.790) | 88.2 | 43.2 | 0.017 | 0.010 |
| Combination | - | 0.864 (0.752–0.938) | 76.5 | 88.6 | <0.001 | Ref |
Disclaimer/Publisher’s Note: The statements, opinions and data contained in all publications are solely those of the individual author(s) and contributor(s) and not of MDPI and/or the editor(s). MDPI and/or the editor(s) disclaim responsibility for any injury to people or property resulting from any ideas, methods, instructions or products referred to in the content. |
© 2023 by the authors. Licensee MDPI, Basel, Switzerland. This article is an open access article distributed under the terms and conditions of the Creative Commons Attribution (CC BY) license (https://creativecommons.org/licenses/by/4.0/).
Share and Cite
Huang, Q.; Wang, Y.; Meng, X.; Li, J.; Shen, Y.; Hu, X.; Feng, C.; Li, Z.; Kamel, I. Amide Proton Transfer-Weighted Imaging Combined with ZOOMit Diffusion Kurtosis Imaging in Predicting Lymph Node Metastasis of Cervical Cancer. Bioengineering 2023, 10, 331. https://doi.org/10.3390/bioengineering10030331
Huang Q, Wang Y, Meng X, Li J, Shen Y, Hu X, Feng C, Li Z, Kamel I. Amide Proton Transfer-Weighted Imaging Combined with ZOOMit Diffusion Kurtosis Imaging in Predicting Lymph Node Metastasis of Cervical Cancer. Bioengineering. 2023; 10(3):331. https://doi.org/10.3390/bioengineering10030331
Chicago/Turabian StyleHuang, Qiuhan, Yanchun Wang, Xiaoyan Meng, Jiali Li, Yaqi Shen, Xuemei Hu, Cui Feng, Zhen Li, and Ihab Kamel. 2023. "Amide Proton Transfer-Weighted Imaging Combined with ZOOMit Diffusion Kurtosis Imaging in Predicting Lymph Node Metastasis of Cervical Cancer" Bioengineering 10, no. 3: 331. https://doi.org/10.3390/bioengineering10030331
APA StyleHuang, Q., Wang, Y., Meng, X., Li, J., Shen, Y., Hu, X., Feng, C., Li, Z., & Kamel, I. (2023). Amide Proton Transfer-Weighted Imaging Combined with ZOOMit Diffusion Kurtosis Imaging in Predicting Lymph Node Metastasis of Cervical Cancer. Bioengineering, 10(3), 331. https://doi.org/10.3390/bioengineering10030331