Abstract
Water footprint (WF) is a comprehensive summation of the volume of freshwater consumed directly and indirectly in all the steps of the production chain of a product. The water footprint concept has been widely used in agricultural water resources management. Water for irrigation is supplied in Sri Lanka to farmers at no cost, and thus the question is arising, whether the current management strategies the authorities and the farmers follow are appropriate to achieve productive water utilization. Therefore, this study aims at evaluating the water footprint of rice production in an irrigation scheme in the dry zone of Sri Lanka, the Walawe irrigation scheme. Due to the unreliability of the rainfall in the study area paddy cultivation depends entirely on irrigation, thus, the , in other terms the volume of water evaporated from the irrigation water supply is considered as the total WF ( in this study. Actual crop evapotranspiration (equivalent to ) was estimated based on the Penman-Monteith (P-M) model integrating effective rainfall, and crop coefficient published in Sri Lankan Irrigation Design Guidelines. The study spanned for three irrigation years from 2018–2021. Actual irrigation water issued to the field was estimated based on the data recorded by the government body responsible for irrigation water management of the area—Mahaweli Authority of Sri Lanka. The total volume of percolated water was computed employing the water balance method while assuming runoff is negligible. Results show that the average annual found to be 2.27 m3/kg, which is higher than global and national . As the crop yield in the study area (6.5 ton/ha) is also higher than the global (4.49 ton/ha) and national (3.5 ton/ha) yields, a conclusion was drawn that the irrigation water usage ( in the area may be significantly higher. It was then noted the higher was due to relatively higher evapotranspiration in the area. Thus, it is vital to reduce excess water usage by shifting irrigation practices from flooded irrigation to the System of Rice Intensification (SRI).
1. Introduction
Agriculture, the main consumer of freshwater globally [1,2] plays a major roll in freshwater scarcity [3]. About 70% of total direct extractions and 90% of indirect consumption (e.g., evapotranspiration) of the freshwater resources are accounted for agricultural water demand, which is predicted to be increased by 55% over the next three decades [2] due to factors such as rapid population growth, economic development, urbanization and climatic changes [3]. Therefore, both future food and water security are at risk. This necessitates increased crop water use efficiencies and sustainable irrigation water management. Characterisation and quantification of both direct and indirect water use in agriculture are paramount to managing agricultural water allocations sustainably to ensure future water security [4].
The concept of water footprint (WF) has been considered a valuable tool by many scholars recently [2,5] in estimating water consumption in agriculture. WF of a product is the comprehensive summation of the volume of water consumed directly and indirectly in all the steps of the production chain of a product. WF is an indicator that characterises consumed water volumes by source and polluted volumes by type of pollution and specifies all the components of consumed water spatially and temporally. WF has three components: Blue WF (), Green WF (), and Grey WF (), which, respectively refer to total evapotranspiration from water withdrawn from surface and groundwater resources (in other terms evaporation from irrigated water), total evapotranspiration from rainwater utilised in crop production and volume of freshwater required to dilute the load of pollutants to the agreed maximum permissible levels [6].
Rice is one of the major crops that feed the global population, with a total annual production of approximately 600 million metric tons, of which about 30% being produced in the South Asian region [7]. In South Asia, a larger portion of agricultural WF could be attributed to paddy due to two factors: (1) rice, being the staple food of South Asians, needs significantly higher production than any other single crop, and (2) rice, being a water intense crop, requires paddy fields to be saturated (in many cases this is achieved by flooding the fields). There are two major rice production systems namely wetland systems and upland systems. Wetland systems can either be rainfed or irrigated. In South Asia, rice occupies about 30–35% of all the irrigated croplands [8], which has shown a substantial expansion over the last few decades [9]. In order to feed the rapidly growing population in the region more rice needed to be produced. Since the rainwater is already scant and unreliable in the study area, with the impacts of climate change, it could be expected have even higher dependability on irrigated rice production. Hence, the pressure on the water resources in the region will be on the rise, as the total the WF of irrigated rice is almost two times that of rain-fed rice [10], demanding a comprehensive and continuous assessment of WF of paddy for efficient irrigation water resources management in the region.
Sri Lanka (refer to Figure 1) an island nation in the Indian Ocean, located between 5° N to 10° N latitudes and 79° E to 82° E longitudes, with a total geographical area of 65,610 km2, is home to approximately 21 million people. Although Sri Lanka represents only a tiny portion of South Asia in terms of both the landmass and the population, because of relative similarities between the rest of the South Asian countries in terms of irrigation practices; policies; socio-economic and environmental conditions, this case study has a considerable potential for up- and out scaling of findings in the region. Although Sri Lanka has agriculture-based economy and some areas in the country are facing water scarcity, there seemed to be little or no attempts in Sri Lanka to evaluate WF, which allows sound overall assessment of water utilizing in crop production as the first step to a proper irrigation water management. This study was formulated to address this identified and vital research gap.
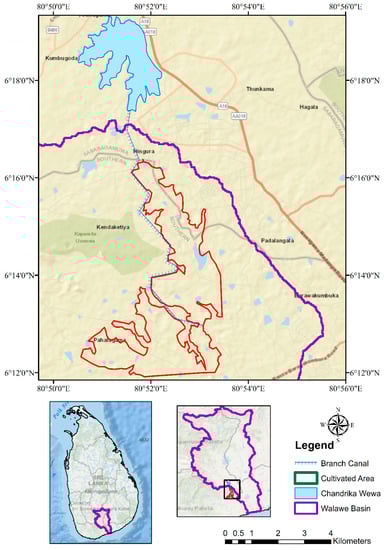
Figure 1.
Cultivated area fed by Chandrikawewa Branch Canal. Source: ESRI ArcGIS Basemap.
Approximately, 10% of the total land area of Sri Lanka (7080 km2) has been allocated as Paddy fields [11]. Sri Lanka records the highest annual rice yield (about 3885 kg/ha) in South Asia [9]. However, the current rice yields are already reaching the maximum yield that could be achieved with the current sown area, which does not seem to be extending [12]. In Sri Lanka, rice is produced in two cultivation seasons namely, namely Yala (April to August) and Maha (November to March next year), which are synonymous with two monsoons: Southwest monsoon (SWM) from March to September and Northeast monsoon (NEM) from December to February [13]. So that, the irrigation year spans from October to September of next year. There are two major climatic zones delineated based on the spatial heterogeneity of rainfall. The two zones, i.e., the Wet zone, and Dry zone, are separated by the 2000 mm annual average rainfall isohyet. Paddy cultivation in Sri Lanka is broadly categorised as (1) wet zone paddy and dry zone paddy based on the local agroecology and (2) low land paddy and upland paddy based on the topography. About 60% of the annual rice production is coming from the dry zone, which receives most of its rain from NEM [14]. Therefore, for this study, a dry zone irrigation scheme was selected to evaluate the of paddy cultivation in the dry zone of Sri Lanka.
2. Study Area
The case study was conducted in an irrigation scheme named, Walawe Special Area of which the administrative activities are being carried out by the Mahaweli Authority of Sri Lanka (MASL), which plays a key role in managing large reservoirs and irrigation distribution systems in Sri Lanka. Walawe Special Area is located in the Walawe river basin in the dry zone of Sri Lanka. “Chandrika wewa” is one of the three major reservoirs in the Walawe basin with a capacity of 27 million cubic meters (MCM). Chandrika wewa has three main canals, namely the right bank canal, left bank canal, and branch canal, irrigating downstream paddy fields. Paddy fields of 1549 ha which are located between 6°12′00″ N to 6°17′00″ N and 80°50′00″ E to 80°54′00″ E) and being fed by branch canal of Chandrika wewa were considered for this study (refer to Figure 1). Irrigation water is supplied to paddy fields by 30 sub canals, both lined and unlined and all having 1 m width, connected to the branch canal of Chandrika wewa (Refer to Table 1 for more details on canals). Discharge from each canal is quantified by measuring water level at the gate to each canal and substituting to a discharge equation derived and calibrated for the scheme. The area is characterised by an average annual rainfall of 1120 mm, with a majority coming from NEM, a flat terrain, with elevation ranging between 60–70 m, and reddish-brown soil. Reddish brown soil shows low hydraulic conductivity values of its bottom layers suggesting possible impedance to water movement under saturation. The profile saturated hydraulic conductivity range between 0.4 and 2.1 cm/hr. The bulk density values range from 1.06 gcm3 to 2.15 gcm3 at 10–20 cm soil depth and from 1.07 gcm3 to 2.18 gcm3 at 40–50 cm depth with averages of 1.68 gcm3 and 1.69 gcm3, respectively.

Table 1.
Details of canals in the study area—length and command area of each canal; number water supplying days per week during the crop growth stage as per MASL rotation plan. L—lined canals, UL—unlined.
2.1. Irrigation Water Allocation
As per ID-SL guidelines, in each cultivation season, the total crop production process can be broadly categorised into two major stages: Land Preparation and Crop growth. The crop growth stage can be further divided into four substages: initial stage; crop development stage; mid-season (mid) stage and late stage. Table 2 shows the duration (in weeks) of each stage for 105 days of paddy cultivation in both seasons. As per MASL, water is issued continuously (24 h everyday) via all sub canals during the Land Preparation, so that the issued water would amount to a field water depth (FWD) of 5 inches (122.5 mm) over 7 days standing in the field. During the crop growth period, irrigation water is supplied according to a rotation plan (given in Table 1 and the same for Yala and Maha seasons) implemented by MASL. The rotation plan is prepared, so that irrigation water issued would sum up to an FWD of 73.5 mm over 7 days during the initial and mid stages, and 49 mm over 7 days for crop development and late stages in both Yala and Maha seasons. These are the depths of water needed to meet the water output from the irrigation system as evapotranspiration during each stage. Thus, the actual water issued to a canal is greater than FWD by 60–70% after accounting for canal losses and field percolation losses.
Table 2.
Duration (in weeks) of land preparation stage and each crop growth stage for 105 days paddy cultivation in Yala and Maha seasons. Lp—Land preparation stage, Initial—Initial stage, Crop dev.—Crop development stage, Mid—Mid season stage and Late—Late stage.
3. Methodology
3.1. Estimation of Water Footprint
WF of a crop product can be expressed in terms of water volume per unit time of production process (m3/yr) or water volume per unit mass of product (m3/kg) [5]. Due to the unreliability of the rainfall in this study area (Walawe irrigation scheme), rainfed irrigation is uncommon, hence all the paddy fields are irrigated—supplemental irrigation. However, as per MASL, all the water requirement of paddy cultivation is released from Chandrika Wewa according to the rotation plan. Thus, it is reasonable to state that paddy cultivation in the study area is based entirely on irrigation, which also means a loss of green water component. Therefore, from the three components of water footprint; , , and , this assessment used , which refers to the volume of water evaporated from the irrigation water supply is considered as the total WF ( in this study. The for rice in the study area was calculated as water volume per unit mass of product as shown in Equation (1), where is the blue water footprint (m3/kg), is the crop blue water use per area (m3/ha) and Y is the crop yield for rice production in the study area (kg/ha). The was estimated for the three most recent irrigation years (2018/19, 2019/20, 2020/21). As per MASL, the average seasonal crop yield of rice in the study area was 6500 kg/ha in all three irrigation years.
was calculated as in Equation (2), where is the total crop blue water use in the field (m3) and is the cultivation area (ha). The was considered as the summation of evapotranspiration from the paddy fields and evaporation from canal water surfaces. for each stage was computed using the relationship given by Equation (3), where is the index denoting a canal, is the blue water evapotranspiration (mm/day), is the command area (ha) under the canal , digit 10 is the unit conversion factor, is the number of days in each stage, is the evaporation from a water surface (mm/day), is the length of the canal , is the length of the canal and is the number of days irrigation water issued via the canal during a given stage. Pan (Class A) evaporation values recorded in 2018, 2019, 2020 and 2021 at the nearest weather station (Hambantota), which were obtained from the Department of Meteorology of Sri Lanka, were considered as .
Total for a given stage was estimated using Equation (4), where is the actual crop evapotranspiration (mm/day), which was estimated by using Equation (5) and is the effective rainfall (mm/day), estimated based on the relationship explained in Ponrajah [15], which provides the guidelines for irrigation designs in Sri Lanka and hereinafter referred to as ID-SL guidelines (as expressed in Equation (6)).
where, is the crop coefficient for a given stage and is the potential crop evapotranspiration (mm/day). values were abstracted from the ID-SL guidelines; = 1.00, 1.00, 1.15, 1.20 and 0.90 for Land Preparation, initial, crop development, mid-season and late stages, respectively. was estimated using the Penman-Monteith (P-M) model standardized by Food and Agricultural Organization (FAO) [16]. Reason for this selection is that the FAO P-M model considered to be applicable worldwide without any extra adjustment to its parameters [16].
where R is the monthly rainfall (mm/month) and digit 30 the unit conversion factor. Equation (7) is the FAO P-M model as expressed in [17].
where, is the total daily PET (mm/day), is the slope of saturation vapour pressure curve (kPa °C−1), is the net incoming radiation (kPa), G is the soil heat flux (MJ m−2), is the psychrometric constant (kPa °C−1), is the average daily temperature (°C), is the wind speed at 2 m height (m s−1), and are the saturation vapour pressure (kPa) and the ambient vapour pressure (kPa), respectively. Rainfall and hydro-meteorological data required by FAO P-M model (i.e., solar radiation, wind speed, relative humidity and temperature) were obtained from the Department of Meteorology of Sri Lanka for the years 2018, 2019, 2020 and 2021. Figure 2 provides a comparison of and . is lower than , and this is in agreement with the findings of Abeysiriwardana [16] who have reported a similar relationship over the whole Sri Lanka. Furthermore, Nandagiri and Kovoor [18] have identified similar relationship between the two parameters in several south Indian states with both paraments ranging within the same range estimated in this study.
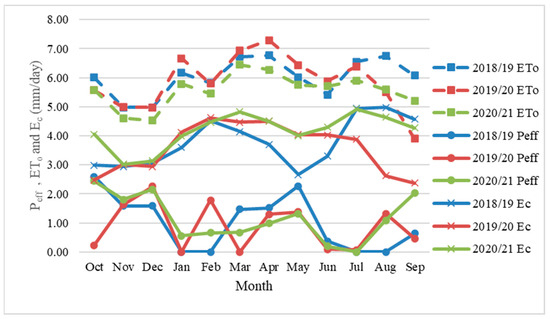
Figure 2.
Temporal variations of ETo estimated by FAO P-M model, Ec and effective rainfall.
3.2. Computation of Total Irrigation Water Issued
In order to find the fraction of in the total crop water use, the total irrigation water issued () via the canals were computed. To account for canal losses (evaporation + percolation) and field percolation losses, FWDs (Section 2.1) were multiplied by respective loss factors relevant to the stage of the cultivation process. Thus, the total IWS from a canal for crop production in a given cultivation season was estimated as in Equation (8).
where, is the index denoting a canal, is the total irrigation water issued via the canal for crop production (m3), is the area cultivated under the canal (ha), is the index denoting a stage in crop production cycle, is the loss factor for stage , is the number of weeks in the stage is the required field water depth in the stage (mm/week) and digit 10 is the unit conversion factor. for land preparation stage is 1.15 and for all the crop growth stages 1.42 (factors used by MASL for estimating discharge volumes).
3.3. Comparison of Irrigation Water Issued and Irrigation Water Requirement Estimated Based on Irrigation Guidelines for the Crop Growth Period
Further, to quantify excess irrigation water usage for paddy production, a comparison was made between the actual irrigation water issues and design irrigation requirement (DIR), which was estimated as per the ID-SL guidelines. Equations (9)–(13) describe the estimation of irrigation requirements and these equations are expressed in this paper as described in the ID-SL guidelines [15].
where, is crop water requirement (mm), is the number of weeks in the respective stage, is reference crop evapotranspiration (mm/month), is the crop factor which is specific for the crop and growth stage, is the field irrigation requirement (mm), is application efficiency (%), is effective rainfall (mm/week), is the monthly 75% probable rainfall (mm), is the irrigation requirement (mm/week) and is the conveyance loss (%). is defined as the “depth of water needed to meet the water loss through evapotranspiration” (ID-SL guidelines). Monthly , R values (Table 3), and values for each stage (Table 4) were extracted from the ID-SL guidelines. for lowland farms and for a supply canal are given as 60% and 70%, respectively (ID-SL guidelines).
Table 3.
Reference crop evapotranspiration values and monthly 75% probability rainfall. Source: ID-SL guidelines [14]. All the values are given in inches in the source, and the values are converted to SI units by multiplying by 25.4.
Table 4.
Crop growth stages and crop factors for lowland paddy.
Finally, the total design irrigation water requirement () of a given canal for a given season was calculated as per Equation (8), where is the index denoting a canal, is the cultivated area under the canal (ha), is the index denoting a stage in crop production cycle, is the number of weeks in the stage and digit 10 is the unit conversion factor.
4. Results
4.1. Water Footprint and Crop Water Use
Using the data collected from MASL, the crop water use and water footprint were calculated for the study period. Stagewise, Seasonal, and annual estimates are given in Table 5. When each stage was considered separately, mid-season stage required the highest in both seasons in all three irrigation years. This can be associated with and . Mid stage of Yala is in July and that of Maha season is in February. Both months have highest values with respect to the other months in respective season. Additionally, the is highest in the mid stage.
Table 5.
Stagewise, Seasonal, and annual crop blue water usage per area.
The initial stage had accounted for the lowest in the Maha season in all three years, whereas, in the Yala season, association of the lowest with cultivation stages was not consistent. of land preparation stage and Late stage were recorded to be higher in the Yala all the time. Though of other stages did not exhibit a similar trend, when the total seasonal considered, of Yala always exceeded that of Maha. This can be clarified by comparing (1) total in Yala season (893.68 mm) and Maha Season (810.78 mm) and (2) total in Yala Season (109.97 mm) and Maha (177.43 mm). It is clear when the entire season is considered Maha records lesser and higher , making it the wetter season of the two. Thus, requirement for irrigation is lower in Maha, hence lower . As per Figure 2, estimated follows a similar pattern in all three irrigation years; however, the displays great differences in each year, and has resulted in above mentioned inconsistencies in values. Average annual of the study area was 14,781.4 m3/ha, with the lowest (13,977.1 m3/ha) was recorded in 2020/21, which can be explained by the fact that the said irrigation year was wetter than the other two years.
Table 6 tabulates seasonal and annual of rice in all three years. Annual were calculated to compare our results with previous studies. Though the annual figures in this study is for an irrigation year defined earlier, estimating annual figures provide a common base to compare with the available literature as cultivation seasons in other countries may differ to those of Sri Lanka. Except in Maha 2020/21, ranges between 1.0–1.3 m3/kg. Considering all three Yala seasons and all three Maha seasons, the average Yala and Maha were found to be 1.22 m3/kg and 1.06 m3/kg, respectively. Average annual of rice production in the study area was 2.27 m3/kg. The spatial variability of WF within the scheme was not significant in all three years in all three years. When WF was estimated separately for each canal, maximum and minimum WF values varied only percentages less than 1% in both seasons.
Table 6.
Seasonal and annual blue water foot print for rice production.
4.2. Total Irrigation Water Issued and Percolation
Seasonal and annual total irrigation water supplied () to the entire command area, which includes both blue water and percolated water, are given in Table 7. As , duration of each stage and cultivated land area under each canal remain the same for both seasons, the , values are the same for both seasons. As per Table 7, the maximum over a stage was 9.049 million m3 and has been issued for the land preparation stage, while the minimum was recorded during a late stage at 3.352 million m3. Total for the entire cultivated land during the initial, crop development stage and mid stages are 5.028 million m3, 4.469 million m3, and 8.380 million m3, respectively. Accordingly, the for the entire command area under consideration, was 30.279 million m3, hence resulted in of 19,547 m3/ha. of each sub canal was found to be as same as the total command area (19,547 m3/ha).
Table 7.
Seasonal and annual total irrigation water supplied (blue water plus percolated water) to the total command area fed by all the 30 canals considered. Lp—Land preparation stage, Initial—Initial stage, Crop dev.—Crop development stage, Mid—Mid season stage and Late—Late stage.
Assuming no runoff occurred (this is the actual field situation according to MASL), the total amount of water percolated was estimated as the difference between and . The annual , and are given in Table 8. Considering the annual estimated percolated amount, the annual average percolation rates were calculated to be 6.53, 6.57 and 6.88 mm/day, respectively in 2018/19, 2019/20 and 2020/21 irrigation years, resulting in average percolation rate of 6.66 mm/day.
Table 8.
Summary of annual total irrigation water supply, total annual blue water volume, total volume of irrigated water that percolated annually and average percolation rate. Notations are as same as described in the text.
4.3. Comparison of Irrigation Water Requirement and Issued
A summary of design irrigation requirement () estimated based on the ID-SL guidelines is shown in Table 9. During the Yala season, varies from the lowest of 3.840 million m3 during the land preparation stage to a maximum of 8.258 million m3 during the mid-season stage. When Maha season is considered, the minimum , which is 0.395 million m3 is recorded in the crop development stage while the maximum of 2.587 million m3 is recorded in the late stage. For all crop growth stages except the initial stage, values in the Maha season are relatively lower than those of the Yala season. Yala season total 29.03 million m3 exceeds the Maha season total (7.37 million m3) by nearly four times.
Table 9.
Summary of design irrigation requirement estimated based on ID-SL guidelines and summed up stagewise, seasonally and annually. Lp—Land preparation stage, Initial—Initial stage, Crop dev.—Crop development stage, Mid—Mid season stage and Late—Late stage.
Figure 3 illustrates a comparison of the stagewise breakdown of and estimated based on, in Yala and Maha, respectively. It was evident that the total values were higher than , in all stages of Maha. However, during crop development and late stages in Yala, the values are lesser than . Furthermore, the seasonal sum of (Table 5) is always greater than (Table 9). Annual is almost twice the .
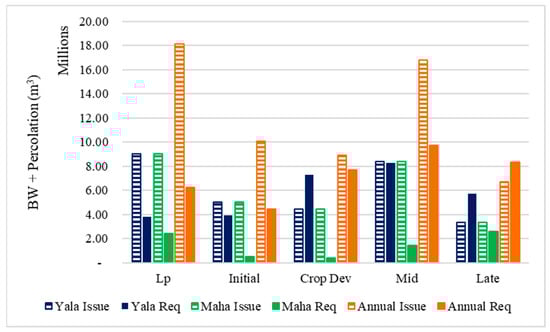
Figure 3.
Stage wise comparison of total irrigation water issued to the field and the computed irrigation water requirement based on ID-SL guidelines.
5. Discussion
When having a Look at previous studies which focused on estimating the of crops, some researchers ([10,19,20]) have considered all three components of (, and ) while some others ([21,22,23]) have omitted . and have always been quantified [24]. However, since this study area receives only a very little rainfall compared to the rest of the country and the cultivation in the area largely depends on irrigation, it can be assumed that the green water component associated with the rice production in the study area is minimal compared to blue water fraction. This assumption was later confirmed by estimated and values, of which the relationship can be expressed as . Based on the same assumption this study evaluated only the of rice production in the area. Therefore, despite the fact the should be slightly higher than the , the study considered computed as the when comparing the results of this study with the previous studies conducted worldwide. As mentioned by some researchers intensified precipitation do not change the substantially, with only about 1% change in when the rainfall increased by 200 mm, neglecting component under this study can be justified [5]. Though the estimated under this illustrated significant variations in the three years considered, did not fluctuate as much over the three years, showcasing a lesser correlation between and , hence, further supporting the study procedure.
As per the literature, the of rice production ranges mostly between 1.0 to 2.0 m3/kg [5], with some outliers going high about 6 m3/kg [20] and low about 0.8 m3/kg [25]. Average Yala, Maha, and Annual of rice production in the present study area were found to be 1.22, 1.06, and 2.27 m3/kg, respectively. Thus, it can be seen that, in the study area, the of rice production in Yala and Maha falls within said range, and the annual is about 11% higher. Mekonnen and Hoekstra [10] have found the global annual (including . and ) of rice as 1.673 m3/kg, which is about 1.4 times lesser than the of rice production in the study area of the present study. component in the global annual was only about 0.341 m3/kg. Thus the global annual was about 85% lesser than the annual in the study area. The average rice yield in the study area is about 6.5 ton/ha, which is nearly 1.5 times higher than the global irrigated rice yield is 4.26 ton/ha [10]. Therefore, the substantial difference in global and study area annual is due to a significantly large irrigation water usage in the study area. As the study area is characterised by a tropical climate (all year long high temperature, humidity, and wind) and receives approximately 12 h of direct sunlight all year long with the sun rising directly above Sri Lanka twice a year, the evapotranspiration in the study area experiences high (6.8–5.00 mm/day). The irrigation practice in the study area can be labelled as full irrigation, where full evapotranspiration demand is met, no water stress occurs and the highest compared to other irrigation methods takes place [26]. This evapotranspiration demand is fully met via flooded paddy fields, which enhances the rate of evapotranspiration. As WF is influenced to a larger extent by the irrigation practice rather than agro climate [10], said irrigation practice in the study area may play a huge role in higher in the area compared to the global .
A past study conducted in Indonesia resulted in of 3.473 m3/kg [19]. Though this figure is 53% higher than the of present study area, given that Indonesia is also a tropical island, it can be expected to have similar crop water demand as in Sri Lanka. However, Bulsink et al. [19] claimed only about 21% of was (0.733 m3/kg) and the majority of (around 73%) was composed of . This suggests that in Indonesia paddy cultivation is mainly rainfed, which is true for the wet zone of Sri Lanka., However, it is in contrast to the dry zone of Sri Lanka, where with the less frequent, less reliable little rain, farmers tend to irrigate the paddy fields instead of utilising the direct rain. Thus, it would be reasonable to compare (which have been considered as ) computed by [19] with As per this study in Indonesia, was 2.528 m3/kg in their study area, which was only about 11.4% higher than the of the present study area [9]. Crop yield in Indonesia is below the global yield [5], hence explain the slightly larger WF. ( computed by [22] for Thailand (2.005 m3/kg) was about 11.7% lower than the outcome of the present study. They also found that the was higher than the . Although Thailand has similar temperature and evapotranspiration as in Sri Lanka, the difference can be the differences in the distribution of rainfall, the length of growing periods, size of the cultivated areas and agricultural practices.
As stated in Chapagain and Hoekstra [7], average of Sri Lanka was 1.32 m3/kg and average rice yield was 3.5 ton/ha—both values are considerably lower than this study’s estimates and data provided by MASL. As per Chapagain and Hoekstra [7], out of the average , only about 44% is and 47% is . These percentages are surprising, as only a small fraction (30%) of Sri Lankan rice production depends entirely on the rain (rainfed) [11]. In other terms it would be expected to have the larger faction from Since Chapagain and Hoekstra [7] have conducted their study for 2000–2004, the discrepancies between the national values obtained by Chapagain and Hoekstra [7] and regional values obtained by this study area may be expected due to many reasons including: (1) increase in total cultivation area, (2) enhanced crop yield and (3) increased evapotranspiration due climate changes. On further note, the seasonal in the study area (Yala–1.22 m3/kg and Maha—1.06 m3/kg) however were closer to the national value of 1.32 m3/kg, with only 7.6% and 20% of deviations in Yala and Maha, respectively. Whereas the annual in the study area exceeded the national value by 72%. In addition to aforementioned, another reason for this may be because in some areas rice cultivation is taken place only in one season (Yala or Maha), whereas in the study area fields are cultivated in both seasons.
and composition of three components (Blue, Green, and Grey) show great differences in different studies [5,10,24]. In addition to before mentioned reasons, the identified differences could be due to various other factors including the type of models used for computations, period considered, crop parameters, climate [10], geographical and geomorphological conditions [23]. The variations also can be due to different crop yield which might have been strongly influenced by factors such as seed quality, agricultural practices, nutrition and fertilizer application. Though many studies [10,19,22] have noted that was greater than , a study [7] showed that in countries like the USA and Pakistan, which depend entirely on irrigation for rice cultivation, is noticeably larger than . This strengthens the argument of the current study, i.e., the contribution from rainfall can be neglected, hence can be considered as with much confidence.
Different studies have used various methods and models to estimate and , however the widely applied method was Penman-Monteith (P-M) equation [19,20,22], under which it was assumed that crop water requirements can be satisfied [5]. Without following previous studies, [5] have measured field water balance and claimed their estimations of WF are closer to the actual situation on the ground than previous studies. Following the widely applied method, this study employed FAO P m method to estimate . However, the actual total water use in any crop production is the WF plus percolation [7]. As WF concepts considers only the loss of freshwater to the catchment and percolation is not really a loss, percolated amount is never considered under WF. In this study, based on the data provided by MASL, the actual amount of irrigation water issued to the field ( was estimated. Then, based on and , field percolation volume and average percolation rate were also computed. The average percolation rate (6.66 mm/day) in the area is well below the range (10 mm/day–20 mm/day) which percolation rate can be expected to vary in reddish brown soil [27]. This supports the assumption of not occurring runoff in the fields, as the percolation rate still can escalate—also explains the highest percolated volume in the wettest irrigation year (2020/21).
Previous studies [2,28] have discussed the sustainability and unsustainability of of crop production. The sustainability indicator is the ratio between the total and blue water availability [2]. Since, in this study area, Chandrika wewa is not only collecting rainwater but receiving transboundary inflow from another large reservoir located in the wet zone, which hardly undergoes water stresses. This water trade between the two basins is irregular making the computation of blue water availability extremely complex. Therefore, this study did not attempt to find the sustainability indicator of rice production in the area.
As annual (or in the study area slightly surpasses global and national annual and some occasions, annual of nearby countries. Therefore, the study proposes to implement water saving measures in the study area for more sustainable agriculture in the area. Given the higher evapotranspiration in the area, the application of the System of Rice Intensification (SRI) is highly recommended. Unlike flooded irrigation, SRI suggests only keeping the soil moisture at saturation level all the time instead of standing water in the field [7]. Unlike flooded irrigation, SRI suggests only keeping the soil moisture at saturation level all the time instead of standing water in the field [7]. In addition to SRI, several other methods such as drip irrigation, rainwater harvesting and alternate wetting and drying (AWD) have been applied worldwide as water saving methods [29]. Most of these methods, do not reduce the potential evapotranspiration, but allow utilization of seasonal rainfall [29], which in this study area goes to waste. Although WF is an excellent tool for overall assessment of water utilization and the need for water saving, as it only accounts for evaporation, evaluation of aforementioned water saving methods is not feasible with WF concept alone. Thus, it requires shifting to or combining WF concept with other methods such as water balancing to estimate other component of local water budget. On further note, this requirement is also one of the identified research gap in Sri Lankan context and would be a part of the future extensions of this project. Change of cultivation calendar and introduction of less water demanding variants of rice are also recommended to save water use. Additionally, it was also observed that the computation of actual irrigation water discharges ( does not incorporate actual meteorological and percolation data. Instead, the practice is to issue the same amount of water each year each season, indicating poor management of irrigation water. Thus, it is highly recommended to use field observed meteorological and percolation data when preparing an irrigation water release schedule. This action in fact could reduce the . Further, the comparison of total water issued ( and estimated total irrigation water requirement displayed significant variations, suggesting a necessity for re-evaluation of the parameter (such as ET0, kc, duration of stages and loss coefficients) given in the ID-SL guidelines, as it is the only guideline in the country to be used in irrigation water management practices. In addition, as mentioned earlier, due to the limitations inherited by WF method, it should be supplemented with other approaches to estimate the efficiencies of each and every changes made to the irrigation scheme.
6. Conclusions
of rice production in an irrigation scheme in the dry zone of Sri Lanka was calculated based on FAO P-M model. The actual irrigation water issued from the reservoir was computed based on the MASL records. The volume of irrigated water percolated was estimated based on the water balance method. Irrigation water requirement was estimated following the guidelines of Sri Lanka ID-SL guidelines. Three recent irrigation years 2018/19, 2019/20, and 2020/21 were considered in this study and the averaged of rice for three years was about 2.27 m3/kg. As the rice production in the study area entirely depends on irrigation, assuming is negligible, was considered as the , which was larger than the global and national of rice as noted by previous other studies. This outcome was attributed to relatively high evapotranspiration, much lower effective rainfall in the area, and the irrigation practice (full and flooded). Therefore, the study highlights the requirement of changing irrigation practice in to System of Rice Intensification to reduce the . Though, no clear pattern of annual could be observed, the findings revealed no significant variations to in wetter years. Furthermore, shows only slight variations in the study years, whereas effective rainfall ( fluctuates significantly during the study period. Thus, the study found no correlation (qualitatively) between the effective rainfall ( and , and concluded that if the rice production is 100% irrigated, there would be no considerable effects of rainfall on the of rice production. The average percolation rate was about 6.66 mm/day, which is below the capacity of the soil type in the area. Thus, it was confirmed that no overflow of irrigated water happened in the field. However, the estimated annual irrigation requirement was substantially lesser than the actual annual irrigation water releases. This indicates that either there is an excessive wastage of freshwater or there is a need to revise ID-SL guideline parameters or both.
It is recommended to change the rotation system to match seasonal needs and considering climate conditions such as rainfall instead of adhering to same pattern both seasons. To reduce water losses through percolation, the study recommends all the canals to be lined in the future, however this may result in other implications on the surrounding ecosystems. Common water savings methods such as rainwater harvesting, drip irrigation, SRI and AWD are suggested by this study. As a further improvement to the current project, it is planned at supplementing WF concept with water balancing to evaluate efficiencies of proposed water savings method.
Author Contributions
Conceptualization, R.S.; methodology, H.K.J.; software, H.K.J. and H.D.A.; validation, H.K.J. and H.D.A.; formal analysis, H.K.J. and H.D.A.; resources, U.R.; data curation, H.K.J. and H.D.A.; writing—original draft preparation, H.K.J.; writing—review and editing, H.D.A., U.R. and R.S.; visualization, H.K.J. and H.D.A.; supervision, U.R. and R.S.; project administration, U.R. and R.S. All authors have read and agreed to the published version of the manuscript.
Funding
This research received no external funding.
Data Availability Statement
Data used in this study can be requested only for research purposes from the corresponding author.
Acknowledgments
The authors would like to acknowledge the Mahaweli Authority, Udawalawe, Sri Lanka for their support in conducting this research (allowing the authors to use their sensitive data in agriculture).
Conflicts of Interest
The authors declare no conflict of interest.
References
- Chu, Y.; Shen, Y.; Yuan, Z. Water footprint of crop production for different crop structures in the Hebei southern plain, North China. Hydrol. Earth Syst. Sci. 2017, 21, 3061–3069. [Google Scholar] [CrossRef]
- Novoa, V.; Ahumada-Rudolph, R.; Rojas, O.; Munizaga, J.; Sáez, K.; Arumí, J. Sustainability assessment of the agricultural water footprint in the Cachapoal River basin, Chile. Ecol. Indic. 2019, 98, 19–28. [Google Scholar] [CrossRef]
- Sidhu, B.; Sharda, R.; Singh, S. Water Footprint of Crop Production: A Review. Indian J. Ecol. 2021, 48, 358–366. [Google Scholar]
- Wanniarachchi, S.; Sarukkalige, R. A Review on Evapotranspiration Estimation in Agricultural Water Management: Past, Present, and Future. Hydrology 2022, 9, 123. [Google Scholar] [CrossRef]
- Cao, X.; Wu, M.; Shu, R.; Zhuo, L.; Chen, D.; Shao, Z.; Guo, X.; Wang, W.; Tang, S. Water footprint assessment for crop production based on field measurements: A case study of irrigated paddy rice in East China. Sci. Total Environ. 2018, 610–611, 84–93. [Google Scholar] [CrossRef]
- Hoekstra, A.; Chapagain, A.; Aldaya, M.; Mekonnen, M. Water Footprint Manual; Water Footprint Network: Enschede, The Netherlands, 2009. [Google Scholar]
- Chapagain, A.; Hoekstra, A. The blue, green and grey water footprint of rice from production and consumption perspectives. Ecol. Econ. 2011, 70, 749–758. [Google Scholar] [CrossRef]
- Bouman, B.; Humphreys, E.; Tuong, T.; Barker, R. Rice and Water. Adv. Agron. 2007, 92, 187–237. [Google Scholar] [CrossRef]
- Morita. Chapter 7—Past growth in agricultural productivity in South Asia. In Water Productivity and Food Security: Global Trends and Regional Patterns; Kumar, D.M., Ed.; Elsevier: Amsterdam, The Netherlands, 2021; Volume 3, pp. 137–156. [Google Scholar] [CrossRef]
- Mekonnen, M.; Hoekstra, A. The green, blue and grey water footprint of crops and derived crop products. Hydrol. Earth Syst. Sci. 2011, 15, 1577–1600. [Google Scholar] [CrossRef]
- Department of Census and Statistics (DoCS). Agriculture. 2022. Available online: http://www.statistics.gov.lk/Agriculture/StaticalInformation/rubpaddy (accessed on 11 September 2021).
- Davis, K.; Gephart, J.; Gunda, T. Sustaining food self-sufficiency of a nation: The case of Sri Lankan rice production and related water and fertilizer demands. Ambio 2015, 45, 302–312. [Google Scholar] [CrossRef] [PubMed]
- Department of Agriculture Sri Lanka (DOA). 2022. Available online: https://doa.gov.lk/home-page/ (accessed on 11 September 2021).
- Ratnasiri, S.; Walisinghe, R.; Rohde, N.; Guest, R. The effects of climatic variation on rice production in Sri Lanka. Appl. Econ. 2019, 51, 4700–4710. [Google Scholar] [CrossRef]
- Ponrajah, A.J.P. Design of Irrigation Headworks for Small Catchments; Department of Irrigation: Colombo, Sri Lanka, 1984. [Google Scholar]
- Abeysiriwardana, H.D.; Muttil, N.; Rathnayake, U.A. Comparative Study of Potential Evapotranspiration Estimation by Three Methods with FAO Penman–Monteith Method across Sri Lanka. Hydrology 2022, 9, 206. [Google Scholar] [CrossRef]
- Allen, R.; Pereira, L.; Raes, D.; Smith, M. Crop Evapotranspiration (Guidelines for Computing Crop Water Requirements); FAO Irrigation and Drainage Paper No. 56; FAO—Food and Agriculture Organization of the United Nations: Rome, Italy, 1998; pp. 65–275. [Google Scholar]
- Nandagiri, L.; Kovoor, G.M. Performance Evaluation of Reference Evapotranspiration Equations across a Range of Indian Climates. J. Irrig. Drain. Eng. 2006, 132, 238–249. [Google Scholar] [CrossRef]
- Bulsink, F.; Hoekstra, A.; Booij, M. The water footprint of Indonesian provinces related to the consumption of crop products. Hydrol. Earth Syst. Sci. 2010, 14, 119–128. [Google Scholar] [CrossRef]
- Zhuo, L.; Mekonnen, M.; Hoekstra, A. The effect of inter-annual variability of consumption, production, trade and climate on crop-related green and blue water footprints and inter-regional virtual water trade: A study for China (1978–2008). Water Res. 2016, 94, 73–85. [Google Scholar] [CrossRef] [PubMed]
- Liu, J.; Zehnder, A.; Yang, H. Historical Trends in China’s Virtual Water Trade. Water Int. 2007, 32, 78–90. [Google Scholar] [CrossRef]
- Gheewala, S.; Silalertruksa, T.; Nilsalab, P.; Mungkung, R.; Perret, S.; Chaiyawannakarn, N. Water Footprint and Impact of Water Consumption for Food, Feed, Fuel Crops Production in Thailand. Water 2014, 6, 1698–1718. [Google Scholar] [CrossRef]
- Zhuo, L.; Mekonnen, M.; Hoekstra, A. Sensitivity and uncertainty in crop water footprint accounting: A case study for the Yellow River basin. Hydrol. Earth Syst. Sci. 2014, 18, 2219–2234. [Google Scholar] [CrossRef]
- Lovarelli, D.; Bacenetti, J.; Fiala, M. Water Footprint of crop productions: A review. Sci. Total Environ. 2016, 548–549, 236–251. [Google Scholar] [CrossRef]
- Yoo, S.; Choi, J.; Lee, S.; Kim, T. Estimating water footprint of paddy rice in Korea. Paddy Water Environ. 2013, 12, 43–54. [Google Scholar] [CrossRef]
- Chukalla, A.; Krol, M.; Hoekstra, A. Green and blue water footprint reduction in irrigated agriculture: Effect of irrigation techniques, irrigation strategies and mulching. Hydrol. Earth Syst. Sci. 2015, 19, 4877–4891. [Google Scholar] [CrossRef]
- Jayawardane, S.; Weerasena, L. Crop diversification in Sri Lanka. In Proceedings of the Crop Diversification in the Asia-Pacific Region, Bangkok, Thailand, 4–6 July 2000; Food and Agriculture Organization of the United Nations Regional Office for Asia and the Pacific: Bangkok, Thailand, 2000. Available online: https://www.fao.org/3/x6906e/x6906e00.htm#Contents (accessed on 4 December 2021).
- Mekonnen, M.; Hoekstra, A. Sustainability of blue water footprint of crops. Adv. Water Resour. 2020, 143, 103679. [Google Scholar] [CrossRef]
- Alauddin, M.; Sarker, A.R.; Islam, Z.; Tisdell, C. Adoption of alternate wetting and drying (AWD) irrigation as a water-saving technology in Bangladesh: Economic and environmental considerations. Land Use Policy 2019, 91, 104430. [Google Scholar] [CrossRef]
Publisher’s Note: MDPI stays neutral with regard to jurisdictional claims in published maps and institutional affiliations. |
© 2022 by the authors. Licensee MDPI, Basel, Switzerland. This article is an open access article distributed under the terms and conditions of the Creative Commons Attribution (CC BY) license (https://creativecommons.org/licenses/by/4.0/).