Article

Hydro-Climate Variability and Trend Analysis in the Jemma Sub-Basin, Upper Blue Nile River, Ethiopia

by
Kidist Hilemicael Gonfa
1,
Tena Alamirew
2 and
Assefa M Melesse
3,*
1
College of Natural and Computational Sciences, Africa Center of Excellence for Water Management (ACEWM), Addis Ababa University, Addis Ababa 1176, Ethiopia
2
Water and Land Resource Center (WLRC), Addis Ababa University, Addis Ababa 1176, Ethiopia
3
Department of Earth and Environment, Florida International University, Miami, FL 33199, USA
*
Author to whom correspondence should be addressed.
Hydrology 2022, 9(12), 209; https://doi.org/10.3390/hydrology9120209
Submission received: 10 October 2022 / Revised: 17 November 2022 / Accepted: 21 November 2022 / Published: 24 November 2022
(This article belongs to the Special Issue Stochastic and Deterministic Modelling of Hydrologic Variables)

Abstract

:
Understanding hydro-climate variability in areas where communities are strongly dependent on subsistence natural resource-based economies at finer spatial resolution can have substantial benefits for effective agricultural water management. This study investigated the hydro-climate variability and trend of the Jemma sub-basin, in the Upper Blue Nile (Abbay) basin, using Mann–Kendall test, Sen’s slope estimator, and Standardized Precipitation Index (SPI). Climate data from 11 weather stations inside the basin and two major streams were used for the statistical analysis. The climate data were also correlated with the ENSO phenomenon to explain drivers of the variability. The results show that the sub-basin has been experiencing normal to moderate variability in the annual and Kiremt season rainfalls, but high variability and declining trend for 73% of the minor (Belg) season rainfall, negatively affecting the planting of short-cycle crops that account for about 20% of crop production in the study area. Generally, strong El Nińo (SST anomaly >1) has been correlated to a substantial decline in the Belg season rainfall. Stream-flow variability has also been found to be very high (CV > 30%) in both river flow monitoring stations. Subsequently, ensuring agricultural water security for short-cycle crop production seems to be a risky and daunting task unless supplemented with groundwater conjunctive use or water harvesting.

1. Introduction

The effects of climate change are already being felt in the biosphere and human settlements all over the world [1]. Compared to 100 years ago, the continent of Africa has become warmer [2], resulting in increased incidences of food shortages, crop failures, and drought in the last three decades of the 20th Century due to the effects of climate change [3]. Specifically, the impact has been felt in East Africa, and particularly, Ethiopia, which is widely considered as one of the most vulnerable countries to climate variability and change due to a strong reliance on subsistence agriculture [4,5]. In the Upper Blue Nile Basin (UBNB), significant seasonal and annual variability in the climate and hydrology has been attributed to human activities, such as land use and land cover change (LULC), water abstraction, and changes in water consumption. Therefore, there is an urgent need to plan and manage the limited amount of water resources, as well as to develop alternative plans for future expansion (e.g., shared water supply for the Blue Nile River) by evaluating trends in hydro-climatic variables [6].
Ethiopia’s food security may be significantly impacted by the influence of climatic variability on the UBNB’s water resources. [7]. This is because the basin consists of approximately 14% of the Ethiopian land area and produces 40% of the country’s agricultural produce [8]. Around two-thirds of the population, which entirely depends on agriculture, is estimated to reside in the basin’s highlands, where rainfall is plentiful. The population’s livelihood, however, remains below the poverty line because of the erratic spatial and temporal distribution of rainfall and the increase in dry spells that severely diminish crop yields, and sometimes result in total crop failure [9].
Several hydro-meteorological studies conducted on basin and sub-basin scales have been conducted, focused on a hydro-climatic investigation in the western UBNB [10,11]. However, there have not been nearly enough studies conducted in the eastern half of the UBNB. Although some climate trend studies have been conducted in similar sub-basins [12], the hydro-climatic trends were not extensively studied. The topography of the Jemma sub-basin is noted for its rough terrain, short-distance elevation changes, and the predominance of valleys in the southern regions. Its landscape is primarily composed of hills, with uplands in the central portions. Due to the unique features of the aforementioned study sub-basin, it is important to conduct an in-depth, location-specific hydro-climate analysis in order to successfully choose and execute water management strategies. According to a study conducted in the UBNB, minimum temperatures have significantly increased more than mean and maximum temperatures. The increase is more noticeable in the Belg season (short rain) and dry seasons compared to the Kiremt (main rain). Based on information from 12 rainfall stations across a range of time periods, February rainfall at Debre Markos and the southeast region of the basin displayed a declining trend with statistically significant results. Furthermore, no substantial changes in mean annual, seasonal, or severe flows of the Koga, Rib, Jedeb, and Chemoga catchments have been observed. The Kiremt season flows, on the other hand, exhibited large increases. However, the Belg season inflow had a declining and increasing trend, respectively, as shown in Gilgel Abay and Gumera [10].
Trends in precipitation and stream flow throughout the Abay/Upper Blue Nile Basin were investigated at three weather stations along the river’s main stem from 1964 to 2003 [13]. They exhibited no statistically significant precipitation trends during the study period. Each of the three stations displayed noticeable rising patterns over the Kiremt season. The functioning of the Chara-Chara weir near the outlet of Lake Tana, which was commissioned in 1996, was said to have increased in flow during the dry season [13]. In terms of the long-term variable regions of flow in the UBNB, another study used Mann-Kendall analysis [14]. They observed a substantial upward increase in the overall annual stream flow during the rainy seasons, but a downward trend during the dry season. Despite this, there were no discernible trends in total annual rainfall across the basin. Trends and change-point data for precipitation, temperature, and stream weather stations in the UBNB were analyzed [10]. Researchers discovered a statistically significant increase in temperature during both the Kiremt and Belg seasons, as well as significant fluctuating trends in seasonal and extreme stream flows, respectively. However, there were no significant seasonal or annual differences in precipitation. A study conducted at Lake Tana and on the Blue Nile River found no noticeable pattern in the flow time series [15].
In order to develop an accurate estimate of future climate change scenarios to inform policy decisions linked to water management, a detailed examination of the temporal and spatial variability of rainfall and streamflow data is essential [16]. Therefore, this study evaluated seasonal, inter-annual, and temporal variability, as well as rainfall and streamflow trends. The findings on climate-related changes in the eastern UBNB can potentially be used to prescribe suitable water resource management strategies in regions of sub-Saharan Africa experiencing the adverse effects of climate change.

2. Materials and Methods

2.1. Description of the Study Area

The research was undertaken in the central highlands of Ethiopia, in the Jemma sub-basin, located in the southeastern region of the Upper Blue Nile Basin (UBNB) (Figure 1). The Jemma sub-basin covers an estimated area of 15,000 km2 and is situated between 9°12′10.9′′–10°57′23.9′′ N and 38°6′59.9′′–39°48′46.9′′ E (Figure 1). The altitude of the sub-basin ranges between 991 and 3814 m above sea level (masl). It has an annual rainfall ranging between 697 and 1475 mm, while the mean annual temperature ranges between 9 °C and 24 °C, respectively.
The short rainy season, known locally as Belg, lasts from February to May. Except for the southern and southeastern lowlands, most of Ethiopia experiences this short rainy season. The amount of rain during the season greatly varies in terms of both time and space, and high maximum temperatures are frequently recorded [17]. During the Belg season, March, April, and May are the warmest months [18]. The main rainy season, or Kiremt, is when 80% to 95% of Ethiopia’s crops are produced [19]. It lasts from June to September after the Belg rains, and is characterized by regular rain and uniform temperatures, especially in July and August. For several regions in the country, the majority of rainfall occurs during this season than in others [17]. Accordingly, crop production follows a bimodal rainfall pattern, resulting in two harvesting seasons [20]. However, the short rainy season is erratic, extremely unpredictable, and frequently unproductive, which makes it difficult to harvest during the Belg season [21].

2.2. Data Collection, Quality Control, and Gap Filling

Data on rainfall were acquired from the National Meteorological Agency (NMA) of Ethiopia from 1980 to 2021. The stream flow data were attained from Ethiopia’s Ministry of Water, Irrigation, and Electricity (MoWIE). Precipitation and stream flow data used in the analysis were obtained from 11 meteorological stations and 2 hydrological stations, respectively. The criteria used to select weather stations were based on their availability and the proportion of missing data being less than 10%. For our study, only those stations with higher-quality data were evaluated. The analysis excluded stations with under 30 years of rainfall data and substantial missing values.
The hydro-climate variables of the Jemma sub-basin were tested for homogeneity and autocorrelation. The homogeneity of hydro-climatic variables were checked using Pettit’s test in XLSTAT. The two-tailed test was used to check the autocorrelation of the hydro-climatic variables because the presence of autocorrelation may have affected the results. Missing data was estimated using the Inverse Distance Weighting Method (IDWM) and was calculated using Equation (1) [22].
V o = i = 1 n ( V i D i ) i = 1 n ( 1 D i )
where Vo denotes the estimated value of the missing data, Vi denotes the value of the same parameter at the i-th closest climate station, and Di is the distance between the station with the missing data and the i-th closest station.
Time series plots were used for primary data visualization, and then normality, homogeneity, and outlier tests were conducted using Excel-XLSTAT Add-ins. Normality was analyzed using the Z-test at 0.05 percent significance levels [23].

2.3. Data Analysis

The goal of the data analysis was to identify, calculate, and confirm the variability and trends in rainfall and stream flow across the sub-basin. Our study used the coefficient of variation (CV), the Standardized Precipitation Index (SPI), and other visual formats. The regression and correlation analysis, Mann–Kendall (MK) trend test, and Sen’s slope estimator were used to assess rainfall and stream flow trends. The coefficient of variation (CV) was calculated using Equation (2) to estimate rainfall and stream flow variability. Higher CV values were associated with higher variability.
C V = σ μ
where CV is the coefficient of variation, σ is the standard deviation, and μ is the mean rainfall and stream flow. Coefficient of variation (CV) is used to describe the degree of variability of rainfall in a station [24]. A value is regarded as low (CV < 20), moderate (20 < CV < 30), and high (CV > 30).
SPI was calculated to analyze trends, identify dry and wet years during the period, and evaluate the frequency and severity of droughts [25] as:
SPI = ( x μ ) σ
where SPI stands for Standardized Precipitation Index, x represents the total annual rainfall for a given year, μ is the mean annual rainfall over a period of observation, and σ is the standard deviation of annual rainfall over the same period. The drought severity classes were classified as extreme drought (SPI < −1.65), severe drought (−1.28 > SPI > −1.65), moderate drought (−0.84 > SPI > −1.28), and no drought (SPI > −0.84) [26].

Mann-Kendall (MK) Test and Sen’s Slope

The Mann-Kendall (MK) test is a nonparametric trend test that was used to detect trends because of its data distribution independence and lack of sensitivity to missing values and outliers [27]. Because serial autocorrelation increases the likelihood of the MK trend test yielding a significant trend, lag1- autocorrelation was evaluated to avoid auto-correlation in rainfall and stream flow observations [27,28].
The MK test statistic ‘S’ was calculated based on [27,29,30], using the formula:
S = i = 1 n 1 j = i + 1 n s g n   ( x j x i )
The trend test is applied to a time series Xi that is ranked from I = 1, 2, … n − 1, and Xj, which are ranked from j = i + 1, 2, …. n. Each data point for Xi is taken as a reference point which is then compared with the rest of the data point’s for Xj, so that:
S g n   ( X j X i ) = { + 1   i f (   X j X i ) > 0 0   i f (   X j X i ) = 0   1   i f (   X j X i ) < 0
where Xi and Xj are the annual values in years i and j (j > i), respectively. It is determined that when the number of observations is more than 10 (n ≥ 10), the statistic ‘S’ is approximately normally distributed with the mean, and E(S) becomes 0 [29]. In this case, the variance statistic is given as:
V a r ( S ) = n ( n 1 ) ( 2 n + 5 ) t = 1 n t 1 ( t 1 1 ) ( 2 t 1 + 5 ) 18
where n is the number of observations and ti is the ties of the sample time series. The test statistics Zc are calculated as follows:
Z c = { ( S 1 ) / V a r ( S )   i f   S > 0   0                                                                 i f   S = 0 ( S + 1 ) / V a r ( S )   i f   S < 0
A positive Zc and a negative Zc represent an upward and downward trend for the period, respectively; where Zc has a normal distribution. The slope (i.e., the linear rate of change) and intercept are both estimated using Sen’s Slope test and the slope estimator methods forecast the trend’s size [30,31]. An “upward trend” (rising values over time) is indicated by a positive value of β, whereas a “downward trend” is indicated by a negative value of β. Here, all the slopes (Ti) of each data pair are calculated as described in [30], using Equation (8). In general, it is possible to infer the slope Ti between any two values of a time series X using:
T i = X j X i j i
where Xj and Xk are regarded as data values at times j and k (j > i) Sen’s slope estimator, respectively, which is calculated as Q m e d = T ( N + 1 ) / 2 if N appears odd, and as Q m e d = [ T N / 2 + T ( ( N = 2 ) / 2 ) / 2 ] if N appears even; the median of these N values of Ti is taken. An upward or increasing trend in the time series is indicated by a positive value for Qi, while a downward or falling pattern is shown by a negative value for Qi.
Data that are serially independent or uncorrelated should be subjected to the MK test. In this investigation, the trend-free pre-whitening (TFPW) method was employed to adjust the data for serial correlation, as defined in [27] and [32]. The first stage in TFPW is de-trending the original series, which is done by erasing the linear trend in the data by estimating slope β using Equation (9). After that, Equation (10) was used to construct the de-trended series.
β = ( X j X k j k )
For all k < j. (j = 2, …, n and k = 1, …, n − 1)
Y t = X t β t
where Yt is the trended series, Xt is the original data series value at time t, and b is the slope.
The second step is accomplished by checking the presence of auto-correlation with lag-1 in the de-trended series using Equation (11).
r 1 = 1 n 1 t = 1 n 1 [ Y t Y t ¯ ] [ Y t + 1 Y t ¯ ] 1 n t = 1 n [ Y t Y t ¯ ] 2
where n is the number of years in the de-trended series, Yt is the trended series, the over-bar is the mean of the trended series, and r1 is the lag-1 auto-correlation coefficient. The auto-regressive portion of the de-trended series was removed by evaluating the lag-1 autocorrelation coefficient at a 5% significance level. If the lag-1 auto-correlation coefficient is significant, the auto-correlation component is eliminated from the series using Equation (12). If it is not significant, the original xt data series can be subjected to the MK test.
Y 1 = Y t r 1 Y t 1
where the series Y1 is the one without an auto-regressive component. Using Equation (13), the linear trend is finally added to the new series, and the MK test may be used on this new series.
Y 2 = Y 1 + β t
where Y2 is the new series without auto-regressive and linear trends in the original data series.

3. Results and Discussion

3.1. Hydro-Climate Features of the Jemma Sub-Basin

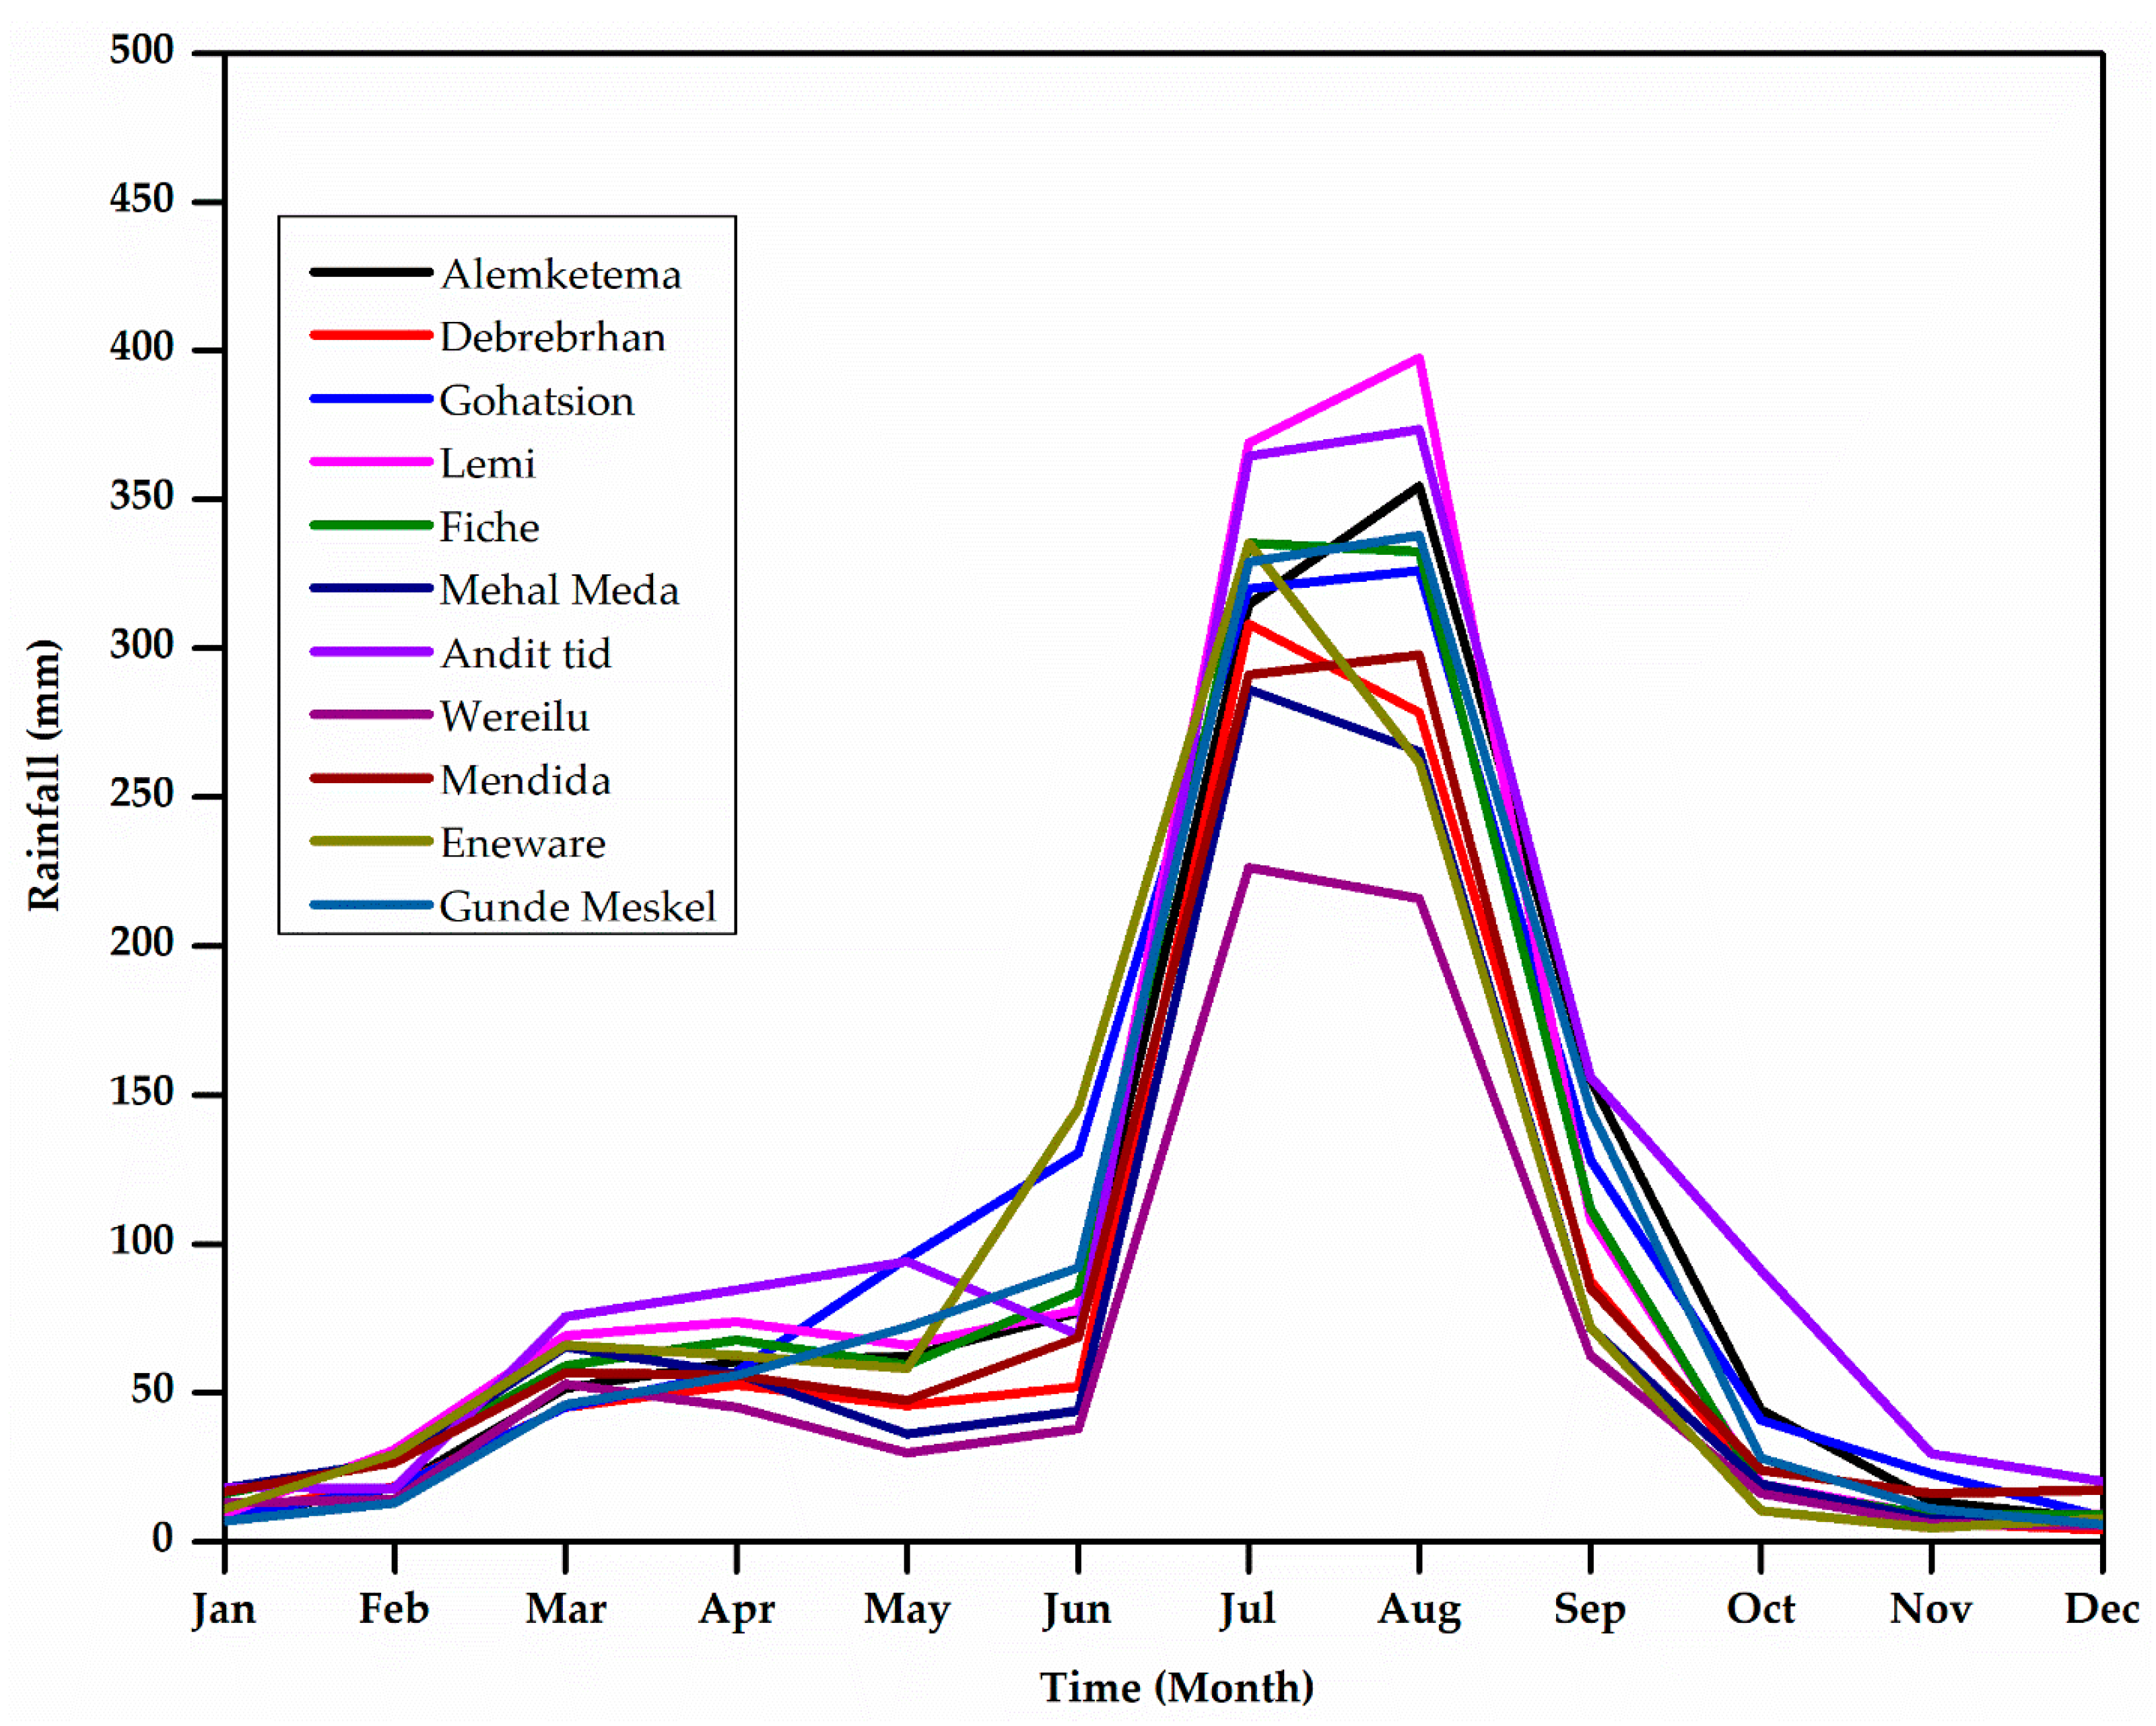
3.1.1. Characteristics of Monthly and Seasonal Rainfall

The mean monthly rainfall distribution is shown in Figure 2. Monthly rainfall was relatively low from October through February. Much of the rain was concentrated between June and August, with the maximum mean monthly rainfall (397 mm) at Lemi station in August. The lowest monthly rainfall was recorded at Debrebrhan in December.
July and August produced the highest rainfall across stations, constituting annual totals of 26 and 32%, respectively. The Kiremt season experienced extremely strong rainfall, with July and August accounting for more than half of the annual total [20].

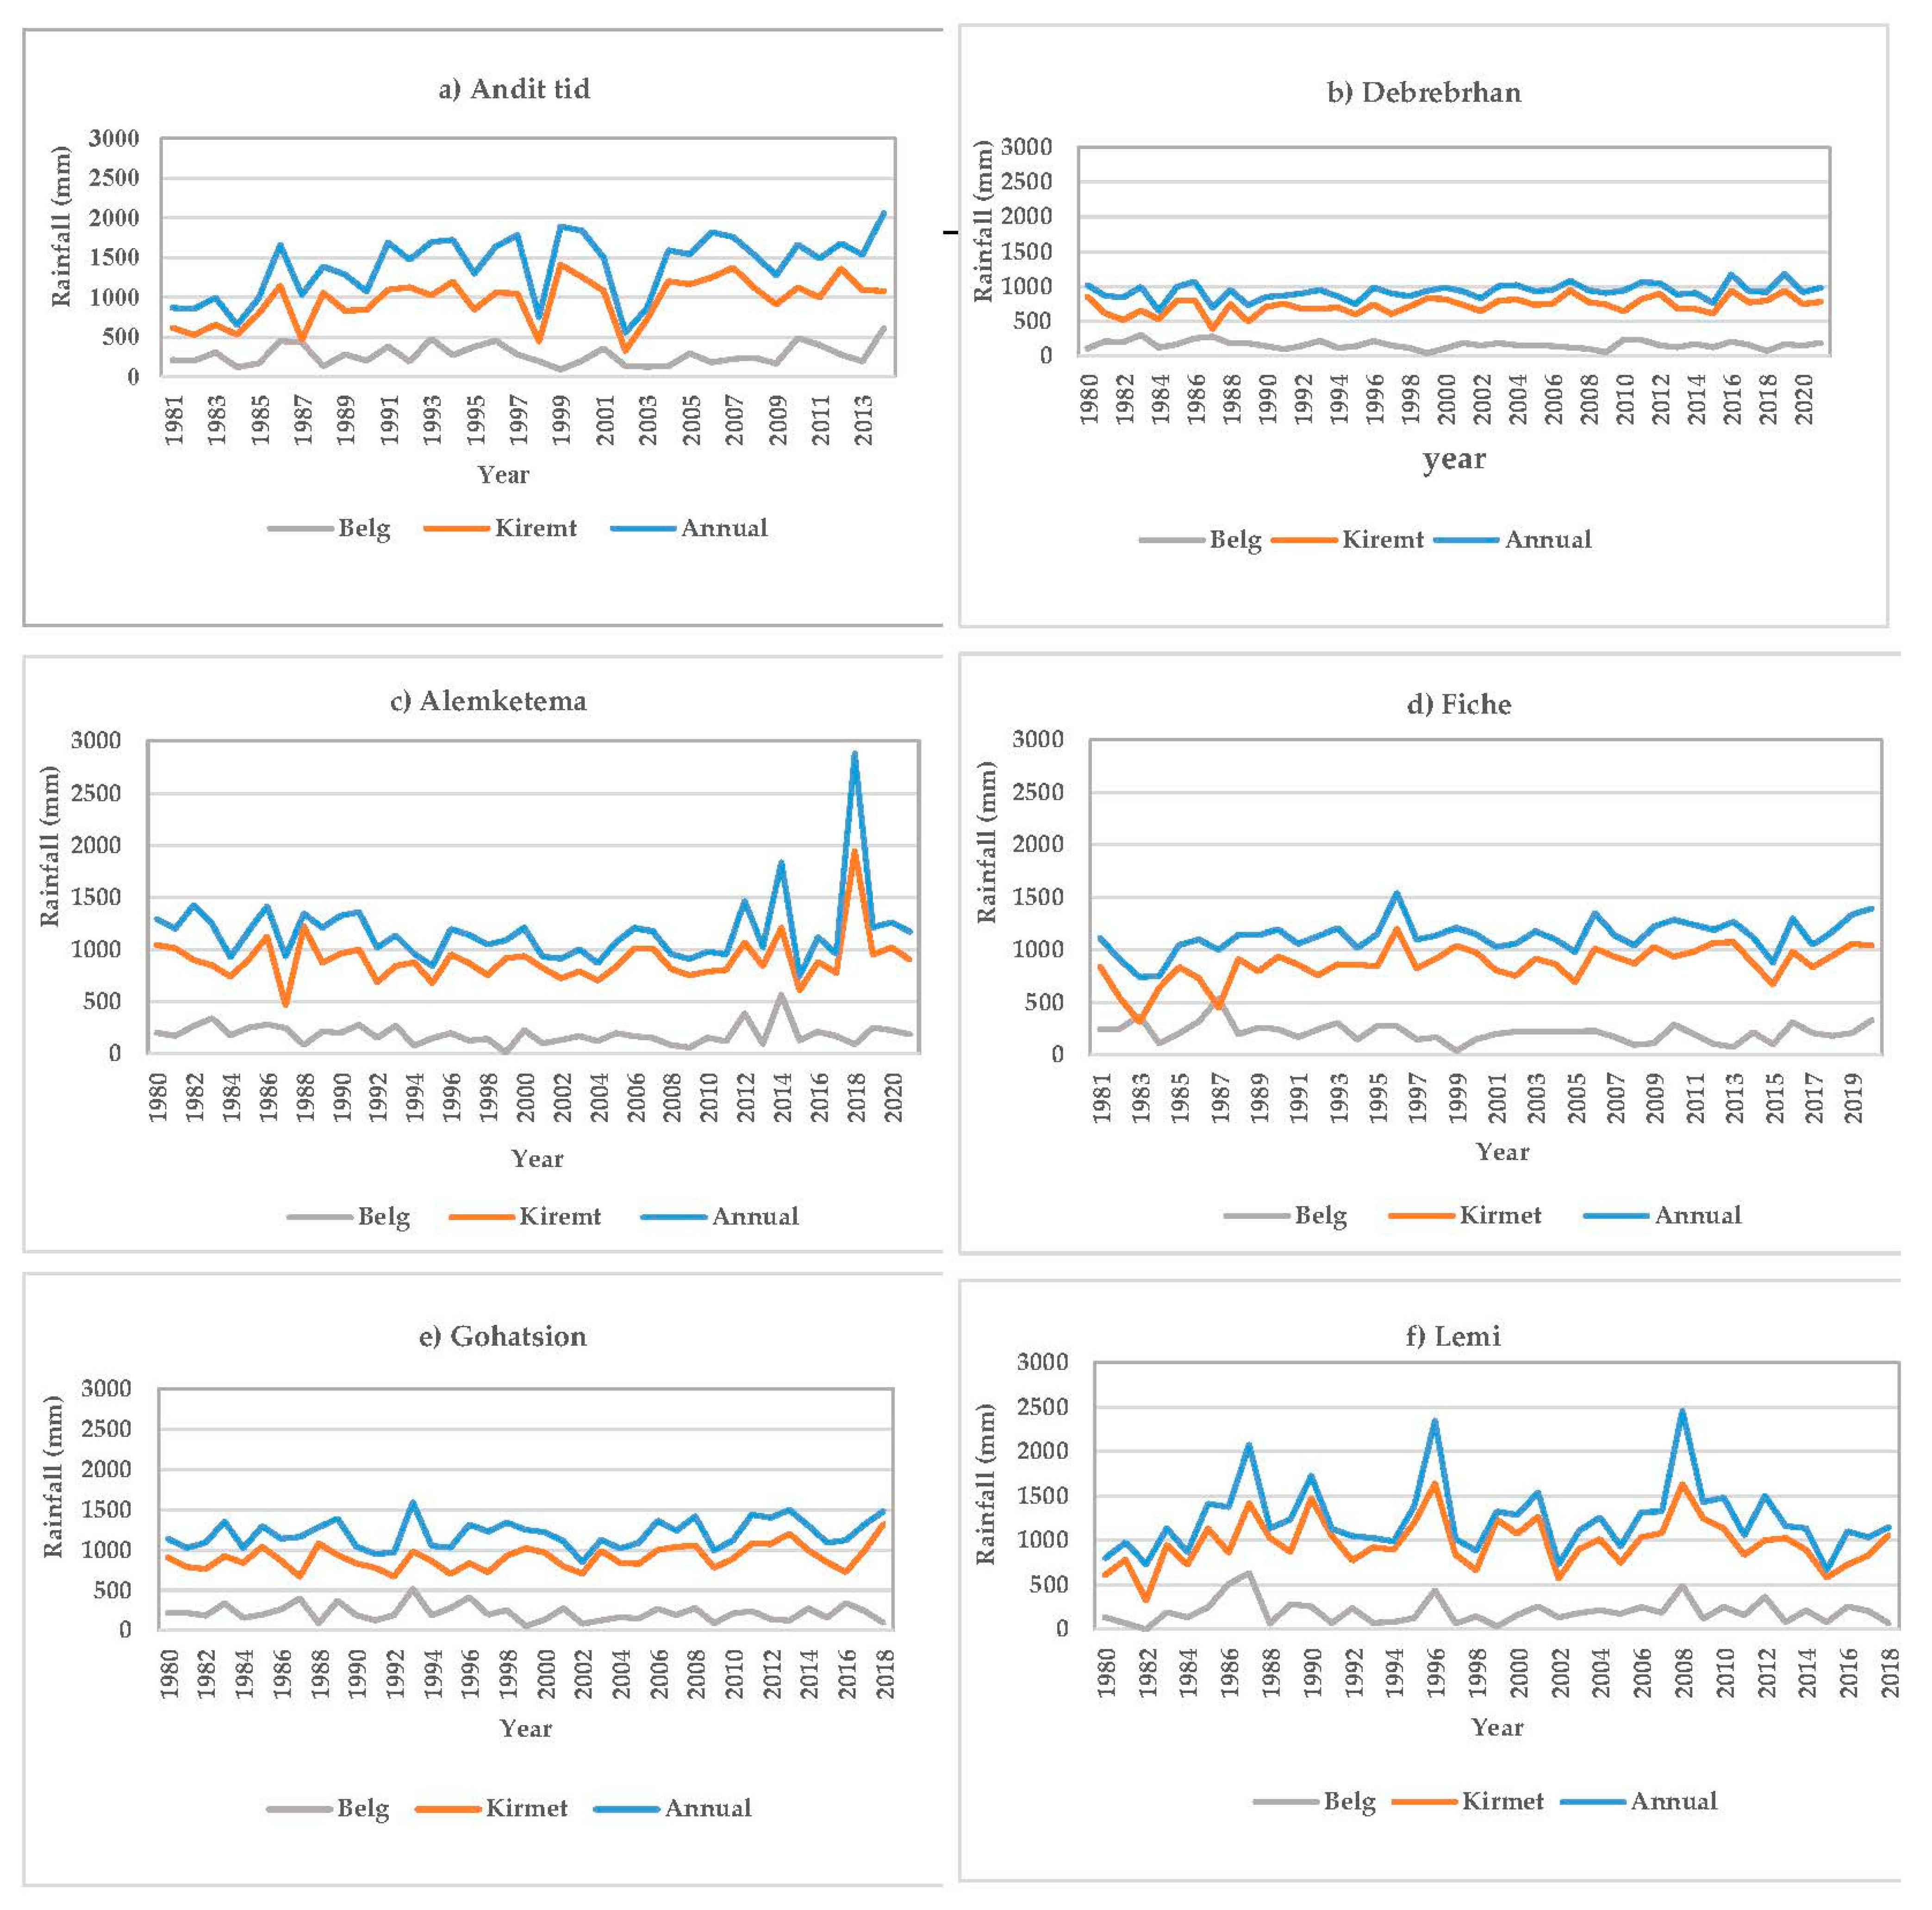
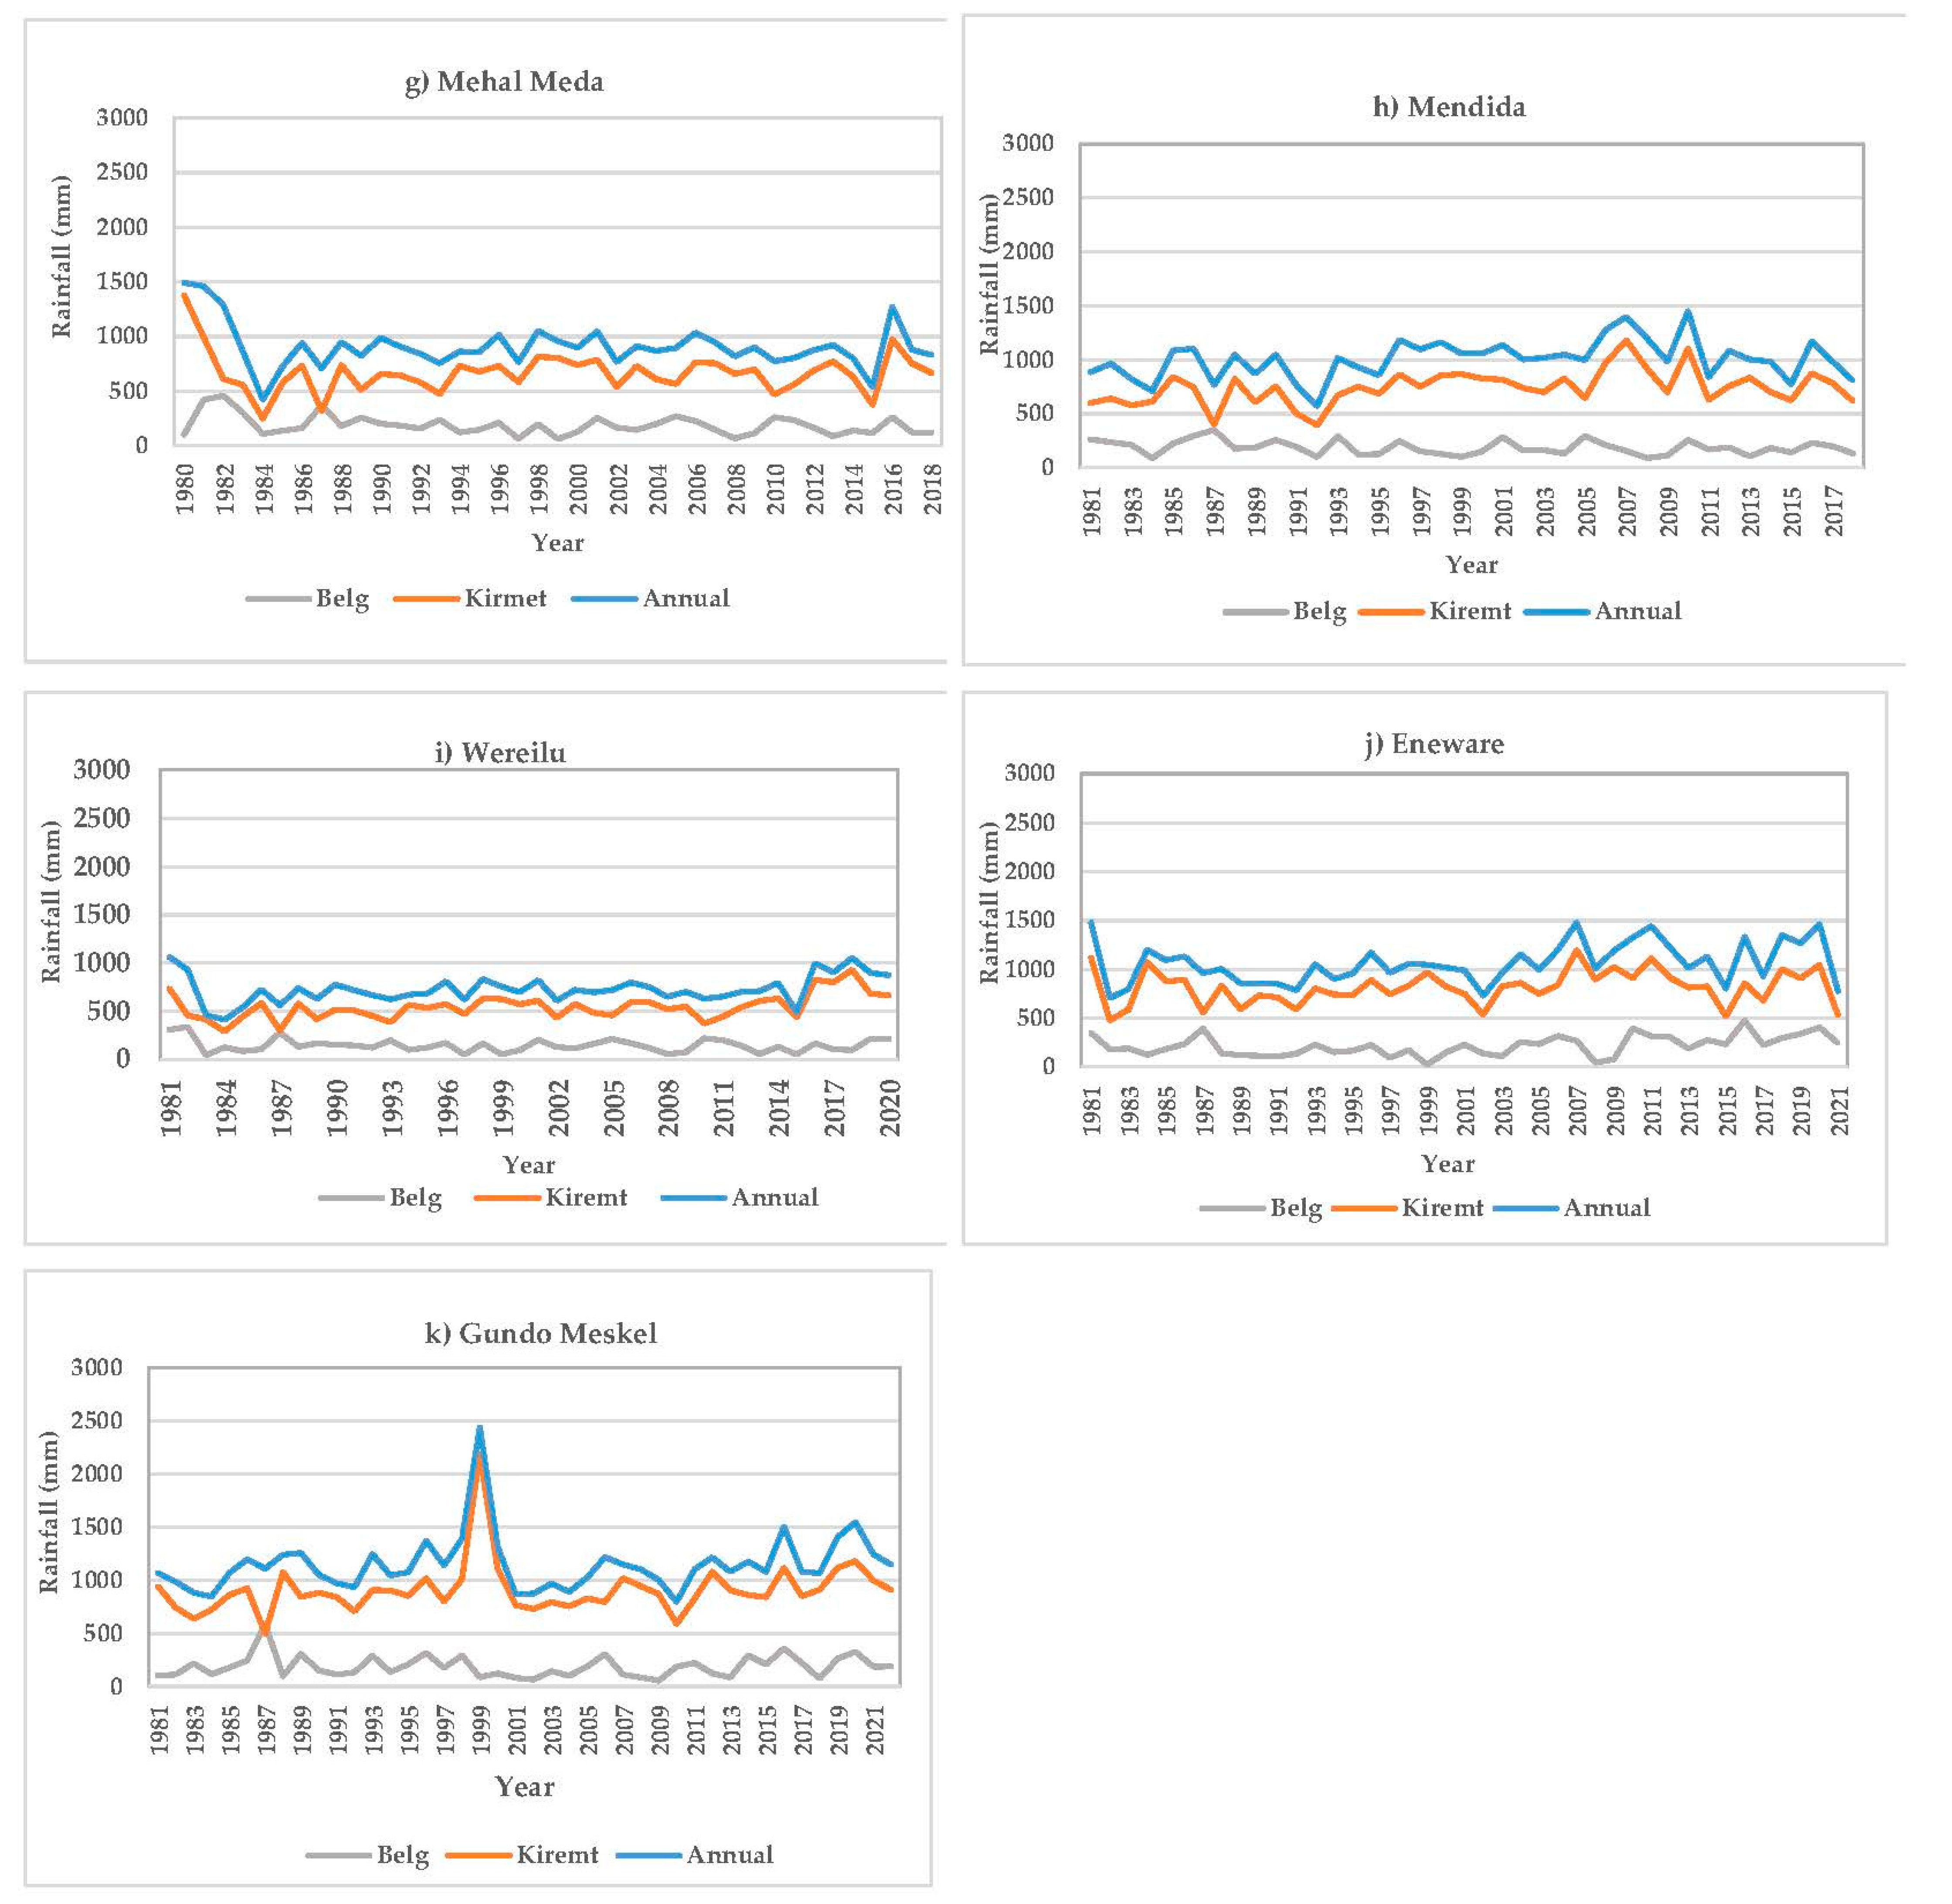
3.1.2. Seasonal and Annual Variability of Rainfall

Figure 3 provides the spatial distribution of mean annual rainfall. The average annual rainfall in a portion of the sub-basin ranges from 1110 to 1170 mm. While the middle region of the sub-basin, where Eneware station is located, receives mean annual rainfall amounts between 1040 and 1100 mm; other areas of the northeastern region receive mean annual rainfall amounts between 731 and 1030 mm. In addition, a section of the southeast region of the sub-basin, where Andit Tid is located, receives mean annual rainfall amounts between 1260 and 1400 mm.
The annual and seasonal rainfall variations at the stations are shown in Figure 4. The maximum Belg, Kiremt seasons, and annual rainfall values of 633 mm, 2180 mm/season, and 2849 mm were recorded during 1987, 1999, and 2018, at Lemi, Gundo Meskel, and Alemketema stations, respectively. Lemi, Mehal Meda, and Wereilu stations recorded the lowest Belg and Kiremt seasons in terms of annual rainfall, respectively. Belg rainfall was lower in years other than those under observation. In the Belg season, between 12 and 90 mm of rainfall was recorded at 73% of the stations in 1999; between 46 and 90 mm at 64% of the stations in 2008; between 53–597 mm at 55% of the stations in 2013; and between 68 and 94 mm at 46% of the stations in 2013.
Seasonal and annual time scales were used to summarize the statistical analysis of the 11 rainfall stations (Table 1). The inter-annual variability of 45.5% of the stations had less than 20% CV (low variability), while 45.5% and 9.1% of the stations had CVs of 20–30% (moderate variability) and >30% (very variable), respectively, based on annual rainfall. Lemi station had a CV of 31.6% in annual rainfall.
During the Kiremt season, rainfall resulted in normal and moderate rainfall variability. A CV of less than 20% (low variability) was recorded by 18.2% of the stations, while a CV of 20–30% (moderately variable) was reported by 81.8% of the stations (Table 1). Both Debrebrhan and Gohatsion recorded a CV of 16.4%, which was less variable. The other nine stations showed a CV of more than 20%, which ranged between 20–29.7%. However, all the stations in the Belg season resulted in a CV greater than 30%, which indicated high rainfall variability during this season; Debrebrhan and Mendida recorded a CV of 34.3% and 35.9%, respectively.
During the Kiremt season, rainfall variability was moderate at Lemi, Mehal-Meda, Fiche, Andit Tid, and Mendida stations. According to [20], a study conducted in one of the sub-basins of the UBNB, the Belg season rainfall CV was 56.57%, which was greater than the Kiremt rainfall CV of 17.51%, implying that Belg rainfall has more inter-annual variability than Kiremt rainfall. The study reported that Kiremt rainfall displayed less variation than Belg rainfall. The highest coefficient of variation in Kiremt rainfall was recorded in Efratana Gidim, with a CV > 23%, and the highest coefficient of variation in the Belg season was recorded at 45% in Basona Werana, which is found in the central highlands of Ethiopia. In addition, Belg and Bega (dry season) rainfall were significantly more variable than Kiremt rainfall [33].
Our findings show that the Belg season’s rainfall has become notoriously unreliable. The decision to plant is a risk. If the Belg season fails, farmers will lose their investments in seeds, fertilizers, and labor. Not planting is also equally uncertain, as the main season tends to be short and is not adequate to cover a full crop growing season. Both the current study and the findings of other studies indicate that it is difficult to rely on Belg rainfall since it so drastically varies [20,33]. In the central highland region of the sub-basin, irrigation is required for agriculture, rather than just relying on rainfall.

3.1.3. Belg and Kiremt Season Contribution to Annual Rainfall

Figure 5 shows that the contribution of the Kiremt season to annual rainfall is more than 70% at almost all of the stations, while the Belg season contributes less than 20%, except for at two stations. Even though the contribution of the Belg season was less than 20%, the averages of both the Belg and Kiremt seasons showed a higher correlation with the annual rainfall, which were 0.85 and 0.96, respectively. On the other hand, the contribution of the Belg and Kiremt seasons to annual rainfall showed a negative correlation (−0.67), indicating that when the Belg season contribution increased, the Kiremt season contribution decreased. This relationship was significantly observed at Andit Tid station, where the Belg average rainfall (272 mm) was relatively higher than all the other stations, and the mean annual rainfall was also at a maximum of 1396 mm (Figure 5). In this station, the contribution of the Kiremt season to annual rainfall was the least, at 69%. Kiremt rainfall contributed 64% of the total annual in Combolcha, and approximately 85% in Gorgora (in the northwestern region) [33].

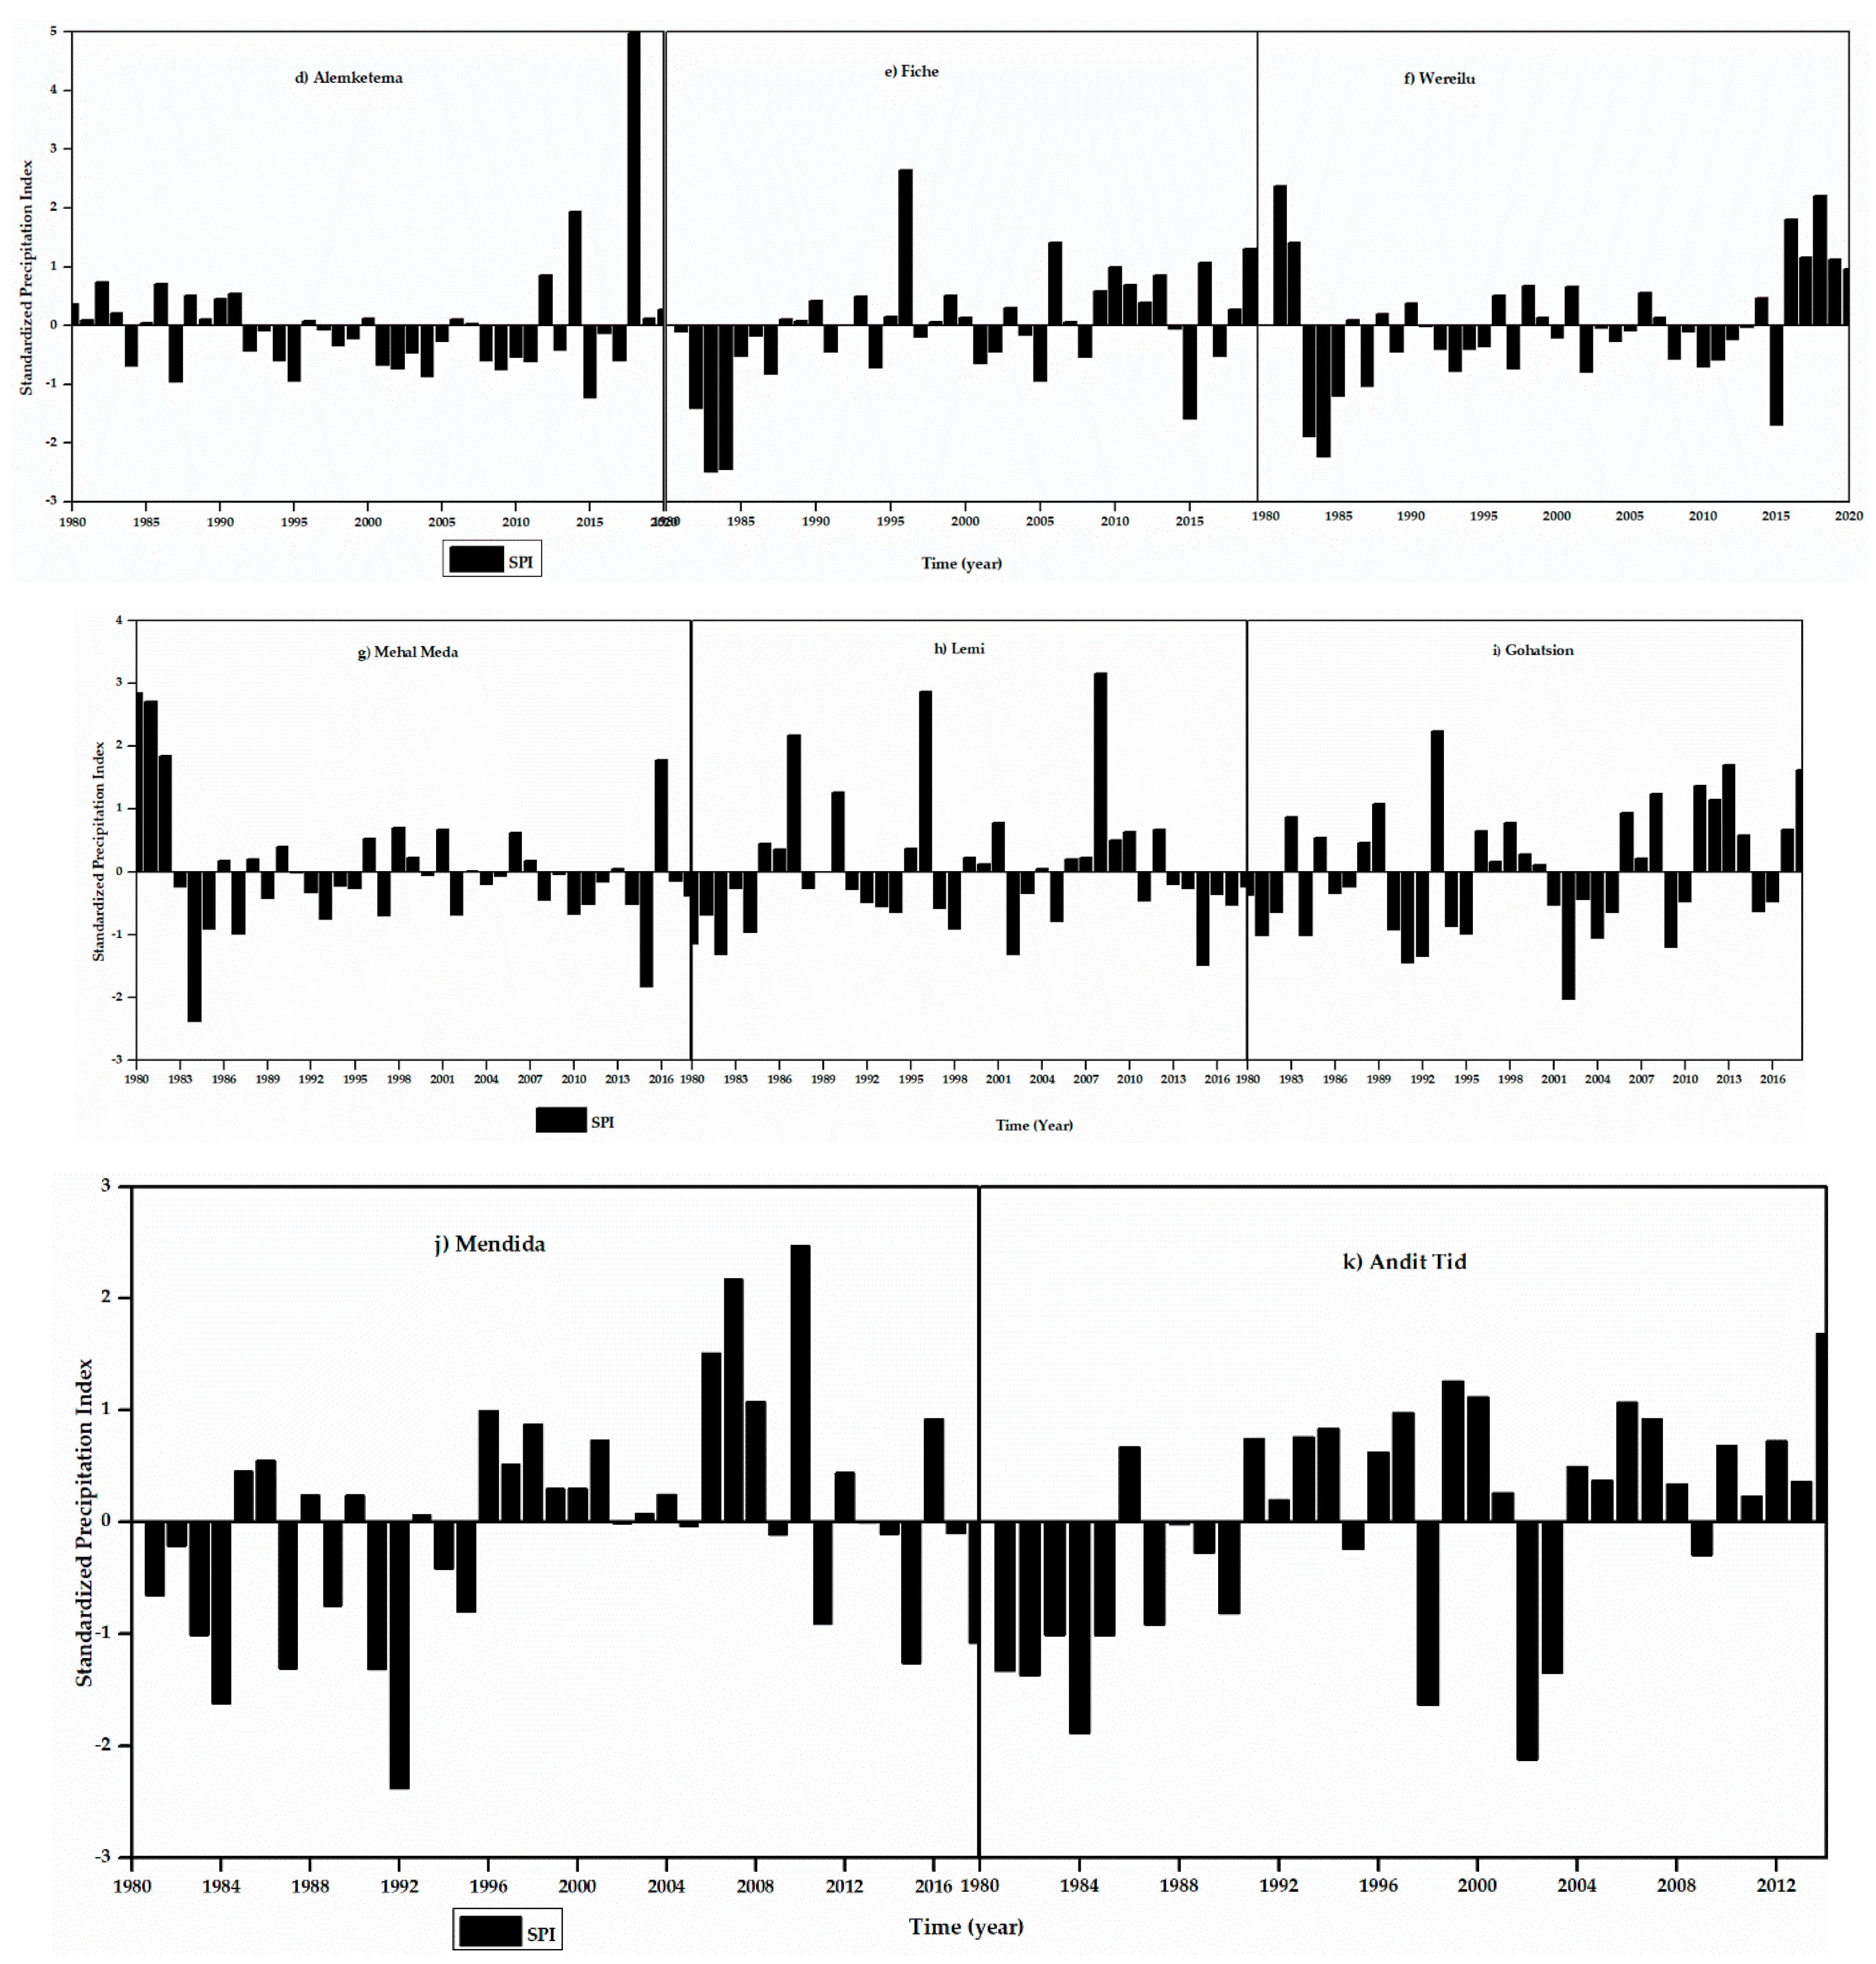
3.1.4. Standardized Precipitation Index (SPI)

According to the SPI analysis results (Figure 6), severe drought was observed at Andit Tid station in 1981 and 1982. The severe drought (−1.28 > SPI > −1.65) was also seen in 1982, at Fiche and Lemi stations. In 2002, extreme drought (SPI < −1.65) was recorded at five of the eleven stations, in 1984. In 1983, there was extreme drought at Fiche and Wereilu stations, in addition to 1984. In 2002, another extreme drought year was observed at Andit Tid and Gohatsion stations, and severe drought was seen at Lemi. In 2015, among six stations, four (Debrebrhan, Fiche, Lemi, and Mendida) recorded severe drought, and the other two (Mehal Meda and Wereilu) indicated extreme drought.
A study conducted in the UBNB supports the aforementioned findings [34]. As documented in the study, droughts in Ethiopia have had a terrible effect on the survival of thousands of individuals. The substantial droughts experienced in Ethiopia over the previous three decades have been linked to ENSO episodes. In Ethiopia, El Niño events occurred in 1984, 1987, 1991–1992, 1993–1994, 2002, 2009, 2012, 2015, and 2016, all of which were accompanied by prolonged drought conditions from April to November, during the country’s primary agricultural season. Recent studies have investigated the impact of El Niño events on Ethiopian rainfall distribution, and the results support these findings [35].

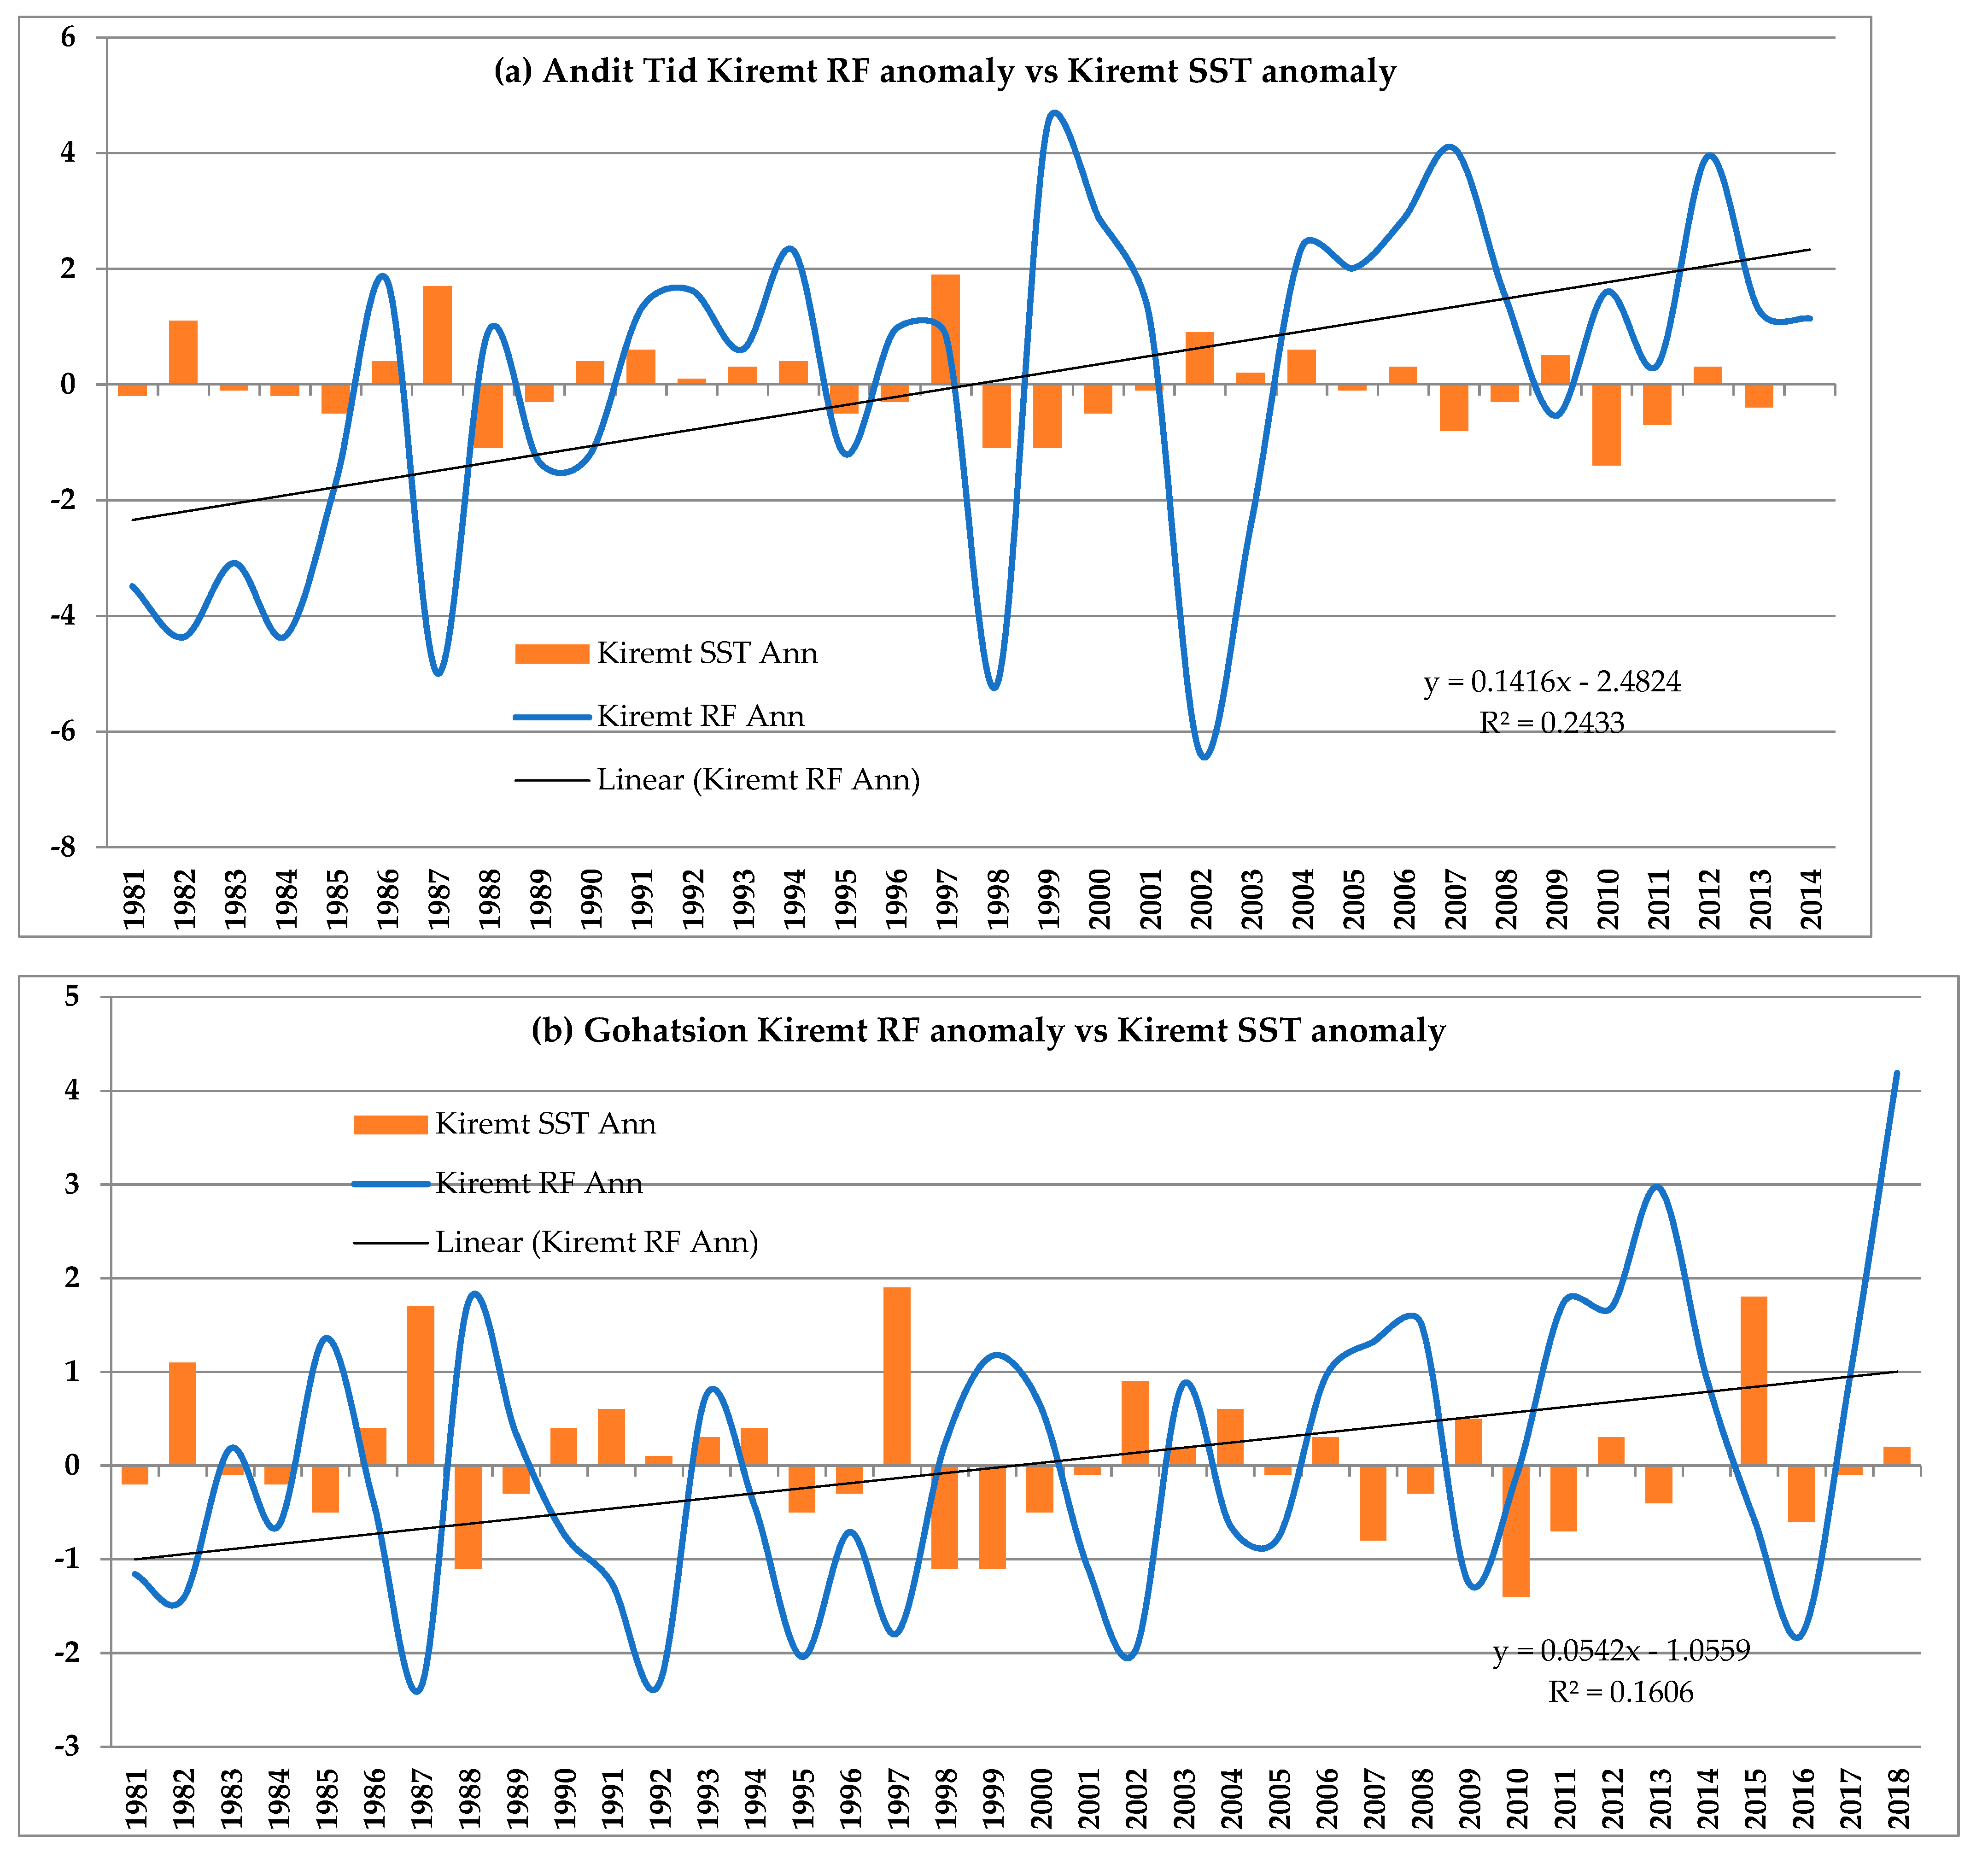
3.1.5. The Link between Belg and Kiremt Rainfall Anomalies with ENSO

This study has been linked with large scale patterns such as ENSO (Figure 7). Table 2 shows the El Niño events that have occurred in Ethiopia [36]. As indicated in Table 2, strong El Niño effects occurred during 1982–1983, 1987–1998, and 2015, which coincide with our identifications of drought years.
The analysis carried out in this study indicates that in 1987, a strong El Niño event year (Table 2), Alemketema station recorded a drought year with a Kiremt sea surface temperature anomaly value of +1.7, which led to a −4.32 Kiremt rainfall anomaly (Figure 7). El Niño impacts were observed at Andit Tid station in 1984, 1987, 1998, and 2002 (Figure 7). El Niño impacts were also observed at Wereilu station in 1987, 1997, 2002, 2005, 2010, and 2015. Eneware station also recorded severe El Niño effects in 1982, 1987, 1988, 2002, and 2015. The results are comparable to Table 2. Therefore, it is of the upmost importance that the possibility of another drought occurring in the future must be considered, and a method must be developed to protect the population from this threat. In addition, Figure 8 and Figure 9 show Belg and Kiremt rainfall anomalies versus SST anomalies using CHIRP data downloaded from: https://earlywarning.usgs.gov/fews/software-tools/20 (accessed on 12 September 2022) for the Jemma sub-basin. Figure 8 shows that, during the Belg season period, strong La Nina years were observed in 1985, 1989, 1999, 2000, and 2008. According to the results, strong El Nino years were observed in 1987, 1997, and 2015 within the study area (Figure 9), which significantly reduced rainfall during the Belg season. Strong La Nina years were observed in 1988, 1998, 1999, 2000, 2007, and 2010, where rainfall was demonstrated in an increasing pattern during these years. The correlation between the two anomalies during the Kiremt season was −0.69, while the correlation between the Belg season anomalies was 0.43.

3.1.6. Monthly and Seasonal Stream Flow Characteristics

The highest flow was recorded at Beressa, 102.37 L/s/km2, while the lowest flow was at Robi-Lemi, 0.13 L/s/km2 in August and May, respectively (Figure 10). From January to June and October to December, the flow conditions were similar at both river stations (Figure 10).
The results from both stream flow stations showed river discharge was low from October to June, but increased in July. Moreover, peak flow occurred in August at both sites. During the dry season, the monthly river flow was low, but rose from June to September during the rainy season. This showed that water availability was constrained during the dry season when irrigation was needed, and increased during the rainy season when irrigation was not required.

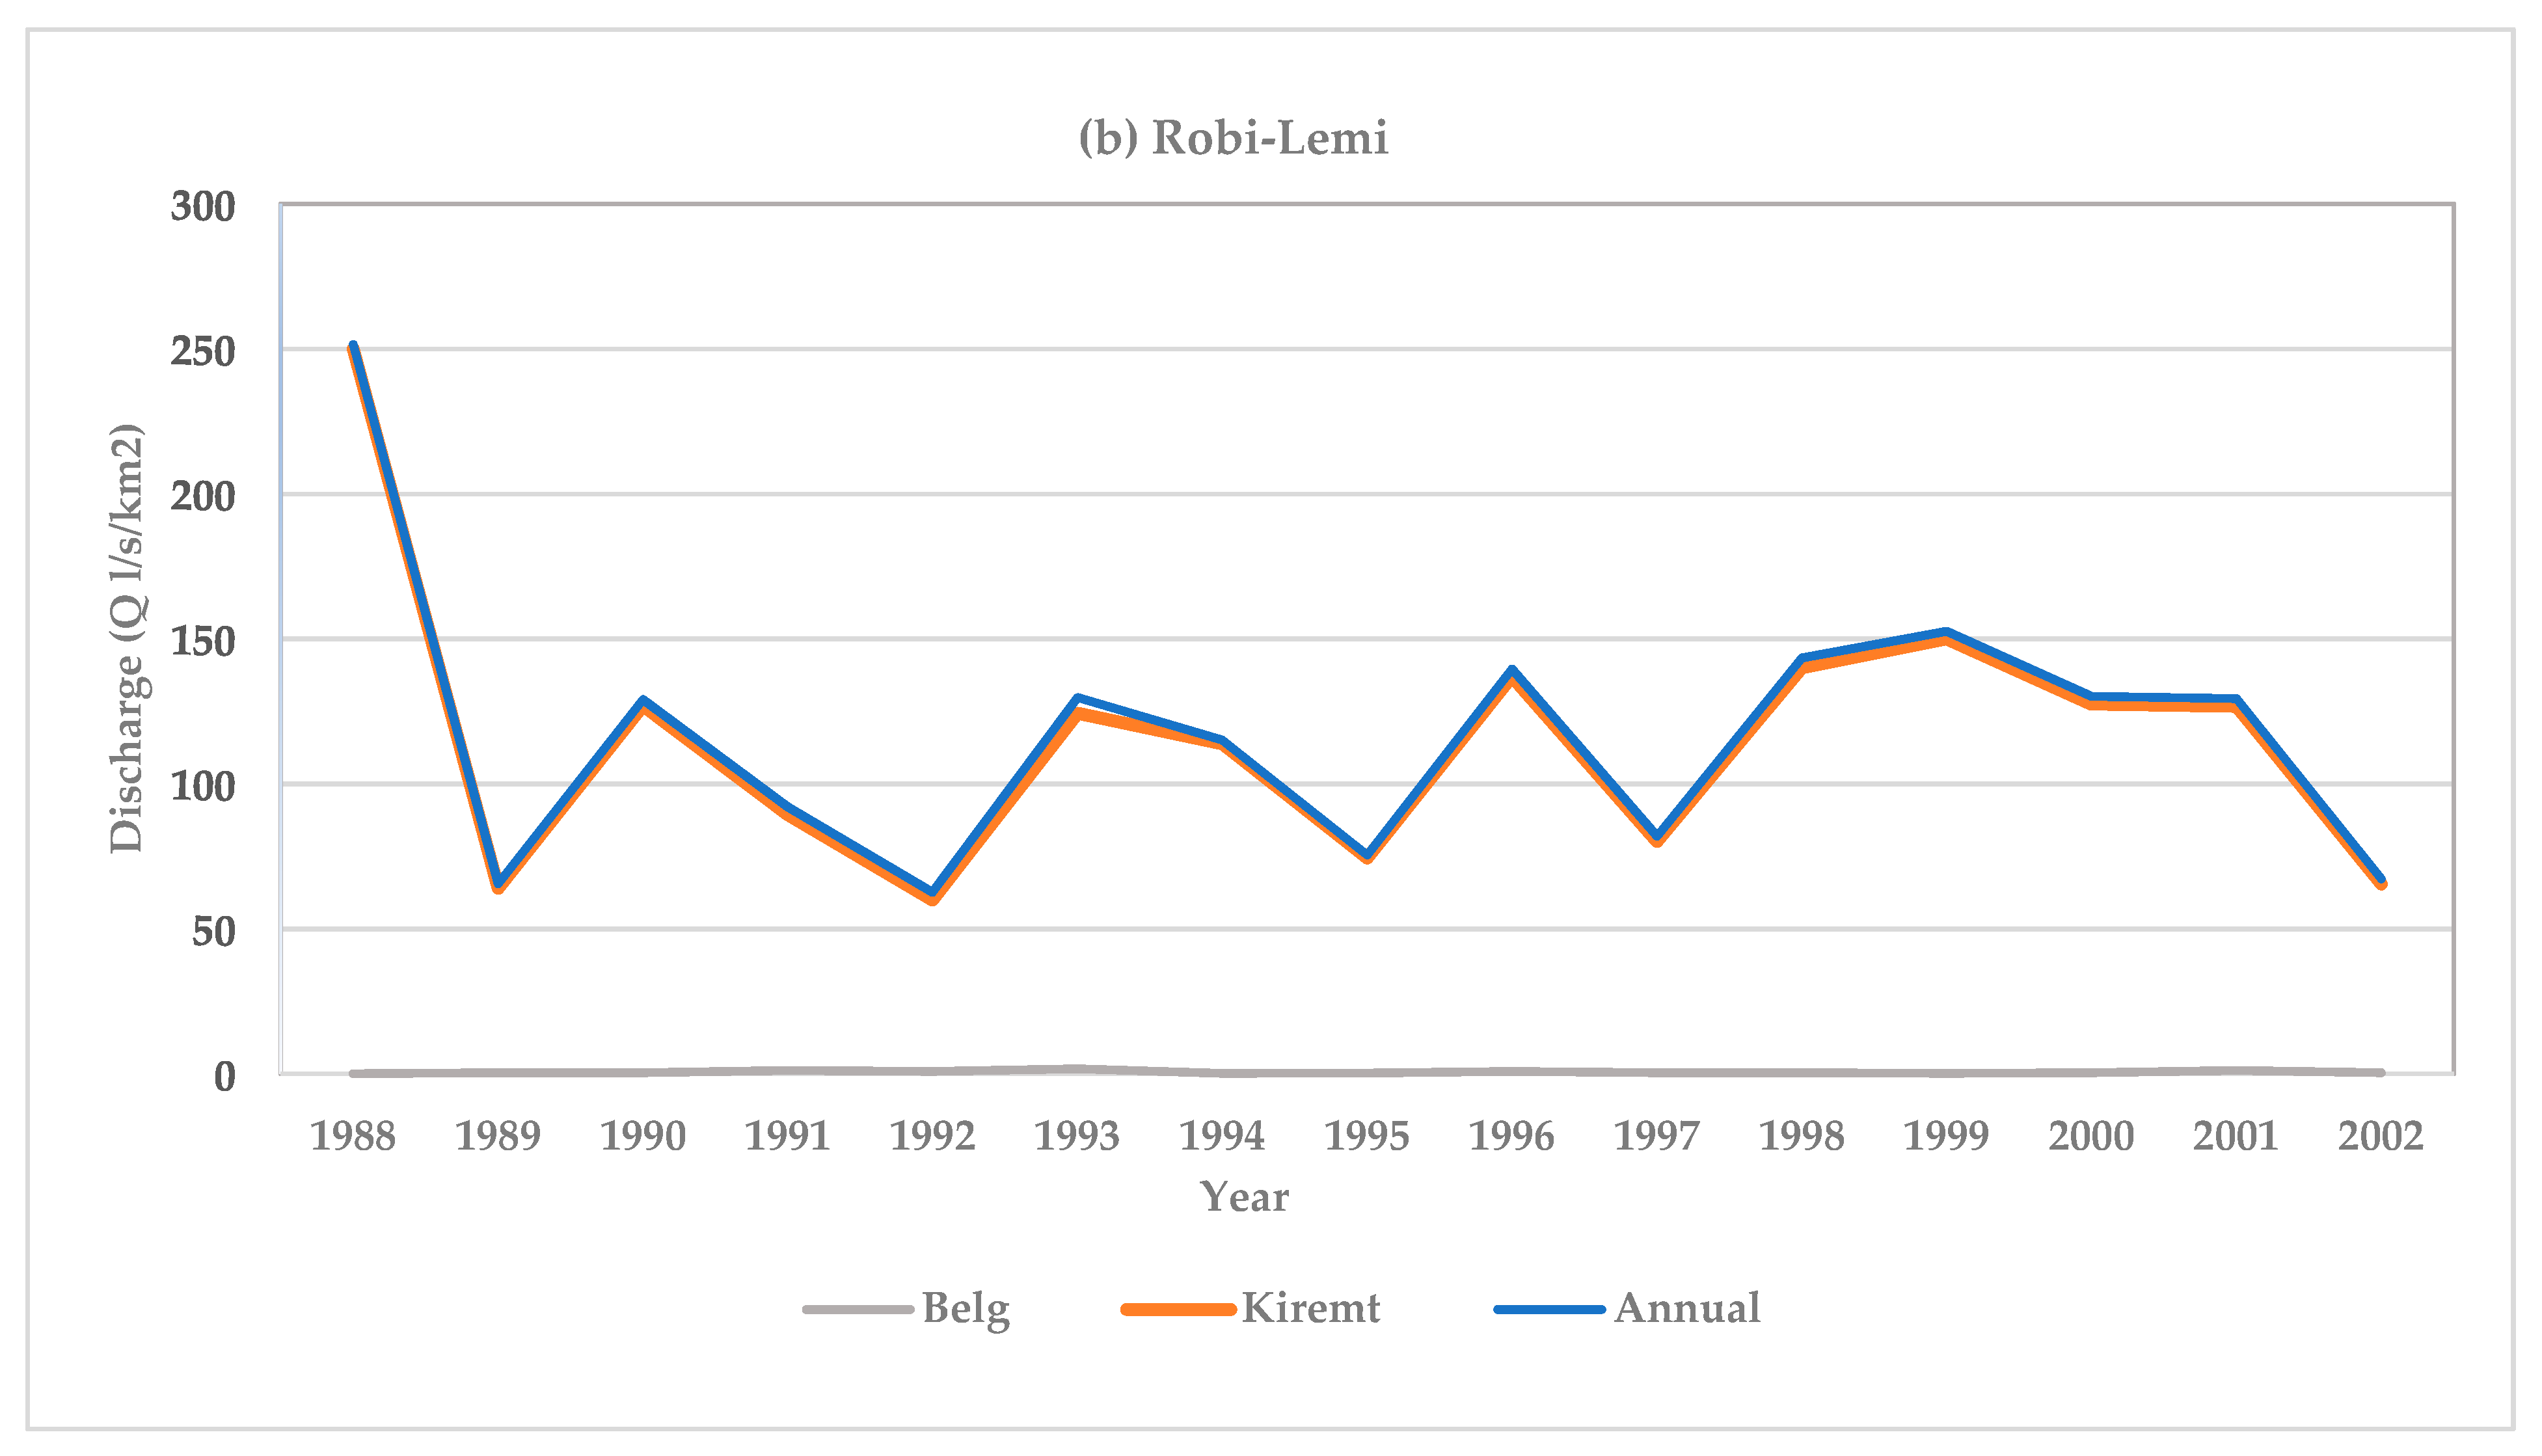
3.1.7. Seasonal and Inter-Annual Variability of Stream Flow

The maximum annual flow occurred at Beressa River, which was 1297.63 L/s/km2 (Figure 11). The annual stream flow ranged from 62.61 L/s/km2 to 697.63 L/s/km2 at Robi-Lemi and Beressa, respectively. Figure 11 shows annual and seasonal stream flow variability at the two stations. Except for 2000, which was recorded as the highest river discharge at Beressa, the graph shows a similar pattern for the annual and Kiremt seasons. At the Robi-Lemi river station, the flow pattern is the same for the annual and Kiremt seasons. However, during the Belg season there was no significant variation.
Low annual and Kiremt season flows were recorded at the Beressa river station from 1990 to 1998. Furthermore, low flow was observed at the same river station from 2002 to 2008, which is explained by the drought event in Ethiopia in 2002 and 2009 [6,20]. The stream flow at the Robi-Lemi station exhibited high variation (Figure 11). Low flows were recorded at the river station in during the periods 1991–1992, 1994–1995, 1997, and 2001–2002. This could be related to Ethiopian drought records, which have been linked to ENSO episodes [20]. Decreasing patterns from 2001 may be due to El Niño phases of ENSO: ‘which are associated with decreased stream flow; however, this is not always the case’ [10,37]. Parched years are most likely associated with El Niño events, while highly wet years are associated with La Niña events in the Blue Nile region of Ethiopia [37]. About 83% of the El Niño events in the Blue Nile region resulted in drought, whereas 67% of extreme flood events were caused when an La Niña event followed the El Niño event [14]. Other studies have corroborated these findings [38,39].
A CV of >30% was recorded at both river stations on both an annual and seasonal basis. In the Belg season, the Beressa River showed a CV of 261%, whereas the Robi-Lemi CV was calculated as 73%. At Robi-Lemi, the CV during the Kiremt season and annual was 42%, whereas at Beressa, the CV during the Kiremt season and annual was 91% and 134%. In Ethiopia’s Rift Valley, a similar outcome was reported [40]. As seasonal stream flow becomes more and more variable, mainly in the Belg season, one of the key crop growing seasons, it will intensify the shortage of accessible water and threats to agricultural activities [11].

3.2. Trend Analysis for Hydro-Climate Variables

The Mann-Kendall test and Sen’s slope estimator results, which were used to examine trends in annual and seasonal rainfall and stream flow, are presented in Table 3. About 64% of the rainfall stations considered in this study demonstrated a downward trend in the Belg (short rain) season; however, it is not statistically significant. At Enewari station, a magnitude of 3.49 mm rainfall trend with a substantial increase was observed during the Belg season. In terms of rainfall during the Kiremt season (main season), 73% of the stations showed a significant upward trend. One can infer from these findings that there may be a change in the amount of rainfall from the Belg season to the Kiremt season.
Annual rainfall trends are displayed in Table 3. As indicated, 36% of the stations recorded a significant increase in trends. At Fiche, Andit Tid, Wereilu, and Eneware stations, the MK analysis resulted in a significantly increasing annual rainfall trend.
At Fiche station, there was a substantial upward increase in annual rainfall during the Kiremt season, and a declining trend during the Belg season [12]. Our study found an increasing tendency for precipitation at some stations in the southeastern region of the Blue Nile basin, contrary to some earlier studies which found no statistically significant increase in rainfall during the last 40 years (1964–2005) in the UBNB [10,11,12]. Significantly, this shows a greater spatial variation in precipitation within the basin.
In general, and according to the trend analysis results (Table 3), rainfall during the Belg season decreased at the majority of stations, with magnitudes ranging from −1.08 mm to −2.25 mm. While rainfall during the Kiremt season showed an increasing trend in 73% of the stations, with magnitudes ranging from 2.35 mm at Lemi to 14.18 mm at Andit Tid. At several of the sites, annual rainfall showed an increasing trend, ranging from 5.76 mm in Fiche to 19.80 mm in Andit Tid. A positive trend in rainfall at the Debrebrhan station without a significant trend has been reported [41]. ‘For the medium-term future (2041–2070), this reveals that under a 2 °C global warming threshold, the magnitude of annual rainfall is expected to shift little (–2.8 to 2.7%), but the direction is unclear.’ The amount of rainfall during the Belg season is expected to decrease in the future. With a few exceptions, these reductions are typically less than 10%, but they might be significant in rain-fed agriculture [42].
For total annual and seasonal stream flow, both locations had a non-significant pattern (Table 3). Beressa demonstrated a declining trend, though this was not significant, with magnitudes −0.001, −1.0, and −1.06 L/s/km2 throughout the Belg, Kiremt, and annual seasons, respectively. The Robi-Lemi river station, on the other hand, recorded an upward trend, with magnitudes of 0.01, 0.4, and 0.2 L/s/km2 during the Belg, Kiremt, and annual seasons, respectively. Considering 17 gauged catchments in UBNB, a separate study estimated future stream flow, with few exceptions [42]. The model rainfall estimates for all five RCMs showed that stream flow in almost all catchments considered in their study would decline. Most catchments experience a 5% reduction in flow magnitude, but some catchments have experienced 5–10% reductions, or even more. It is probable that this is the case because rainfall in the sub-basin is not the only factor affecting stream flow variability and availability. Apart from rainfall characteristics, such as intensity, duration, and distribution, several catchment-specific factors might directly affect the occurrence and volume of stream flow. Such factors may be soil type, vegetation cover, slope, and catchment size, which need further investigation.

4. Conclusions

This study investigated inter-annual variability and trends in rainfall distribution and stream flow in the Jemma sub-basin, Upper Blue Nile, Ethiopia, with a focus on the two rainy seasons; the main and short rainfall seasons locally called the Kiremt and the Belg seasons, respectively. Rainfall variability analyses showed that the sub-basin had a highly variable coefficient of variation (CV) that ranged from 34.3–70.6%. In comparison, the Kiremt season rainfall CV ranged from 16.4% (at Debrebrhan and Gohatsion) to 28.9% (at Lemi) which was regarded as moderate. The annual rainfall CV varied from 12.1–31.6%. Trend analysis results showed that Belg rainfall was decreasing (at 73% of the stations), while Kiremt and annual rainfall were increasing. This revealed that there has been a gradual change in rainfall patterns from bimodal to monomodal rainfall regimes. The significant variability and declining tendency of rainfall in the Belg season, which is responsible for some 20% of the food crop production, is fast declining. Hence, this should trigger policymakers in water resource management to consider strategies, such as water conservation, during the main rainy season.
Moreover, around 46% of the stations’ SPI indicated that extreme drought was observed in 1984. The effect of ENSO was observed at all stations, and significantly observed at some of them. More investigation is therefore required to ascertain the actual cause of the unfavorable anomalies and how to limit their influence on water resources.
The stream flow coefficient of variation was highly variable throughout the year and during both seasons. At both rivers stations, Beressa and Robi-Lemi, a CV of >30% was annually and seasonally observed. Trend analysis of the stream flows of the two rivers indicated an insignificant decreasing and increasing trend at Beressa and Robi-Lemi, respectively. In general, stream flow variability and trends are becoming increasingly unpredictable, necessitating additional research. Supplemental irrigation may ease the water scarcity problems that farmers encounter during the Belg season.

5. Limitation of the Study

Africa faces a general problem with data availability; thus we tried to select typical stations based on the total area and the data that were accessible. However, we advocate for additional research employing the reanalysis of data to be conducted in a wider context.

Author Contributions

Conceptualization, K.H.G., T.A. and A.M.M.; methodology, K.H.G.; software, K.H.G.; validation, T.A.; formal analysis, K.H.G.; investigation, T.A. and K.H.G.; resources, T.A.; data curation, T.A. and K.H.G.; Writing—original draft preparation, K.H.G.; literature review, K.H.G.; review and editing, T.A. and A.M.M.; visualization, T.A., A.M.M. and K.H.G.; supervision, T.A. and A.M.M. All authors have read and agreed to the published version of the manuscript.

Funding

This research was funded by the Africa Center of Excellence for Water Management, Addis Ababa University (AAU), Addis Ababa, Ethiopia, and the Ethiopian Institute of Agricultural Research, Addis Ababa, Ethiopia.

Data Availability Statement

Ethiopia’s Ministry of Water, Irrigation, and Electricity (MoWIE) and National Meteorology Agency (NMA) (www.ethiomet.gov.et/ (accessed on 30 December 2021)) provided the hydro-climatic data used in this study. All data used in this research work is available with the lead author. This article includes all of the information gathered and analyzed during the investigation.

Acknowledgments

The authors are grateful to Africa Center Excellence for Water Management of Addis Ababa University and the Ethiopian Institute of Agricultural Research in Ethiopia for providing postgraduate research support to the first author and NMA, MWIEE, for availing climate, and hydrology data, respectively.

Conflicts of Interest

The authors declare no conflict of interest.

References

  1. Paglia, E.; Parker, C. The Intergovernmental Panel on Climate Change: Guardian of Climate Science; Springer: Berlin/Heidelberg, Germany, 2021. [Google Scholar] [CrossRef]
  2. Yamanaka, M.D.; Ogino, S.Y.; Wu, P.M.; Jun-Ichi, H.; Mori, S.; Matsumoto, J.; Syamsudin, F. Maritime continent coastlines controlling Earth’s climate. Prog. Earth Planet. Sci. 2018, 5, 21. [Google Scholar] [CrossRef]
  3. Ahmadalipour, A.; Moradkhani, H.; Castelletti, A.; Magliocca, N. Future drought risk in Africa: Integrating vulnerability, climate change, and population growth. Sci. Total Environ. 2019, 662, 672–686. [Google Scholar] [CrossRef] [PubMed]
  4. Apollo, A.; Mbah, M.F. Challenges and opportunities for climate change education (Cce) in East Africa: A critical review. Climate 2021, 9, 1–16. [Google Scholar] [CrossRef]
  5. Thornton, P.K.; Jones, P.G.; Ericksen, P.J.; Challinor, A.J. Agriculture and food systems in sub-Saharan Africa in a 4 °C+ world. Philos. Trans. R. Soc. A Math. Phys. Eng. Sci. 2011, 369, 117–136. [Google Scholar] [CrossRef] [Green Version]
  6. Mekonnen, D.F.; Disse, M. Analyzing the future climate change of Upper Blue Nile River basin using statistical downscaling techniques. Hydrol. Earth Syst. Sci. 2018, 22, 2391–2408. [Google Scholar] [CrossRef] [Green Version]
  7. Mengistu, D.; Bewket, W.; Dosio, A.; Panitz, H.J. Climate change impacts on water resources in the Upper Blue Nile (Abay) River Basin, Ethiopia. J. Hydrol. 2021, 592, 125614. [Google Scholar] [CrossRef]
  8. Tessema, I.; Simane, B. Vulnerability analysis of smallholder farmers to climate variability and change: An agro-ecological system-based approach in the Fincha’a sub-basin of the upper Blue Nile Basin of Ethiopia. Ecol. Proc. 2019, 8, 5. [Google Scholar] [CrossRef] [Green Version]
  9. Merem, E.C.; Twumasi, Y.A.; Wesley, J.; Olagbegi, D.; Crisler, M.; Romorno, C.; Alsarari, M.; Isokpehi, P.; Hines, A.; Ochai, G.S.; et al. Leggett, Issues in Transboundary Water Use in the River Nile Basin Area of Africa. World Environ. 2020, 10, 27–44. [Google Scholar] [CrossRef] [Green Version]
  10. Tekleab, S.; Mohamed, Y.; Uhlenbrook, S. Hydro-climatic trends in the Abay/Upper Blue Nile basin, Ethiopia. Phys. Chem. Earth 2013, 61–62, 32–42. [Google Scholar] [CrossRef]
  11. Orke, Y.A.; Li, M.-H. Hydroclimatic Variability in the Bilate Watershed, Ethiopia. Climate 2021, 9, 98. [Google Scholar] [CrossRef]
  12. Worku, G.; Teferi, E.; Bantider, A.; Dile, Y.T. Observed changes in extremes of daily rainfall and temperature in Jemma Sub-Basin, Upper Blue Nile Basin, Ethiopia. Theor. Appl. Climatol. 2018, 135, 839–854. [Google Scholar] [CrossRef]
  13. Tesemma, Z.K.; Mohamed, Y.A.; Steenhuis, T.S. Trends in rainfall and runoff in the Blue Nile Basin: 1964–2003. Hydrol. Proc. 2010, 24, 3747–3758. [Google Scholar] [CrossRef] [Green Version]
  14. Gebremicael, T.G.; Mohamed, Y.A.; Betrie, G.D.; Betrie, G.D.; Teferi, E. Trend analysis of runoff and sediment fluxes in the Upper Blue Nile basin: A combined analysis of statistical tests, physically-based models and landuse maps. J. Hydrol. 2013, 10, 10971–10995. [Google Scholar] [CrossRef]
  15. Samy, A.; Ibrahim, M.G.; Mahmod, W.E.; Fujii, M.; Eltawil, A.; Daoud, W. Statistical assessment of rainfall characteristics in upper Blue Nile basin over the period from 1953 to 2014. Water 2019, 11, 468. [Google Scholar] [CrossRef] [Green Version]
  16. Shawul, A.A.; Chakma, S. Suitability of global precipitation estimates for hydrologic prediction in the main watersheds of Upper Awash basin. Environ. Earth Sci. 2020, 79, 1–18. [Google Scholar] [CrossRef]
  17. Seleshi, Y.; Zanke, U. Recent changes in rainfall and rainy days in Ethiopia. Int. J. Climatol. 2004, 24, 973–983. [Google Scholar] [CrossRef]
  18. Rosell, S. Regional perspective on rainfall change and variability in the central highlands of Ethiopia, 1978–2007. Appl. Geogr. 2011, 31, 329–338. [Google Scholar] [CrossRef]
  19. Segele, Z.T.; Lamb, P.J. Characterization and variability of Kiremt rainy season over Ethiopia. Meteorol. Atmos. Phys. 2005, 89, 153–180. [Google Scholar] [CrossRef]
  20. Asfaw, A.; Simane, B.; Hassen, A.; Bantider, A. Variability and time series trend analysis of rainfall and temperature in northcentral Ethiopia: A case study in Woleka sub-basin. Weather Clim. Extrem. 2018, 19, 29–41. [Google Scholar] [CrossRef]
  21. Mekonen, A.A.; Berlie, A.B. Spatiotemporal variability and trends of rainfall and temperature in the Northeastern Highlands of Ethiopia. Model. Earth Syst. Environ. 2020, 6, 285–300. [Google Scholar] [CrossRef]
  22. Sattari, M.T.; Rezazadeh-Joudi, A.; Kusiak, A. Assessment of different methods for estimation of missing data in precipitation studies. Hydrol. Res. 2017, 48, 1032–1044. [Google Scholar] [CrossRef]
  23. Mishra, P.; Pandey, C.M.; Singh, U.; Gupta, A.; Sahu, C.; Keshri, A. Descriptive statistics and normality tests for statistical data. Ann. Card. Anaesth. 2019, 22, 67–72. [Google Scholar] [CrossRef]
  24. Hansen, G. The evolution of the evidence base for observed impacts of climate change. Curr. Opin. Environ. Sustain. 2015, 14, 187–197. [Google Scholar] [CrossRef]
  25. Merino, A.; López, L.; Hermida, L.; Sánchez, J.L.; García-Ortega, E.; Gascón, E.; Fernández-González, S. Identification of drought phases in a 110-year record from Western Mediterranean basin: Trends, anomalies and periodicity analysis for Iberian Peninsula. Glob. Planet. Chang. 2015, 133, 96–108. [Google Scholar] [CrossRef]
  26. Brooks, N. Drought in the African Sahel: Long term perspectives and future prospects, Tyndall Cent. Clim. Chang. Res. 2004. Available online: http://citeseerx.ist.psu.edu/viewdoc/download?doi=10.1.1.151.8727&rep=rep1&type=pdf%5Cnpapers2://publication/uuid/81C009F8-5A32-4BA3-B927-FE1EA2608311 (accessed on 23 March 2021).
  27. Yue, S.; Pilon, P.; Phinney, B.; Cavadias, G. The influence of autocorrelation on the ability to detect trend in hydrological series. Hydrol. Proc. 2002, 16, 1807–1829. [Google Scholar] [CrossRef]
  28. Hamed, K.H. Trend detection in hydrologic data: The Mann-Kendall trend test under the scaling hypothesis. J. Hydrol. 2008, 349, 350–363. [Google Scholar] [CrossRef]
  29. Mann, H.B. Nonparametric Tests Against Trend. Econometrica 1945, 13, 245–259. [Google Scholar] [CrossRef]
  30. Sen, P.K. Estimates of the Regression Coefficient Based on Kendall’s Tau. J. Am. Stat. Assoc. 1968, 63, 130. [Google Scholar] [CrossRef]
  31. Theil, H. A rank-invariant method of linear and polynomial regression analysis, Part I. Proc. R. Netherlands Acad. Sci. 1950, 53, 386–392. [Google Scholar]
  32. Yue, S.; Hashino, M. Long term trends of annual and monthly precipitation in Japan. J. Am. Water Resour. Assoc. 2003, 39, 587–596. [Google Scholar] [CrossRef]
  33. Bewket, W. Rainfall Variability and Agricultural Vulnerability in the Amhara Region, Ethiopia, Ethiop. J. Dev. Res. 2008, 29, 823–836. [Google Scholar] [CrossRef]
  34. Belay, A.; Demissie, T.; Recha, J.W.; Oludhe, C.; Osano, P.M.; Olaka, L.A.; Solomon, D.; Berhane, Z. Analysis of climate variability and trends in Southern Ethiopia. Climate 2021, 9, 1–17. [Google Scholar] [CrossRef]
  35. Gleixner, S.; Keenlyside, N.; Viste, E.; Korecha, D. The El Niño effect on Ethiopian summer rainfall. Clim. Dyn. 2017, 49, 1865–1883. [Google Scholar] [CrossRef] [Green Version]
  36. FAO. An assessment using FAO’s Agricultural Stress Index (ASI) Understanding the drought impact of El Niño on the global agricultural areas, FAO, Rome. 2014. Available online: https://www.uncclearn.org/wp-content/uploads/library/fao15102015_7.pdf (accessed on 22 February 2021).
  37. Abtew, W.; Melesse, A.M.; Dessalegne, T. El Niñno Southern Oscillation link to the Blue Nile River Basin hydrology Wossenu. Hydrol. Proc. 2009, 23, 3653–3660. [Google Scholar] [CrossRef]
  38. Amarasekera, K.N.; Lee, R.F.; Williams, E.R.; Eltahir, E.A.B. ENSO and the natural variability in the flow of tropical rivers. J. Hydrol. 1997, 200, 24–39. [Google Scholar] [CrossRef]
  39. Siam, M.S.; Eltahir, E.A.B. Climate change enhances interannual variability of the Nile river flow. Nat. Clim. Chang. 2017, 7, 350–354. [Google Scholar] [CrossRef]
  40. Tesfamariam, B.G.; Gessesse, B.; Melgani, F. Characterizing the spatiotemporal distribution of meteorological drought as a response to climate variability: The case of rift valley lakes basin of Ethiopia. Weather Clim. Extrem. 2019, 26, 100237. [Google Scholar] [CrossRef]
  41. Bewket, W.; Conway, D. A note on the temporal and spatial variability of rainfall in the drought-prone Amhara region of Ethiopia. Int. J. Climatol. 2007, 1477, 1467–1477. [Google Scholar] [CrossRef]
  42. Haile, A.T.; Akawka, A.L.; Berhanu, B.; Rientjes, T. Changes in water availability in the Upper Blue Nile basin under the representative concentration pathways scenario. Hydrol. Sci. J. 2017, 62, 2139–2149. [Google Scholar] [CrossRef]
Figure 1. Locations of the Jemma sub-basin in the UBNB: meteorological stations, river networks, and stream gauging stations.
Hydrology 09 00209 g001
Figure 2. Mean monthly rainfall at weather stations in the Jemma sub-basin.
Hydrology 09 00209 g002
Figure 3. Mean annual rainfall in the sub-basin.
Hydrology 09 00209 g003
Figure 4. Seasonal and temporal variability of rainfall at: (a) Andit tid, (b) Debrebrhan, (c) Alemketema, (d) Fiche, (e) Gohatsion, (f) Lemi, (g) Mehal Meda, (h) Mendida, (i) Wereilu, (j) Eneware, and (k) Gundo Meskel stations.
Hydrology 09 00209 g004aHydrology 09 00209 g004b
Figure 5. Belg and Kiremt seasonal rainfall contributions to the annual totals.
Hydrology 09 00209 g005
Figure 6. Standardized Precipitation Index of (a) Debrebrhan, (b) Eneware, (c) Gundo Meskel, (d) Alemketema, (e) Fiche, (f) Wereilu, (g) Mehal Meda, (h) Lemi, (i) Gohatsion, (j) Mendida, and (k) Andit Tid.
Hydrology 09 00209 g006aHydrology 09 00209 g006b
Figure 7. (a) AnditTid, (b) Gohatsion, (c) Wereilu, and (d) Eneware Kiremt rainfall anomalies with Kiremt SST anomaly using nino 3.4 downloaded from https://www.cpc.ncep.noaa.gov/data/indices/ersst5.nino.mth.91-20.ascii (accessed on 29 April 2021).
Hydrology 09 00209 g007aHydrology 09 00209 g007b
Figure 8. Jemma Belg season rainfall anomaly with Belg SST anomaly using nino 3.4.
Hydrology 09 00209 g008
Figure 9. Jemma Kiremt season rainfall anomaly with Kiremt SST anomaly using nino 3.4.
Hydrology 09 00209 g009
Figure 10. The mean monthly river discharge at Robi-Lemi and Beressa.
Hydrology 09 00209 g010
Figure 11. Temporal variations in annual and seasonal stream flow at (a) Beressa and (b) Robi-Lemi.
Hydrology 09 00209 g011aHydrology 09 00209 g011b
Table 1. Seasonal and Annual Precipitation Statistical Summary Result.
NoStationsBelgKiremtAnnual
Mean (mm)CV (%)Mean (mm)CV (%)Mean (mm)CV (%)
1Alemketema18852.590425.0117029.3
2Debrebrhan16234.372616.4928.612.1
3Gohatsion21646.590516.4118814.2
4Lemi195.670.697628.9123931.6
5Mehal-Meda16152.766828.690623.1
6Fiche21442.786320.0113013.7
7Wereilu14248.954324.672620.0
8Andit Tid27247.496429.7139628.4
9Mendida18735.974221.8100418.0
10Eneware21747.981521.6106519.9
11Gundo Meskel18756.990527.8114423.8
Table 2. Intensity of El Niño events from 1952 to 2020/21.
WeakModerateStrong
1952–19531951–19521957–1958
1953–19541963–19641965–1966
1958–19591968–19691972–1973
1969–19701986–19871982–1983
1976–19771991–19921987–1998
1977–19781994–19952015–2016
2004–20052002–20032020–2021
2006–20072009–2010
2014–2015
Source: Reprinted/adapted with permission from Ref. [36] and with new data from current study.
Table 3. Mann-Kendall trend analysis summary results of total annual and seasonal rainfall and stream flow.
No.StationsBelgKiremtAnnual
p-ValueZsSen’s Slopep-ValueZsSen’s Slopep-ValueZsSen’s Slope
1RainfallAlemketema0.10−2.09−1.860.80−0.33−0.570.260.01−3.66
2Debrebrehan0.39−1.14−0.800.01 *3.323.990.072.412.60
3Gohatsion0.36−1.08−1.250.03 *2.585.000.10−0.014.44
4Lemi0.530.740.770.630.572.350.530.742.74
5Mendida0.18−2.25−1.630.03 *3.594.540.202.133.67
6Wereilu0.77−0.37−0.260.00 **3.725.220.04 *2.564.64
7Andit Tid0.530.621.020.01 **2.7914.180.01 **2.7919.80
8Fiche0.10−1.65−1.800.00 **3.726.940.00 **3.025.76
9Mehal meda0.14−1.73−1.840.600.621.330.43−0.94−2.09
10 Enewari0.02 *3.163.490.092.274.290.03 *2.867.96
11 Gundo Meskel0.680.550.470.04 *2.714.560.092.274.47
12Stream flowBeressa0.94−0.07−0.000.18−1.33−1.000.26−1.12−1.06
13Robi-Lemi0.430.790.010.770.300.400.690.400.20
** Significant at 0.01 significance level. * Significant at 0.05 significance level.
Publisher’s Note: MDPI stays neutral with regard to jurisdictional claims in published maps and institutional affiliations.

