Article

Estimation of Spatial and Temporal Groundwater Balance Components in Khadir Canal Sub-Division, Chaj Doab, Pakistan

1
Department of Irrigation and Drainage, University of Agriculture Faisalabad Pakistan, Punjab 38000, Pakistan
2
Civil Engineering Department, Faculty of Engineering, Minia University, Minia 61111, Egypt
3
Doctoral School of Earth Sciences, University of Pécs, Ifjúság útja 6, H-7624 Pécs, Hungary
4
Department of Biological and Agricultural Engineering, Texas A&M University, College Station, TX 77843, USA
*
Author to whom correspondence should be addressed.
Hydrology 2021, 8(4), 178; https://doi.org/10.3390/hydrology8040178
Submission received: 19 October 2021 / Revised: 14 November 2021 / Accepted: 29 November 2021 / Published: 4 December 2021
(This article belongs to the Section Hydrological and Hydrodynamic Processes and Modelling)

Abstract

:
Evaluation of the spatial and temporal distribution of water balance components is required for efficient and sustainable management of groundwater resources, especially in semi-arid and data-poor areas. The Khadir canal sub-division, Chaj Doab, Pakistan, is a semi-arid area which has shallow aquifers which are being pumped by a plethora of wells with no effective monitoring. This study employed a monthly water balance model (water and energy transfer among soil, plants, and atmosphere)—WetSpass-M—to determine the groundwater balance components on annual, seasonal, and monthly time scales for a period of the last 20 years (2000–2019) in the Khadir canal sub-division. The spatial distribution of water balance components depends on soil texture, land use, groundwater level, slope, and meteorological conditions. Inputs for the model included data on topography, slope, soil, groundwater depth, slope, land use, and meteorological data (e.g., precipitation, air temperature, potential evapotranspiration, and wind speed) which were prepared using ArcGIS. The long-term average annual rainfall (455.7 mm) is distributed as 231 mm (51%) evapotranspiration, 109.1 mm (24%) surface runoff, and 115.6 mm (25%) groundwater recharge. About 51% of groundwater recharge occurs in summer, 18% in autumn, 14% in winter, and 17% in spring. Results showed that the WetSpass-M model properly simulated the water balance components of the Khadir canal sub-division. The WetSpass-M model’s findings can be used to develop a regional groundwater model for simulation of different aquifer management scenarios in the Khadir area, Pakistan.

1. Introduction

Groundwater is one of the major sources of freshwater for domestic, agricultural, and industrial use. An exponential increase in population, extensive demand in the agriculture sector, increasing industrial use, indiscriminate extraction, decreasing recharge, and climate are causing an alarming depletion of groundwater [1,2,3]. Groundwater management is particularly vital in the Khadir canal sub-division, Chaj Doab, Pakistan, for improving agriculture and improving and protecting the biodiversity and the ecosystem, as well as for its judicial use.
Chaj Doab is an area of alluvium plain with a considerable depth and has an unconfined aquifer system which is at risk due to over-exploitation by the farming community [4,5,6]. Over-drafting of groundwater is occurring for two main reasons. First, it is easy because the water table is shallow and, as a result, the abstraction rate is increasing day after day. Second, the canal irrigation system of Pakistan was designed for up to 75% cropping intensity, but now cropping intensity has exceeded 100%, further increasing the water demand. In order to fulfill the supply gap and cope with the effect of saline water on soil fertility, groundwater is conjunctively used with canal water, putting an additional burden on groundwater resources [7,8]. Groundwater management in the canal sub-division can be done using an integrated groundwater model. The groundwater models require input in the form of groundwater recharge and evapotranspiration as boundary conditions [9].
Different methods like hydrological budget, experimental methods, empirical methods, and water fluctuation methods have been applied to evaluate groundwater balance components. Experimental methods using an isotopes tracer were used by [10]. The water table fluctuation and groundwater hydrograph was used by [11] in South Korea. The hydrological budget method was used by [12] for recharge estimation in the Hemet basin. An empirical method was used by [13] for the assessment of distributed recharge in the Cún-Szaporca oxbow of the Drava floodplain, Hungary.
Water and energy transfer between soil, plants, and atmosphere under a quasi-steady-state (WetSpass) [14] is widely used for groundwater recharge assessment. A model for the downscaling of monthly groundwater recharge from seasonal recharge was experimented by in Belgium [15] and satisfactory results were obtained after adjusting various parameters. This model was also used for the Varazdin aquifer, Croatia [16], cJafar and Hasa basin, Jordan [17,18], and Werri watershed and Bikri watershed, Ethiopia [19,20]. It was also used for the Mashhad basin [21], Iran; Nile Delta aquifer, Egypt [22]; and Drava basin in south-western Hungary [23,24,25].
The present paper aims at assessing the spatial distribution of long-term average water balance components in the Khadir basin, Pakistan. Moreover, the WetSpass-M model was applied to explore the impact of land use/land cover and soil texture on the distribution of groundwater balance components.

2. Materials and Methods
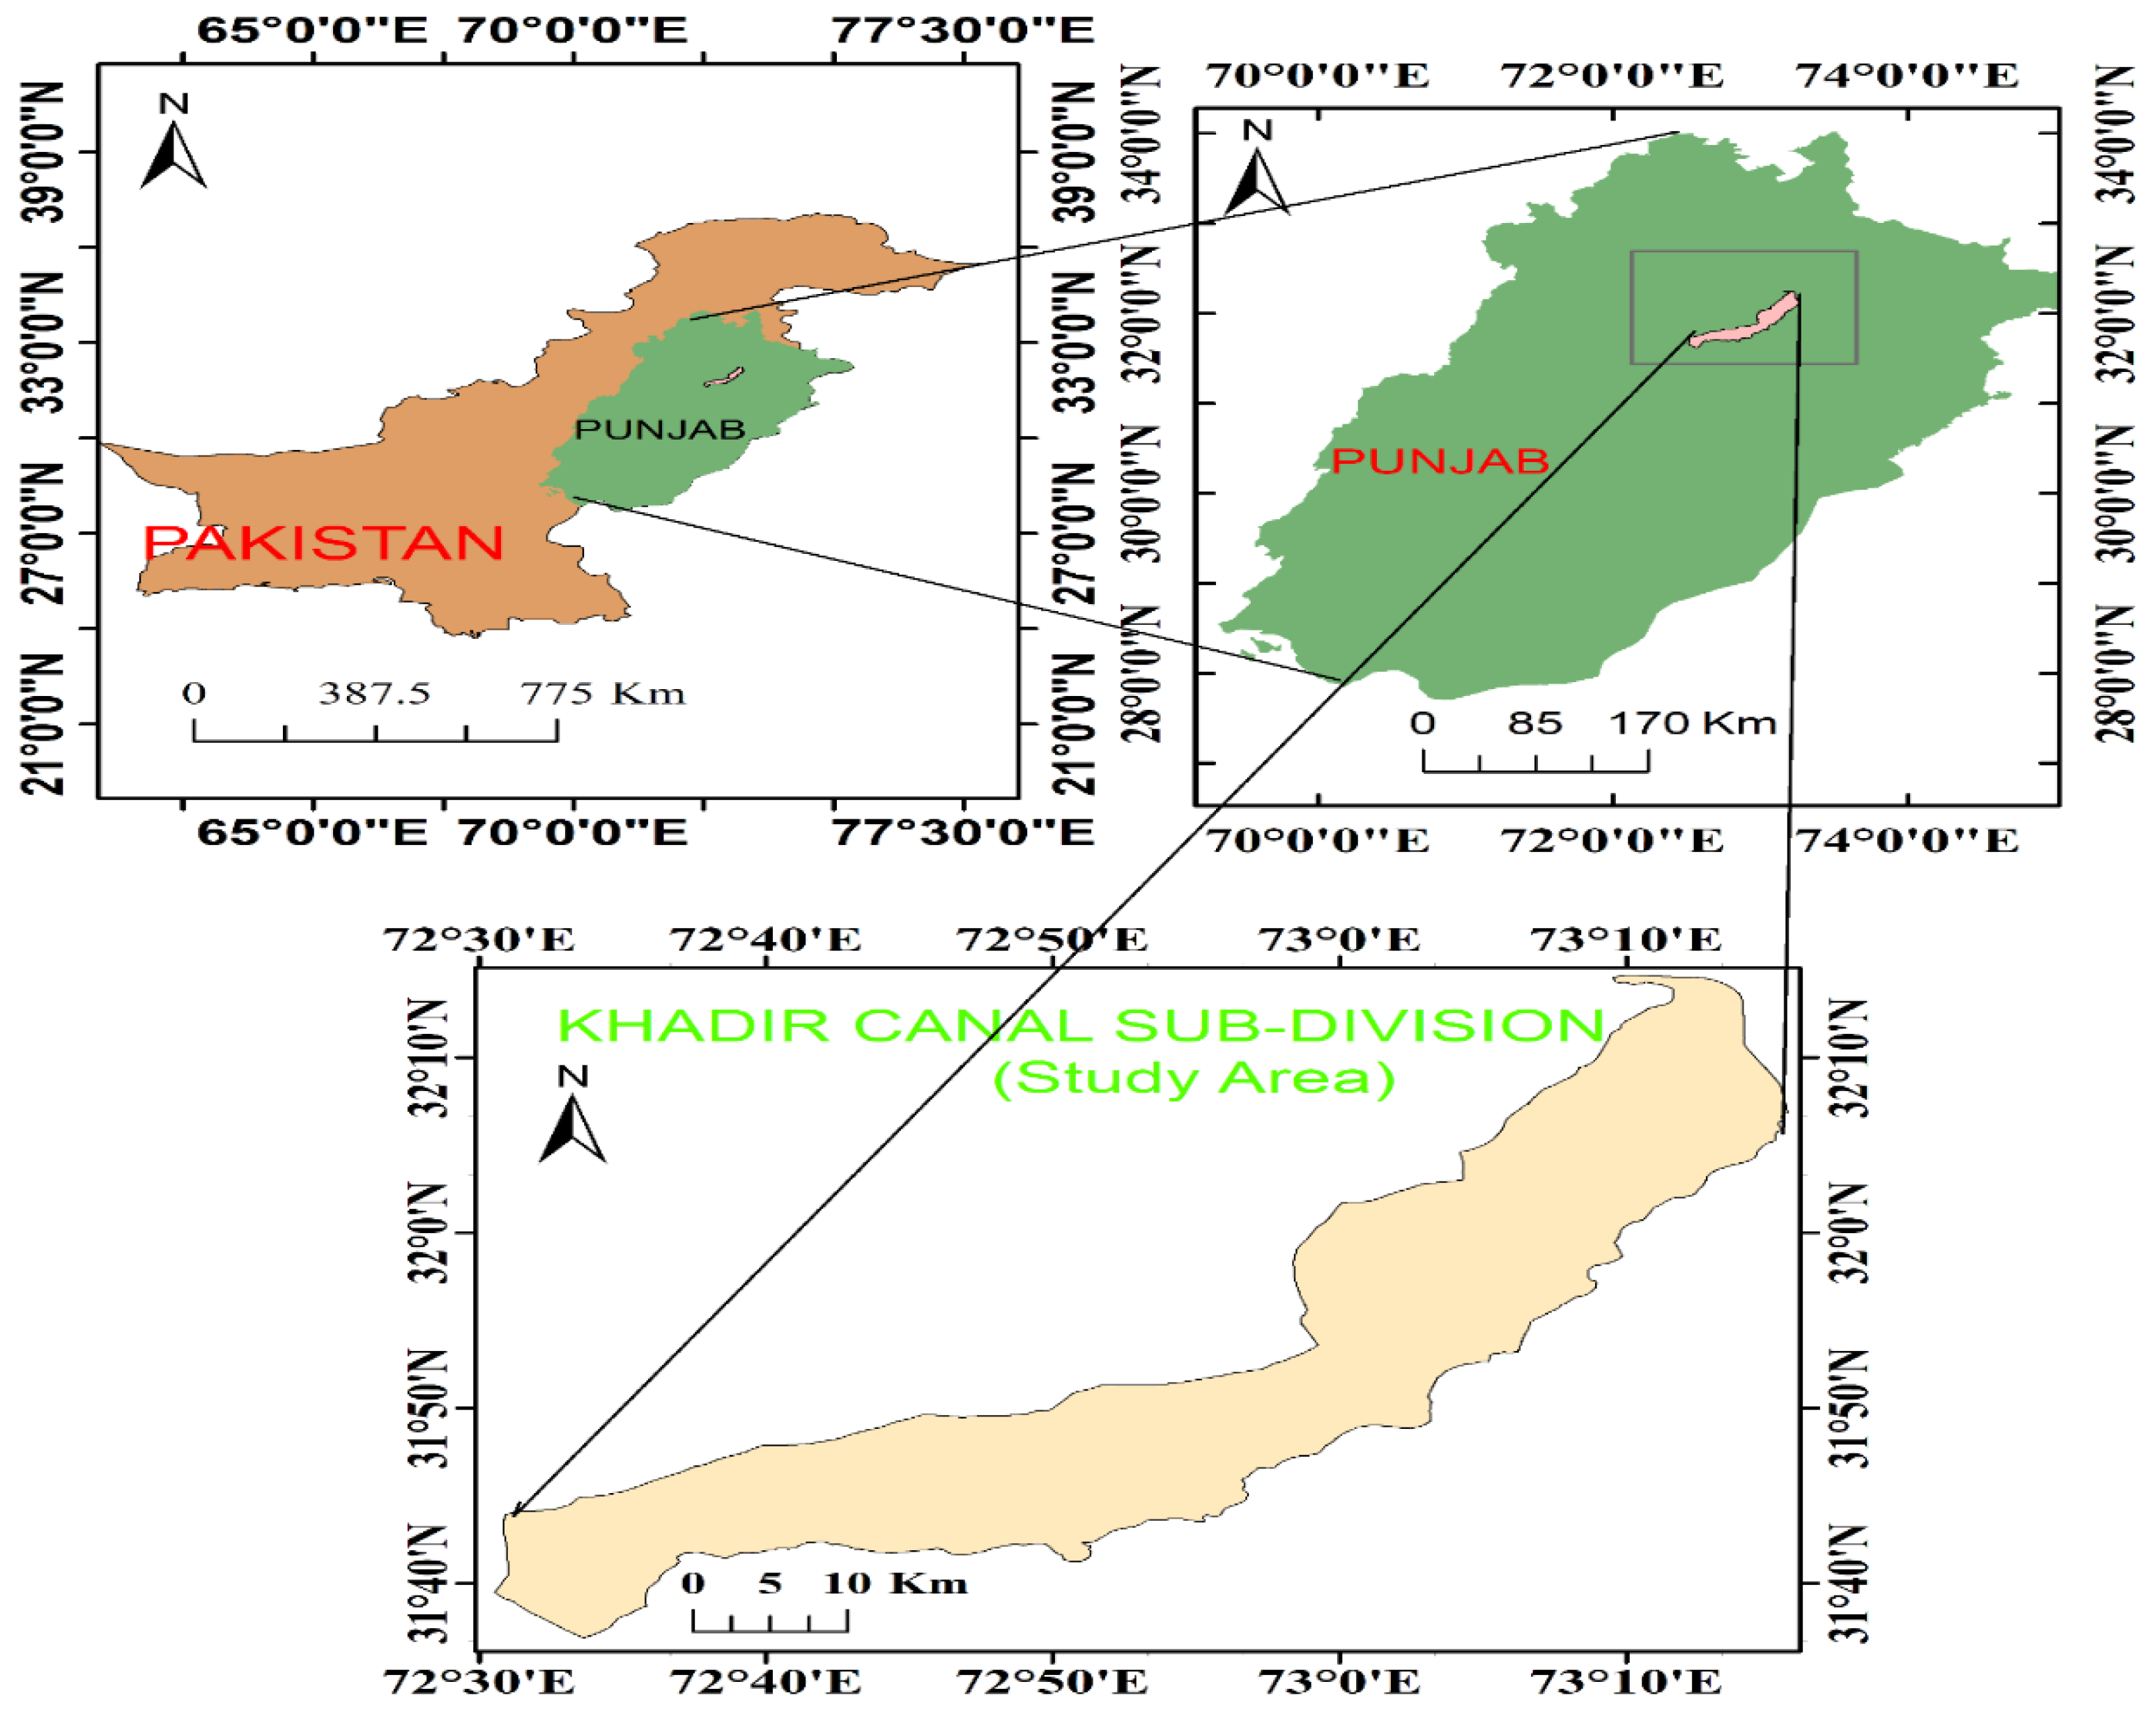
2.1. Study Area

The Khadir canal sub-division, with a total area of 1139 km2, is located in Chaj Doab (area between Rivers Chenab and Jhelum), Punjab, Pakistan. The Punjab province lies between longitudes 72°30′ and 73°15′ E and latitudes 31°36′ and 32°15′ N and is irrigated by the lower Jhelum canal (LJC) (Figure 1). Most of this area has a mild slope of 0.3 m/km and elevation ranges between 155 and 255 m above mean sea level. It is observed that mostly western monsoons are primarily responsible for heavy rains from June to October. The average annual rainfall is about 1000 mm in the northeast, which reduces to about 230 mm in the southwest of Punjab, and about 65 to 70% of the rainfall occurs during the monsoon season [26].

2.2. WetSpass-M Model
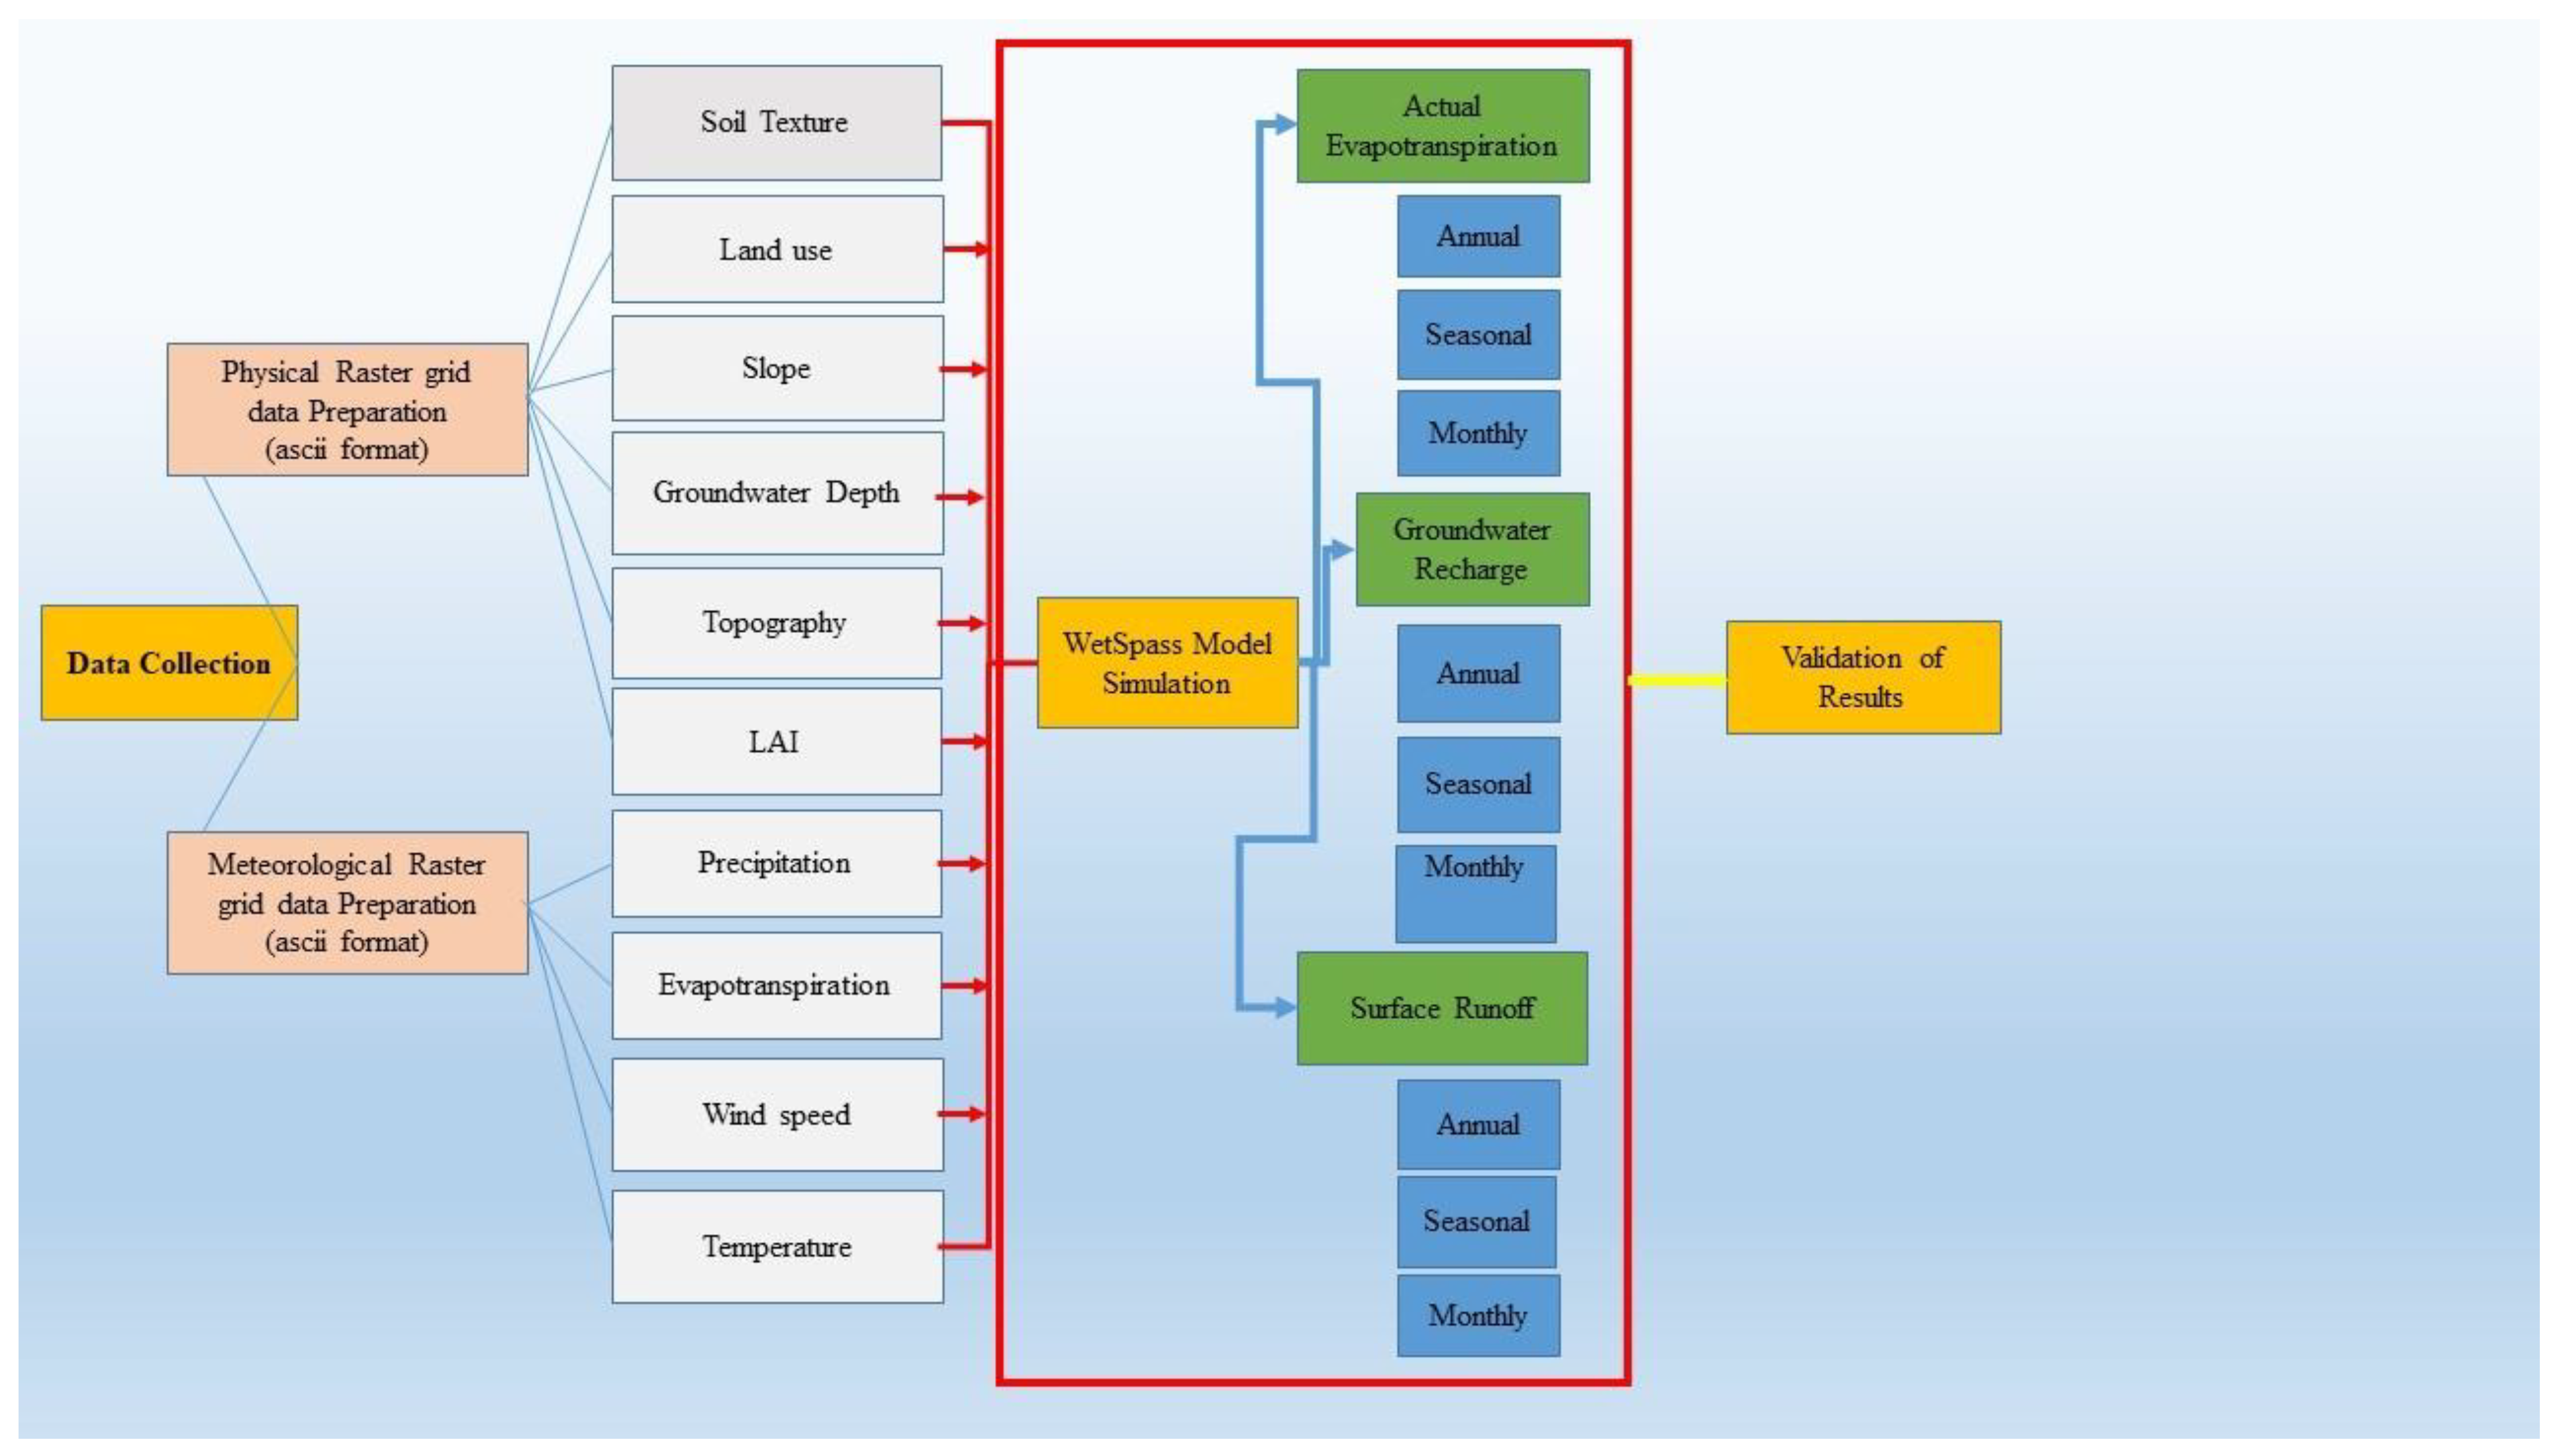
WetSpass-M (water and energy transfer between soil, plants, and atmosphere under a quasi-steady-state) [15] is a geographical user interface model used for the assessment of groundwater recharge, actual evapotranspiration, and surface runoff in arid/semi-arid regions [14,27]. This model treats the study area as a regular pattern raster cell and calculates the water balance by the following equation [14]:
P = I+ Sv + Tv + Rv,
where P is the average monthly, seasonal, or annual precipitation; I is the fraction of interception; Sv is the surface runoff; Tv is called actual transpiration; and Rv is the recharge of groundwater, all with units [LT−1].
Interception (I) depends upon the type of vegetation, surface runoff that shows the relation between precipitation amount, precipitation intensity, interception, and soil infiltration capacity. It is estimated in two stages.
First, potential surface runoff (SV_pot) is calculated as:
SV_pot = Csv(P − I)
where Csv is the coefficient of surface runoff for vegetative infiltration, P is the precipitation, and I is the interception, both with units [LT−1].
Second, S can be calculated by taking the difference between precipitation and infiltration capacities [14]:
S = Cchor − SV_pot
where Cchor represents the coefficient of parametrizing rainfall [15].
The actual evapotranspiration was calculated from vegetation, and the open-water evaporation coefficient is the ratio of reference vegetative transpiration to the potential water evaporation from the open pan [14].
Reference transpiration was calculated by the following equation:
Trv = CeO
where Trv is vegetative transpiration of reference surface with units [LT−1] and c is the vegetative coefficient that is the ratio of reference potential evapotranspiration to the evaporation from the open water surface. Groundwater recharge was calculated by the following equation:
R = P − Sv − ETV − I
where R is the recharge, P is the precipitation, Sv is the surface runoff, ETV is the actual evapotranspiration, and I is the interception, all with units [LT−1].
Water balance components for bare soil, vegetative area impervious fraction, and open water surface were calculated by the following equations:
ETR = avETV + asEs + aoEo + aiEi
Sr = avSv + asSs + aoSo + aiSi
Rr = avRV + asRs + aoRo + aiRi
where ETR, Sr, and Rr are the total actual evapotranspiration, surface runoff, and groundwater recharge in raster grids, having av, as, ao, and ai denoting vegetated, bare soil, open water, and impervious area components, respectively.

2.3. Model Inputs

WetSpass-M [15] is an ArcGIS-integrated model used to simulate runoff, groundwater recharge, interception, and evapotranspiration. WetSpass-M model is available for free download from https://github.com/WetSpass. Basic input data for this model include meteorological data (rainfall, potential evapotranspiration, wind speed, and temperature), topography, land use/land cover, soil texture, groundwater depth, and leaf area index [15,28]. All input data were prepared in Geographic Information (GIS) in Ascii grid format, and the cell size of all raster maps was kept equal for running the model. ArcGIS 10.3.1 was used to prepare the input data from the year 2000 to 2019 and the raster cell size was kept at 100 m × 100 m. The total grids of each parameter were 72713. WetSpass operates on the principle of water balance. The scheme of the WetSpass-M model is shown in Figure 2.

2.3.1. Input Data Preparation

Topography and Soil Map

A topographic map of the study area was obtained from the Shuttle Radar Topography Mission (STRM) at 1 arc second with a 30 m resolution. Elevation ranged from 155 m at the lowest point to 255 m at the highest point (Figure 3a). The slope map was derived from a digital elevation model by using ArcGIS 10.3.1 and ranged from 0 to 16 degrees with a slope ratio of 0.3/km towards the southwest, as shown in Figure 3b.

LULC and Soil Sampling

The distribution of vegetation plays a key role in water balance component variation. For this purpose, a land-use/land-cover map was obtained from moderate resolution imaging spectroradiometer (MODIS) land-cover products (MCD12Q1.006) for 2018 using the following link of USGS (https://lpdaac.usgs.gov/dataset_discovery/modis/modis_products_table/mcd12q1, accessed on 15 November 2021) [29]. MCD12Q1 is an annual global land-cover dataset that spans the years 2001 to present at 500 m resolution, compiled from Aqua and Terra observations and classified using six global land-cover classification methods [29]. The International Geosphere-Biosphere Programme (IGBP) classification scheme, which included 17 land-cover classes, was created with an ensemble of decision trees—6 out of these 17 classes were used in this study. Most of the area was covered by crops that were up to 95% of the total area; only 3% of the area was settled, with other areas containing 0.2%, 03%, 0.5%, and 1% natural vegetation, shrubs, barren, and natural grass, respectively, as shown in Figure 4a.

Soil Sample Collection and Analysis

The soil textural map of the study area was prepared from the nineteen soil samples taken from the study area. Hydrometer analysis of soil samples showed that this area contained two textural classes—sandy loam and loam, as shown in Figure 4b.

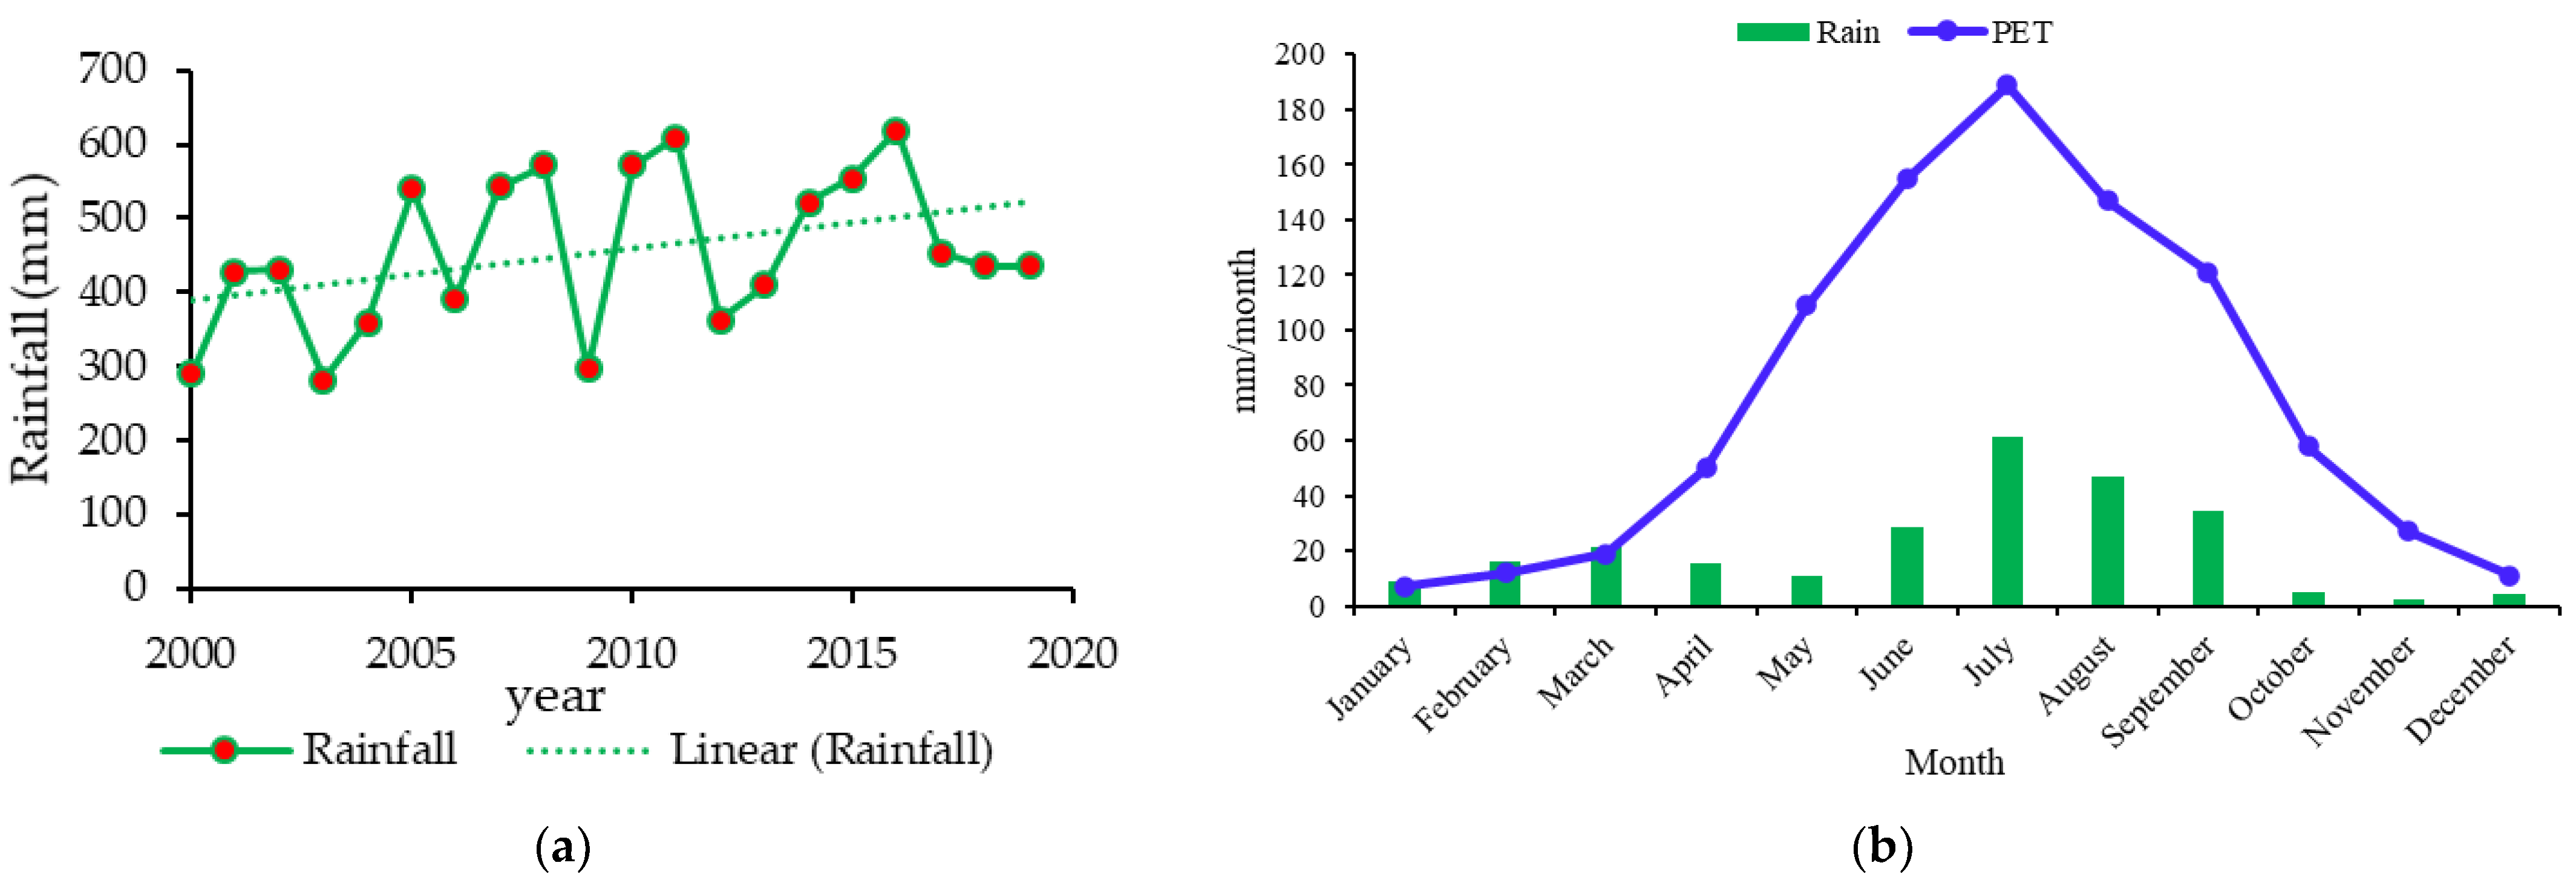
Meteorological Data Collection

Meteorological input data for the WetSpass-M model were collected from the Pakistan Meteorological Department for the period of 2000 to 2019, and its raster maps were prepared.
The long-term monthly rainfall varied from 35.9 mm to 40.5 mm with an average value of 38.5 mm/month, and the minimum rain was observed in November and the maximum rainfall in July, as shown in Figure 5b. The long-term annual rainfall had a minimum value of 424 mm, a maximum value of 679.5 mm, and an average value of 455.7 mm/year (Figure 5a and Figure 6a). Daily groundwater depth data were collected from the Punjab Irrigation Department for the period from 2000 to 2019. The spatial groundwater depth was constructed using Kriging interpolation. The average groundwater depth ranged from 4.39 m to 6.2 m, as shown in Figure 6b.
Potential evapotranspiration for input data was calculated by using the Hargreaves equation [30]:
PET = 0.0023 (Tmean + 17.8)/(Tmax − Tmin)0.5Ra
where PET is the potential evapotranspiration (mm day−1); Tmean Tmax, and Tmin are average, maximum, and minimum temperatures (°C), respectively; and Ra is the extraterrestrial radiation (mm day−1). The average monthly PET is presented in Figure 5b. It ranges from 7 mm to 189 mm with an average of 75.4 mm. The lowest PET occurs in January, 7mm, while July has the highest, 189 mm (Figure 5b). A graphical representation of long-term maximum, minimum, and mean monthly temperature is depicted in Figure 7. The average monthly temperature between 2000 and 2019 of the Khadir canal sub-division ranged from 11.3 °C in January to 33.1 °C in June as the minimum and maximum values, respectively, with an average temperature of 24.5 °C. The highest temperature of 40.1 °C was recorded in June, while January had the lowest temperature of 4.8 °C. Table 1 shows the input data and their sources for the WetSpass-M model.

3. Results and Discussion

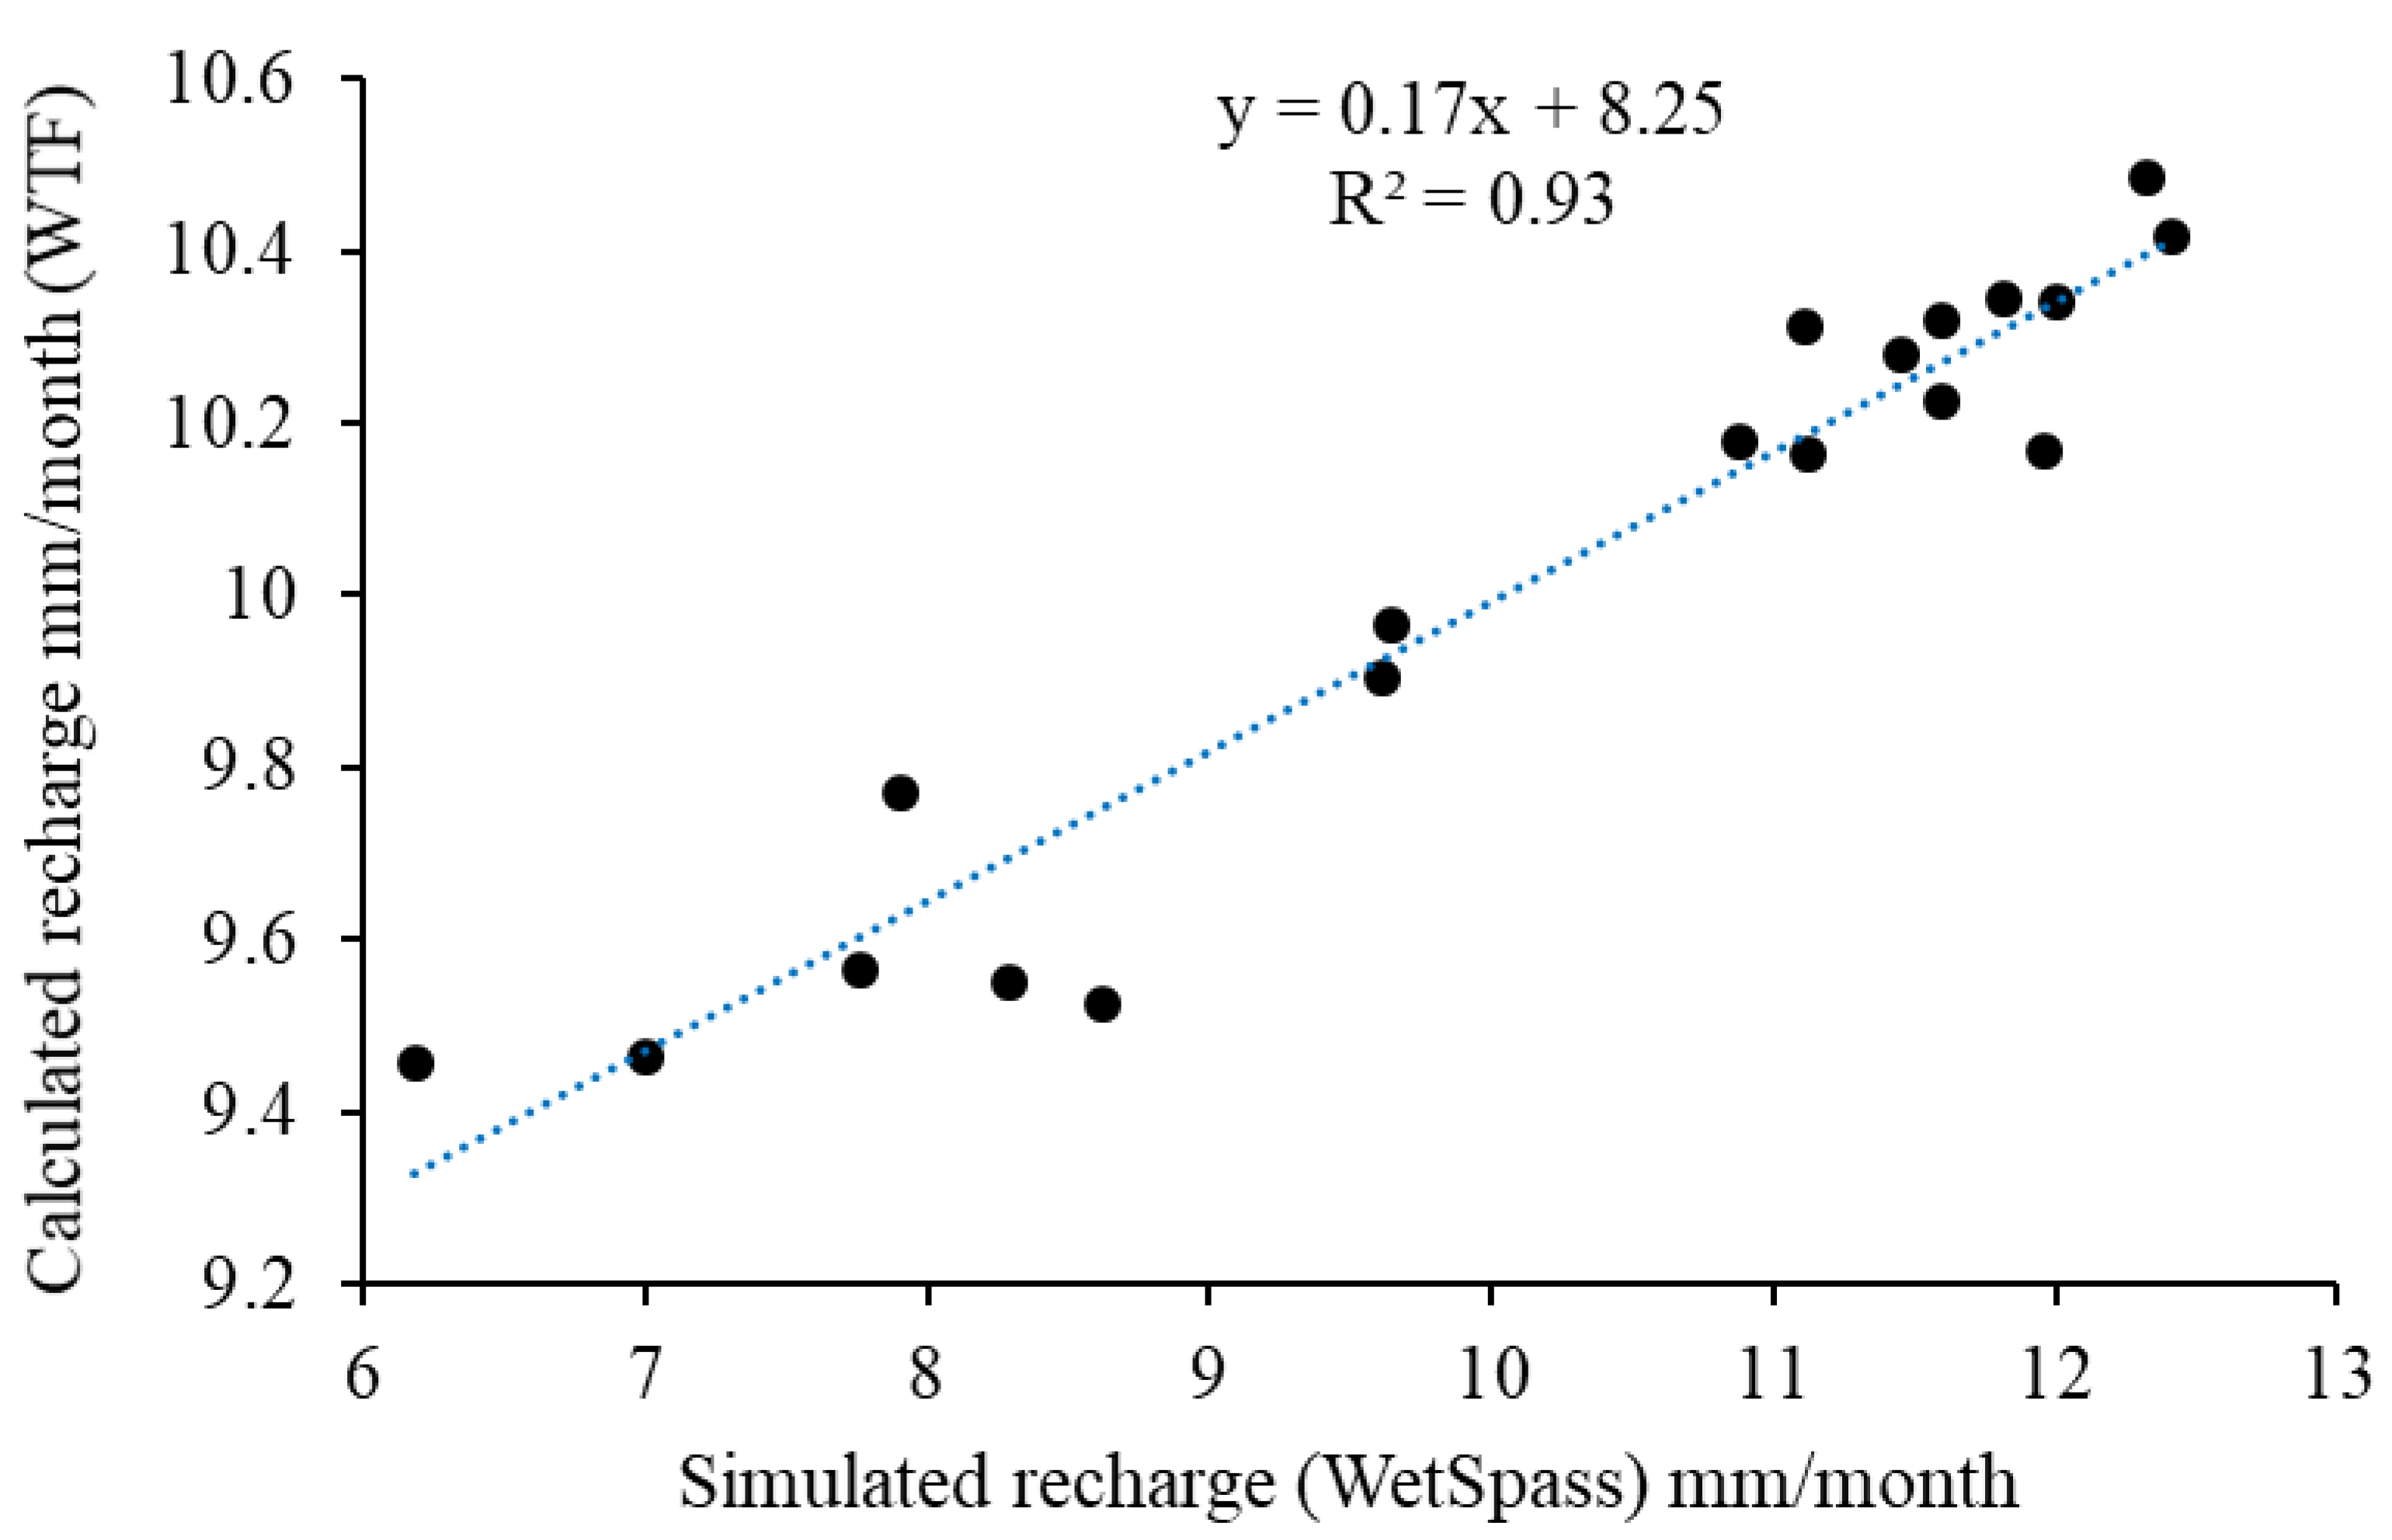
3.1. Validation of WetSpass-M Model

Validation of any hydrological model is a crucial element for the authenticity of its results. In this study, simulated groundwater recharge components were validated against the calculated groundwater recharge. One of the most commonly used approaches for estimating groundwater recharge is the water-table fluctuation method (WTF). It was used to validate the performance of the WetSpass-M model in this case. It requires information on variations of groundwater levels throughout time, as well as specific yield. The following formula was used to determine recharge:
R = Sy x ∆h
where R is recharge, Sy is specific yield, and ∆h is the change in water table height with time.
The specific yield data and observed daily groundwater table data were collected from the water and Punjab Irrigation Department at 20 observation wells from 2000 to 2019 [33]. The GIS was used to derive the simulated groundwater recharge for the WetSpass model at the associated observation wells.
Validated results showed a good agreement between the simulated groundwater recharge by WetSpass and the calculated recharge by WTF with R2 = 0.93., a mean error of 0.18 mm/month, an absolute mean error of 1.49 mm/month, and a root-mean-square error (RMSE) of 0.34 mm/month, as shown in Figure 8.

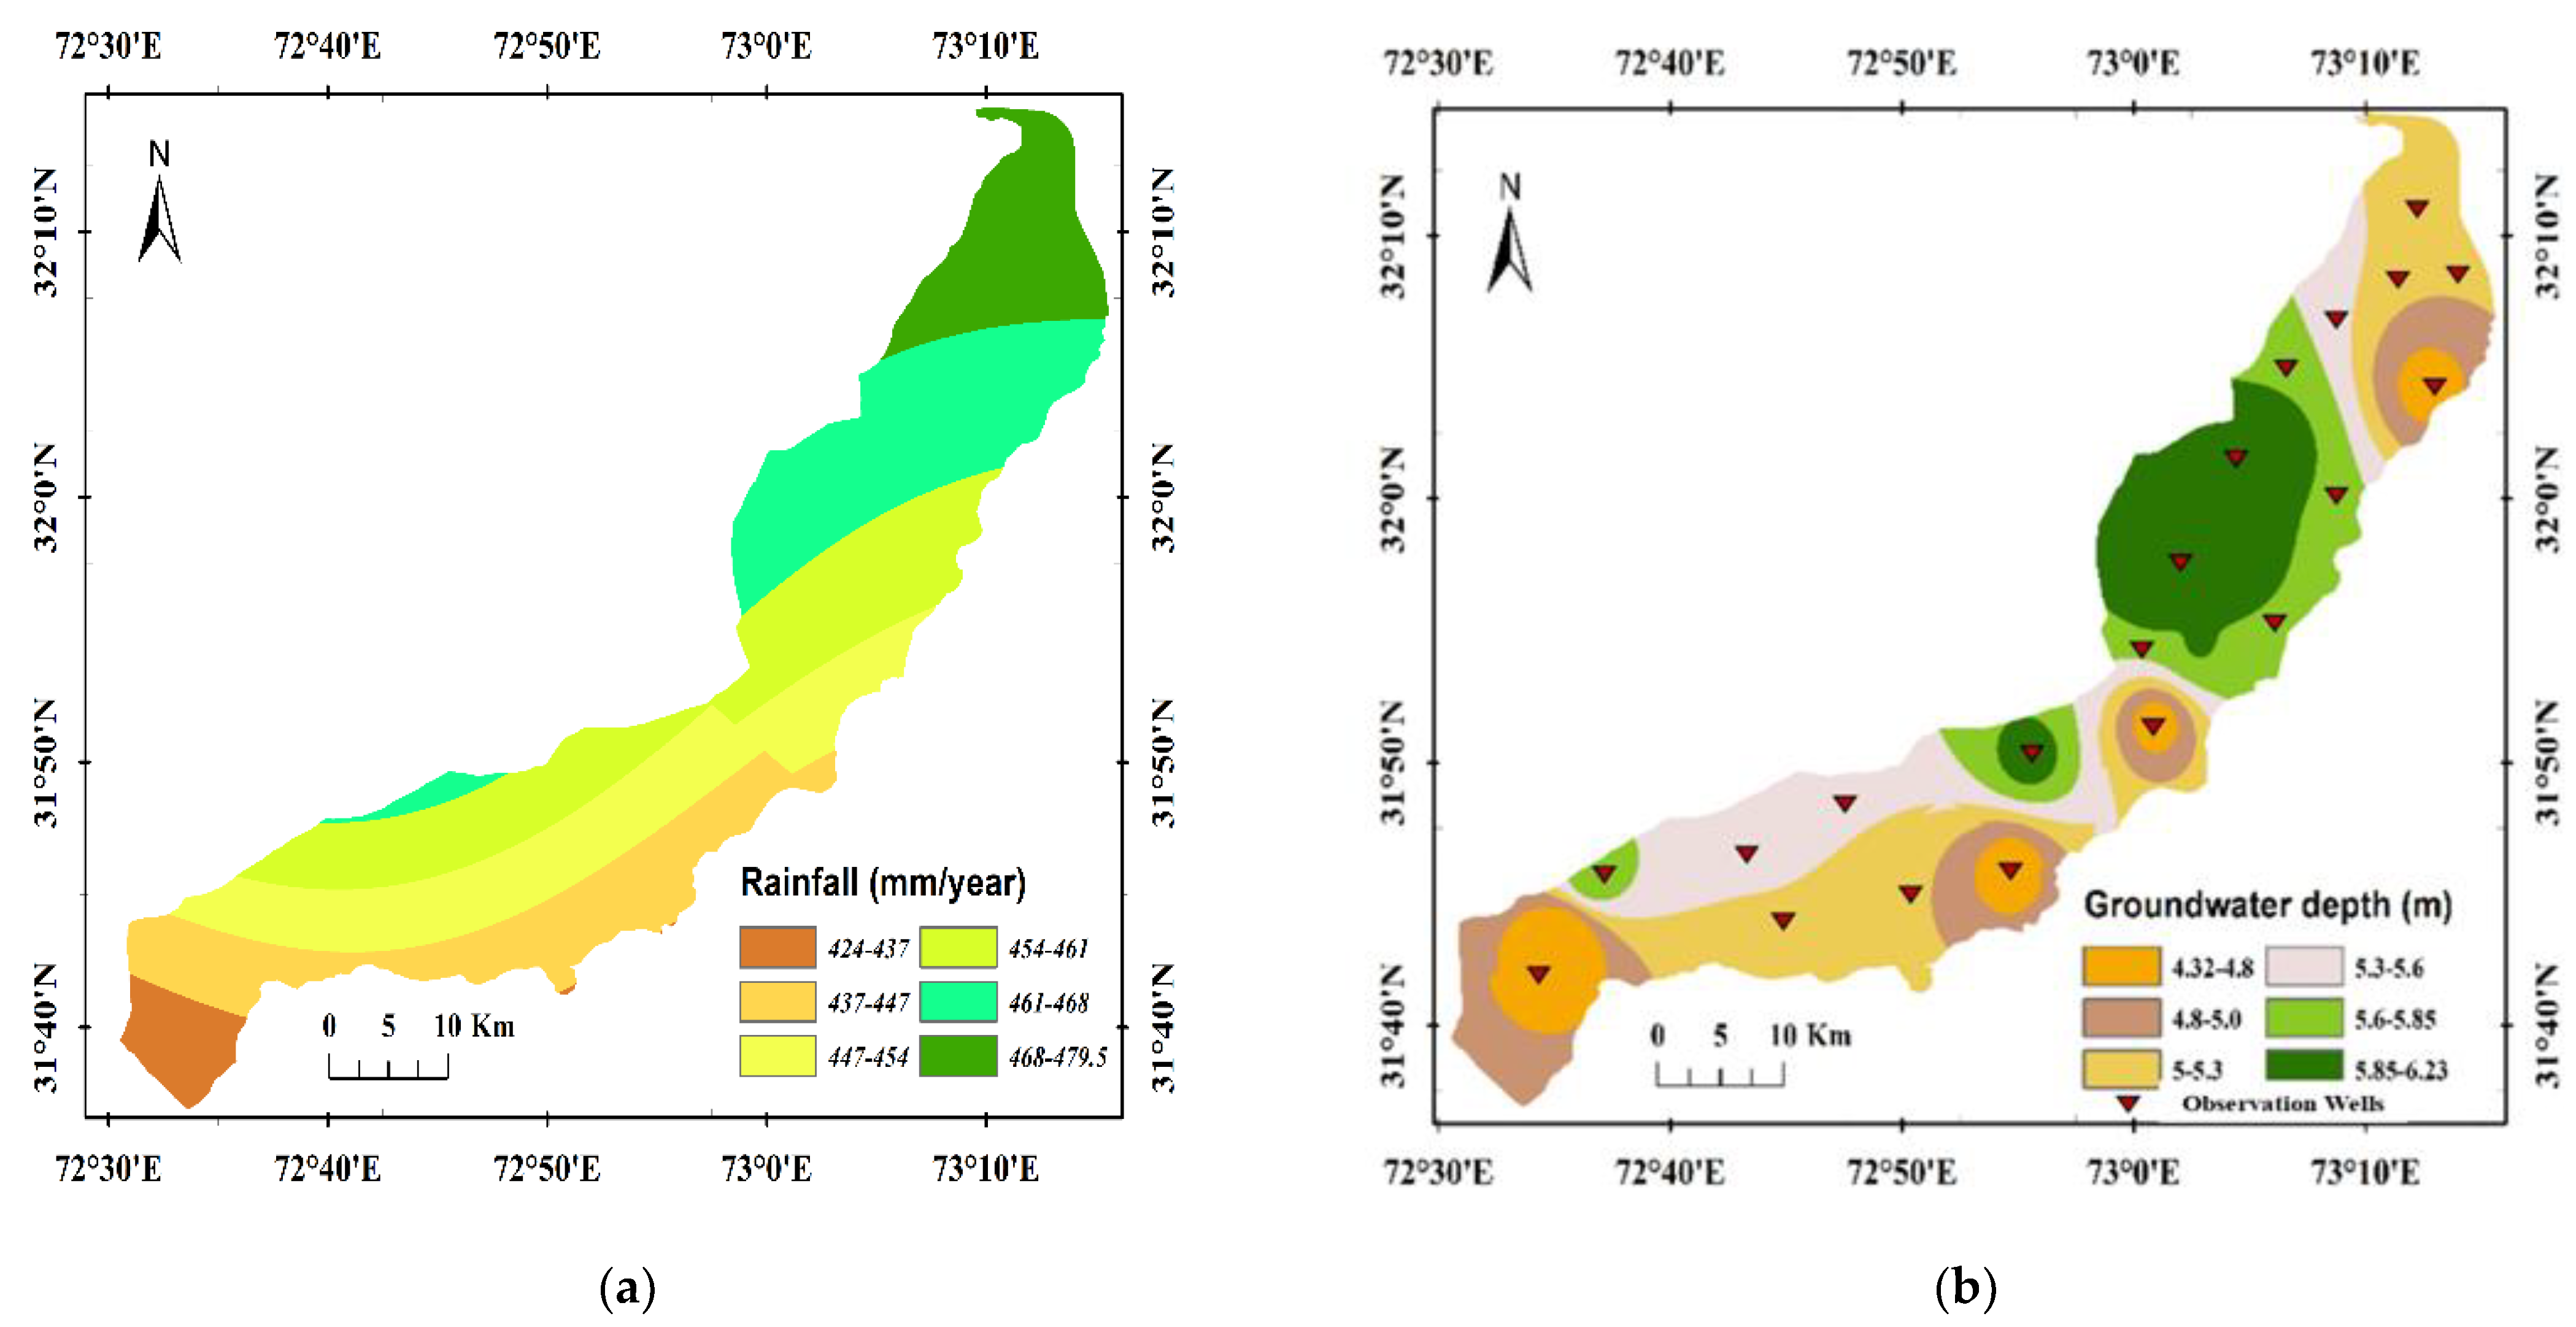
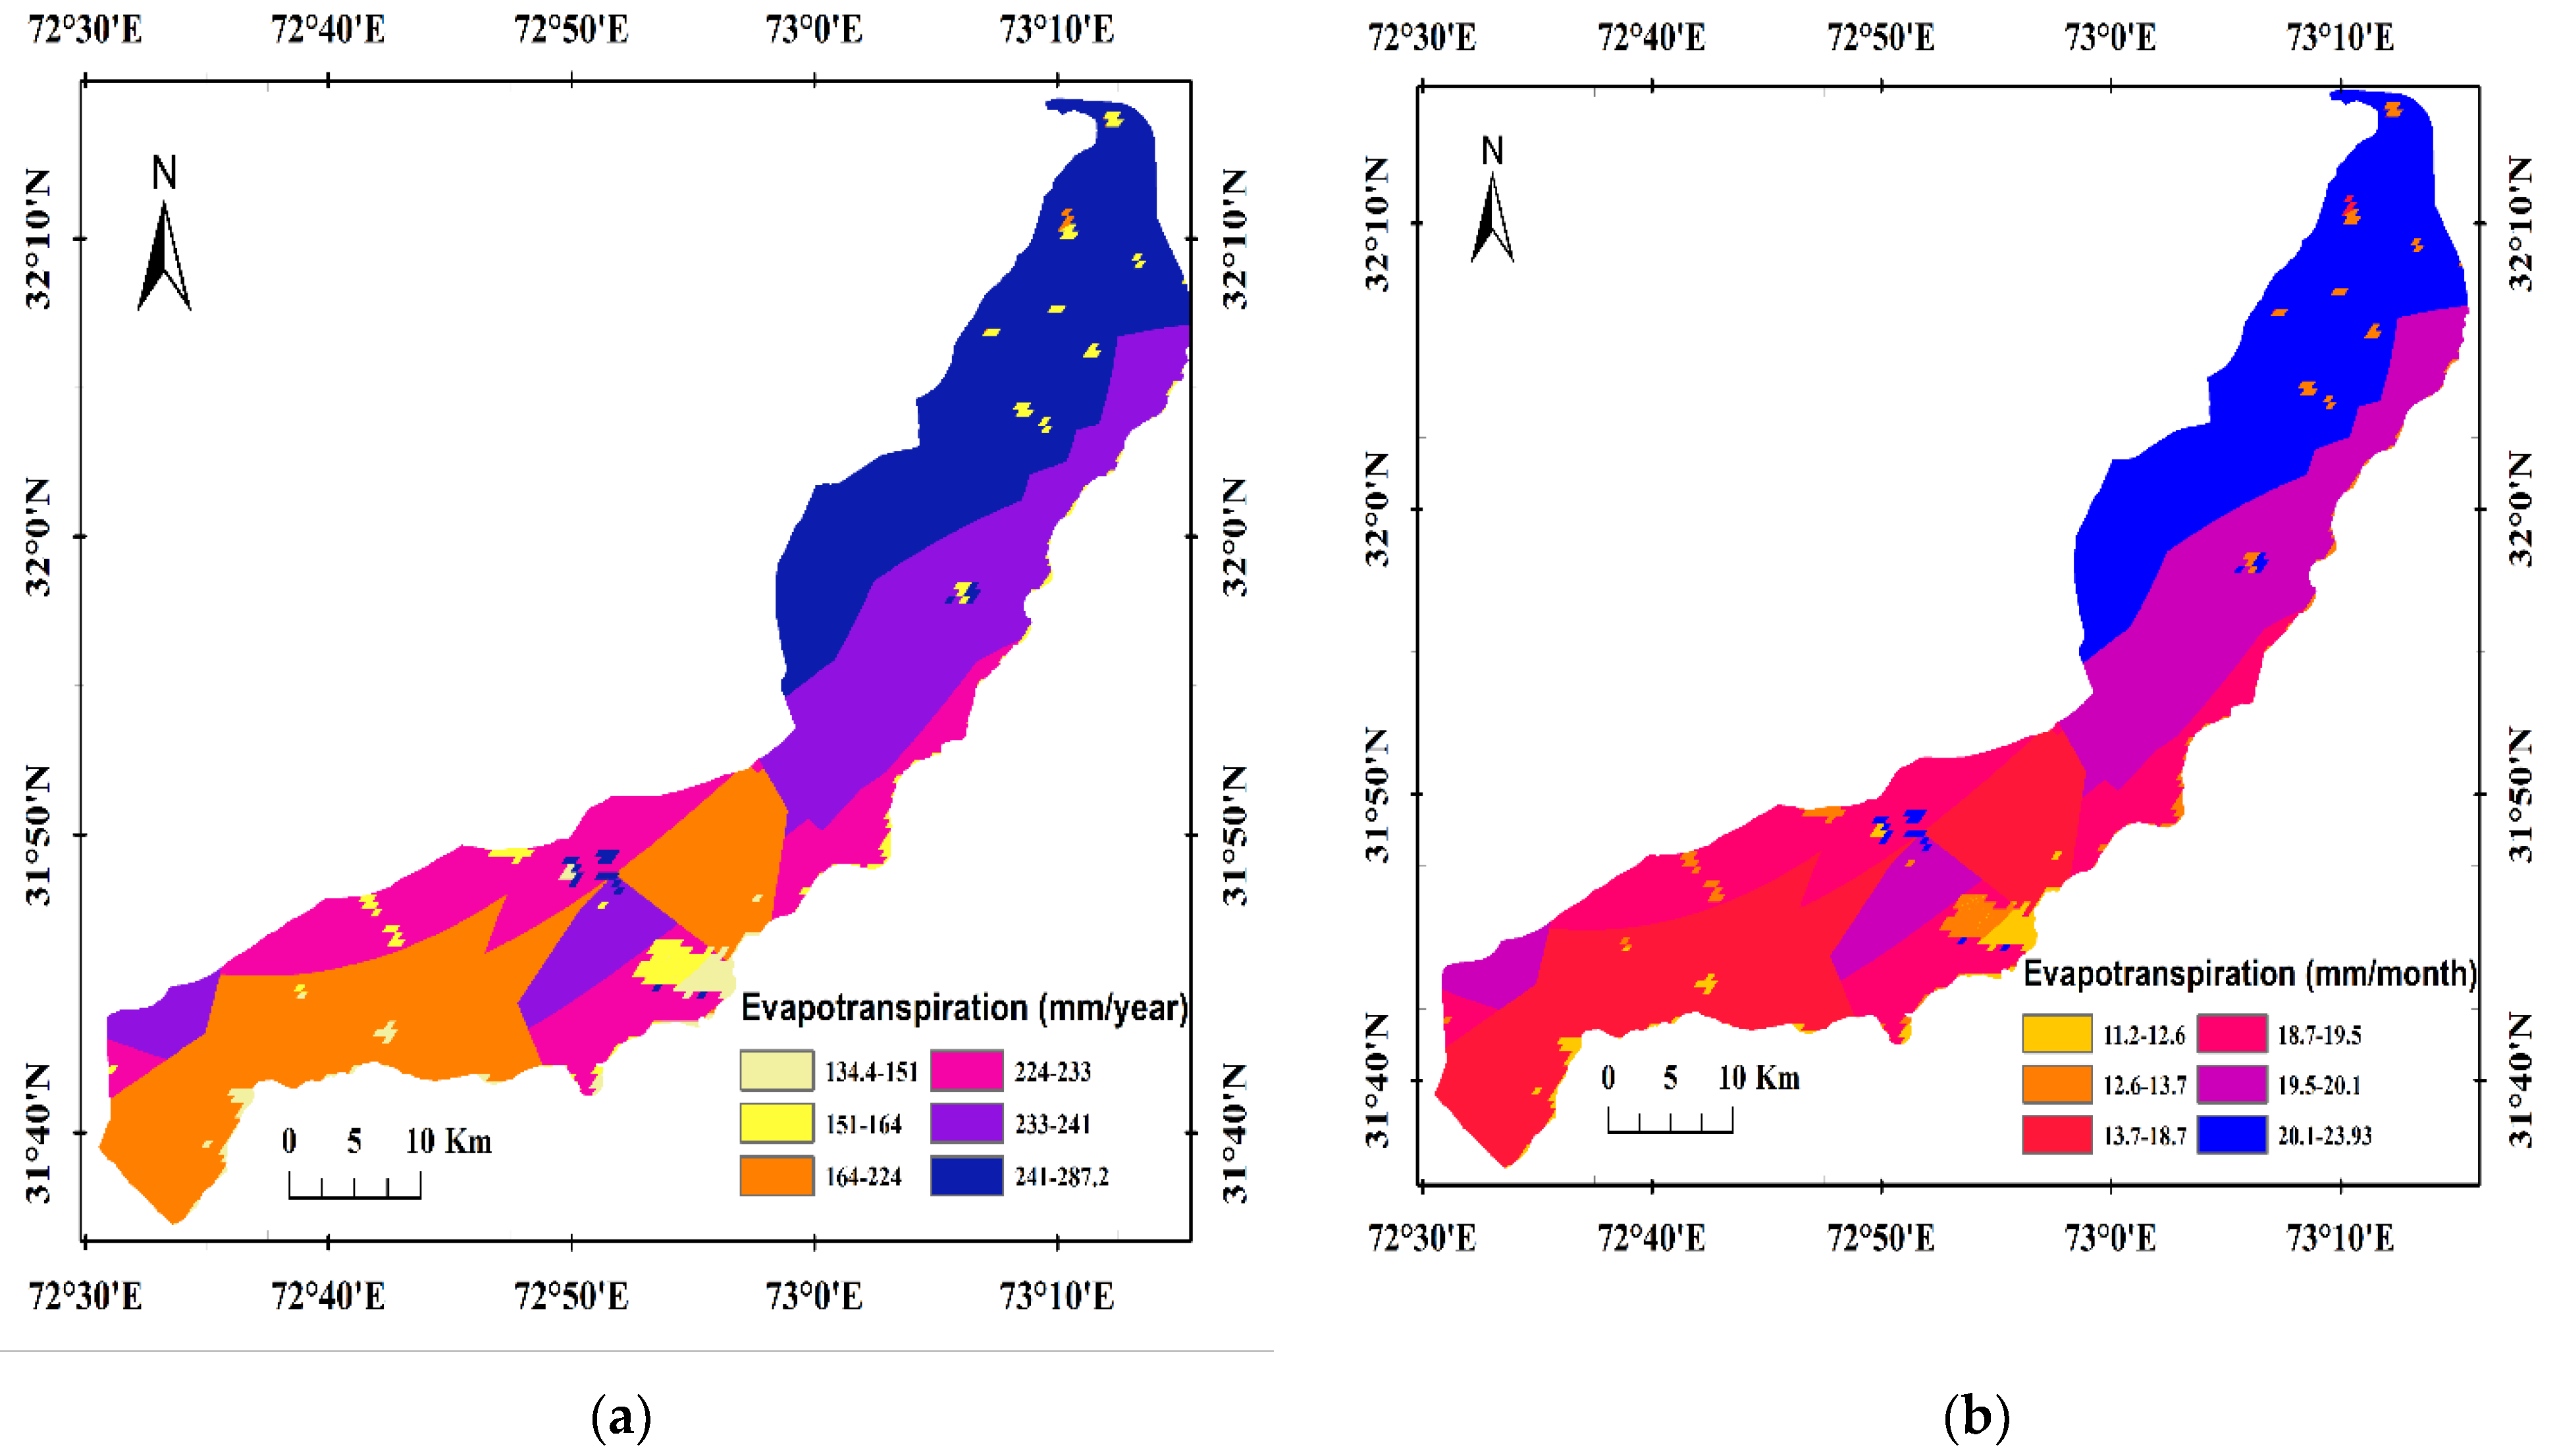
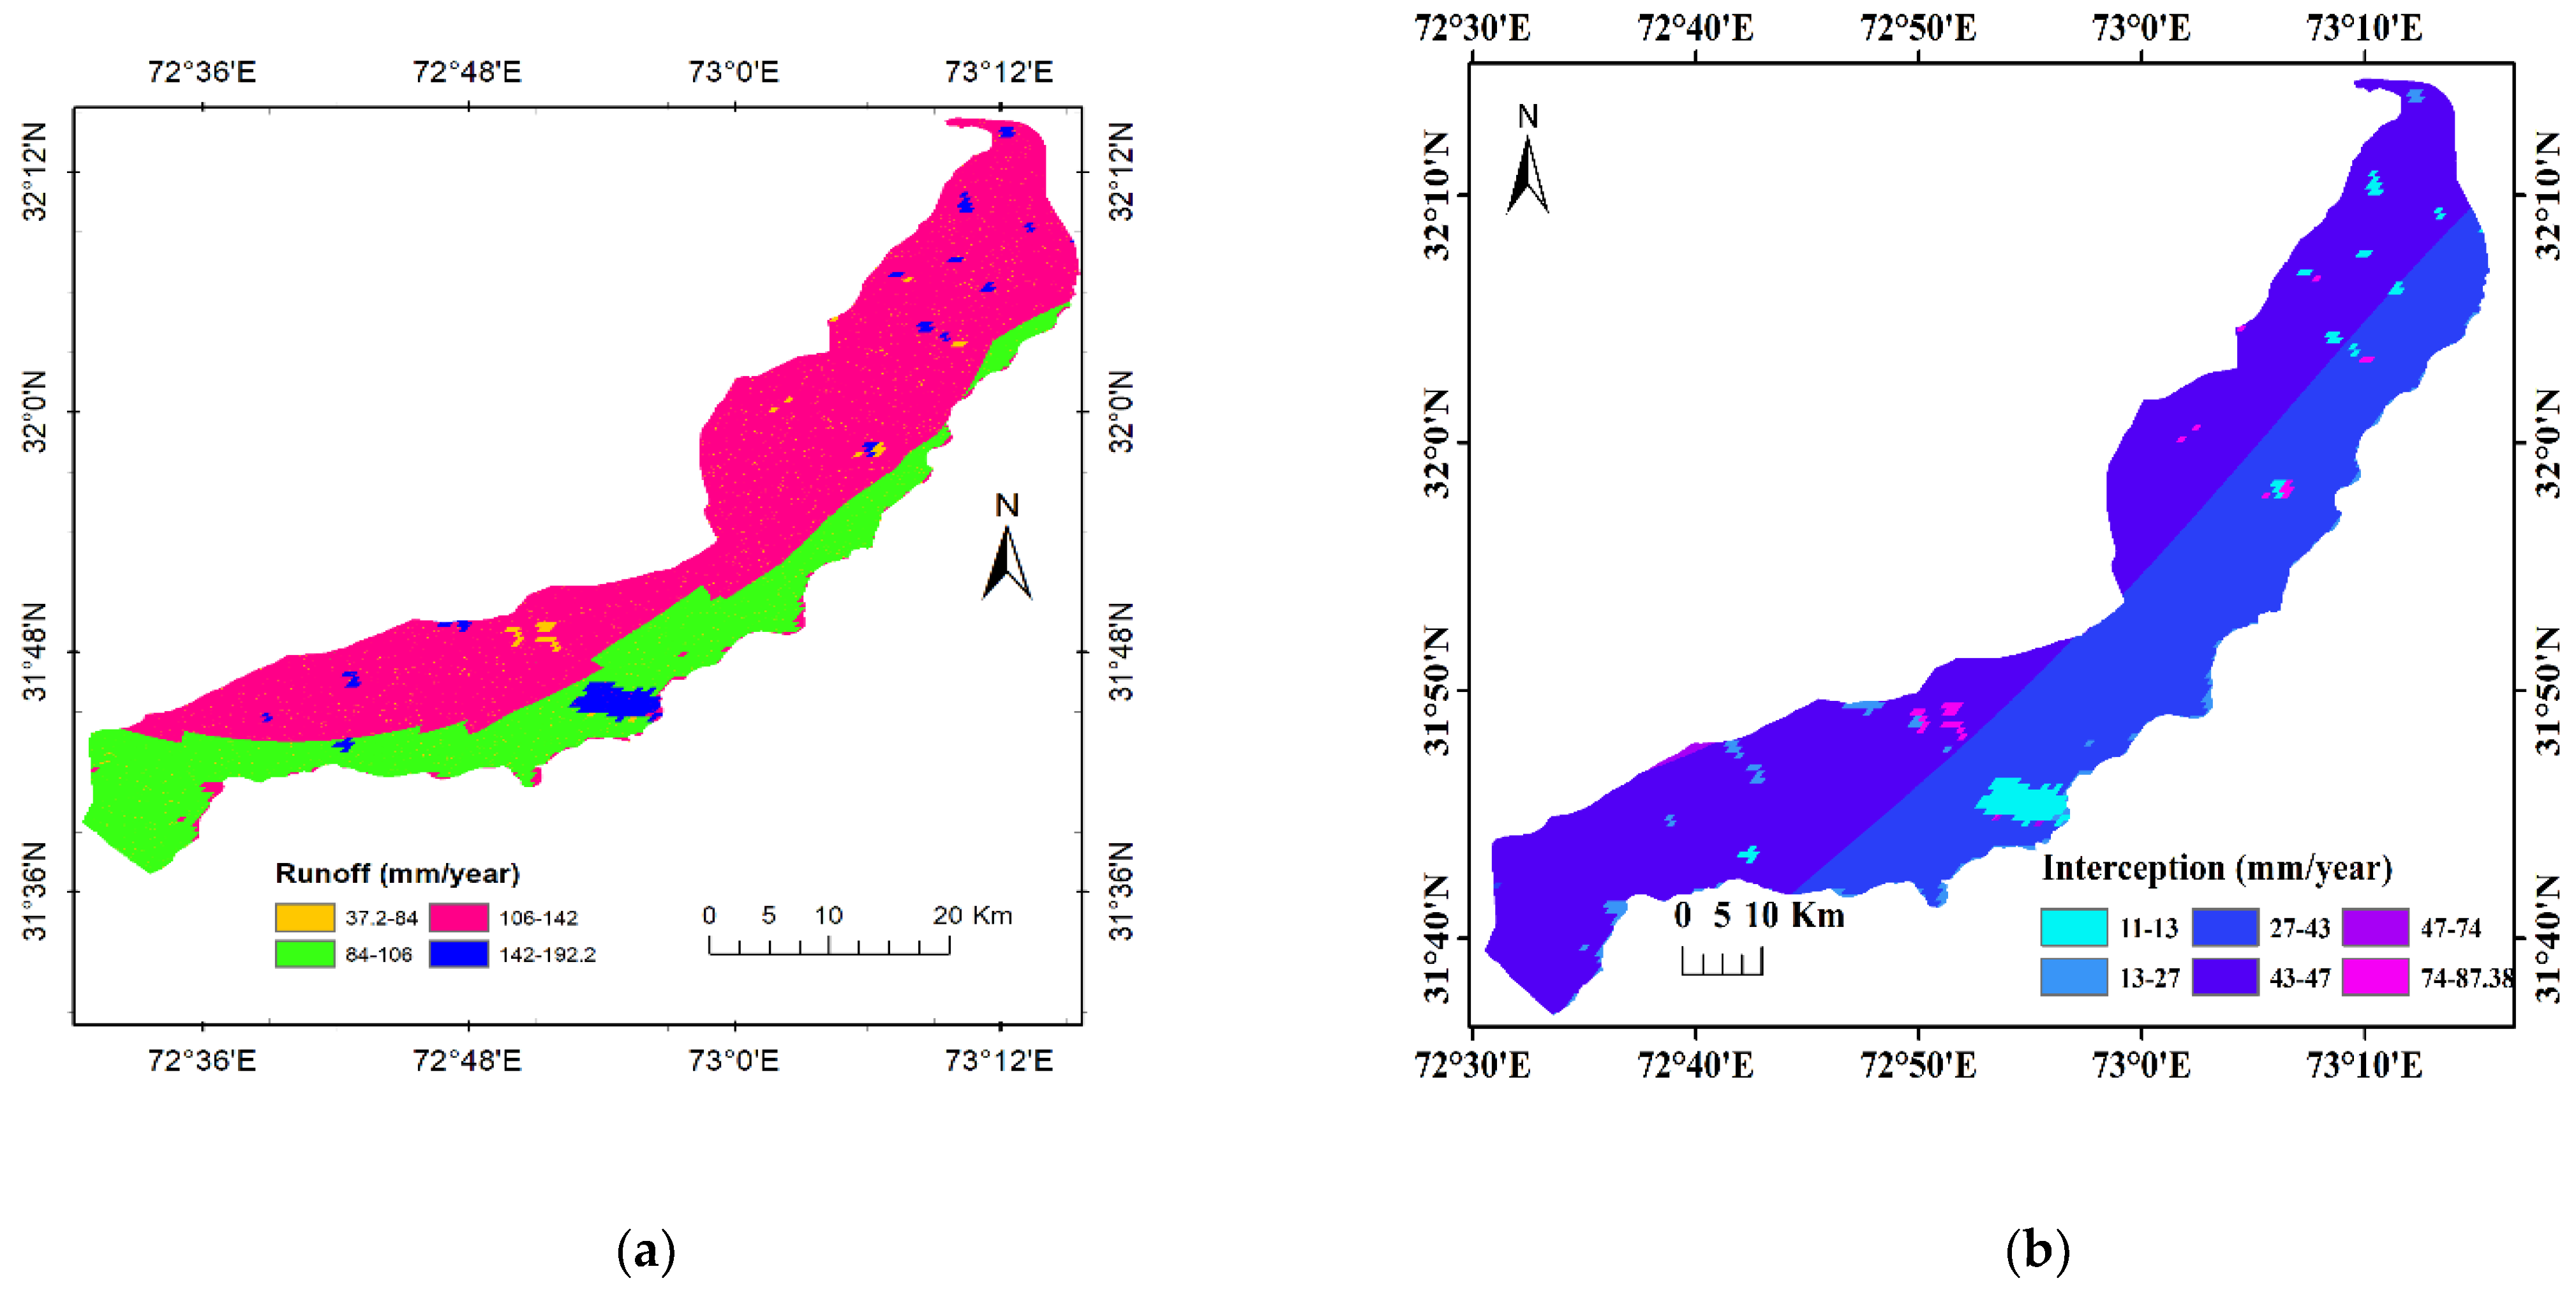
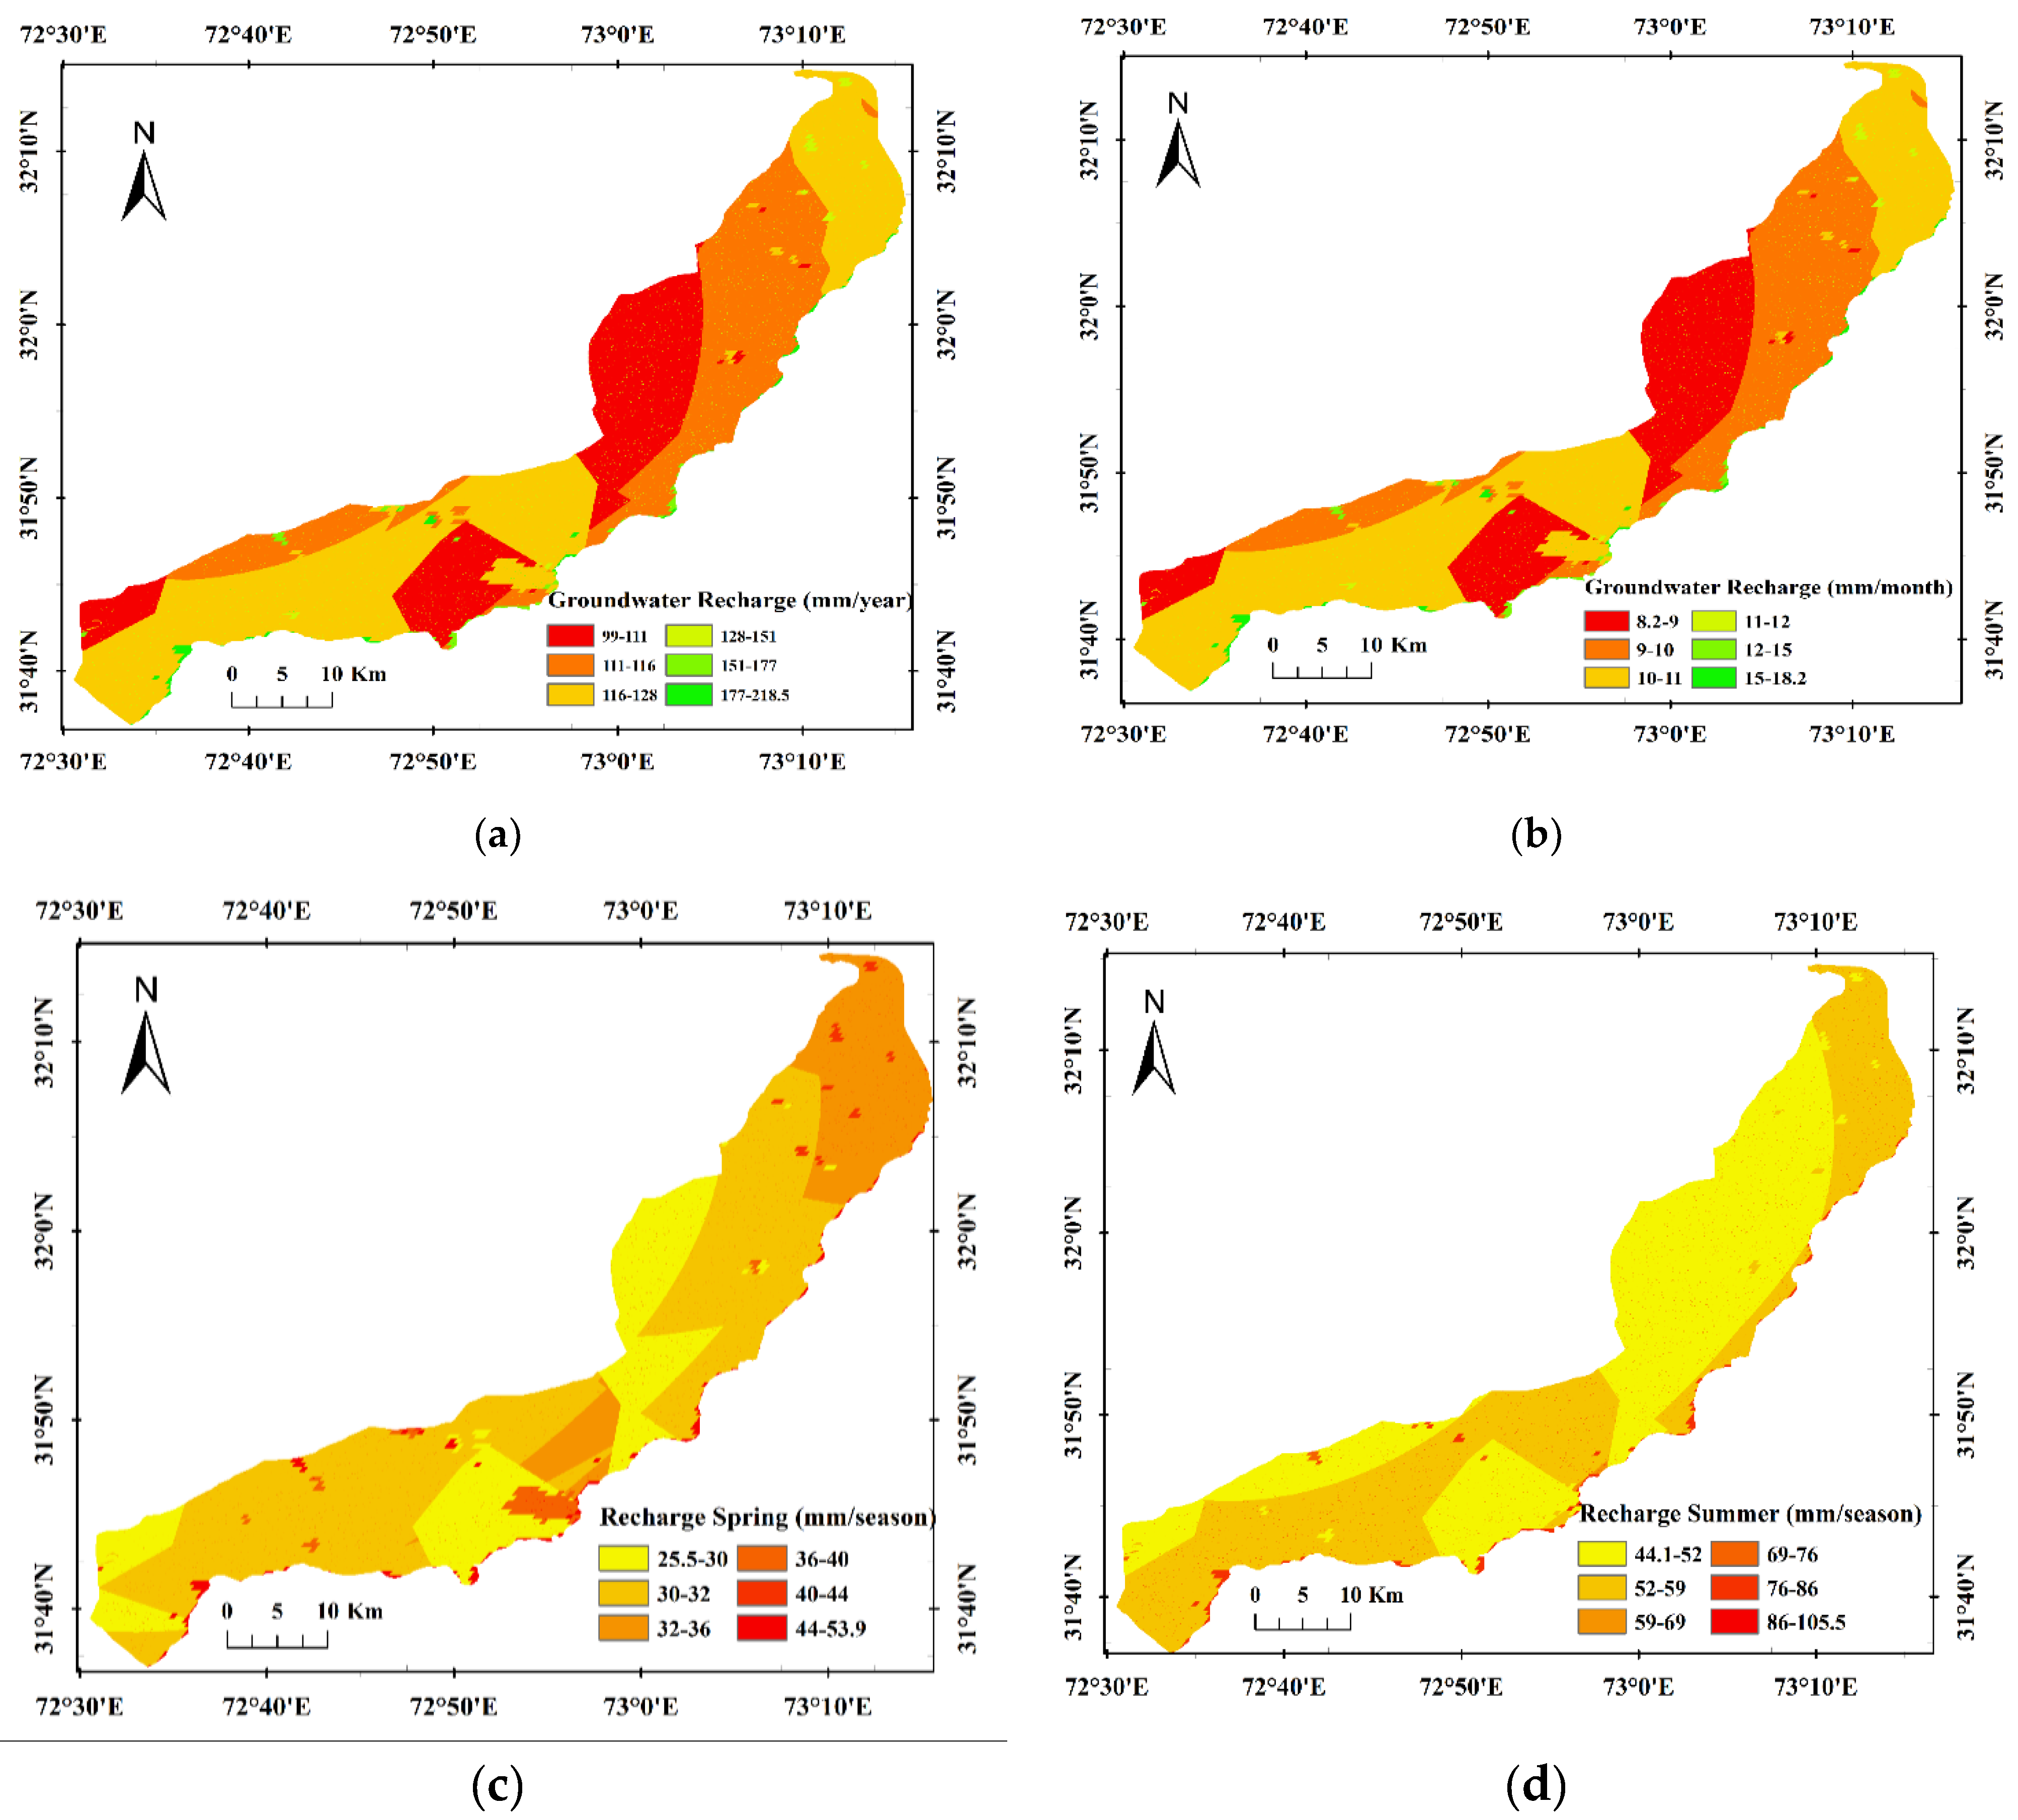
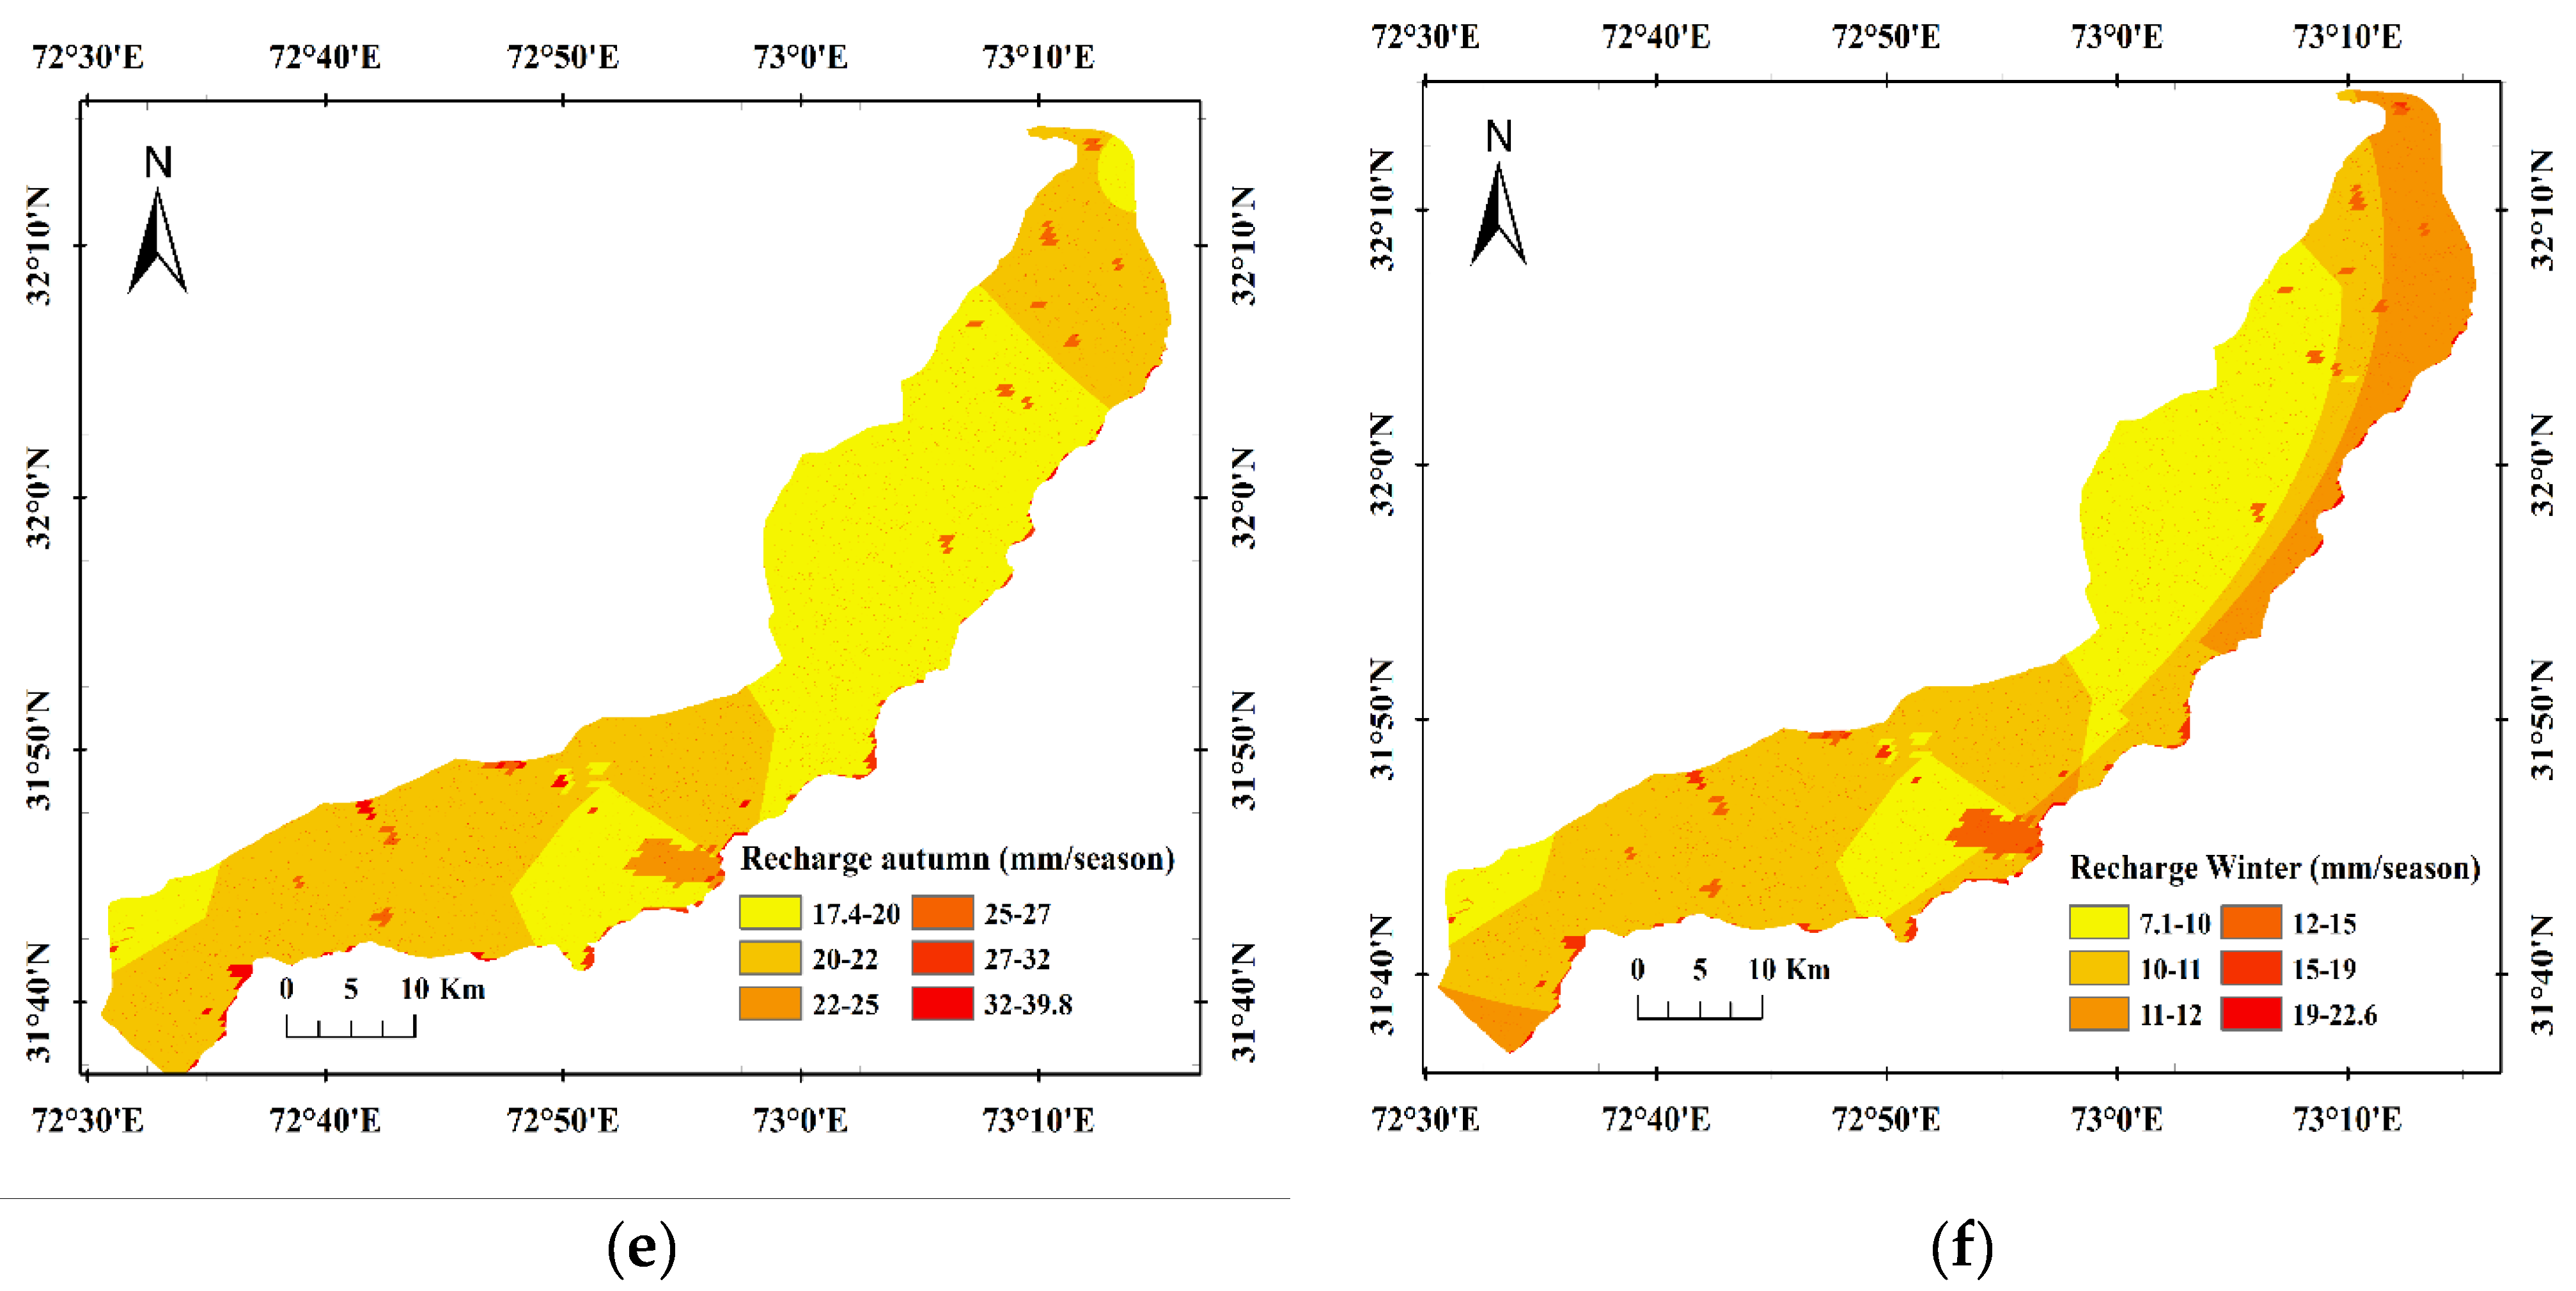
3.2. Temporal and Spatial Distribution of Simulated Water Balance Components

The WetSpass model yielded 240 raster maps of each water balance component, evapotranspiration, runoff, recharge, and interception in raster Ascii maps for the period of 2000 to 2019 on a monthly basis. Each pixel in the raster output map had a unique value of the water balance component [14]. This is the first study to assess the spatial and temporal distribution of water balance components in the Khadir canal sub-division, Chaj Doab, Pakistan. Simulations by the WetSpass model were used to evaluate the water budget of the study area at annual, seasonal, and monthly scales. Evapotranspiration, as a crucial component of water balance, removes a major part of rainfall and causes water losses [34]. Long-term annual evapotranspiration ranged between 134.4 mm/year and 287.2 mm/year with an average value of 231 mm/year and a standard deviation of 17.9 mm for the period of 2000 to 2019 (Figure 9a) and, annually, 51% of total precipitation was accounted to evapotranspiration.
Water balance components were divided into four seasons (summer, autumn, winter, and spring). Long-term summer evapotranspiration ranged from 68.5 mm/season to 141.5 mm/season with a mean value of 114.5 mm/season and a standard deviation of 8.5 mm. Long-term autumn evapotranspiration varied with a minimum value of 22.4 mm/season and a maximum value of 53.7 mm/season, as well as mean and standard deviation of 41.3 mm/season and 4.4 mm, respectively. Evapotranspiration in the long-term winter season for the period of 2000 to 2019 had a maximum value of 36.7 mm/season and a minimum value of 16.1 mm/season with an average value of 28.8 mm/season and a standard deviation of 1.9 mm. Long-term spring evapotranspiration values ranged between 22.3 mm/season and 60.8 mm/season having an average value of 47.4 mm/season and a standard deviation of 4.5 mm, as shown in Table 1. Results showed that 51% of evapotranspiration occurred in summer, 18% in autumn, 14% in winter, and 17% in spring. Similarly, long-term monthly evapotranspiration ranged between 11.2 mm/month and 23.9 mm/month as minimum and maximum values, respectively, with a standard deviation of 1.5 mm and an average value of 19.4 mm/year, as shown in Table 2 and Figure 9b.
Surface runoff is a function of the soil type, slope, and vegetation of the area [35]. Annual seasonal and monthly runoff distributions are depicted in (Table 2). Long-term annual runoff showed that its value for a period of 2000 to 2019 ranged between 37.2 mm/year and 192.2 mm/year with an average value of 109.1 mm/year and a standard deviation of 12.9 mm/year (Table 2) (Figure 10a). Average annual surface runoff attributes for 24% of total average precipitation. Seasonal results showed that 77% of evapotranspiration occurred in summer, 10.3% in autumn, 4.3% in winter, and 8.4% in spring. Similarly, long-term monthly runoff ranged between 3.1 mm/month and 16 mm/month as minimum and maximum values, respectively, with a standard deviation of 1.1 mm/year and an average value of 9.3 mm/year, as shown in Table 2. Long-term annual interception ranged between a minimum value of 11 mm/year and a maximum value of 87.3 mm/year and had an average value of 60.1 mm/year with a standard deviation of 8.4 mm, as shown in Figure 10b and Table 2.
Groundwater recharge is also a necessary component of groundwater management and was simulated for long-term (20 years) annual, seasonal, and monthly periods, as shown in Table 1. Results showed that 25% of the total average precipitation was due to average groundwater recharge. The long-term annual groundwater recharge showed that its value for the period of 2000 to 2019 ranged between 99.1 mm/year and 218.5 mm/year with an average value of 115.6 mm/year and a standard deviation of 9.0 mm/year, as shown in Figure 11a.
Long-term summer groundwater recharge ranged from 44.1 mm/season to 105.6 mm/season with a mean value of 114.5 mm/season and a standard deviation of 4.5 mm/season (Figure 11d.) Long-term autumn groundwater recharge varied with a minimum value of 17.4 mm/season and a maximum value of 39.8 mm/season with mean and standard deviation of 20.7 mm/season and 1.9 mm/season, respectively (Figure 11e). Long-term groundwater recharge in winter for the period of 2000 to 2019 has a maximum value of 22.7 mm/season and minimum value of 7.1 mm/season with an average value of 10.5 mm/season and a standard deviation of 1.3 mm/season (Figure 11f). Long-term groundwater recharge values of spring ranged between 25.6 mm/season and 53.9 mm/season, having an average value of 8.9 mm/season and a standard deviation of 2.2 mm/season (Figure 11c). Results showed that 51% groundwater recharge occurred in summer, 18% in autumn, 14% in winter, and 17% in spring. Similarly, long-term monthly groundwater recharge ranged between 8.3 mm/month and 18.2 mm/month as minimum and maximum values, respectively, with a standard deviation of 0.8 mm/month and an average value of 9.8 mm/month (Figure 11b).

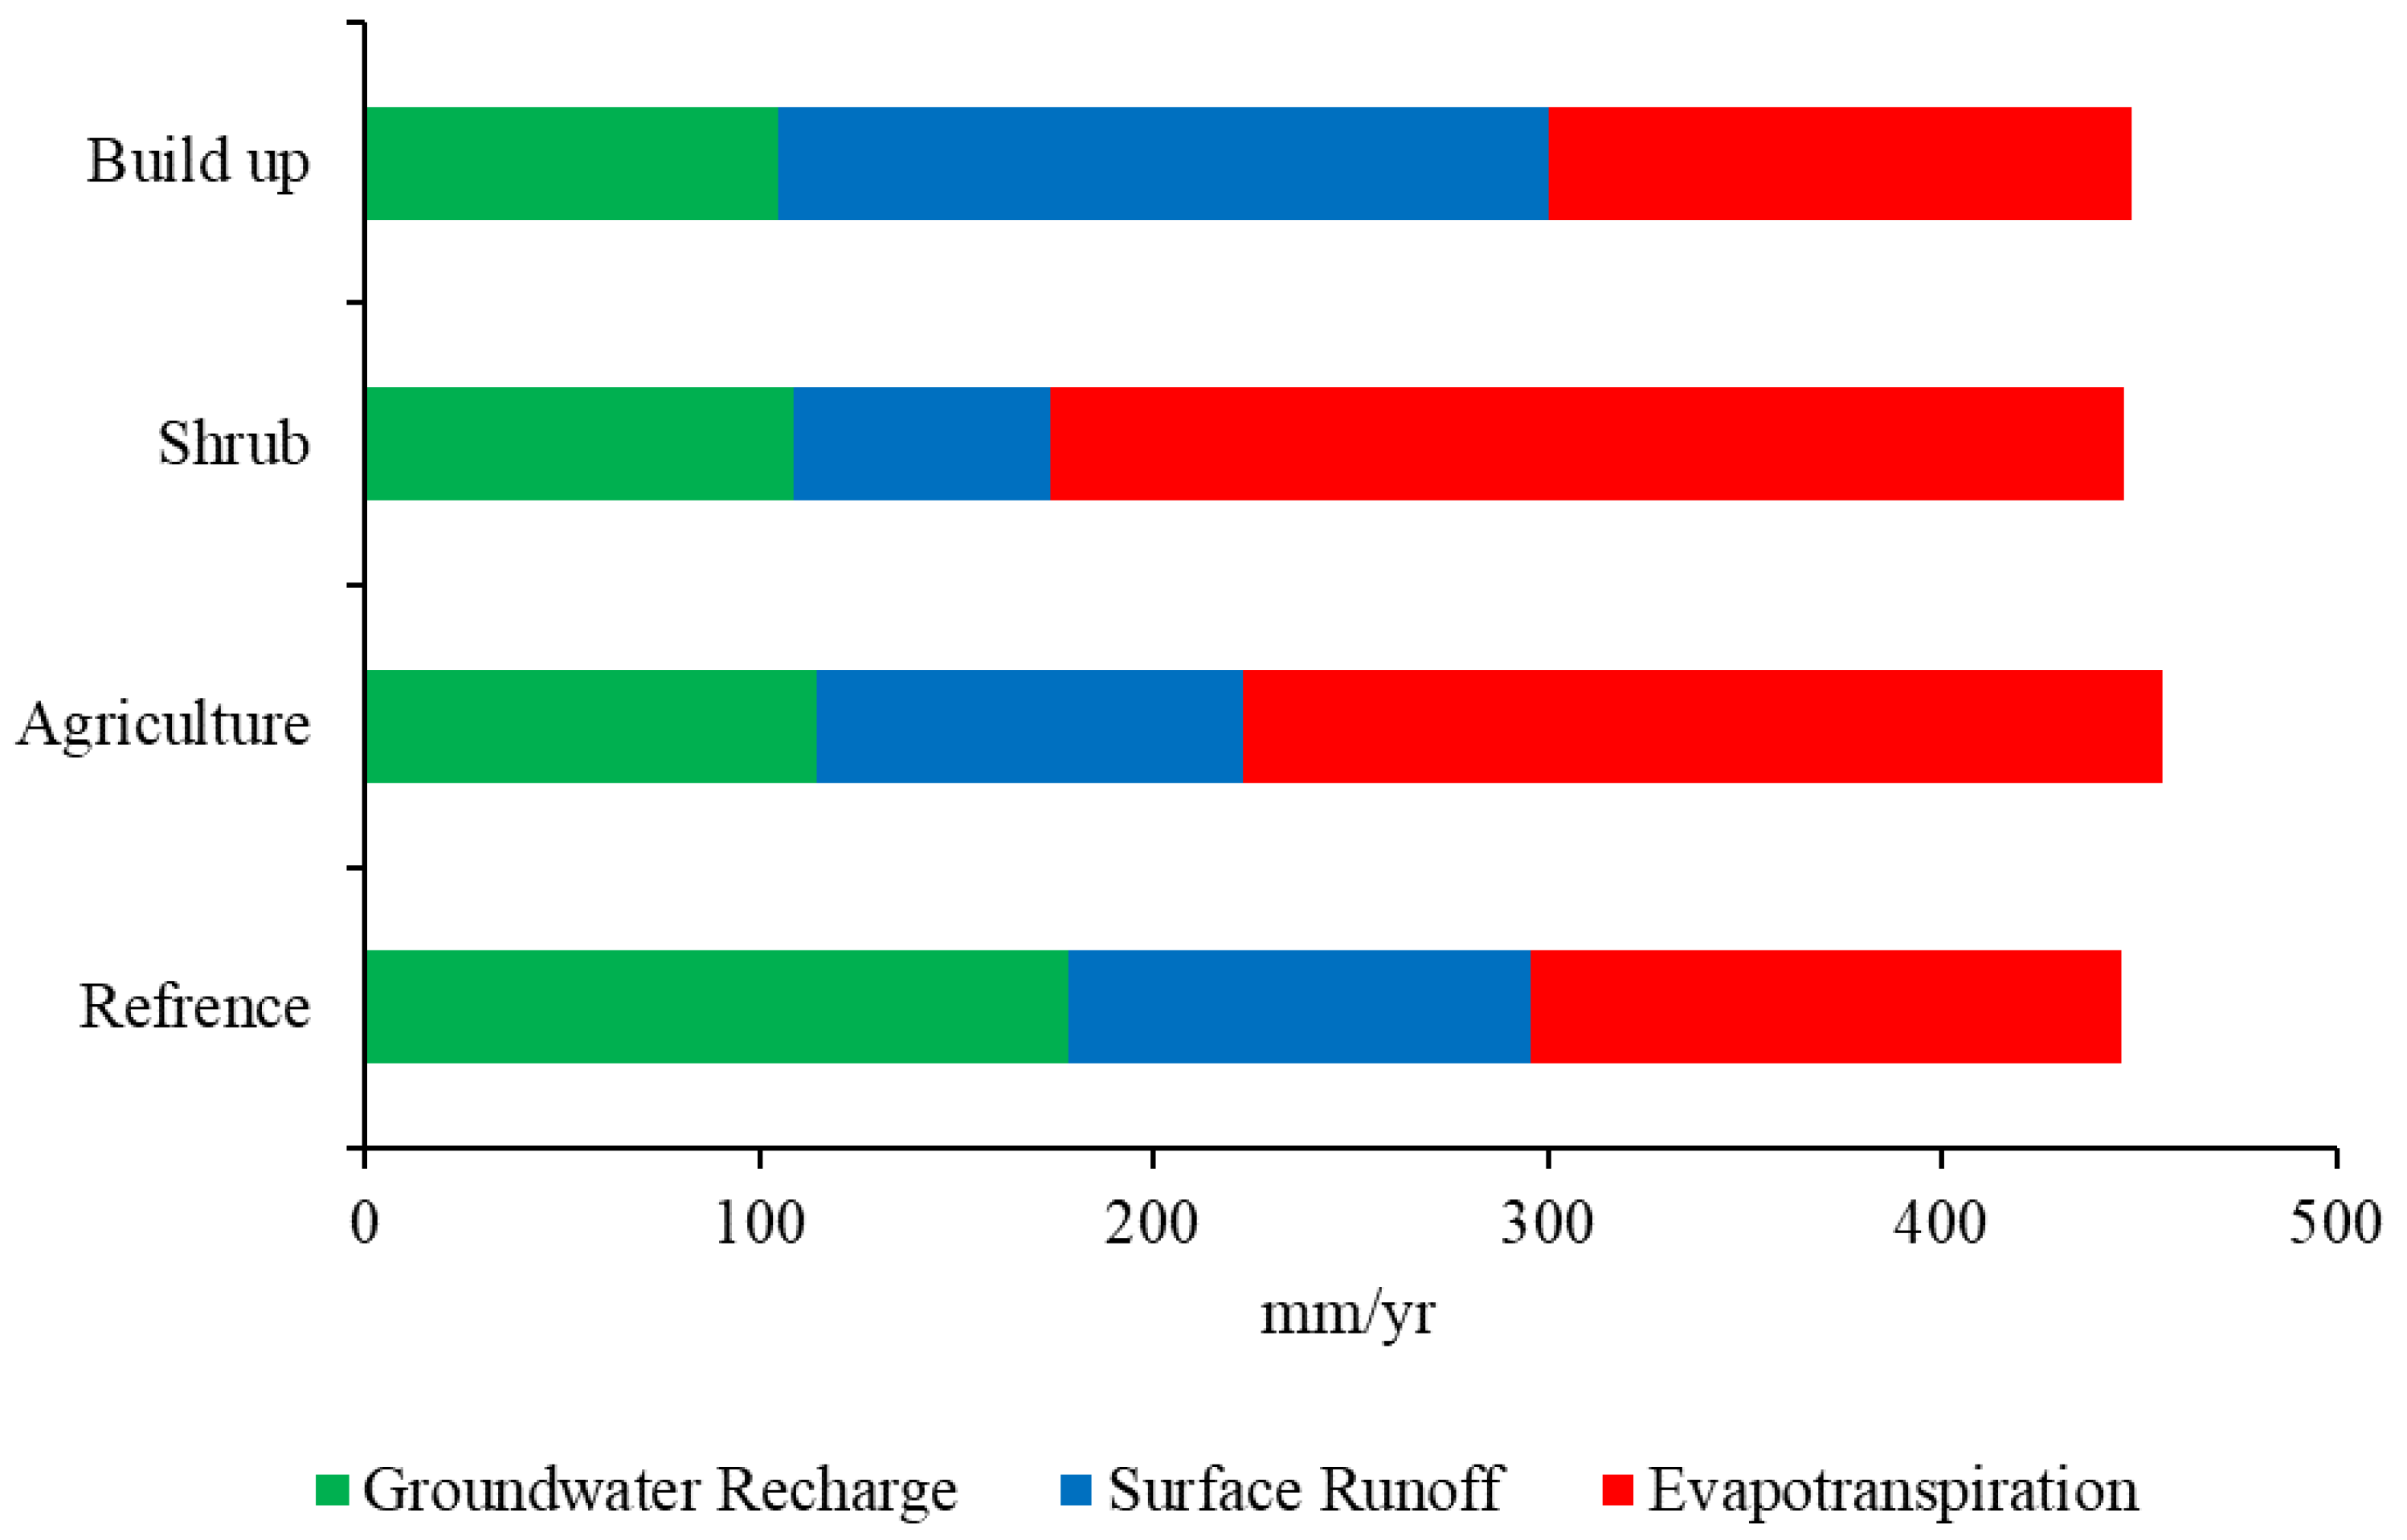
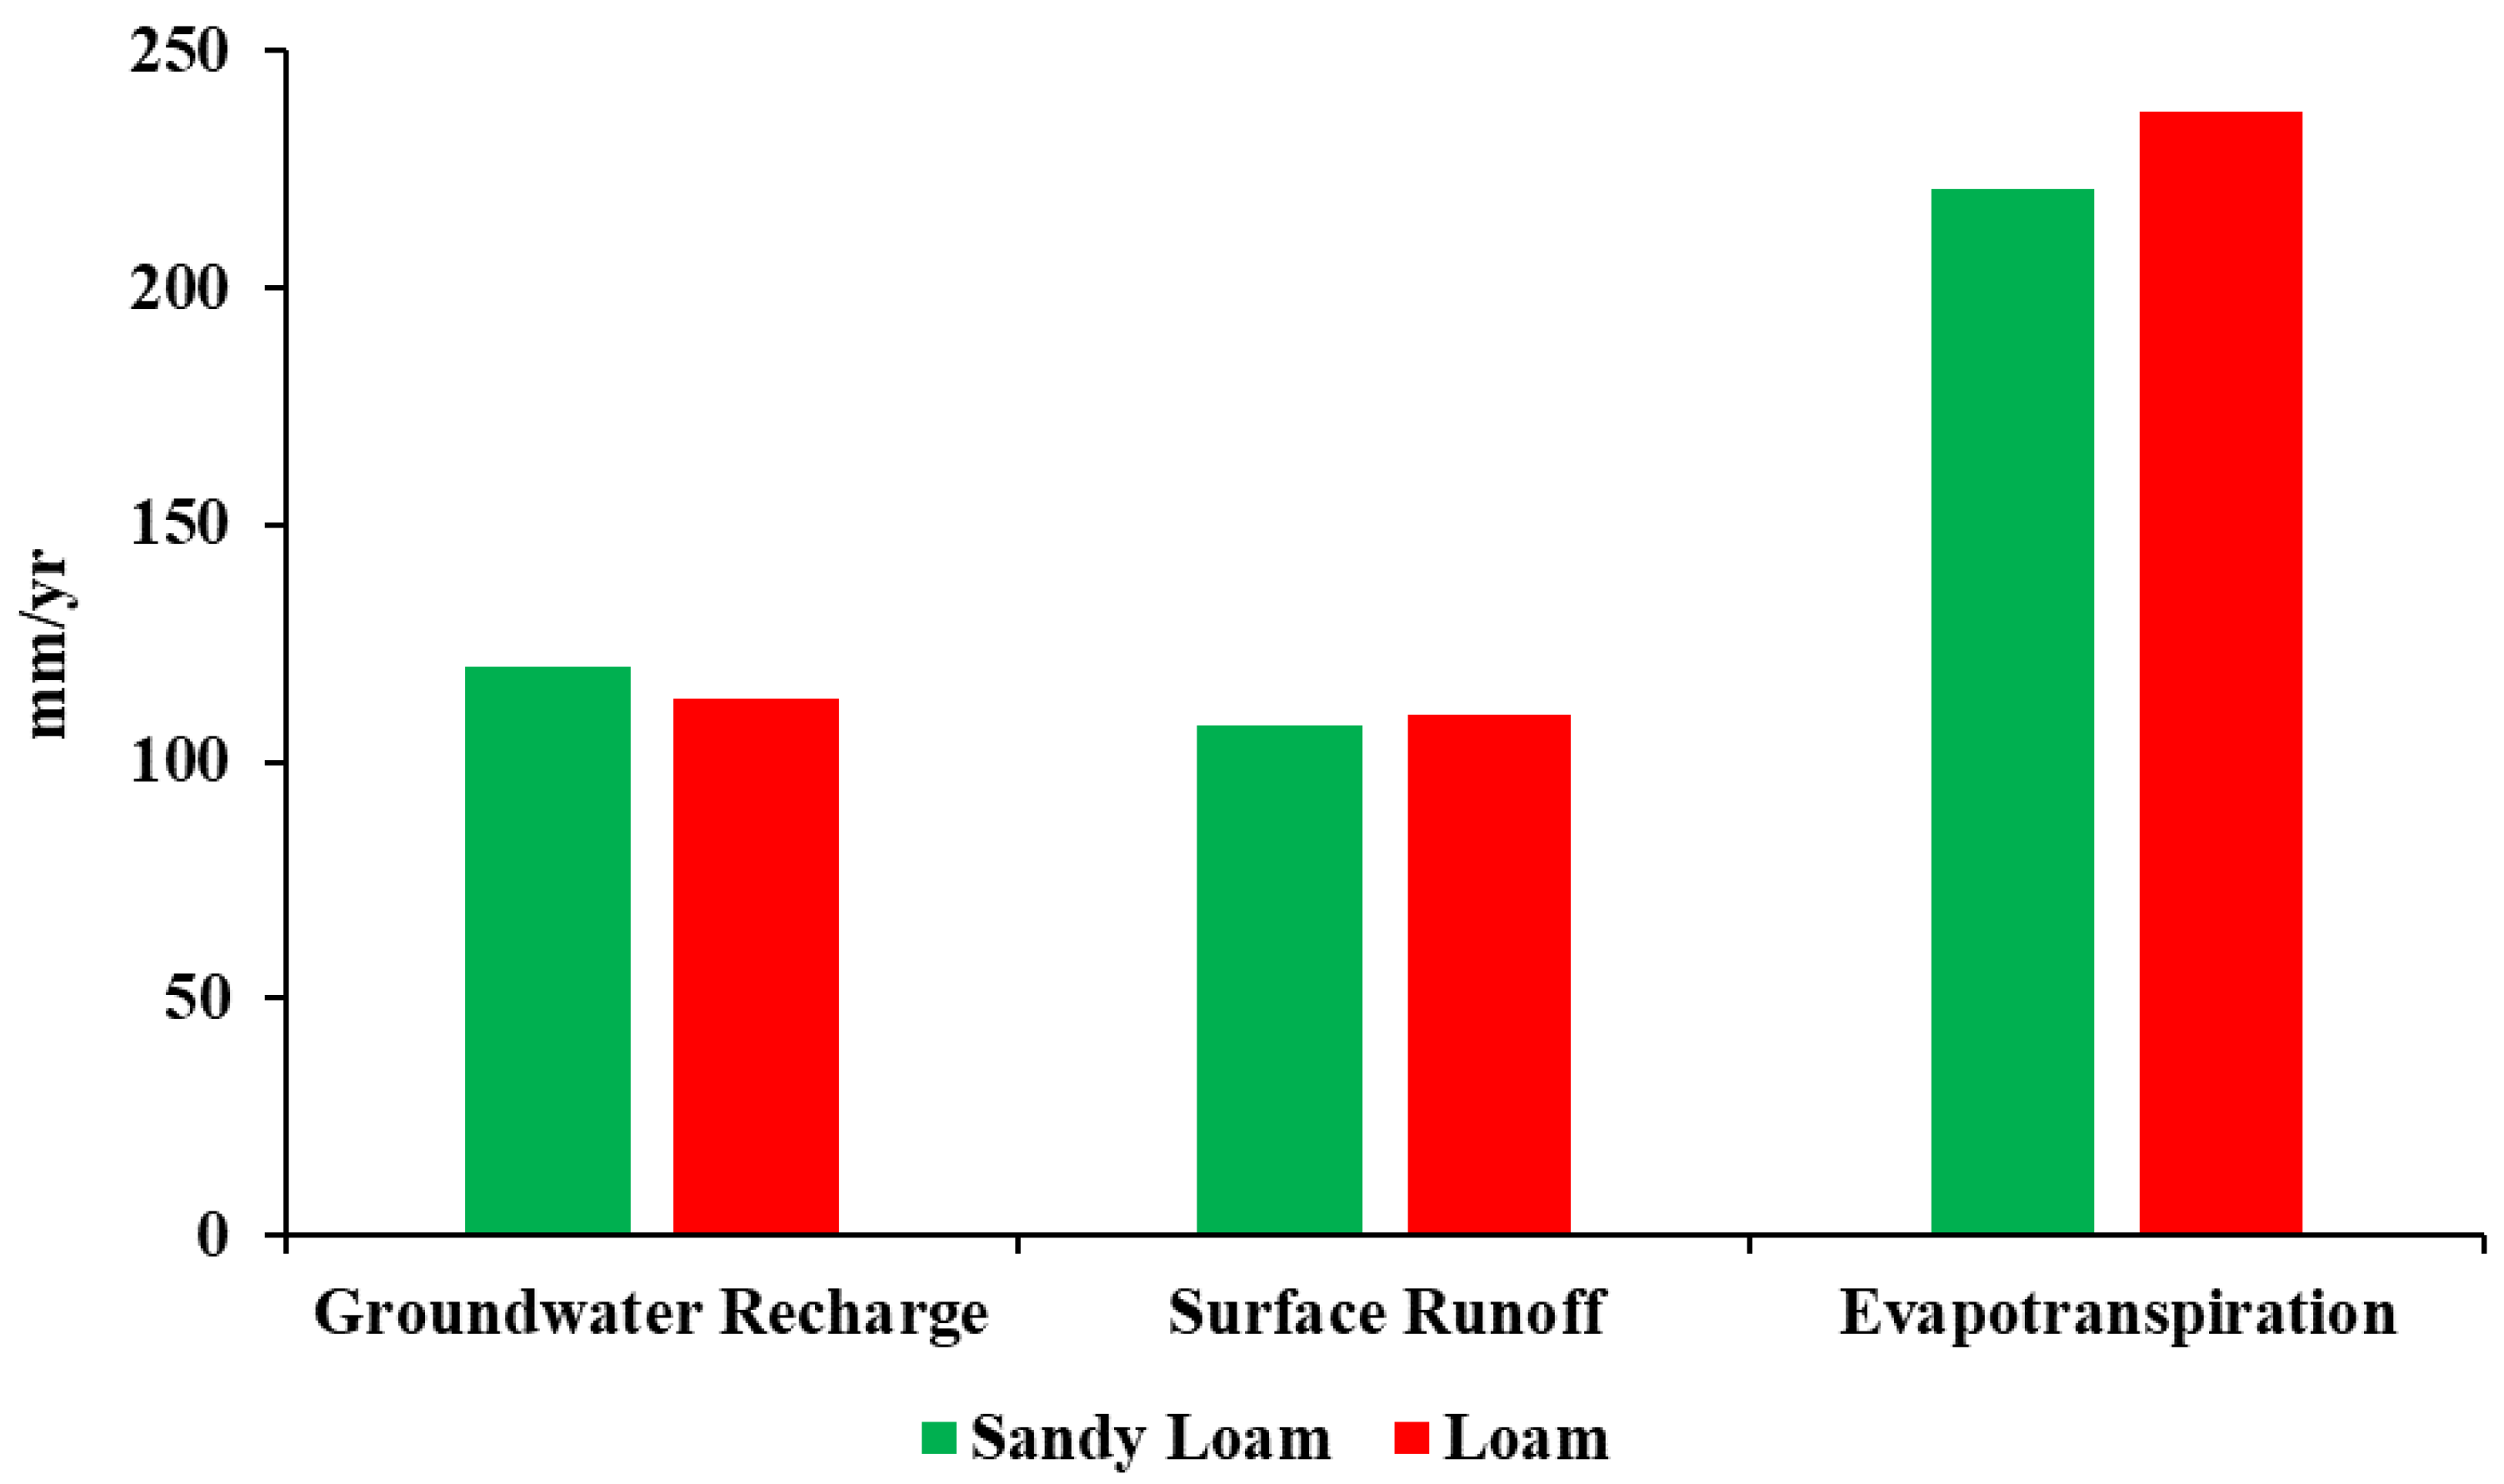
3.3. Water Balance Components under Different LULC and Soil Types

Assessment of the water balance components, especially recharge, with respect to land-use/land-cover change is important for proper groundwater management. Land use/land cover directly affects the water balance components of evapotranspiration, recharge, and runoff [36,37], and the relationship between land use and land cover was assessed in this study. In built-up areas, long-term annual surface runoff was greater as compared to evapotranspiration and groundwater recharge, as shown in Figure 12. Evapotranspiration in the built-up area was 32.7%, recharge was 23.7%, and runoff was 43.6 % of the total precipitation, as shown in Appendix A Table A1. In the shrubs area, there was more evapotranspiration than recharge and surface runoff, as evapotranspiration in the shrubs-covered area was 59%, runoff 16.3%, and recharge was only 24.7% of the total precipitation. In agricultural areas, simulated evapotranspiration was 51.1%, surface runoff 23.3%, and recharge 25.3% of the total precipitation on a long-term annual basis. In the reference (grass) area, recharge was observed to be maximum as compared to evapotranspiration and runoff. There was 40% recharge, 26.5% runoff, and 33.5% evapotranspiration of the total precipitation, as shown in Table A1.
The relationship between water balance components and soil texture was important for groundwater management. The study area was divided into two major classes, sandy loam and loam. Groundwater balance components behaved differently in different soil types. In sandy loam soil, more recharge was simulated by the model than in loamy soil, but evapotranspiration and surface runoff in sandy loam were more than in loamy soil, as shown in Figure 13.
In sandy loam, evapotranspiration was simulated as 49.2%, surface runoff as 23.8%, and recharge as 27% of the total precipitation. In loamy soil, evapotranspiration was simulated as 51.5%, surface runoff as 23.9%, and recharge as 24.6% of the total precipitation, as shown in Table A2. Simulation of groundwater balance components at spatial and temporal scales is useful for the efficient management of groundwater resources. The results obtained are highly encouraging and can be used as input data for groundwater model development for future prediction of groundwater resources and development of groundwater management guidelines for the study area.

4. Conclusions

Overexploitation in the Khadir basin without effective monitoring for groundwater is lessening groundwater availability. Understanding the spatial and temporal variation in groundwater in this region is imperative for sustainable management of groundwater resources. Its management is important for preserving this precious resource for nourishing and raising future offspring on the face of the planet. For proper simulation and management of the aquifer, the study of groundwater balance components is necessary. The long-term annual, seasonal, and monthly groundwater recharge, actual evapotranspiration, and surface runoff of the Khadir canal sub-division were estimated using the spatially distributed water balance model WetSpass-M. Specific input data were prepared in the form of digital maps using GIS tools. Parameter attribute tables in the WetSpass model were adjusted to the conditions prevailing in the study area. Basic input data for this model, including meteorological data (rainfall, potential evapotranspiration, wind speed, and temperature), topography, land use/land cover, soil texture, groundwater depth, and leaf area index, were prepared in raster maps using ArcGIS 10.3.1. Water balance components were simulated at annual, seasonal, and monthly scales. Long-term average annual rainfall of 455.7mm was divided into evapotranspiration of 231 mm (51%), surface runoff of 109.1 mm (24%), and recharge of 115.6 mm (25%). The long-term monthly evapotranspiration was 19.5 mm (50.6%), surface runoff was 9.3 mm (24.1%), and recharge was 9.8 mm (25.3%) of the total monthly precipitation of 38.5 mm (100%). Seasonal results showed that 51% groundwater recharge occurred in summer, 18% in autumn, 14% in winter, and 17% in spring. The relationship between land use/land cover and groundwater balance components showed that there was more recharge in a grassy area, more runoff in built-up areas, and more evapotranspiration in shrubs-dominated areas. Similarly, the relationship between soil type and water balance components showed that, in sandy loam, there was more recharge than in loamy soils and less evapotranspiration, as well as less runoff than in loamy soils. Simulation of groundwater balance components at spatial and temporal scales is useful for the efficient management of groundwater resources.

Author Contributions

Conceptualization, methodology and investigation, M.A. (Muhammad Aslam), A.S., V.S., and M.A (Muhammad Arshad); building the model, M.A. (Muhammad Aslam) and A.S.; writing the paper, M.A. (Muhammad Aslam); reviewing and editing the paper, V.S., A.S., and M.A. (Muhammad Aslam) All authors have read and agreed to the published version of the manuscript.

Funding

This research received no external funding.

Institutional Review Board Statement

Not applicable.

Informed Consent Statement

Not applicable.

Data Availability Statement

Meteorological input data for the WetSpass-M model were collected from the Paki-stan Meteorological Department.

Acknowledgments

Authors are highly thankful to the Department of Irrigation and Drainage and the University of Agriculture Faisalabad for providing lab facilities. The first author would like to thank the Higher Education Commission of Pakistan (HEC) for providing him with an HEC-Indigenous Scholarship. The first author would like to thank the department of biological and agricultural engineering at Texas A&M University USA for providing me with a good learning environment in its lab.

Conflicts of Interest

The authors declare no conflict of interest.

Appendix A

Table A1. Average annual water balance components as a function of land-use types.
LULC TypeWater Balance Components (mm)MinMXRANGEMEAN%STD
Build upRainfall438.0479.040.9451.310012.1
Evapotranspiration137.3164.927.6148.032.75.7
Runoff127.4192.264.9195.043.67.6
Recharge121.1173.352.2105.023.75.0
AgricultureRainfall424.0479.555.5455.910010.7
Evapotranspiration208.9250.942.0233.551.19.9
Runoff56.5123.166.7107.723.66.5
Recharge102.4151.449.1114.825.35.6
ShrubRainfall439.2469.630.4457.31006.2
Evapotranspiration262.1287.225.1272.4599.0
Runoff37.268.831.565.616.33.1
Recharge99.1129.029.9108.524.74.9
ReferenceRainfall424.0467.443.4446.01009.6
Evapotranspiration134.4162.227.7149.533.56.4
Runoff65.8137.471.6117.226.58.2
Recharge166.2218.552.3178.6405.2
Table A2. Average annual water balance components as a function of soil types.
Soil TypeWater Balance Components (mm)MINMAXRANGEMEAN%STD
Sandy loamRainfall424.0463.839.8449.31008.3
Evapotranspiration134.4264.8130.3220.949.212.9
Runoff41.3192.2150.9107.623.811.3
Recharge112.3218.5106.2119.9278.5
LoamRainfall434.6479.544.8459.610010.1
Evapotranspiration142.7287.2144.6237.051.517.7
Runoff37.2191.6154.4110.123.913.7
Recharge99.1214.2115.1113.324.68.4

References

  1. NRC (National Research Council). Water Implications of Biofuels Production in the United States; National Academies Press: Washington, DC, USA, 2008. [Google Scholar]
  2. Ahmad, H.M.N.; Kaleem Ullah, K.; Qureshi, A.S. Controlling Groundwater Table through Localize sub-surface Evaporation Basin: A Case Study of Rachna Doab. Irriag. Drain. 2002, 51, 61–72. [Google Scholar]
  3. Dezső, J.; Lóczy, D.; Salem, A.; Gábor, N. Floodplain connectivity. In The Drava River: Environmental Problems and Solutions; Springer Science + Media: Cham, Switzerland, 2019; pp. 215–230. [Google Scholar]
  4. Bakhsh, A.; Ahamd, R.N.; Awan, A. A Use of Groundwater and Energy in Pakistan: Issue and Options. In One Day Seminar, Theme: Water and DessertsWater Management Research Center; University of Agriculture Faisalabad: Punjab, Pakistan, 2004. [Google Scholar]
  5. Ahmad, M.U.; Bastiaanssen, W.G.; Feddes, R.A. A new technique to estimated groundwater use at irrigated areas by combining remote sensing and water balance approaches Rachna Doab, Pakistan. Hydrol. J. 2005, 13, 653–664. [Google Scholar] [CrossRef]
  6. Shah, T. Groundwater economy of South-Asia: An Assessment of size, significant and socio-ecological impacts. In Agriculture and Groundwater Revolution. Opportunities and Threats to Development; Giordano, M., Villholth, K.G., Eds.; CABI Publication: Islamabad, Pakistan, 2007; p. 36. [Google Scholar]
  7. Basharat, M. Integarion of Canal and Groundwater to Improve Cost and Quality of Groundwater in Canal Command. Ph.D. Thesis, Center of Excellence in Water Resources Engineering, University of Engineering and Technology, Lahore, Pakistan, 2012. [Google Scholar]
  8. Qureshi, A.S.; Sarwae, A. Sustainable groundwater management in Pakistan: Challenges and Opportunities. Irrig. Drain. 2010, 59, 107–116. [Google Scholar] [CrossRef]
  9. Dezső, J.; Salem, A.; Lóczy, D.; Slowik, M.; Dávid, P. Randomly layered fluvial sediments influenced groundwater-surface water interaction. In Proceedings of the 17th International Multidisciplinary Scientific GeoConference SGEM 2017, Vienna, Austria, 27 June–6 July 2017; Volume 17, pp. 331–338. [Google Scholar]
  10. Wang, B.; Jin, M.; Nimmo, J.R.; Yang, L.; Wang, W. Estimating groundwater recharge in Hebei Plain, China under varying land use practices using tritium and bromide tracers. J. Hydrol. 2008, 356, 209–222. [Google Scholar] [CrossRef]
  11. Moon, S.; Woo, N.C.; Lee, K.S. Statistical analysis of hydrograph and water-table fluctuation to estimate groundwater recharge. Hydrology 2004, 292, 198–209. [Google Scholar] [CrossRef]
  12. Manghi, F.; Mortazavi, B.; Crother, C.; Hamdi, M.R. Estimating regional groundwater recharge using a hydrological budget method. Water Resour. Manag. 2009, 23, 2475–2489. [Google Scholar] [CrossRef]
  13. Salem, A.; Dezso, J.; Lóczy, D.; El-Rawy, M.; Słowik, M. Modeling surface water-groundwater interaction in an oxbow of the Drava floodplain. In Proceedings of the 13th International Conference on Hydroinformatics (HIC 2018), Palermo, Italy, 1–6 July 2018; Volume 3, pp. 1832–1840. [Google Scholar]
  14. Batelaan, O.; de Smedt, F. Wetspass: A flexible, GIS based, distributed recharge methodology for regional groundwater modelling. In Impact of Human Activity on Groundwater Dynamics; Gehrels, H., Peters, J., Leibundgut, C., Eds.; International Association of Hydrological Sciences: Wallingford, UK, 2001; pp. 11–17. [Google Scholar]
  15. Abdollahi, K.; Bashir, I.; Verbeiren, B.; Harouna, M.R.; Griensven, A.V.; Husmans, M.; Batelaan, O. A distributed monthly water balance model: Formulation and application on Black Volta Basin. Environ. Earth Sci. 2017, 76, 198. [Google Scholar] [CrossRef]
  16. Karlovic, I.; Markovic, T.; Vujnovic, T.; Larva, O. Development of a Hydrogeological Conceptual Model of the Varaždin Alluvial Aquifer. Hydrology 2021, 8, 19. [Google Scholar] [CrossRef]
  17. Abu-Saleem, A. Estimation of Water Balance Components in the Hasa Basin with GIS Based–WetSpass Model. Master’s Thesis, Al Balqa Applied University, Salt, Jordan, 2010; p. 61. [Google Scholar]
  18. Al Kuisi, M.; El-Naqa, A. GIS based spatial groundwater recharge estimation in the Jafr basin, Jordan–Application of WetSpass models for arid regions. Rev. Mex. De Cienc. Geol. 2013, 30, 96–109. [Google Scholar]
  19. Gebremeskel, G.; Kebede, A. Spatial estimation of long-term seasonal and annual groundwater resources: Application of WetSpass model in the Werii watershed of the Tekeze River Basin, Ethiopia. Phys. Geogr. 2017, 38, 338–359. [Google Scholar] [CrossRef]
  20. Gebreyohannes, T.; Smedt, F.; Walraevens, K.; Gebresilassie, S. Application of a spatially distributed water balance model for assessing surface water and groundwater resources in the Geba basin, Tigray, Ethiopia. J. Hydrol. 2013, 499, 110–123. [Google Scholar] [CrossRef]
  21. Zarei, M.; Ghazavi, R.; Vali, A.; Abdollahi, K. Estimating Groundwater Recharge, Evapotranspiration and Surface Runoff using Land-use data: A Case Study in Northeast Iran. Biol. Forum Int. J. 2016, 8, 196–202. [Google Scholar]
  22. Armanuos, A.M.; Negm, A.; Yoshimura, C.; Saavedra Valeriano, O.C. Application of WetSpass model to estimate groundwater recharge variability in the Nile Delta aquifer. Arab. J Geosci. 2016, 9, 553. [Google Scholar] [CrossRef]
  23. Salem, A.; Dezso, J.; Mustafa, E.R. Assessment of Groundwater Recharge, Evaporation, and Runoff in the Drava Basin in Hungary with the WetSpass Model. Hydrology 2019, 6, 23. [Google Scholar] [CrossRef] [Green Version]
  24. Salem, A.; Dezső, J.; El-Rawy, M.; loczy, D.; Halmai, Á. Estimation of groundwater recharge distribution using Gis based WetSpass model in the Cun-Szaporca oxbow, Hungary. In Proceedings of the 19th International Multidisciplinary Scientific GeoConference SGEM 2019, Albena, Bulgaria, 28 June–7 July 2019; Volume 19, pp. 169–176. [Google Scholar]
  25. Salem, A.; Dezső, J.; El-Rawy, M.; Lóczy, D. Hydrological Modeling to Assess the Efficiency of Groundwater Replenishment through Natural Reservoirs in the Hungarian Drava River Floodplain. Water 2020, 12, 250. [Google Scholar] [CrossRef] [Green Version]
  26. Awan, N.M. Surface Water Hydrology, Vol. 1; National Book Foundation: Islamabad, Pakistan, 1981. [Google Scholar]
  27. Batelaan, O.; De Smedt, F. GIS-based recharge estimation by coupling surface-subsurface water balances. J. Hydrol. 2007, 337, 337–355. [Google Scholar] [CrossRef]
  28. Armanuos, A.M.; Negm, A. Assessment of the variations of local parameters of Wetspass model: Case study Nile Delta aquifer. Procedia Eng. 2016, 154, 276–283. [Google Scholar] [CrossRef] [Green Version]
  29. Friedl, M.; Sulla-Menashe, D. MCD12Q1 MODIS/Terra+Aqua Land Cover Type Yearly L3 Global 500m SIN Grid V006 [Data set]; NASA EOSDIS Land Processes DAAC: Sioux Falls, SD, USA, 2019; (accessed on 12 February 2021). [Google Scholar] [CrossRef]
  30. Allen, R.G.; Pereira, L.S.; Raes, D.; Smith, M. Crop Evapotranspiration—Guidelines for Computing Crop Water Requirements; FAO Irrigation and drainage paper 56; FAO: Rome, Italy, 1998. [Google Scholar]
  31. Available online: https://earthexplorer.usgs.gov/ (accessed on 10 January 2021).
  32. Available online: https://lpdaac.usgs.gov/datasetdiscovery/modis/modisproductstable/mcd12q1 (accessed on 12 February 2021).
  33. Ashraf, A.; Ahmad, Z. Regional groundwater flow modelling of Upper Chaj Doab of Indus Basin, Pakistan using finite element model (Feflow) and geoinformatics. Geophys. J. 2008, 1, 17–24. [Google Scholar] [CrossRef] [Green Version]
  34. Black, C.; Evans, A.; Ensminger, D.D.; White, L.E.; Clark, J.L. Methods of Soil Analysis; American Society of Agronomy: Madison, WI, USA, 1965. [Google Scholar]
  35. Arefaine, T.; Nedaw, D.; Gebreyohannes, T. Groundwater Recharge, Evapotranspiration and Surface Runoff Estimation Using WetSpass Modeling Method in Illala Catchment, Northern Ethiopia. Momona Ethiop. J. Sci. (MEJS) 2012, 4, 96–110. [Google Scholar]
  36. Dawes, W.R.; Gilfedder, M.; Stauffacher, M. Assessing the variability of recharge reduction for dry land salinity control vanilla Eyre, Peninsula, Australian. J. Soil Res. 2012, 40, 1407–1424. [Google Scholar] [CrossRef]
  37. Zomlot, Z.; Verbeiren, B.; Huysmans, M.; Batelaana, O. Spatial distribution of groundwater recharge and base flow: Assessment of controlling factors. J. Hydrol. Reg. Study 2015, 4, 349–368. [Google Scholar] [CrossRef] [Green Version]
Figure 1. Location map of the study area; Khadir canal sub-division, Chaj Doab, Pakistan.
Hydrology 08 00178 g001
Figure 2. Scheme of WetSpass-M model.
Hydrology 08 00178 g002
Figure 3. Input maps for model, (a) topography, (b) slope.
Hydrology 08 00178 g003
Figure 4. Input data for the model, (a) land use/land cover and (b) soil texture.
Hydrology 08 00178 g004
Figure 5. (a) Long-term average annual rainfall (2000–2019) and (b) long-term average monthly rainfall and potential evapotranspiration (2000–2019).
Hydrology 08 00178 g005
Figure 6. Spatial distribution of long-term annual (a) rainfall and (b) groundwater depth.
Hydrology 08 00178 g006
Figure 7. Long-term monthly temperature data.
Hydrology 08 00178 g007
Figure 8. The linear relationship between simulated and observed groundwater recharge.
Hydrology 08 00178 g008
Figure 9. Long-term simulated evapotranspiration (a) annual and (b) monthly.
Hydrology 08 00178 g009
Figure 10. Long-term simulated distribution of average annual (a) runoff and (b) interception.
Hydrology 08 00178 g010
Figure 11. Long-term annual, seasonal, and monthly distribution of simulated groundwater recharge, (a) annual, (b) monthly, (c) spring, (d) summer, (e) autumn, and (f) winter.
Hydrology 08 00178 g011aHydrology 08 00178 g011b
Figure 12. Variation of average annual water balance components for different land-use types.
Hydrology 08 00178 g012
Figure 13. Average annual water balance components as a function of soil textures.
Hydrology 08 00178 g013
Table 1. Input parameters and source for WetSpass-M model.
IDInput ParametersSourceResolution
1RainfallPakistan Meteorological Department and own processing100 × 100 m
2ETPakistan Meteorological Department and own processing100 × 100 m
3Wind speedPakistan Meteorological Department and own processing100 × 100 m
4TemperaturePakistan Meteorological Department and own processing100 × 100 m
5DEM and Slophttps://earthexplorer.usgs.gov/, (accessed on 15 November 2021) [31] and own processing and own Processing100 × 100 m
6LULC mapshttps://lpdaac.usgs.gov/datasetdiscovery/modis/modisproductstable/mcd12q1, (accessed on 15 November 2021) [32] and own processing100 × 100 m
7Soil textureFAO soil maps and own processing100 × 100 m
8Groundwater depthPunjab Irrigation Department and own processing100 × 100 m
9Soil lookup tablesWetSpass-M Model100 × 100 m
10LULC lookup tablesWetSpass-M Model
11Runoff lookup tablesWetSpass-M Model
Table 2. Long-term annual, seasonal, and monthly simulated water balance components of the Khadir canal sub-division (2000–2019).
PeriodWater Balance Components (mm)MINMAXRANGEMEANSTD
AnnualRainfall424.0479.555.5455.710.7
Evapotranspiration134.4287.2152.823117.9
Runoff37.2192.2155.0109.112.9
Recharge99.1218.5119.4115.69.0
SummerRainfall236.7262.025.3251.04.9
Evapotranspiration68.5141.573.0114.58.5
Runoff32.5135.7103.283.78.3
Recharge44.1105.661.452.84.5
AutumnRainfall65.482.016.573.23.7
Evapotranspiration22.453.731.341.34.2
Runoff2.426.724.311.22.5
Recharge17.439.822.420.71.9
WinterRainfall41.846.24.444.00.9
Evapotranspiration18.136.718.628.81.9
Runoff0.410.710.44.70.9
Recharge7.122.615.510.51.3
SpringRainfall79.693.213.787.32.7
Evapotranspiration22.360.838.547.44.5
Runoff1.224.823.68.92.2
Recharge25.653.928.4312.5
MonthlyRainfall35.940.54.638.50.9
Evapotranspiration11.223.912.719.41.5
Runoff3.116.012.99.31.1
Recharge8.318.210.09.80.8
Publisher’s Note: MDPI stays neutral with regard to jurisdictional claims in published maps and institutional affiliations.

