Abstract
The diminishing spring discharge in the Middle Mountain Zone (MMZ) in Nepal is a matter of concern because it directly affects the livelihoods of low-income farmers in the region. Therefore, understanding the impacts of changes in climate and land-use patterns on water demand and availability is crucial. We investigated the impact of climate change on streamflow and environmental flow, and the demand for spring-fed river water for irrigation using the limited meteorological data available for the Babai River Basin, Nepal. SWAT and CROPWAT8.0 were used to respectively calculate present and future streamflow and irrigation water demand. Three general circulation models under two representative concentration pathways (RCPs 4.5 and 8.5) for the periods of 2020–2044, 2045–2069, and 2070–2099 were used to investigate the impact of climate change. Results indicate that the catchment is likely to experience an increase in rainfall and temperature in the future. The impact of the increment in rainfall and rise in temperature are replicated in the annual river flow that is anticipated to increase by 24–37%, to the historical data of 1991–2014. Despite this increase, projections show that the Babai River Basin will remain a water deficit basin from January to May in future decades.
1. Introduction
Climate has been changing continuously over millennia. It passes through several cool and warm periods and each lasts for thousands of years. In the past 100 years, the earth’s temperature has risen by more than 1 °F. This may not seem like much of an increase, but the impact of this small change is still very significant. This is why climate change is a matter of great concern to several stakeholders inside and outside academia. Research organizations such as IPCC, EPA, USGCRP, NOAA, etc., lead the study on climate change. The one prominent conclusion all these organizations have arrived at is that the carbon content in the atmosphere is steadily increasing and it is due to anthropogenic activities. Climate change has also modified the hydrological cycle, negatively impacted water quality, and caused changes in land-use practices around the globe. Climate change is a global phenomenon, but its impact mostly occurs on local or regional scales. Climate change is expected to alter temperature and precipitation patterns all around the world, and these alterations will affect river discharge, seasonal and local water availability, and water supply [1]. In Asia, the average temperature is expected to rise by 1.8–3.9 °C and precipitation by 1–12% by the end of the century [2].
The climate in Nepal varies widely even over the relatively short span from the Terai in the south to the high Himalayas in the north. The Terai region has a subtropical climate whereas it is extremely cold in the high Himalayas. This is due to the topographic fluctuation from the south (60 m) to the north (8848 m). Annual rainfall varies from 150 mm to 5000 mm in the country. The mean annual rainfall in Nepal is around 1600 mm. Around 79% of the total rainfall occurs during the monsoon season [1,3]. The month of July receives the highest amount of rainfall and November the least.
Climate change studies conducted in Nepal suggest that temperature is likely to increase continuously throughout the twenty-first century as is the frequency of winter droughts [4,5]. Monsoonal rainfall over the Indian sub-continent is predicted to become more intense under global warming [6]. With increasing temperatures and precipitation, the probability of an increase in river discharge and flooding is to be expected during the wet season. On the other hand, there are indications of climatic drying during the winters in the lower Middle Mountain Zone (MMZ) of northwest India and Sikkim [7]. Thus, whether in the region is likely to become more variable and prone to extremes [3]. Such events will change water availability in rivers, especially during the winter and spring seasons. Therefore, it is very important to understand the impact of climate change on hydrology at the basin scale [4,8,9].
The rivers in the most densely populated part—the MMZ or Lesser Himalayas—are mostly rain-fed [9] while springs constitute the prime water sources for most headwater communities [8]. Increasing climatic variability, namely increasing frequency of prolonged winter drought and torrential rainfall along with anthropogenic activities, has disrupted the regular flow of water in springs in the MMZ. Yet, very few studies have been conducted on the spring-based river systems originating in this region. Thus, the hydrological consequences of these phenomena are almost entirely unknown [10,11].
A general circulation model (GCM) is the mathematical representation of the planetary atmosphere of the earth which can be used to predict future climate scenarios. An ensemble of GCMs can provide better information than a single one [12]. The spatial resolution of a GCM is very large and may not be compatible with hydrological models (sensitive to regional or local variations). Hence, various downscaling methods are used. Representative concentration pathways (RCPs) indicate possible future emission scenarios. RCPs have been developed by the Coupled Model Inter-comparison Project Phase 5 (CMIP5) and are considered a sound approach for developing mitigation plans and also for analyzing the impacts of climate change.
The soil water assessment tool (SWAT) model is useful to analyze the effects of hydro-climatic-land cover changes on hydrological processes at watershed scale [13]. Use of SWAT has become widespread because of its ability to predict the impacts of climate change and land cover change on water availability, and to assess a watershed’s response to annual water balance under climate change and land cover changes. SWAT is also able to use temporal runoff dynamics to predict streamflow, which often compares favorably with the measured data for a variety of watersheds [6]. All such studies have shown varied results due to the different regions considered and have employed different methodologies to construct climate change scenarios and study their impacts on hydrological responses. Most of these studies conclude that SWAT is suitable for long-term (monthly, seasonal, and yearly) simulations [14].
CROPWAT 8.0, a software developed by the land and water development division of the Food and Agricultural Organization (FAO), is a well-received model. It is used to estimate water requirements in croplands. In this study, we also assessed environmental flow (EF). In Nepal, for most cases, around 10% of the base flow of a river is considered to be the environmental flow, which cannot address the environmental water demand. In this study, the environmental flow calculator (EFC), developed by the International Water Management Institute (IWMI), was used to fix the quantity of EF in the study area [15]. EFC is a software for the rapid assessment of EFs. EFC uses monthly time series natural or unregulated flow conditions and gives the corresponding EFs as per the selected environmental management class (EMC) [15].
This study area here is the Babai River Basin (BRB), a river system originating from the MMZ in western Nepal. The highlights of this study include: (1) projecting future climatic (temperatures and rainfall) using three GCMs and using that projected climate to estimate future streamflow in the Babai river from the calibrated model; (2) predicting irrigation water demand (IWD) in the BRB and the EF of the Babai River under current and future climate conditions; and (3) analyzing water management in the BRB under current and future climate conditions. The study results will be helpful for managing irrigation water supply and demand in the Babai Basin and western part of Nepal. Three future periods 2020–2044 (2030s), 2045–2069 (2060s), and 2070–2099 (2080s) under two emission scenarios, RCP 4.5, and RCP 8.5 in the study. As of now, it appears that no research studies have been conducted in the BRB that are related to the assessment of the impacts of climate change on streamflow and IWD. Furthermore, most of the research conducted in this area focuses only on mountainous rivers. On the other hand, the findings of this study may be useful for other spring-fed river basins and irrigation projects whose climatic and topographic characteristics are similar to the BRB.
2. Data and Method
2.1. Study Area
The Babai River Basin (BRB) lies in the western part of Nepal (Figure 1a). The area of this basin is around 3250 km2. It lies within 81°14′ E to 82°38′ E longitude and 27°56′ N to 28°32′ N latitude. The Babai River is a tributary of the Karnali River (the third biggest river of Nepal). The BRB lies partially in the Middle Mountainous Zone (MMZ). The elevation of the basin extends between 147 to 2880 m from the mean sea level. It lies in a subtropical region. The average annual rainfall in the basin, based on data from 1975 to 2005 observed at seven climatological stations, is 1468 mm. About 83% of the total rainfall occurs from June to September. The only hydrological station in the Babai River is located at Chepang and has a catchment area of 2570 km2. The annual mean flow at Chepang is 86 m3/s. The maximum runoff at this station is 257 m3/s, which occurs in August, and the minimum runoff is 9.9 m3/s, which occurs in April. From the Chepang station, the river passes through the Bardiya National Park and exits in the plains in Bardaghat. The headwork of the Babai Irrigation Project (BIP) is located in Bardaghat. The average maximum and minimum temperatures of the area are 31 and 18 °C, as observed at the Rani Jaruwa station. The average annual rainfall in the BIP area is around 1130 mm whereas the basin’s average rainfall is 1468 mm. The basin is dominated by forest (36.2%), followed by agricultural land (28.9%), and the smallest portion is occupied by built-up area (2.2%). The geographical and basic information about the meteorological and hydrological stations is presented in Figure 1 and Table 1.
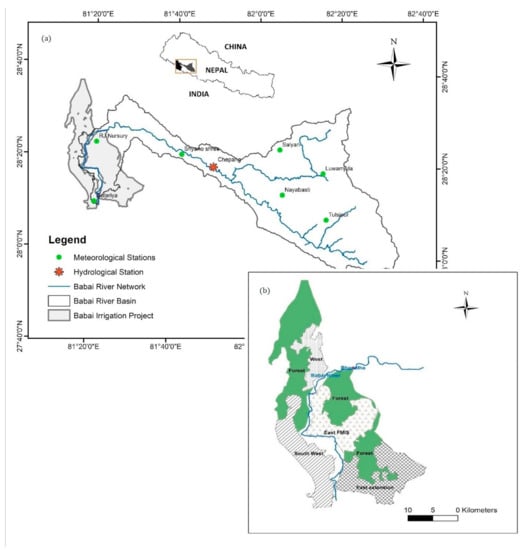
Figure 1.
(a) Location of the Babai River Basin with its hydrological and meteorological stations (top) (b) Babai Irrigation Project (bottom).

Table 1.
Basic information about the hydro-climatic stations in the Babai River Basin.
2.2. Data Sources
2.2.1. Digital Elevation Model
The digital elevation model’s (DEM) data were used to generate the river network and delineate watershed boundaries in the study area. The 30 m resolution SRTM DEM data was obtained from the United State Geological Survey (USGS) (https://lta.cr.usgs.gov/SRTM1Arc; accessed on 13 May 2021).
2.2.2. Soil and Land Cover Data
Soil data and all the required information related to soil properties were obtained from the soil and terrain database (SOTER http://www.isric.org/data/soil-and-terrain-database-Nepal; accessed on 13 May 2021). A 30 m resolution land-use map was obtained from the International Centre of Integrated Mountain Development (ICIMOD). The map was developed in 2010 using Landsat imagery [16]. Figure 2 shows the soil types and land-use types in the Babai River Basin.
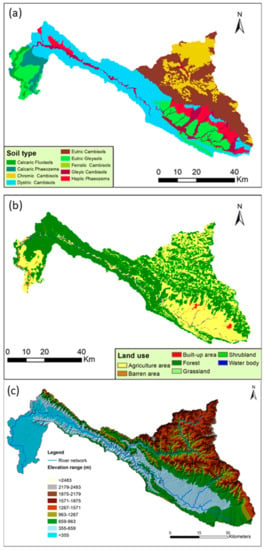
Figure 2.
Soil type (a), land-use type (b) and elevation (c) maps of the Babai River Basin.
2.2.3. Streamflow and Meteorological Data
Streamflow and meteorological data were obtained from the Department of Hydrology and Meteorology (DHM), Nepal. There is only one hydrological station in the Babai River at Chepang. This station was established in 1989 and has daily data from 1990 to the present. The historical data presented in supplementary Table S1. Out of the seven meteorological stations in the study area, three stations measure the daily minimum and maximum temperature and all seven stations measure daily rainfall data. This data is available since 1970. As daily sunshine hours, humidity, and wind speed are not measured by any stations in the BRB, these data were taken from the nearby Nepalgunj stations which have climatic conditions similar to the BRB.
2.2.4. Global Climate Model Data
The future climate change scenarios for the Babai Basin were developed using three GCMs and two RCPs. Table 2 presents the details of the climate models used in the study.

Table 2.
Details of the climate models used to project climate change scenarios.
2.2.5. Cropping Patterns
The current and future cropping patterns under the BIP area were collected by the first author for the period of May 2018 to July 2019. Cropping intensity (was calculated through a questionnaire survey of the farmers from the command area. The BIP is now carrying out its command area development work and they aim to provide year-round irrigation by 2022 to the entire area under the project. The project plans to achieve a cropping intensity of around 250% (from the current 150%) after completing the command area development work. Table 3 shows current and anticipated cropping areas under the BIP’s scheme. The whole area is divided into four cropping regions and each season has different cropping intensities. Table 3 depicts the present and anticipated cropping patterns of the BIP.

Table 3.
Crop area under the current and future conditions in the Babai Irrigation Project (all areas in hectares).
2.3. Methods
2.3.1. Bias Correction of RCP Scenario Data
Because of its coarse resolution, GCM data needs to be downscaled to fit the required spatial resolution before using it in the SWAT model. In this study, the Linear Scale Factor (LSF) approach under the statistical downscaling method was used. This method has been used for many basins [17]. In the LSF method, the monthly averages of observed and simulated values of the constituent are used to compare the results before and after bias correction in all the stations. In this study, the data downscaled from that GCM were compared with the observed data of the baseline period (1975 to 2005), and the best-fitting three GCMs were selected. Different descriptive statistics such as R2, RMSE (root mean square error), standard deviation, and mean were used to check the suitability of the climate models. The variables’ values, with and without bias correction, were compared against observed data. The enhancement of each parameter (increased R2, decreased RMSE, and closer to mean and standard deviation to the observed value) is one major criterion in selecting a GCM [18].
2.3.2. SWAT Model Setup, Calibration, and Validation
The SWAT model is a spatially semi-distributed, physically-based, continuous hydrological model developed by the United States Department of Agriculture (USDA) and Texas A&M University [13]. The model can be used to study hydro-climatic-land cover changes by modifying the input parameters. In the SWAT model, a basin is divided into various sub-basins, which are then further divided into hydrologic response units (HRUs) that comprise unique land use, slope, and soil characteristics. The initial simulation of the hydrological cycle occurs at the HRU level, and excess discharge is then aggregated across HRUs [19]. All other input parameters remained static except hydro-climatic and land cover/use parameters. A major focus of this study is to quantify the impact of climate change in historical streamflow. For this, a model was fitted using time series land climatic parameters along with other static input variables. The impact of climatic variation was quantified by simulating the model for different scenarios of climatic variables. This allowed us to understand the impact of land cover changes and land climate changes on water availability since 1980. The same model was employed to estimate water availability under different RCP conditions.
SWAT Model was developed in Arc SWAT 2012 in the ArcGIS 10.1 platform. The basin area was delineated into 24 sub-basin which were divided into 243 HRU with a 10% threshold for slope, soil type, and land use. During sensitivity analysis, PLAPS and TLAPS are also considered. Orographic effect was reduced by considering the 500 m range elevation band in each sub-basin. The Penman–Monteith method was used to compute the potential evapotranspiration. Calibration and validation periods from 2003 to 2010 and 2013 to 2014, respectively. A warm-up period from 2000 to 2003 was used.
The performance of the SWAT model is evaluated using the coefficient of determination (R2), Nash–Sutcliffe efficiency index (NSE), and relative bias (Bias), which are calculated as follows [20]:
where is the ith observation for the parameter being evaluated, is the ith simulated value for the parameter being evaluated, Kmean is the mean of observed data for the parameter being evaluated, and n is the total number of observations.
A model’s simulation performance can be considered satisfactory at NSE greater than 0.5, Bias within ±25%, and R2 greater than 0.6 [20].
The sensitivity analysis of model parameters, calibration, and validation were performed with SWAT-CUP tools (http://swat.tamu.edu/software/swat-cup/; accessed on 13 May 2021) using the sequential uncertainty fitting algorithm (SUFI-2). Initially, 29 general parameters [19] were used to run 1000 simulations and 11 most sensitive parameters were recognized for calibrate and validate of the model. These 29 general parameters and 11 most sensitive parameters are presented in Table S2 in the supplementary material.
2.3.3. CROPWAT Model
CROPWAT 8.0, developed by the Land and Water development division of the FAO, is a decision support tool. Based on soil, climate, and crop data, this tool computes crop water requirements (CWR) and irrigation requirements. It has been used extensively across the globe to calculate regional crop irrigation requirements [21]. The major input parameters for this model are reference evapotranspiration (ETo), monthly rainfall, wind speed, monthly mean of maximum and minimum temperatures, relative humidity, sunshine hours, crop coefficient (Kc), seepage loss, and water allowance for land preparation.
2.3.4. Environmental Flow Calculator (EFC)
EFC has been developed by IWMI for the rapid assessment of environmental flows. It uses monthly time series data of natural or unregulated flow conditions and gives EFs as per the selected Environmental Management class (EMC) [15]. There are six EMCs, ranging from minor to critically modifying the natural flow. In minor form, natural rivers with minor modification of in streams and riparian habitat whereas, in critically modified form, modifications have reached a critical level and ecosystems have been completely modified with almost total loss of natural habitat and biota. A suitable EMC is selected by experts by considering the natural environment and the development patterns of the area. In this study, we carried out a detailed analysis of water surplus/deficit with EMC classes C and A. Class A is an ideal condition while class C is a balance of environment and development conditions. EMC C was selected based on discussions with the professional environmental sector of Nepal. In this category, the habitats and dynamics of the biota have been disturbed, but the basic ecosystem functions are still intact. Some sensitive species are lost and/or reduced to some extent.
3. Results and Discussion
3.1. Calibration and Validation of the Model
The SWAT model was calibrated on a monthly time scale using SUFI-2 within SWAT-CUP. Initially, 21 parameters were selected from the literature [19]. During calibration, the overall effect of each parameter used was ranked using the global sensitivity function within SWAT-CUP. From the analysis, it was concluded that the top three sensitive parameters to simulate streamflow in the Babai River watershed are initial SCS CN II value (CN2), base flow alpha-factor (ALPHA_BF), and GWQMN.gw. The calibration was conducted using monthly data from 2003 to 2010, and the results show a good correlation between observed and simulated values with NS = 0.88, R2 = 0.89, and PBIAS = +14.5%. The validation of the model was carried out without changing the parameters during the calibration process. There were several missing or recorded mismatches in the observed data in the years 2011 and 2012 in one hydrological station of the BRB, so these two years were removed, and validation was performed using the data from 2013 and 2014. For the validation period, the values of NSE = 0.92, R2 = 0.93, and PBIAS = +10.9% were obtained. Graphical representations of calibration and validation are shown in Figure 3. As per Moriasi et al. [20], the results obtained for calibration and validation in the present study lie within the very good category.
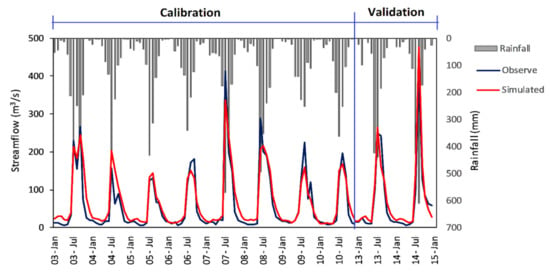
Figure 3.
Comparison of observed and simulated streamflow data at the Chepang station.
3.2. Water Budget during the Calibration and Validation Periods
To see water balance during the calibration and validation periods, the model was re-run for the years 2003–2014 by using calibrated parameters, and the water balance study was carried out with the help of corresponding SWAT output tables. As can be seen in Table 4, which shows the water budget reported by SWAT, the model maintains mass balance and it can honor continuity.

Table 4.
Average annual basin values of water balance components in the Babai River Basin during the calibration and validation periods (2003 to 2014).
3.3. Climate Change Scenario Generation
Future temperature and rainfall of the BRB were obtained by the ensemble of downscaled and bias-corrected data from the selected GCMs. Table 5 shows the changes in maximum and minimum temperature at the three stations—Tulsipur, Salyan, and R J Nursery—under RCP 4.5 and 8.5 in near, middle, and far future periods. Under RCP 4.5, the change in average annual maximum temperature at the Tulsipur station in the 2030s, 2060s, and 2080s is around 1.45, 2.27, and 2.93 °C respectively. Similarly, under RCP 8.5, the change in average annual maximum temperature at the Tulsipur station in the 2030s, 2060s, and 2080s is around 1.51, 2.99, and 4.66 °C respectively. However, the change in minimum temperature at this station under RCP 4.5 in the 2030s, 2060s, and 2080s is around 2.06, 2.84, and 3.27 °C respectively. The minimum temperature under RCP 8.5 for the same station in the 2030s, 2060s, and 2080s is around 2.25, 3.81, and 5.42 °C respectively. The changes in annual average temperature in the other two stations are also similar under both scenarios. This indicates that temperature under RCP 8.5 is higher than under 4.5 by more than 1.5°C at the end of the century. Past research conducted by Mishra et al. at the Bheri [1] and Koshi rivers [22] also showed that temperature in the mountainous areas of Nepal will increase by around 4 degrees in the future. The results of the current study also indicate that the rate of increment of minimum temperature is one degree more than that of maximum temperature.

Table 5.
Variations in annual Tmax and Tmin at different stations relative to the baseline period (1975–2005).
The temperature in the future also varies from month to month. Figure 4 shows the monthly variations in minimum and maximum temperatures at the Salyan station under RCP 4.5 in the 2030s, 2060s, and 2080s. The figure indicates that changes in maximum temperature lie within a wider range than does minimum temperature over a year. Under RCP 8.5_60s, maximum temperature varies from 2.29 °C to 4.57 °C in twelve months but the minimum temperature varies from 3.86 °C to 5.09 °C. We can see similar patterns in other periods and RCPs as well.
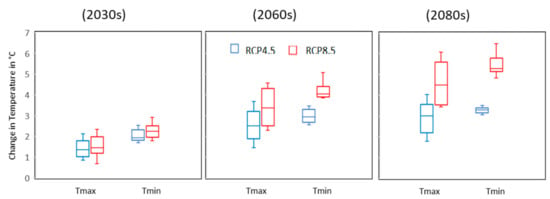
Figure 4.
Relative changes in monthly mean maximum and minimum temperatures at the Salyan Scheme 1975.
A comparison between observed and predicted monthly rainfall in the BRB is presented in Figure 5. Average basin rainfall was calculated using the Thiessen polygon method. Observed data from 7 stations were used to determine average rainfall in the basin. Predicted rainfall at the same stations was used to determine average basin rainfall. The results show a similar pattern between average and predicted periods. The maximum rainfall occurs in July in both, the observed and predicted periods. Additionally, the maximum increment in rainfall also attains its highest value in July. This value is around 440 mm in the baseline period, and it reaches 520 mm in the 2080s under RCP 8.5.
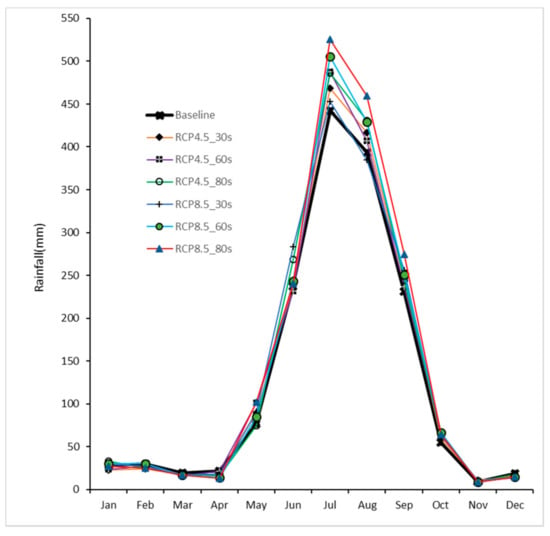
Figure 5.
Comparison of monthly rainfall between observed (1975–2005) and projected climate using the ensemble of three GCMs.
The results show that the rainfall values are similar between the observed and predicted periods from January to April; however, rainfall is predicted to decrease slightly in November and December in the future, as compared to the baseline data. The effect of this reduction will be negligible on streamflow as the value will lie between 1 to 8 mm. If we check the overall change in annual rainfall, future annual rainfall will increase by 15% to 25% as compared to the baseline; maximum increments will be attained under RCP 8.5 in the 2080s and minimum increments under RCP 4.5 in the 2030s.
3.4. Climate Change Impact on Streamflow
The streamflow obtained from the calibrated SWAT model is shown in Figure 6. The predicted streamflow under RCP 4.5 and 8.5 for the near, middle, and far future also presented in the supplementary Tables S3–S5. As can be seen, the consequences of the rise in temperature and increase in rainfall are reflected in future streamflow. The ensemble of three GCMs shows that streamflow could increase by around 24% in the 2030s and 2060s and by 27% in the 2080s under RCP 4.5 and by 28% in the 2030s, 32% in the 2060s, and 37% in the 2080s under RCP 8.5 as compared to the baseline flow (from 1991 to 2014). The pattern of flow is quite similar to the baseline period flow of the river. The increment in streamflow is maximum under RCP 8.5—2080s in August when streamflow will rise by 36.4 m3/s, which corresponds to around 20% more flow than obtained in August in the baseline period. In terms of percentage, streamflow is predicted to increase the most in November under RCP 8.5—2080s, with an increase of almost 125% as compared to the baseline flow of the same month. The increase equals 30.5 m3/s.
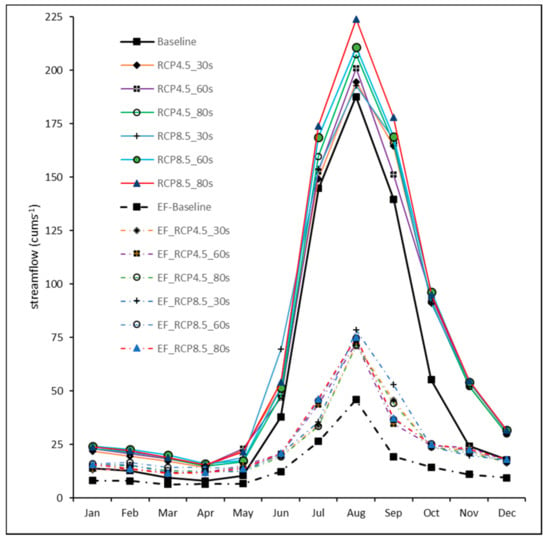
Figure 6.
Comparison of monthly mean streamflow between the observed (1991–2014) and the projected values by the ensemble of three GCMs and the corresponding environmental flow under current and future climate conditions.
Figure 7 shows the comparison between the flow duration curve during the baseline period (1991–2014) and the three future periods (the 2030s, 60s, and 80s) under RCP 4.5 and RCP 8.5 at the Chepang Station. Under both scenarios, the probability of the occurrence of flow and the magnitude of flow could be higher in the Babai River Basin.
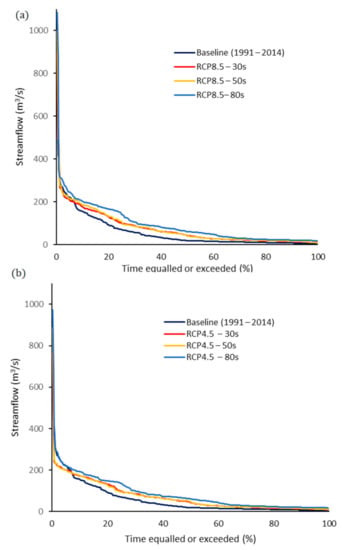
Figure 7.
Flow duration curve under (a) RCP 4.5 and (b) RCP 8.5 scenarios at the Chepang Station.
3.5. Irrigation Water Demand in the Babai River Basin
Figure 1b shows the four different irrigation regions of the Babai Irrigation Project. The current IWD has been computed for the present cropping intensity of 170% in the total irrigated area. It includes 35,200 ha rice, 8091 ha wheat, 6955 ha maize, 2966 ha winter vegetables, and 2124 ha pulses. We considered the scheme efficiency to be at 30% and 40%. The IWD calculation for the near future (2020 to 2044) was carried out to maintain a cropping intensity of around 250% (as per the target of the BIP by 2022) in the total area with 35,200 ha rice, 24,000 ha wheat, 22,600 ha maize, 5066 ha winter vegetables, and 3800 ha pulses.
The consequences of all these inputs reflect in the irrigation water demand. Based on a cropping intensity of 170% and 250% under RCPs 4.5 and 8.5 with scheme efficiency of 30% and 40%, a total of ten sub-scenarios were developed. The IWD for twelve months for each sub-scenario is presented in Table 6. The results were arrived at by summing up all the demand from the four irrigation regions. The calculated water demand in the BIP shows that maximum water is required in July because almost all the cropping area is occupied by rice cultivation this month. Under cropping intensity 170% and scheme efficiency 40%, the IWD in July is 130.01 Mm3 but this value could decrease in the future. Under RCP 8.5_30s, this value reaches 72.99 Mm3. This is because the cropping area in July in the future is assumed to remain the same as the present but rainfall will increase. CROPWAT8.0 shows that ETo will also increase in July, but the increase of rainfall is more than ETo, so the IWD will decrease in the future. We see a similar scenario in October, November, and December as well. Effective rainfall is higher than crop water requirement in August, so the IWD in August is zero. This pattern is projected to continue in the future also. Under the current situation (CI-170%), from January to June, nearly 60% area is fallow land under BIP. With CI 250%, nearly 80% area will be covered by crop. Under such conditions, the IWD will increase significantly. Among the ten sub-scenarios, the IWD varies between 13 to 50 Mm3 in January, 24 to 91 Mm3 in February, 9 to 46 Mm3 in March, 15 to 101 Mm3 in April, 18 to 124 Mm3 in May, and 3 to 21 Mm3 in June. The details of water demand in all the sub-scenarios can be seen in Table 6. By considering the current CI for the future, the IWD under climate change scenarios will decrease under both RCPs and all months except February, September, and October (Table 6). Only in September will the IWD increase by around 40%; during the other eleven months, it will decrease by a small amount. This is because rainfall will increase and CWR is fulfilled by rainfall, which implies that a lesser volume of irrigation water will nevertheless be enough.

Table 6.
The IWD in the Babai River Basin under different sub-scenarios (in Mm3).
3.6. Environment Flow
Long-term EF volume, which is expressed as a percentage of the natural Mean Annual Runoff (MAR) under the different scenarios of the Babai River at the Chepang Station, is shown in Table 7. For EMC class A, more than 70% water volume of MAR is required for EF. This value is in decreasing order with EMC classes B to F. Around 20% volume of MAR is required for EMC class F under all scenarios.

Table 7.
Estimate of long-term EF volume of the Babai River at the Chepang Station for different EMC classes and scenarios.
However, to calculate excess/deficit water, only two EMC classes (A and C) were considered. The environmental flows of the Babai River under the current conditions and different climate change conditions for EMC class C are shown in Figure 6. The obtained EF is similar in pattern to natural river flow. More water will be required for environmental management during the summer season and less during the dry season in the future. However, in percentages, this value seems different. Under the current conditions, 45 m3/s flow is required in August and 6 m3/s flow in April as the EF is around 24% and 81% of natural streamflow respectively. The variations in EF as a fraction of natural flow are also not uniform in the future. EF varies from 20–88% of a natural flow. Under RCP 4.5—30s, EF varies from 11 to 74%, and under RCP 8.5—60s, its value varies from 13 to 78% of predicted natural flow.
3.7. Water Deficit and Surplus Scenario
Figure 8 shows the excess/deficit water in the Babai River under current and future climate change conditions. In this case, climate change conditions were considered only from 2020 through 2044. The required water was calculated by considering irrigation water demand and environmental flow. Twenty sub-scenarios were developed for water deficit analysis and surplus based on RCPs, future time, irrigation efficiency, cropping patterns, and environment flow. The total water demand was calculated by summing up the water requirements for environmental flow and irrigation water demands by using run-of-the-river type diversions.
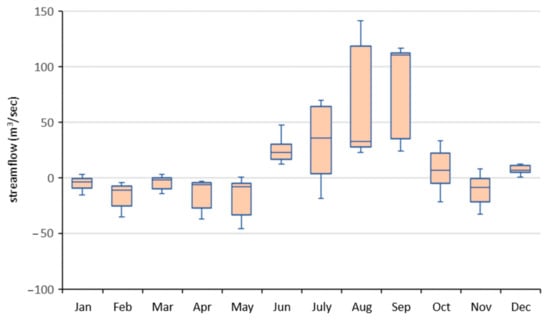
Figure 8.
Excess/deficit water in the Babai River Basin under different sub-scenarios.
Figure 8 was generated by using monthly data of the twenty sub-scenarios. All scenarios predict that, under EMC category A, water could be a deficit for five months a year: from January to May. Considering a CI of 250% with irrigation efficiency of 40% and EMC class C, the highest deficit is in May, followed by April, February, March, and January. In May, the water deficit is around 46 m3/s and 44 m3/s under RCP 8.5 and RCP 4.5 in the 2030s. For a cropping intensity of 170% (current conditions) with 40% efficiency and EMC class C, water is surplus for only six months of the year, from June to October and in December. Water shortage is likely in the remaining six months. However, the shortage quantity varies from month to month. The water balance breaks even in January and March.
The IWD in the future will increase due to increasing CI and ETo. All models predict that ETo may increase in the study area in the future. Simulation results show that the flow in the source river could also increase. However, the increment in water demand is more than the increment in water in the source river, so there will be more water deficit in the future. Some past studies in the Babai Basin also agree that while water is sufficient in the present condition, there will be a shortage in the future if CI is 250% [15,23]. It can be concluded that under all sub-scenarios for EMC class A and CI either 170% or 250%, water supply will be insufficient in the Babai River Basin from January to May, and for EMC class C, it will also be insufficient for February, April, and May. For CI 250%, the water deficit will be experienced in seven months, from November to May.
3.8. Discussion and Summary
Springs constitute the chief source of freshwater for rural headwater communities across the densely populated Middle Mountain Zone (MMZ) of the Himalayas in Nepal. In recent years, spring discharges have diminished because of climate change along with other anthropogenic activities. Changes in water availability impact the livelihoods of upstream-downstream communities. Activities like agriculture, one of the major livelihood options in the region, are most likely to be negatively impacted. The Babai River Basin is crucial from the perspective of agricultural production in Nepal. The fertile land in the plains of the Babai Basin is called the food basket of the country. The Babai Irrigation Project, one of the oldest irrigation systems in the country, is a big investment for the country. The sustainability of this irrigation system directly affects the economic conditions of about ninety thousand households that live in this part of Nepal.
The study shows that the Babai Basin will be a water deficit for six months in a year in the future, which will adversely affect crop productivity, and consequently the livelihoods of local farmers. A scientific study carried out in 2008 showed that the Babai Basin has a water deficit for five months at the time of the study [23]. However, that study did not consider the impacts of climate change in the basin and environmental flow in the river.
The present study was carried out by taking into consideration two RCPs, 4.5 and 8.5, and three GCMs whose values were used in the calibrated and validated SWAT model to predict future discharge. The values of NS = 0.88 and 0.92, R2 = 0.89 and 0.93, and PBIAS = +14.5% and +10.9% for calibration and validation periods indicate that the model can be used reliably to predict streamflow for the future. As shown in Table 4, the model maintains mass balance and honors the continuity equation.
The consequences of the rise in temperature and rainfall reflect in the streamflow. The ensemble of three GCMs shows that the streamflow in the Babai River could increase by 24 to 27% under RCP 4.5 and 28 to 37% under RCP 8.5, as compared to the baseline flow (1991 to 2014). The increase in the streamflow is maximum under RCP 8.5—2080s in August when the streamflow will rise by 36.4 m3/s (or about 20% more than what was obtained in August in the baseline period). The summary of the predicted discharge presented in the supplementary Table S6. The Student’s t-test has been applied to confirm the differences of the six predicted discharges for three GCM and their two scenarios. The majority of the predicted dataset in different scenarios and different durations are significantly different (p-value < 0.05). Therefore, the results are worthwhile to go for further analysis. As the environmental flow is a function of predicted discharges, provided that all other variables are the same in all scenarios, we believe that a separate test is not necessary. The test results are available in the supplementary materials Table S7.
The water balance in the basin was calculated by considering the IWD and EF as output and the streamflow as input. Other water demands like industrial and domestic usage are negligible. Considering the present climatic conditions, with 170% cropping intensity and the corresponding EF (class C) of the river, water deficit is experienced for five months and the maximum deficit is in May, by 74 Mm3. Water shortage is likely to intensify in the future under both RCPs if cropping intensity increases to 250%, as planned. In such a case, water will become scarcer for six months with a maximum deficit of 119 Mm3 in May. Another notable result is that if the cropping intensity remains the same and only the climate change scenarios are considered, the future water demand is likely to decrease. Nevertheless, the water available in the river will not be able to meet these demands. Water shortage will increase if category A is taken for EF. Overall, for all sub-scenarios with EMC classes A and C and cropping intensity either at 170% or 250%, water is (and will be) insufficient from January to May, both in the present and in the future.
The uncertainties inherent in different sources can be considered as a limitation of the study. The chosen GCMs, downscaling methods, RCP scenarios could all be major sources of uncertainties. Land-use patterns and soil properties in the study area were also considered static throughout the study period, which may be another limitation of the study. RCM data may give more reliable results than GCM data. Therefore, we recommend doing further research keeping in mind these considerations.
4. Conclusions
The impacts of climate change on water demand and availability were analyzed in the BRB. The major findings can be summarized as follows:
- (a)
- The SWAT model was calibrated and validated for the Babai River Basin. For monthly calibration, the model performed well with R2 at 0.89 and NSE at 0.88 and +14.5% for PBIAS in the calibration period and R2 at 0.93 and NSE at 0.92, and PBIAS +10.9% for the validation period.
- (b)
- The pattern of future rainfall is similar to the baseline period but an increment is predicted. Future annual rainfall is expected to increase by 15% to 25% as compared to the baseline period. The maximum increment is under RCP 8.5 in the 2080s and the minimum increment is under RCP 4.5 in the 2030s. The minimum and maximum temperatures also increase in the future by around 2 to 4.5 °C, as compared to the baseline period.
- (c)
- The consequences of increased rainfall and temperature reflect in the streamflow. It can be predicted that annual streamflow will rise by 24–27% under RCP 4.5 and 28–37% under RCP 8.5, while monthly increments can go up to 75% in February. As per the flow duration curve, the probability of occurrence of flow and magnitude of flow could be higher in the future than in the baseline period under both scenarios.
- (d)
- EF was calculated corresponding to EMC and the results show that EF varies from 20 to 88% of the natural flow.
- (e)
- Demand for water in the Babai River Basin will increase in the future due to changing cropping patterns. Although rainfall is predicted to increase in the future, this incremental rainfall will not be sufficient to meet the increasing demand. Under current conditions, water deficit is seen in six months and the maximum water deficit is in November (around 33.07 m3/s). The water balance breaks even in January and March. Under the CC condition of the present CI, the IWD will decrease. However, as per the BIP, cropping intensity is to increase to 250%, and under all scenarios, water could be scarcer for five months of the year: from January to May. The maximum shortage is expected in May, followed by April, February, March, and January. Hence, all these results indicate that the water available in the Babai River is not sufficient now and will not be in the future to supply to the year-round irrigation system and sustain a fresh ecosystem. Alternative sources of water are essential and must be deployed at the earliest. Until managing the alternative sources of water, we recommend cultivating less water-demand crops such as wheat and maize instead of rice and sugarcane.
Supplementary Materials
The following are available online at https://www.mdpi.com/article/10.3390/hydrology8020085/s1, Table S1: River flow (Q, m3/s) at Chepang Station (ID: 270); Table S2: Callibrated parameter in SWAT; Table S3: Predicted daily discharge for 2020–2044; Table S4: Predicted daily discharge for 2045–2069; Table S5: Predicted daily discharge for 2070–2099; Table S6: Summary of predicted discharge; Table S7: The summary of the p-value of the T-test is shown in tables below.
Author Contributions
Conceptualization, Y.M.; methodology, Y.M., B.M., M.S.B. and T.N.; validation, Y.M. and B.M.; formal analysis, Y.M. and B.M.; investigation, Y.M.; resources, Y.M. and B.M.; data curation, Y.M., and B.M.; writing—original draft preparation, Y.M. and B.M.; writing—review and editing, Y.M., B.M., M.S.B., and T.N.; supervision, M.S.B., and T.N. All authors have read and agreed to the published version of the manuscript.
Funding
This research received no external funding.
Acknowledgments
We are thankful to the Department of Hydrology and Meteorology Nepal, for providing the data. We also acknowledge the Government of Japan and the Asian Institute of Technology, Thailand, for providing the scholarship for the first author.
Conflicts of Interest
The authors declare no conflict of interest.
References
- Mishra, Y.; Nakamura, T.; Babel, M.S.; Ninsawat, S.; Ochi, S. Impact of Climate Change on Water Resources of the Bheri River Basin, Nepal. Water 2018, 10, 220. [Google Scholar] [CrossRef]
- IPCC AR5—Summary for Policymakers. Contribution of Working Group I to the Fifth Assessment Report of the Intergovernmental Panel on Climate Change. In Climate Change 2013: The Physical Science Basis; Cambridge University Press: Cambridge, UK; New York, NY, USA, 2013; p. 78. [Google Scholar] [CrossRef]
- Shrestha, A.B.; Wake, C.P.; Mayewski, P.A.; Dibb, J.E. Precipitation fluctuations in the Himalaya and its vicinity: An analysis based on temperature records from Nepal. Int. J. Clim. 2000, 20, 317–327. [Google Scholar] [CrossRef]
- Babel, M.S.; Bhusal, S.P.; Wahid, S.M.; Agarwal, A. Climate change and water resources in the Bagmati River Basin, Nepal. Theor. Appl. Climatol. 2014, 115, 639–654. [Google Scholar] [CrossRef]
- Mishra, B.; Babel, M.S.; Tripathi, N.K. Analysis of climatic variability and snow cover in the Kaligandaki River Basin, Himalaya, Nepal. Theor. Appl. Clim. 2014, 116, 681–694. [Google Scholar] [CrossRef]
- Krishnamurthy, C.K.B.; Lall, U.; Kwon, H.H. Changing frequency and intensity of rainfall extremes over India from 1951 to 2003. J. Clim. 2009, 22, 4737–4746. [Google Scholar] [CrossRef]
- Tambe, S.; Kharel, G.; Arrawatia, M.L.; Kulkarni, H.; Mahamuni, K.; Ganeriwala, A.K. Reviving Dying Springs: Climate Change Adaptation Experiments From the Sikkim Himalaya. Mt. Res. Dev. 2012, 32, 62–72. [Google Scholar] [CrossRef]
- Negi, G.C.S.; Joshi, V. Rainfall and spring discharge patterns in two small drainage catchments in the western Himalayan Mountains, India. Environmentalist 2004, 24, 19–28. [Google Scholar] [CrossRef]
- Bookhagen, B.; Burbank, D.W. Toward a complete Himalayan hydrological budget: Spatiotemporal distribution of snowmelt and rainfall and their impact on river discharge. J. Geophys. Res. Earth Surf. 2010, 115, 1–25. [Google Scholar] [CrossRef]
- Erdogan, R. Stakeholder Involvement in Sustainable Watershed Management. Adv. Landsc. Archit. 2013. [Google Scholar] [CrossRef]
- Bhatta, L.D.; Van Oort, B.E.H.; Rucevska, I.; Baral, H. Payment for ecosystem services: Possible instrument for managing ecosystem services in Nepal. Int. J. Biodivers. Sci. Ecosyst. Serv. Manag. 2014, 10, 289–299. [Google Scholar] [CrossRef]
- Ouyang, F.; Zhu, Y.; Fu, G.; Lü, H.; Zhang, A.; Yu, Z.; Chen, X. Impacts of climate change under CMIP5 RCP scenarios on streamflow in the Huangnizhuang catchment. Stoch. Environ. Res. Risk Assess. 2015, 29, 1781–1795. [Google Scholar] [CrossRef]
- Arnold, J.G.; Srinivasan, R.; Muttiah, R.S.; Williams, J.R. Large area hydrologic modeling and assessment Part I: Model development. JAWRA J. Am. Water Resour. Assoc. 1998, 34, 73–89. [Google Scholar] [CrossRef]
- Kiros, G.; Shetty, A.; Nandagiri, L. Performance Evaluation of SWAT Model for Land Use and Land Cover Changes under different Climatic Conditions: A Review. J. Waste Water Treat. Anal. 2015, 6. [Google Scholar] [CrossRef]
- Smakhtin, V.U.; Eriyagama, N. Environmental Modelling & Software Developing a software package for global desktop assessment of environmental flows. Environ. Model. Softw. 2008, 23, 1396–1406. [Google Scholar] [CrossRef]
- Uddin, K.; Shrestha, H.L.; Murthy, M.S.R.; Bajracharya, B.; Shrestha, B.; Gilani, H.; Pradhan, S.; Dangol, B. Development of 2010 national land cover database for the Nepal. J. Environ. Manag. 2015, 148, 82–90. [Google Scholar] [CrossRef]
- Shrestha, S.; Shrestha, M.; Babel, M.S. Assessment of climate change impact on water diversion strategies of Melamchi Water Supply Project in Nepal. Theor. Appl. Climatol. 2017, 128, 311–323. [Google Scholar] [CrossRef]
- Mishra, B.; Tripathi, N.K.; Babel, M.S. An artificial neural network-based snow cover predictive modeling in the higher Himalayas. J. Mt. Sci. 2014, 11, 825–837. [Google Scholar] [CrossRef]
- Arnold, J.G.; Moriasi, D.N.; Gassman, P.W.; Abbaspour, K.C.; White, M.J.; Srinivasan, R.; Santhi, C.; Harmel, R.D.; Van Griensven, A.; VanLiew, M.W.; et al. Swat: Model Use, Calibration, and Validation. Asabe 2012, 55, 1491–1508. [Google Scholar] [CrossRef]
- Moriasi, D.N.; Arnold, J.G.; Van Liew, M.W.; Bingner, R.L.; Harmel, R.D.; Veith, T.L. Veith Model Evaluation Guidelines for Systematic Quantification of Accuracy in Watershed Simulations. Trans. ASABE 2007, 50, 885–900. [Google Scholar] [CrossRef]
- Fischer, G.; Tubiello, F.N.; van Velthuizen, H.; Wiberg, D.A. Climate change impacts on irrigation water requirements: Effects of mitigation, 1990-2080. Technol. Forecast. Soc. Chang. 2007, 74, 1083–1107. [Google Scholar] [CrossRef]
- Agarwal, A.; Babel, M.S.; Maskey, S. Estimating the Impacts and Uncertainty of Climate Change on the Hydrology and Water Resources of the Koshi River Basin. In Managing Water Resources under Climate Uncertainty; Springer: Cham, Switzerland, 2015. [Google Scholar] [CrossRef]
- Adhikari, B.; Verhoeven, R.; Troch, P. Water rights of the head reach farmers in view of a water supply scenario at the extension area of the Babai Irrigation Project, Nepal. Phys. Chem. Earth 2009, 34, 99–106. [Google Scholar] [CrossRef]
Publisher’s Note: MDPI stays neutral with regard to jurisdictional claims in published maps and institutional affiliations. |
© 2021 by the authors. Licensee MDPI, Basel, Switzerland. This article is an open access article distributed under the terms and conditions of the Creative Commons Attribution (CC BY) license (https://creativecommons.org/licenses/by/4.0/).