Abstract
The Three Gorges Reservoir (TGR) in China is one of the world’s largest hydropower projects. Interval inflow, originating from ungauged areas between the upstream gauging control stations (Zhutuo, Beibei, Wulong) and the TGR dam site, is a critical component of total reservoir inflow, but its hydrological characteristics have not been fully clarified. The accurate estimation and prediction of interval inflow are essential for reservoir safety and flood control operations. Using daily hydrological data from 2009 to 2017, we propose an integrated analytical framework combining (i) flow travel time estimation using cross-correlation analysis, (ii) multi-scale statistical characterization, and (iii) K-means clustering with bootstrap validation and algorithm comparison. This framework systematically identified hydrological regimes of interval inflow and their associated flood control risks. The key findings are as follows. (1) The optimal flow travel time from the upstream gauging stations to the dam site is 1 day (correlation coefficient ), and it remains stable across different flow regimes. (2) The interval inflow exhibited a highly right-skewed distribution (mean 1279 m3/s, standard deviation 1651 m3/s) and contributed on average 10.1% to the total inflow. The contribution ratio exhibited an inverted U-shaped relationship with increasing total inflow, peaking at 11.4% when the total inflow () was 13,014 m3/s. The quartile thresholds were 5788 m3/s, 9575 m3/s, and 16,869 m3/s (corresponding to Q1, Q2, and Q3, respectively), and the 10th and 90th percentiles (P10 and P90) were 4865 m3/s and 24,625 m3/s, respectively. (3) Five distinct hydrological patterns (C1–C5) were successfully identified, among which Cluster C4 (5.7% of days) was defined as the high-impact pattern based on reservoir operational criteria, with a mean of 6425 m3/s, a mean of 27.8% (up to 44% in extreme events), a mean flood duration of 5.8 days, a mean flood volume of 36.1 × 10⁸ m3, and a flashiness index of 1.48. (4) C4 is predominantly triggered by localized heavy rainfall, and its flashy nature implies a substantially shorter forecast lead time compared with mainstream-dominated floods, posing major challenges to real-time reservoir operations. This study demonstrates that interval inflow risk is pattern-dependent and that the proposed framework provides a scientific basis for developing pattern-specific reservoir operation strategies. The proposed framework is transferable to other large river-type reservoirs facing similar ungauged interval inflow challenges.
1. Introduction
Large reservoirs, as critical infrastructure for water resources regulation, flood control, and renewable energy supply, have been extensively constructed globally over the past century [1]. Large river-type reservoirs worldwide face a common challenge: “interval inflow”, defined as runoff generated from ungauged areas between upstream gauging stations and the dam site, including small tributaries, hillslopes, and scattered catchments. Although difficult to monitor directly, this flow component significantly affects reservoir inflow flood processes and increases the uncertainty of flood control operations. Major reservoirs in the Amazon, Mekong, and other large river basins confront similar issues; interval inflow has become a bottleneck limiting the accuracy of flood forecasting and refined operations of large reservoirs globally [2,3]. The Three Gorges Reservoir (TGR) is one of the world’s largest hydropower projects. Since its full impoundment in 2009, the TGR has delivered comprehensive benefits in flood control, power generation, and navigation while profoundly altering the hydrological regime of the middle and lower reaches of the Yangtze River [4,5,6]. Existing studies on the hydrological impacts of the TGR have primarily focused on sediment transport, water quality variation, downstream channel erosion, and the regulation of extreme flood/drought events [7,8,9,10,11]. The analysis in these studies predominantly relies on accurate inflow and outflow data of the TGR [12,13].
However, as a typical river-type reservoir with a length exceeding 700 km, the TGR receives inflow from numerous tributaries within its long backwater reach. Apart from the measurable inflows from major tributaries such as the Jialing River and the Wujiang River, a substantial amount of runoff is generated from ungauged small-to-medium tributaries and hillslopes within the reservoir area [14]. The lack of direct observation of this ungauged flow component, commonly termed “interval inflow” [15], significantly impairs the accuracy of reservoir inflow forecasting and has become a major technical bottleneck for refined reservoir operations [16].
Under global climate change, extreme weather events have occurred frequently in the Yangtze River Basin, leading to significant changes in its hydrological regime [17]. In recent years, the TGR region has been prone to flash flood hazards, significantly influenced by heavy rainfall, posing a serious threat to its safe operation [18]. The frequent local heavy rainfall in the TGR region has amplified the climate-related flood risk, and interval inflow has become a critical climate-risk amplifier for reservoir operations, exacerbating the challenges of flood forecasting and real-time control. Therefore, an in-depth analysis of the variation patterns of interval inflow and the precise identification of its distribution characteristics are critical to improving flood forecast accuracy and optimizing reservoir flood control operation strategies [19].
Current research on interval inflow mainly follows two approaches. The first involves simulation and estimation based on physical mechanisms, such as using hydrological or hydrodynamic models (e.g., SWAT, MIKE) to simulate the interval runoff generation and confluence processes, often by establishing rainfall–runoff relationships or solving hydrodynamic equations [20,21,22,23]. These methods have clear physical mechanisms, but require high-quality input data and involve complex parameter calibration, limiting their application in data-scarce or ungauged areas. The second approach is data-driven analysis and prediction. With the accumulation of hydrological data and advances in algorithms, techniques such as cluster analysis, neural networks, and support vector machines have demonstrated progress in flood classification and runoff prediction [24,25,26,27]. International research has accumulated rich experience in ungauged basin runoff simulation, satellite-based interval inflow estimation, and the integration of machine learning with physical models, providing valuable methodological references for this study [28,29,30].
Regarding the interval inflow of the TGR, existing research has primarily focused on the following aspects. The first aspect is the analysis of flood wave propagation processes. For instance, Huang et al. (2018) employed a one-dimensional unsteady flow hydrodynamic model combined with the water balance principle to inversely estimate the daily interval inflow process, thereby improving the simulation accuracy of both the timing and magnitude of flood peaks in the outflow hydrograph throughout the year [31]. Using a water-sediment model, Liu et al. (2023) found that the peak flood propagation time of the TGR decreased with the rise of the reservoir level before the dam [32]. Wang et al. (2023) applied a one-dimensional hydrodynamic model to simulate flood routing in the TGR region, determining that the flood travel time from upstream stations to the dam site ranged between 23 and 44 h and was influenced by the water level at the dam site and peak discharge [33]. Second, studies have focused on simulating and estimating interval inflow itself. For example, Cui et al. (2026) developed an ensemble probabilistic forecasting method coupled with multi-model posterior distributions, significantly enhancing the forecast performance for the interval inflow [34]. Deng et al. (2024) utilized a coupled one-dimensional hydro-sediment-power integrated model, demonstrating that lateral inflows from numerous ungauged small tributaries within the reservoir area significantly affect the calculation accuracy of flow and sediment transport [35]. Third, research has been conducted to identify influencing factors and investigate long-term changes. For instance, Zhang et al. (2018) systematically attributed the changes in TGR inflow to climatic and anthropogenic factors, quantifying their respective contributions [36]. Cheng et al. (2024) quantified the regulation capacity of the TGR on extreme hydrological events and its impact on the flow regime by coupling a distributed hydrological model with a machine learning-based operation model [13]. Furthermore, Xiong et al. (2023) incorporated transport timescales into reservoir operation optimization by employing a 3D hydrodynamic model for Xiangxi Bay, a typical tributary of the TGR, to improve water quality management [37]. However, previous studies either rely on physically based models with high data requirements (e.g., SWAT, MIKE) or focus on single-process prediction using black-box machine learning. Consequently, a systematic pattern-recognition perspective that reveals the intrinsic, repetitive behaviors of interval inflow and quantitatively links them to operation risks is still lacking. Few attempts have integrated travel-time adjustment, multi-scale statistics, and clustering to identify high-risk hydrological patterns of TGR interval inflow.
Accordingly, the interval inflow dynamics of the TGR have rarely been explored from the viewpoint of hydrological pattern recognition, especially via multi-scale statistical analysis and high-risk event identification. We aim to answer: (1) What are the multiscale statistical characteristics of TGR interval inflow? (2) How many typical hydrological patterns can be robustly identified, and what are their distinct features? (3) Which pattern poses the greatest challenge to flood control, and what are its formation mechanisms and operational implications? To address these limitations, we propose an integrated analytical framework combining multiple methods. This framework aims to uncover the statistical patterns and typical modes of the interval inflow within the TGR area, identify high-risk patterns, and analyze their impacts on flood control operation. Utilizing daily hydrological data from 2009 to 2017, the primary research contents include: (1) constructing a reliable interval inflow series based on inflow travel time analysis and the water balance principle; (2) revealing the multiscale statistical characteristics and variation patterns of interval inflow; (3) identifying typical interval inflow patterns with distinct hydrological features based on cluster analysis; and (4) elucidating the formation mechanisms of high-risk interval inflow patterns and analyzing their implications for reservoir flood control operation. The findings of this study are anticipated to provide a scientific basis for flood control operation of the TGR, and the methodological framework can serve as a reference for interval inflow research in other large river-type reservoirs facing similar challenges. This study also contributes to the United Nations Sustainable Development Goals, particularly SDG 6 (Clean Water and Sanitation) and SDG 11 (Sustainable Cities and Communities), by improving the flood safety management of large hydraulic infrastructure.
2. Materials and Methods
2.1. Study Area and Data
The TGR is located at the upstream end of the Yangtze River, and the water system within its area is complex with numerous tributaries. The study area is the uncontrolled region between the upstream gauging stations Zhutuo, Beibei (Jialing River), and Wulong (Wujiang River) and the TGR dam site (Figure 1). This area covers approximately 58,000 km2, with complex topography and landforms including mountains, hills, and river valleys. Precipitation in the region exhibits uneven spatiotemporal distribution, with annual precipitation ranging from 1000 to 1200 mm in most areas, mainly concentrated from June to September, which serves as an important source of flash floods [38].
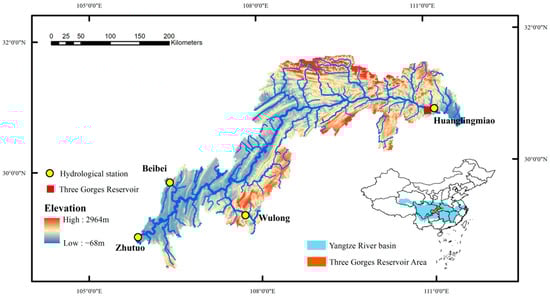
Figure 1.
Distribution map of the water system and hydrological stations in the TGR area.
This study employed daily-scale hydrological data (2009–2017) provided by the Yangtze River Water Resources Commission. The data mainly include: upstream control station discharges (measured at Zhutuo, Beibei, Wulong); daily TGR inflow inverted by a 1D hydrodynamic model [31]; and discharge at Huanglingmiao Station (TGR outflow).
All data underwent strict quality control and interpolation processing. Data quality control and preprocessing were implemented as follows: (i) missing values were detected and filled using linear interpolation; and (ii) the consistency of the discharge series was verified through water balance and temporal continuity checks.
2.2. Analytical Method
The overall analytical framework is illustrated in Figure 2, which integrates flow travel time estimation, multiscale statistical analysis, K-means clustering, and robustness evaluation.
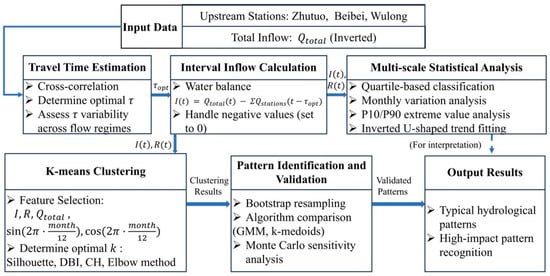
Figure 2.
Methodological framework for interval inflow analysis in the TGR.
2.2.1. Interval Inflow Calculation and Sensitivity Analysis
The TGR inflow data used in this study were based on the results of inverse calculation using a one-dimensional unsteady flow hydrodynamic model, as previously adopted by Huang et al. (2018) [31]. The model control equations were the Saint–Venant equations, which were discretized using the Preissmann four-point implicit difference scheme and solved using a three-level solution approach [39,40]. The model inlet boundary was the daily average flow process of the three upstream control stations (Zhutuo, Beibei, and Wulong), and the outlet boundary was the measured water level process in front of the TGR dam. The measured flow process at the outflow station (Huanglingmiao) was used as the verification criterion. Through model inversion, we allocated the difference between the calculated and measured values to each uncontrolled tributary according to the basin area ratio, thereby deriving the TGR inflow process. This inversion method was rigorously validated against the measured outflow at Huanglingmiao Station [31]. For example, in 2009, the water volume error of the simulated outflow was reduced from 9.29% to 0.78% after incorporating the inverted interval inflow, indicating that the reconstructed interval inflow data reliably represent the actual inflow from uncontrolled areas. To assess the propagation of inversion uncertainty to the calculated interval inflow and contribution ratio , a Monte Carlo sensitivity analysis was conducted. Specifically, ±5% uniform random noise was added to the total inflow series for 100 realizations, and the resulting and clustering assignments were compared with the original results.
Accurate calculation of interval inflow requires accounting for the flow propagation time from the upstream control stations to the TGR dam site. This study employed the cross-correlation analysis method to determine the optimal propagation time . The daily sequence of the sum of flows from the three upstream stations is denoted as , and the daily sequence of the inverted total TGR inflow is denoted as .
Here, denotes the covariance, denotes the standard deviation, and represents the correlation coefficient for a travel time of . is the total inflow into the TGR at time , and is the sum of the flows at the three upstream stations at time . By calculating the correlation coefficients for , the optimal travel time is defined as the value of that maximizes and is statistically significant.
To account for autocorrelation in hydrological time series, we estimated the effective degrees of freedom using the Bartlett formula [41]. The variability of under different flow regimes was examined by stratifying the data into low, medium, and high flow categories based on the quartiles of . The sensitivity of the subsequent interval inflow series and clustering results to the choice of τ was evaluated by repeating the calculations for = 0, 1, 2 days and comparing the outcomes.
Based on the water balance principle and accounting for the travel time lag, the interval inflow process was calculated as follows:
Negative values of may occasionally arise from the difference between two large discharge series. We set these negative values to zero, as they reflect minor mass balance inconsistencies rather than physical inflow.
The contribution ratio of the interval inflow, is:
2.2.2. Multiscale Statistical Analysis and Scenario Classification
To investigate the relationship between the interval inflow and the total inflow conditions, hydrological scenarios were divided into four levels (Q1 to Q4, corresponding to dry, slightly dry, slightly wet, and wet scenarios, respectively) based on the quartiles of the total inflow (). The statistical characteristics of interval inflow () and contribution ratio () under each level were calculated.
To highlight extreme hydrological conditions, high-flow periods () and low-flow periods () were defined. The mean, contribution ratio, and coefficient of variation of interval inflow during these two periods were compared to reveal their behavioral differentiation under different hydrological backgrounds. The monthly mean variations of interval inflow and its contribution ratio were analyzed to identify seasonal patterns.
2.2.3. Typical Pattern Recognition Based on K-Means Clustering
The K-means clustering algorithm was employed to identify typical patterns of interval inflow. This method is widely used in hydrology to identify inherent structures in data [42,43,44]. It has broad applications in extracting reservoir operation rules and identifying typical patterns of interval inflow, providing support for optimal reservoir scheduling and hydrological forecasting [45,46].
Based on the physical mechanisms of hydrological processes, five feature variables were selected to construct a feature matrix: , , and sine and cosine transformations of the month to capture seasonal periodicity. All features were Z-score normalized. Outliers were retained to preserve extreme flood signals. Given the random initialization of the K-means algorithm, the analysis was conducted with a fixed random seed (2024) to ensure full reproducibility. To mitigate the risk of converging to a poor local optimum, 30 replicates with different initial seeds were evaluated, and the solution with the lowest within-cluster sum of squares was retained.
The optimal number of clusters was determined by comprehensively evaluating quantitative indicators (Silhouette Coefficient, Davies–Bouldin Index, Calinski–Harabasz Index) and combining the graphical analysis of the elbow method [47,48]. The robustness of the selected k-cluster solution was assessed via bootstrap resampling (100 iterations, 80% samples each) and by comparing the K-means results with those obtained from alternative clustering algorithms (Gaussian Mixture Model, GMM; k-medoids). The K-means clustering algorithm was applied to the standardized feature matrix for clustering. For each identified pattern class, physical interpretations were provided based on occurrence frequency, seasonal distribution, and typical hydrological characteristics (cluster center values of each feature variable), thereby revealing systematic and repetitive behavioral patterns of the TGR interval inflow system.
After clustering, the cluster exhibiting the highest mean and , together with the highest flashiness index, was designated as the high-impact pattern. Typical events were selected from this cluster for analysis of their temporal distribution characteristics, antecedent conditions, relationship with total inflow, and impact on reservoir flood control. The selection of typical events is based on interval inflow magnitude and representativeness.
To further assess the robustness of the clustering results to uncertainties in the input data—specifically, the inverted total inflow series () used to calculate (t)—a Monte Carlo sensitivity analysis was conducted (as outlined in Section 2.2.1). The stability of the cluster assignments under these uncertainties was quantitatively evaluated using the Adjusted Rand Index (ARI). The ARI measures the similarity between the original cluster labels and those derived from the perturbed datasets, with values close to 1 indicating high robustness.
3. Results
3.1. Flow Propagation Time and Statistical Characteristics of Interval Inflow
During the study period (2009–2017, 3287 days), missing values were detected only in the TGR total inflow series, accounting for 173 days (5.3% of the total), which were filled using linear interpolation. No other variables had missing values. In the calculation of interval inflow (t), negative values were observed on 116 days (3.5%), all of which had absolute values less than 100 m3/s and were set to zero.
The results of the time-lag analysis (Figure 3a) indicate that when , the correlation coefficient between the TGR inflow and upstream control station flow reached its maximum (). This suggests that the average propagation time of water flow from the upstream control stations to the TGR dam site is about 1 day. The high correlation coefficient at () indicates strong continuity of hydrological processes at the daily scale. Figure 3b shows the alignment between upstream control station flow and TGR inflow after considering the propagation time. The determination of propagation time provides a foundation for the accurate calculation of TGR interval inflow.
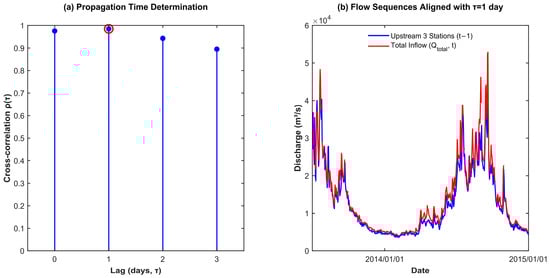
Figure 3.
Analysis results of propagation time: (a) Cross-correlation coefficients under different propagation times; (b) Example hydrograph of inflow based on day. Note: The red circle in (a) denoted the optimal propagation time.
The average interval inflow in the TGR interval area during 2009–2017 was 1279 m3/s, having a standard deviation of 1651 m3/s and a maximum daily magnitude of 20,925 m3/s (on 1 July 2016). The coefficient of variation (CV) of interval inflow was 1.291, indicating significant fluctuations in interval inflow. Interval inflow accounted for an average of 10.1% of the total TGR inflow. Interval inflow exhibited a significantly right-skewed distribution (skewness = 4.17) and extreme leptokurtosis (kurtosis = 30.68), indicating frequent extreme values. The median interval inflow was 745 m3/s, much lower than the mean, further confirming the right-skewed distribution.
Flow-stratified travel time analysis (low: ≤ 5788 m3/s; medium: 5788 < ≤ 16,869 m3/s; high: > 16,869 m3/s) revealed that the optimal was 1 day for the low-flow (1 = 0.902) and high-flow (1 = 0.924) groups, and 0 days for the medium-flow group (0 = 0.944, 1 = 0.942). Given the negligible difference in correlation coefficients (Δ = 0.002) and the physical expectation of a positive lag, a uniform propagation time of = 1 day was adopted for the entire series.
Recalculation of and for = 0, 1, 2 days resulted in mean differences in of less than 4% between any two values. Based on this stability of interval inflow calculations and the physical expectation of a positive lag, a uniform = 1 day was adopted for the entire series for calculating and using Equations (2) and (3). The Monte Carlo simulation (100 realizations), in which ±5% uniform random noise was added to , showed that the resulting mean varied by an average of +4.4% (range: +2.1% to +6.0%), and the clustering assignments resulted in a mean ARI of 0.90 (range 0.64 to 0.94).
3.2. Multiscale Statistical Analysis
Based on the quartiles of the total TGR inflow, four discharge levels were defined (Table 1), with quartile thresholds as follows: Q1 ≤ 5788 m3/s, Q2 = 5788–9575 m3/s, Q3 = 9575–16,869 m3/s, Q4 > 16,869 m3/s. High-flow periods were defined as > P90 = 24,625 m3/s, and low-flow periods were defined as < P10 = 4865 m3/s. The results indicate a significant association between interval inflow and the magnitude of total TGR inflow. As the hydrological scenario changed from the driest (Q1) to the wettest (Q4) scenario, interval inflow increased from 457 m3/s to 2496 m3/s, representing an approximate 5.5-fold increase. However, interval inflow’s contribution ratio () showed a non-linear, inverted U-shaped pattern: it rose from 9.3% in Q1 to 11.4% in Q3, and then slightly decreased to 9.9% in the wettest scenario (Q4) (Figure 4a).

Table 1.
Characteristics of TGR interval inflow under different discharge levels.
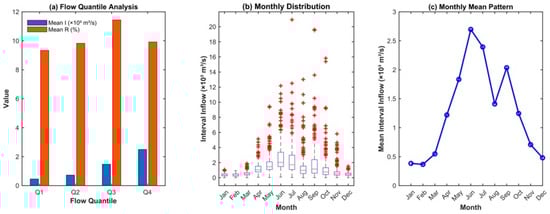
Figure 4.
Results of multiscale statistical analysis for TGR interval inflow: (a) Discharge level analysis; (b) Monthly boxplot distribution of interval inflow; (c) Monthly mean interval inflow. Note: Total number of daily samples was 3287. Outliers in (b) were shown as red plus signs.
A quadratic regression was fitted to the binned relationship between . The quadratic coefficient was negative (−5.68 × 10⁻¹⁰), consistent with the observed inverted U-shaped pattern of (Figure 4a), but the relationship was not statistically significant (p = 0.779).
A comparative analysis under extreme flow conditions revealed that during high-flow periods (>P90), the mean interval inflow was 3380 m3/s and a contribution ratio of 10.5%. Conversely, during low-flow conditions (<P10), the mean interval inflow was 423 m3/s and a contribution ratio of 9.7%. Both the absolute value and relative contribution of interval inflow were higher during high-flow conditions than during low-flow conditions.
The monthly boxplot distribution of interval inflow is presented in Figure 4b, which illustrates that June to September are characterized by higher mean values, greater variability, and numerous outliers. Specifically, June had the highest mean interval inflow. The interval inflow demonstrated distinct seasonal variation (Figure 4c), starting from winter lows (e.g., 383 m3/s in January), undergoing a rapid increase through spring, peaking at 2696 m3/s in June, declining in July and August, experiencing a secondary rise to 2036 m3/s in September, and diminishing again by year-end (480 m3/s in December). In contrast, the monthly mean contribution ratio displayed a more complex variation, increasing from 7.4% in January to its annual maximum value of 16.6% in May, then slightly decreasing to 16.0% in June, dropping sharply to its annual minimum value of 6.1% in August after June, and fluctuating at a relatively low level for the rest of the year.
3.3. Identification and Analysis of Typical Behavioral Patterns of Interval Inflow
Through a comprehensive analysis of multiple clustering validity indices for the TGR interval inflow (Figure 5), the optimal number of clusters was determined to be k = 5. When k = 5, the Davies–Bouldin Index reached its minimum (0.886) (Figure 5b), the Calinski–Harabasz Index reached its maximum (1779.096) (Figure 5c), and the Silhouette Coefficient was 0.518. Furthermore, the Within-Cluster Sum of Squares (WSS) exhibited a noticeable reduction in its rate of decrease after k = 5 (Figure 5d).
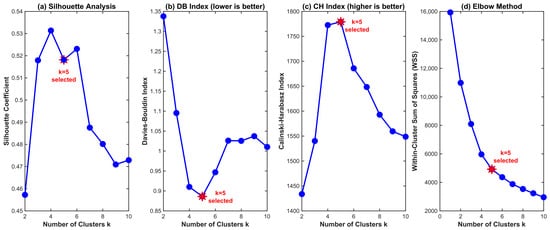
Figure 5.
Multi-criteria evaluation for determining the number of clusters: (a) Silhouette Coefficient; (b) Davies–Bouldin Index; (c) Calinski–Harabasz Index; (d) Elbow Curve.
The robustness of the five-cluster solution was further confirmed by bootstrap resampling (100 iterations, 80% sampling), which yielded a mean ARI of 0.963 (range: 0.659–0.997).
To verify that the five-pattern structure was not an artifact of the K-means algorithm, we compared the clustering results with those obtained from the Gaussian Mixture Model (GMM) and k-medoids. The pairwise ARI values were 0.853 (K-means vs. GMM), 0.977 (K-means vs. k-medoids), and 0.864 (GMM vs. k-medoids).
The five identified patterns exhibited clear and physically meaningful differences in hydrological characteristics and occurrence timing (Table 2). The K-means clustering analysis revealed five typical behavioral modes of the interval inflow (Figure 6). The good separation of clusters in the PCA space (Figure 6a) and the distinct differences displayed in the parallel coordinates plot (Figure 6b) validated the effectiveness of the pattern recognition. The monthly distribution frequency of each category (Figure 6c) further corroborates their seasonal dependency.
Table 2.
Characteristics of the five typical interval inflow patterns.
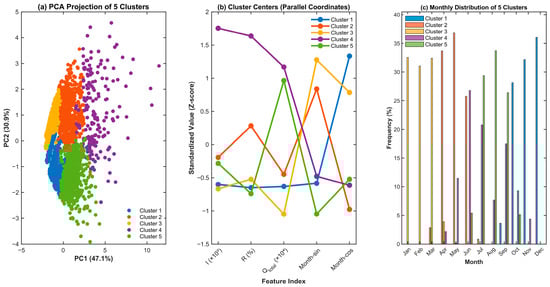
Figure 6.
Visualization of five-cluster results: (a) PCA projection; (b) Parallel coordinates plot (Standardized cluster centers); (c) Monthly distribution. Note: Sample sizes for each cluster in all figures were: C1 = 771, C2 = 698, C3 = 796, C4 = 183, C5 = 739, unless otherwise stated.
To reveal the hydrological characteristics of each pattern, Figure 7 presents the hydrographs of the two typical events with the largest interval inflow in each cluster. These hydrographs demonstrate the differences among the patterns in terms of rising/falling duration, peak shape, and relationship with the total reservoir inflow process.
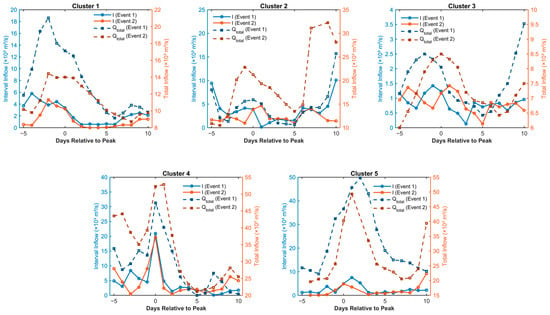
Figure 7.
Typical hydrographs of the five identified clusters (each showing the two events with the largest interval inflow in each cluster).
C1 (Autumn Mainstream-Dominated) primarily occurred from October to December. The interval inflow mean value was relatively small (580 m3/s), with a low contribution ratio (7.0%). Figure 6c shows that C1 occurred most frequently from November to January.
C2 (Spring High-Contribution) primarily occurred from April to June. It featured a relatively large mean interval inflow (1592 m3/s) and a relatively high contribution ratio (15.5%), with an ratio of 0.152.
C3 (Winter Baseflow) occurred primarily from January to March. It had the smallest mean interval inflow (415 m3/s) and a moderate contribution ratio (8.1%), mainly due to the low total inflow during winter (mean: 5240 m3/s). The interval inflow during this period was primarily baseflow, exhibiting relatively stable variations with a coefficient of variation (CV) of 0.521. Figure 6c shows that C3 dominated from January to March.
C4 (Localized High-Impact) occurred primarily in June and July. It had the largest mean interval inflow (6425 m3/s) and the highest contribution ratio (27.8%), with an I/Q ratio of 0.262. The mean total inflow was 24,490 m3/s. Typical C4 events (e.g., the event on 1 July 2016 with a peak of 20,925 m3/s) exhibited sharp, peaked hydrographs with rapid rising and falling. On 1 July 2016, the interval inflow accounted for 44% of the total reservoir inflow.
C5 (Summer Mainstream-Dominated) primarily occurred from July to September. It had a moderate mean interval inflow (1369 m3/s) but the lowest contribution ratio (6.2%).
3.4. Analysis of the High-Risk Cluster
According to the operational criteria defined in Section 2.2.3, Cluster 4 (C4) was identified as the high-impact pattern. Although its occurrence frequency was low (5.7%), it contributed 27.8% of the total interval inflow volume. The PCA projection (Figure 6a) shows that cluster C4 was the most distant from the other clusters. The parallel coordinates plot (Figure 6b) indicates that C4 exhibited the highest values in terms of interval inflow magnitude, contribution ratio, and total reservoir inflow while showing a specific monthly distribution (Figure 6c).
To quantitatively characterize the flashy nature of C4 floods, the top-10 C4 events were extracted, and their flood duration, total volume, and flashiness index (defined as the ratio of the 1-day maximum discharge to the 3-day maximum moving average discharge) were computed. The results are summarized in Table 3.
Table 3.
Hydrological characteristics of the top 10 high-impact (C4) events.
The mean duration of C4 events was 5.8 days, with an average flood volume of 36.1 × 10⁸ m3 and a mean flashiness index of 1.48.
The interannual distribution (Figure 8a) showed a relatively higher number of C4 events in 2011, 2014, and 2017. Figure 8b demonstrates that C4 events were concentrated from June to July, with the highest frequency in June (26.8%), followed by July (20.8%).
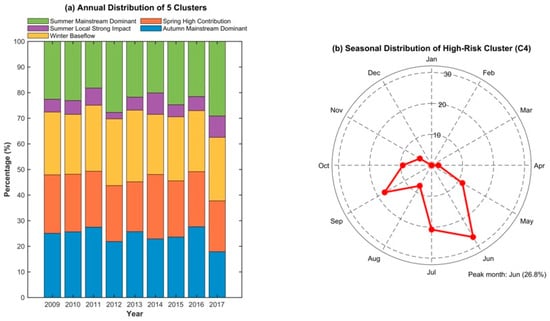
Figure 8.
Annual cluster distribution and seasonal distribution of C4. (a) Stacked bar chart of the annual cluster distribution; (b) Polar plot of the seasonal distribution of C4.
Three typical C4 events were selected for in-depth analysis (Figure 9). Collectively, these events revealed the key characteristics of interval inflow floods: sudden onset, high peak magnitude, and a substantial proportion of the total TGR inflow (with contribution ratios ranging from 40% to 50%).
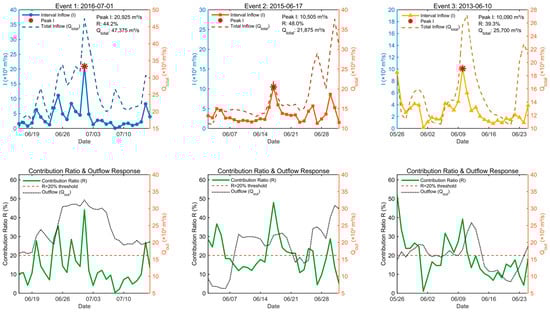
Figure 9.
Hydrographs and operational response of the TGR for three selected high-risk (C4) events.
At the daily scale, the rise in the interval inflow often coincided with or immediately followed upstream flows, leaving virtually no operational lead time. This rapid response necessitates nowcasting approaches rather than traditional forecast-based operations.
By comparing the time-series data of “Total Inflow ()” and “Outflow ()” during these events, we identified the operational response of the TGR. Data analysis indicates that the primary operational strategy for managing high-contribution, sudden interval floods is to attenuate the downstream flood peak by controlling outflow and storing floodwater during the peak inflow period. However, a time lag existed between the operational response and the rapid evolution of the interval flood. For instance, in Event 3, a significant increase in outflow occurred after the flood peak had passed.
4. Discussion
4.1. Robustness of the Analytical Framework
While the interval inflow series was derived from a validated hydrodynamic model [31], it is subject to inversion uncertainty. To evaluate the impact of this uncertainty on our findings, a Monte Carlo simulation was performed by adding ±5% uniform random noise to for 100 realizations. The results showed that even with this added uncertainty, the clustering assignments remained highly consistent with the original solution (mean ARI = 0.90). This high ARI indicates that the identified hydrological patterns (C1–C5) are robust to plausible uncertainties in the input data.
Similarly, the sensitivity of the results to the choice of travel time was assessed. Repeating the clustering for = 0, 1, and 2 days produced ARI values greater than 0.88 between any two choices, confirming that the exact selection of τ does not materially affect the pattern identification. Together, these analyses demonstrate that the proposed framework and the identified five patterns are not artifacts of specific parameter choices or input uncertainties.
4.2. Mechanism of the Inverted U-Shaped Contribution Pattern
The quadratic regression confirmed a negative curvature in the − relationship, supporting the inverted U-shaped tendency observed in Figure 4a. Although the relationship was not statistically significant (p = 0.779), this pattern is hydrologically plausible and can be explained by the competing influences of local runoff and mainstream inflow under different flood magnitudes.
This observed shift in the dominant floodwater sources can be explained by the following mechanisms. The inverted U-shaped pattern of the interval contribution ratio reflects the combined effects of runoff sensitivity, areal scale, and upstream regulation. During small to medium floods (Q1–Q3), the interval catchments respond quickly to rainfall and can generate large relative contributions, resulting in an increase in from Q1 to Q3 [49]. Under extreme rainfall, runoff generation in these small catchments tends to saturate, and their limited areal extent (approximately 5.6% of the Upper Yangtze Basin) imposes an upper bound on the increase in [15]. In basin-wide extreme events, the much larger upstream tributaries (e.g., the Jialing River) produce a massive increase in inflow that outpaces the additional contribution from the interval [50]. Moreover, once the storage capacity of the large upstream watersheds and cascade reservoirs is largely filled, their peak attenuation capacity diminishes, further amplifying the dominance of mainstream inflows [10,51,52]. Consequently, despite the absolute interval inflow continuing to rise in Q4, its relative contribution decreases slightly.
The lack of statistical significance is likely attributable to the high dispersion of R under extreme flows (e.g., C4 events in Q4), which introduces substantial variance and reduces the power of the regression. This does not invalidate the physical interpretation; rather, it highlights that the inverted U-shape is a descriptive tendency rather than a deterministic law. From an operational perspective, the pattern remains useful: it suggests that interval inflow is most critical during moderate floods, whereas during extreme basin-wide floods, mainstream inflow dominates and should be the primary focus of forecasting efforts.
This inverted U-shaped relationship has important implications for flood forecasting. For medium floods, particular attention should be paid to the monitoring and forecasting of precipitation in the interval areas. For extreme floods, although the relative contribution of the interval inflow remains stable (approximately 10%), its absolute increment (with a mean value of approximately 2500 m3/s) cannot be overlooked, as its omission could lead to a systematic underestimation of the total reservoir inflow peak.
This seasonal pattern is intrinsically linked to the precipitation regime of the Yangtze River Basin. The pre-flood and early flood season (April–June) rainfall over the uncontrolled areas generates proportionally higher runoff compared with the upstream mainstream. The high interval contribution (15–16%) requires enhanced monitoring of local rainfall forecasts to inform pre-flood drawdown decisions. In contrast, the peak flood season (July–August) is dominated by basin-wide precipitation and massive inflows from major upstream tributaries. In July–August, although interval contribution decreases to 6–9%, the absolute volume remains substantial (mean: 1400–2400 m3/s), necessitating contingency planning for local flash floods. The secondary peak in September suggests extended flood season vigilance beyond the traditional July–August focus.
4.3. Hydrological Interpretations of the Five Identified Patterns
Mainstream flow dominates during C1, with minimal contribution from interval runoff. This aligns with the seasonal decrease in precipitation and reduced watershed storage in autumn.
C2 reflects enhanced interval runoff activity before the flood season, providing early-warning information for guiding the pre-flood drawdown operation of the TGR. This indicates a significant increase in the contribution of interval runoff to the total inflow, likely due to increased spring rainfall and higher antecedent catchment wetness. Spring is the drawdown period for the TGR, making accurate forecasting of interval inflow particularly important for reservoir operation.
C4 corresponds to situations with localized convective rainstorms in summer, which often generate substantial interval runoff over a short period. When this runoff coincides with upstream flow, it can form significant flood peaks, making it a key focus of flood control operations. The interval flood in July 2016 was primarily triggered by intense precipitation in the TGR region [53]. Multiple stations in the section from Wanzhou to Yichang recorded daily rainfall exceeding 100 mm, leading to a rapid rise in the water levels of the interval tributaries. Such weather processes are characterized by low predictability, short forecast lead times, and inherent uncertainty. Therefore, compared with flood types primarily reliant on upstream inflows with longer forecast lead times, early warning and response for C4-type floods cannot be effectively achieved through traditional forecasting methods based solely on upstream inflow data. This situation significantly increases the risks and difficulties associated with real-time flood control operations.
C5 corresponds to large basin-wide floods in summer where inflows from the upstream mainstream and its major tributaries are absolutely dominant. Local rainfall may be relatively low or the local basin may be saturated, leading to reduced runoff generation efficiency.
The five typical patterns identified in this study statistically demonstrate the systematic and predictable nature of interval inflow behavior in the TGR. Specifically, the identification of C4 and C2 provides clear targets for reservoir risk management. The C4 pattern is characterized by flashy floods with short concentration times. When such floods coincide with upstream inflows, they can lead to a significant rise in the water level in front of the dam, potentially exceeding the flood control water level. This poses a risk that must be addressed in reservoir flood control operations. The C2 pattern coincides with the crucial pre-flood drawdown phase of the TGR. The increased contribution ratio of interval inflow (15.5%) during this period means that its impact on water level control requires attention during the drawdown operation.
4.4. Implications for Flood Risk and Reservoir Operation
From a causal perspective, the occurrence of such flood events depends not only on the temporal concentration of rainfall but also critically on its spatial distribution. The differences in the composition of flood sources are closely related to the distribution and intensity variations of rainfall centers across the river basin. Research by Chen et al. (2025) indicates that when a strong rainfall center is located in and persistently affects the Jialing River Basin (e.g., Langzhong and Wanyuan), the flow from this basin increases sharply, leading to a significant rise in its contribution ratio to the flood peak entering the TGR, which can easily dominate the formation of high-magnitude flood peaks [50]. The location, intensity, and movement of rainfall centers in key basins are crucial spatial factors driving the occurrence of C4-type flood events and shaping their flood peak composition characteristics.
This clearly underscores the challenges of short forecast lead times and consequent response delays associated with interval floods. Therefore, enhancing the forecasting capability for such flood processes is crucial for optimizing reservoir flood control operations and balancing upstream and downstream risks.
This study demonstrates that interval inflow significantly alters the structure of flood risk through a nonlinear amplification effect on reservoir inflow peaks. The rapid response of the underlying surface and short concentration times in the TGR interval catchment lead to marked suddenness and high uncertainty in its runoff generation and concentration process. As a result, it has become a difficult-to-predict yet highly impactful risk source in the reservoir flood control system. There are significant differences in the compositional structure of floods under different patterns.
The C4 pattern is characterized by a high interval inflow contribution ratio (mean: 27.8%). It is characterized by an extremely short forecast lead time and high suddenness. The C5 pattern is characterized by a low interval inflow contribution ratio (mean: 6.2%). The primary risk originates from upstream mainstem flows. Due to its relatively slower formation process, it has a longer forecast lead time based on upstream hydrological information, making the risk more predictable and manageable. The C2 pattern is characterized by a moderately high interval inflow contribution ratio (15.5%), with risk arising from the combined effects of interval and mainstem flows. Although the absolute peak magnitude is generally lower than that of C4 and C5 floods, its occurrence during the critical pre-flood drawdown period of the reservoir gives it special operational significance.
Different flood compositions necessitate distinct risk management strategies. For C4 floods, enhanced nowcasting and immediate response are required. For C5 floods, reliance on traditional forecast-based operations using upstream inflows remains viable. For C2 floods, sufficient operational response space must be reserved during the drawdown period.
Given the distinct risk profiles, tailored operational strategies are required. Therefore, a countermeasure framework is proposed that includes: (1) establishing a tiered warning mechanism based on the identified high-risk patterns through cluster analysis, with corresponding operational measures for different risk levels; (2) integrating interval inflow forecasts into the reservoir operation system to achieve forecast–operation coupling; and (3) adopting flexible operational strategies that account for the uncertainty of interval inflow, including reserving a certain amount of flood control storage capacity.
Several limitations should be acknowledged. First, the total inflow series was derived from a hydrodynamic model. Although the model has been validated against measured outflow [31], the Monte Carlo sensitivity analysis showed that a ±5% error in led to an average 4.4% change in mean and an ARI of 0.90, indicating that the clustering results are robust but not entirely insensitive. Second, the daily temporal resolution smooths sub-daily flash floods; C4 events may have even sharper peaks and shorter durations than those reported in Table 3. Moreover, the forecast lead time could not be precisely quantified due to the daily temporal resolution; sub-daily data would be required to capture the exact lag between upstream flows and interval inflow responses. Future work should couple distributed hydrological models with the pattern-recognition framework developed in this study.
The proposed analytical framework—travel-time correction, multiscale statistics, and clustering—is entirely data-driven and does not rely on basin-specific parameters. It can be readily applied to other large river-type reservoirs facing similar interval inflow challenges, such as the cascade reservoirs in the Mekong River or the Amazon Basin, provided that daily inflow and upstream discharge series are available. The transferability of the five specific patterns (e.g., the existence of a localized high-impact type) would depend on local hydro-climatic conditions, but the methodology itself is generic.
5. Conclusions
Based on daily-scale hydrological data from 2009 to 2017, a comprehensive analytical framework for the interval inflow of the TGR was constructed in this study. By integrating travel time analysis, multi-scale statistics, and k-means clustering, the spatiotemporal variation characteristics and dominant patterns of interval inflow were systematically identified. The main conclusions are as follows:
- (1)
- The optimal flow travel time from upstream stations to the TGR dam site is consistently 1 day across different flow regimes. Interval inflow is highly variable (mean 1279 ± 1651 m3/s) and contributes an average of 10.1% to total inflow, exhibiting a right-skewed distribution. Its contribution ratio follows an inverted U-shaped tendency, peaking under moderate flood conditions.
- (2)
- Using a multi-criteria cluster validation approach, five distinct hydrological patterns of interval inflow (C1–C5) were robustly identified. This classification was more reliable than that using the elbow method alone and was validated through bootstrap and alternative algorithms (bootstrap ARI = 0.96, cross-algorithm ARI > 0.85).
- (3)
- Among these, Cluster C4 (the localized high-impact pattern) poses the greatest challenge to flood control. Characterized by the highest mean interval inflow (6425 m3/s) and contribution ratio (27.8%), these events are flashy (mean flashiness index: 1.48) and driven by local rainstorms, which implies a substantially shorter forecast lead time and necessitates dedicated nowcasting strategies.
- (4)
- The findings of this study demonstrate that flood risk in the TGR is pattern-dependent. Therefore, effective risk management requires tailored strategies for each pattern: enhanced nowcasting for C4, forecast-informed operations for mainstream floods (C5), and strategic drawdown scheduling for spring high-contribution events (C2). The proposed analytical framework is transferable to other large reservoirs facing similar ungauged inflow challenges.
In summary, the multi-scale framework and pattern-based recognition method proposed in this study provide a systematic paradigm for understanding complex reservoir interval inflow. The findings provide a scientific basis for refining TGR flood forecasting models and operational strategies. Future work should integrate high-resolution rainfall forecasts and develop pattern-specific probabilistic flood forecasting models to better address the challenges posed by C4-type events.
Author Contributions
Conceptualization, Q.Z., Z.L. (Zhonghe Li) and Q.F.; methodology, Q.Z., Z.L. (Zhifei Li) and Y.D.; software, Q.Z., Y.D. and Y.W.; validation, Q.Z., Y.D. and H.H.; formal analysis, Q.Z., Y.D. and H.W.; investigation, Q.Z., Z.L. (Zhonghe Li) and Q.F.; resources, Q.Z. and H.W.; data curation, Q.Z. and H.W.; writing—original draft preparation, Q.Z. and Z.L.(Zhifei Li); writing—review and editing, Q.Z., Y.D., H.W., Y.W., and H.H.; visualization, Q.Z.; supervision, H.W.; project administration, Y.D.; funding acquisition, H.W. All authors have read and agreed to the published version of the manuscript.
Funding
This research received no external funding.
Data Availability Statement
The data are available from the corresponding author upon reasonable request.
Conflicts of Interest
The authors declare no conflicts of interest. The funders had no role in the design of the study; in the collection, analyses, or interpretation of data; in the writing of the manuscript; or in the decision to publish the results.
References
- Kummu, M.; Varis, O. Sediment-related impacts due to upstream reservoir trapping, the Lower Mekong River. Geomorphology 2007, 85, 275–293. [Google Scholar] [CrossRef]
- Fagundes, H.O.; Fleischmann, A.S.; Fan, F.M.; Paiva, R.C.D.; Buarque, D.C.; Siqueira, V.A.; Collischonn, W.; Borrelli, P. Human-Induced Changes in South American River Sediment Fluxes From 1984 to 2019. Water Resour. Res. 2023, 59, e2023WR034519. [Google Scholar] [CrossRef]
- Li, X.; Liu, J.P.; Saito, Y.; Nguyen, V.L. Recent evolution of the Mekong Delta and the impacts of dams. Earth-Sci. Rev. 2017, 175, 1–17. [Google Scholar] [CrossRef]
- Li, S.; Zhu, L.; Yuan, J.; Dong, B.; Lv, C.; Yang, C. Riverbed Adjustments in Gravel—Sand Reaches Immediately Downstream of Large Reservoirs. Sustainability 2024, 16, 11245. [Google Scholar] [CrossRef]
- Dai, X.; Wang, L.; Cao, Q.; Niu, Z.; Luo, Z.; Luo, Y. Assessing the Hydrological and Social Effects of Three Gorges Reservoir Using a Modified SWAT Model. J. Earth Sci. 2025, 36, 1793–1807. [Google Scholar] [CrossRef]
- Wang, Y.; Yang, G.; Yuan, S.; Zhang, H.; Tang, H. Nonstationary response of hydrology and water quality in river-connnected lakes: Comparative analysis of pre- and post- three Gorges Dam. J. Hydrol. 2025, 662, 133958. [Google Scholar] [CrossRef]
- Ge, H.; Zhu, L.; Mao, B. Evolution of tidal reaches of the Yangtze River related to reduced non-uniform sediment after the impoundment of Three Gorges Reservoir. Catena 2025, 260, 109462. [Google Scholar] [CrossRef]
- Jiang, A.; Wang, D.; Ning, Z.; Li, P.; Xu, T.; Zhu, B.; Peng, Q.; Jin, T.; Lin, J.; Zhang, D. Spatio-temporal characteristics and influencing factors of water quality in Xiangxi Bay under the operation of the three gorges reservoir. J. Contam. Hydrol. 2025, 270, 104518. [Google Scholar] [CrossRef]
- Su, H.; Chen, X.; Zhang, J.; Wang, Z.; Guo, Y.; Ouyang, S. Quantitative analysis of water exchange between Yangtze River and Dongting Lake. Water Sci. Eng. 2026, 19, 56–66. [Google Scholar] [CrossRef]
- Huang, J.; Tan, C.; Chen, X.; Li, J.; Zhao, B.; Tang, X.; Li, Y.; Gao, C. Modeling framework for coordinated operation of series-parallel reservoir groups considering storage-discharge regulation mechanisms. J. Hydrol. Reg. Stud. 2025, 58, 102245. [Google Scholar] [CrossRef]
- Mei, X.; Dai, Z.; Du, J.; Cheng, J. Three Gorges Dam enhanced organic carbon burial within the sediments of Poyang Lake, China. Catena 2024, 238, 107859. [Google Scholar] [CrossRef]
- Huang, S.; Xia, J.; Zeng, S.; Wang, Y.; She, D. Effect of Three Gorges Dam on Poyang Lake water level at daily scale based on machine learning. J. Geogr. Sci. 2021, 31, 1598–1614. [Google Scholar] [CrossRef]
- Cheng, H.; Wang, T.; Yang, D. Quantifying the Regulation Capacity of the Three Gorges Reservoir on Extreme Hydrological Events and Its Impact on Flow Regime in a Changing Climate. Water Resour. Res. 2024, 60, e2023WR036329. [Google Scholar] [CrossRef]
- Xu, Y.; Yu, S.; Liu, D.; Ma, J.; Chuo, M. The Impact of the Three Gorges Reservoir Operations on Hydraulic Characteristics in the Backwater Region: A Comprehensive 2D Modeling Study. Water 2024, 16, 2045. [Google Scholar] [CrossRef]
- Wang, B.; Tian, F.; Hu, H. Analysis of the effect of regional lateral inflow on the flood peak of the Three Gorges Reservoir. Sci. China Technol. Sci. 2011, 54, 914–923. [Google Scholar] [CrossRef]
- Dong, N.; Yang, M.; Wei, J.; Arnault, J.; Laux, P.; Xu, S.; Wang, H.; Yu, Z.; Kunstmann, H. Toward Improved Parameterizations of Reservoir Operation in Ungauged Basins: A Synergistic Framework Coupling Satellite Remote Sensing, Hydrologic Modeling, and Conceptual Operation Schemes. Water Resour. Res. 2023, 59, e2022WR033026. [Google Scholar] [CrossRef]
- Huang, Z.; Chen, X.; Pan, Z.; Gao, R.; Men, J.; Bi, P.; Huang, N.; Zhang, F.; Yang, R. Increasingly frequent and severe dry-to-wet abrupt alteration events are striking the Yangtze River Basin in China. Atmos. Res. 2025, 315, 107926. [Google Scholar] [CrossRef]
- Li, Z.; Yang, D.; Hong, Y.; Zhang, J.; Qi, Y. Characterizing Spatiotemporal Variations of Hourly Rainfall by Gauge and Radar in the Mountainous Three Gorges Region. J. Appl. Meteorol. Clim. 2014, 53, 873–889. [Google Scholar] [CrossRef]
- Sun, Y.; Zhang, Q.; Song, W.; Tang, S.; Singh, V.P. Hydrological responses of three gorges reservoir region (China) to climate and land use and land cover changes. Nat. Hazards 2025, 121, 1505–1530. [Google Scholar] [CrossRef]
- Xu, H.; Taylor, R.G.; Kingston, D.G.; Jiang, T.; Thompson, J.R.; Todd, M.C. Hydrological modeling of River Xiangxi using SWAT2005: A comparison of model parameterizations using station and gridded meteorological observations. Quat. Int. 2010, 226, 54–59. [Google Scholar] [CrossRef]
- Zhi, X.; Xu, Y.; Chen, L.; Chen, S.; Zhang, Z.; Meng, X.; Shen, Z. The synergistic response between temperature, flow field and nutrients in the tributary disturbed by the Three Gorges reservoir. J. Hydrol. 2024, 639, 131636. [Google Scholar] [CrossRef]
- Wu, B.; Zhang, H.; Zhang, D.; Fan, Q.; Li, L.; Lan, H. Influence of water level change of Three Gorges Reservoir on rainfall and runoff in reservoir area. Yangtze River 2022, 53, 76–80. [Google Scholar] [CrossRef]
- Zhang, N.; He, H.M.; Zhang, S.F.; Jiang, X.H.; Xia, Z.Q.; Huang, F. Influence of Reservoir Operation in the Upper Reaches of the Yangtze River (China) on the Inflow and Outflow Regime of the TGR-based on the Improved SWAT Model. Water Resour. Manag. 2012, 26, 691–705. [Google Scholar] [CrossRef]
- Fan, M.; Liu, S.; Lu, D. Advancing subseasonal reservoir inflow forecasts using an explainable machine learning method. J. Hydrol. Reg. Stud. 2023, 50, 101584. [Google Scholar] [CrossRef]
- Moeini, R.; Nasiri, K.; Hosseini, S.H. Predicting the Water Inflow Into the Dam Reservoir Using the Hybrid Intelligent GP-ANN- NSGA-II Method. Water Resour. Manag. 2024, 38, 4137–4159. [Google Scholar] [CrossRef]
- Mahmood, O.A.; Sulaiman, S.O.; Al-Jumeily, D. Forecasting for Haditha reservoir inflow in the West of Iraq using Support Vector Machine (SVM). PLoS ONE 2024, 19, e0308266. [Google Scholar] [CrossRef]
- Zhao, Z.; Wang, X.; Jin, H.; Zheng, J. Research on monthly runoff prediction model considering secondary decomposition of multiple fitness functions and deep learning. Geomat. Nat. Hazards Risk 2025, 16, 2469775. [Google Scholar] [CrossRef]
- Prakash, H.; Pandey, K.K.; Soni, P. Peak discharge estimation for ungauged basins: A review. J. Water Clim. Change 2025, 16, 3483–3507. [Google Scholar] [CrossRef]
- Du, T.L.T.; Lee, H.; Bui, D.D.; Graham, L.P.; Darby, S.D.; Pechlivanidis, I.G.; Leyland, J.; Biswas, N.K.; Choi, G.; Batelaan, O.; et al. Streamflow Prediction in Highly Regulated, Transboundary Watersheds Using Multi-Basin Modeling and Remote Sensing Imagery. Water Resour. Res. 2022, 58, e2021WR031191. [Google Scholar] [CrossRef]
- Jia, Y.; Su, X.; Singh, V.P.; Zhao, B.; Zhang, T.; Chu, J.; Wu, H. A Novel Hybrid Predictive Model Based on Mixture Density Networks With Weighted Conformal Inference Strategy for Runoff Interval Prediction Across Australia. Water Resour. Res. 2026, 62, e2024WR039807. [Google Scholar] [CrossRef]
- Huang, R.; Wang, M.; Zhang, X.; Zhou, M.; Liu, L.; Ren, S. Calculation of Local Inflow Process of the Three Gorges Reservoir. J. Chang. River Sci. Res. Inst. 2018, 35, 67–69. [Google Scholar] [CrossRef]
- Liu, S.; Wang, D.; Wang, Z.; Xu, Z.; Li, D. Propagation characteristics of the flow and suspended sediment peaks in the three gorges reservoir, China: Insight from numerical simulations and measured data. Hydrol. Process. 2023, 37, e15000. [Google Scholar] [CrossRef]
- Wang, J.; Zhang, H.; Sun, Z.; Mingliang, Z. Flood Routing Simulation and Propagation Law Analysis in Three Gorges Reservoir Area. Pearl River 2023, 44, 9–16. [Google Scholar] [CrossRef]
- Cui, Z.; Guo, S.; Hu, C.; Yin, J.; Chen, K.; Zhang, X. Probabilistic runoff forecasting based on Coupled multi-model posterior distributions. Adv. Water Sci. 2026, 37, 1–12. [Google Scholar]
- Deng, S.; Xia, J.; Chen, Y.; Zhou, M.; Zhou, Y.; Wang, Z. Integrated modelling of flow-sediment transport and power generation in the Three Gorges Reservoir. Sci. Total Environ. 2024, 921, 170983. [Google Scholar] [CrossRef]
- Zhang, Y.; Zhong, P.; Wang, M.; Xu, B.; Chen, J. Changes identification of the Three Gorges reservoir inflow and the driving factors quantification. Quat. Int. 2018, 475, 28–41. [Google Scholar] [CrossRef]
- Xiong, G.; Mao, J.; Cai, H.; Zhang, H. Optimal reservoir operation for transport timescales using an integrated methodology. Environ. Res. Lett. 2023, 18, 114025. [Google Scholar] [CrossRef]
- Sheng, L.; Liu, D.; Wang, B.; Yu, S.; Zuo, Y.; Gu, F. Temporal variations characteristic of precipitation in the Three Gorges Reservoir area from 1961 to 2016. J. Water Clim. Change 2022, 13, 1765–1775. [Google Scholar] [CrossRef]
- Huang, R.; Huang, Y. Preliminary Study on1-D Numerical Simulation of Unsteady flow and Sediment Transport in Mainstream and Tributaries of Three Gorges Reservoir Area. J. Yangtze River Sci. Res. Inst. 2009, 26, 9–13. [Google Scholar] [CrossRef]
- Huang, R.; Li, F.; Zhang, X. Numerical Simulation of Flow and Sediment Transport in the Early Stage of Three Gorges Reservoir Operation. J. Chang. River Sci. Res. Inst. 2012, 29, 7–12. [Google Scholar] [CrossRef]
- Bartlett, M.S. Some Aspects of the Time-Correlation Problem in Regard to Tests of Significance. J. R. Stat. Soc. 1935, 98, 536–543. [Google Scholar] [CrossRef]
- Wang, S.; Peng, H. Multiple spatio-temporal scale runoff forecasting and driving mechanism exploration by K-means optimized XGBoost and SHAP. J. Hydrol. 2024, 630, 130650. [Google Scholar] [CrossRef]
- Kisi, O.; Heddam, S.; Parmar, K.S.; Yaseen, Z.M.; Kulls, C. Improved monthly streamflow prediction using integrated multivariate adaptive regression spline with K-means clustering: Implementation of reanalyzed remote sensing data. Stoch. Environ. Res. Risk Assess. 2024, 38, 2489–2519. [Google Scholar] [CrossRef]
- Guru, N. Implication of partial duration series on regional flood frequency analysis. Int. J. River Basin Manag. 2022, 22, 167–186. [Google Scholar] [CrossRef]
- Feng, Z.; Niu, W.; Zhang, R.; Wang, S.; Cheng, C. Operation rule derivation of hydropower reservoir by k-means clustering method and extreme learning machine based on particle swarm optimization. J. Hydrol. 2019, 576, 229–238. [Google Scholar] [CrossRef]
- Noorbeh, P.; Roozbahani, A.; Moghaddam, H.K. Annual and Monthly Dam Inflow Prediction Using Bayesian Networks. Water Resour. Manag. 2020, 34, 2933–2951. [Google Scholar] [CrossRef]
- Roushangar, K.; Alizadeh, F. A multiscale spatio-temporal framework to regionalize annual precipitation using k-means and self-organizing map technique. J. Mt. Sci. 2018, 15, 1481–1497. [Google Scholar] [CrossRef]
- Sotomayor, G.; Hampel, H.; Vázquez, R.F. Water quality assessment with emphasis in parameter optimisation using pattern recognition methods and genetic algorithm. Water Res. 2018, 130, 353–362. [Google Scholar] [CrossRef]
- Shen, H.; Dong, L.; Tang, W.; Zeng, Y. Physically Consistent Runoff Simulation in Mountainous Catchments Using a Time-Varying Gated Hybrid XAJ–LSTM Model. Water 2025, 17, 3507. [Google Scholar] [CrossRef]
- Chen, L.; Xu, S.; Zhang, W.; Zhai, S.; Liu, X.; Yang, L. Changes in the composition of flood peaks in the Three Gorges Reservoir and analysis of its causes. Adv. Water Sci. 2025, 36, 39–49. [Google Scholar] [CrossRef]
- Zhang, K.; Yuan, X.; Lu, Y.; Guo, Z.; Wang, J.; Luo, H. Quantifying the Impact of Cascade Reservoirs on Streamflow, Drought, and Flood in the Jinsha River Basin. Sustainability 2023, 15, 4989. [Google Scholar] [CrossRef]
- Wang, S.; Ma, Y.; Zhu, D.; Yao, H.; Wang, X. Quantitative Analysis of Flood Peak Attenuation Capacity of the Three Gorges Reservoir Facing Historical Floods. J. Chang. River Sci. Res. Inst. 2023, 40, 73–77. [Google Scholar] [CrossRef]
- Li, Y.; Liu, D.; Xiong, Y. Flood Encounter Analysis of Yangtze River in 2016. J. Water Resour. Res. 2017, 6, 568–576. [Google Scholar] [CrossRef]


Disclaimer/Publisher’s Note: The statements, opinions and data contained in all publications are solely those of the individual author(s) and contributor(s) and not of MDPI and/or the editor(s). MDPI and/or the editor(s) disclaim responsibility for any injury to people or property resulting from any ideas, methods, instructions or products referred to in the content. |
© 2026 by the authors. Licensee MDPI, Basel, Switzerland. This article is an open access article distributed under the terms and conditions of the Creative Commons Attribution (CC BY) license.