You are currently viewing a new version of our website. To view the old version click .
Hydrology
  • Article
  • Open Access

Published: 8 September 2025

Are Hydrological Geosites Related to High Hydrodiversity? A Study in the State of Rio Grande do Norte, Northeast Brazil

,
and
1
Centre for Humanities, Literature and Arts, Federal University of Rio Grande do Norte, Natal 59078-970, Brazil
2
Institute of Earth Sciences, University of Minho, 4710-057 Braga, Portugal
3
Department of Geography, Seridó Higher Education Centre, Federal University of Rio Grande do Norte, Caicó 59300-000, Brazil
*
Author to whom correspondence should be addressed.

Abstract

This study presents an assessment of hydrological diversity (hydrodiversity) in Rio Grande do Norte, Brazil, aiming to identify potential correlations between hydrodiversity and hydrological features of geoheritage. The methodology applied a quantitative approach based on mean annual precipitation, river discharge, reservoir distribution, and stream order. These variables were analyzed within a 5.5 km grid using GIS tools. The four resulting sub-indices were normalized through the Maximum Possible Value method to ensure equal weighting in the final Hydrodiversity Index, which classifies areas into four levels: low, medium, high, and very high. Results show the highest hydrodiversity values in the eastern region and along the Apodi–Mossoró River, where rainfall and drainage density are greatest. The Hydrodiversity Index map was examined alongside land use data and the distribution of 22 previously identified hydrological sites (hydrosites). A greater concentration of anthropogenic land use was noted in areas with medium to high hydrodiversity, especially in the east and along the northern coast, emphasizing the role of water resources in territorial dynamics. The findings indicate that no hydrosites are located within areas of Very High Hydrodiversity; however, more than 50% of the hydrosites correspond to areas classified as High Hydrodiversity. While further research is required to better elucidate the relationship between geodiversity and geoheritage, these results underscore both the complexity of the link between hydrodiversity and water-related geoheritage, as well as the importance of employing an index to inform conservation and management strategies.

1. Introduction

The study of geodiversity involves developing approaches for understanding, valuing, and promoting the sustainable use of the Earth’s abiotic components. Conceptually, it encompasses geological, pedological, hydrological, and geomorphological features, as well as the structures and systems that shape landscapes []. Water, as an integral element of geodiversity, plays a crucial role in terrestrial processes. Its effective management relies on its interaction with other abiotic elements, all of which possess intrinsic value and are linked to broader societal demands [].
According to Brilha et al. (2018) [], geodiversity can be analyzed through two main perspectives, guided by central questions such as “What?”, which pertains to identifying the types and spatial distribution of geodiversity elements in a given area. Within this framework, hydrology is emphasized as the principal aspect of geodiversity examined in the present study. Hydrological diversity (hydrodiversity) refers to the variety of hydrological features within a given region, including rivers, lakes, aquifers, and other surface and subsurface water bodies []. This diversity of water resources is key to sustaining life and maintaining environmental balance, and it is a part of geodiversity, which encompasses all the components of abiotic nature.
Instead, geoheritage refers to the subset of geodiversity features that are considered to have significant scientific, cultural, aesthetic, ecological, or tourism value. In this context, some hydrological features can be considered as geoheritage and are referred to as hydrological heritage []. The identification, evaluation, and conservation of these sites (Hydrosites) are essential for promoting the sustainable and responsible use of water resources.
To this end, objective assessment methodologies to assess geodiversity have become necessary to inform conservation efforts, spatial planning, and environmental management []. According to Gonçalves et al. (2022) [], widely adopted quantitative methodologies are based on map analysis and the use of indices. These geodiversity indices are derived from the integration of data related to geology, geomorphology, soils, water resources, and other relevant variables.
Recent studies have also focused on hydrological geoheritage, identifying sites with scientific value, which consider criteria such as representativeness, integrity, rarity, and scientific knowledge. From this framework, several hydrosites were identified and quantitatively assessed in the Rio Grande do Norte state, in Brazil [], the study area for this research. Similarly, geoconservation strategies were proposed for waterfalls in the central region of the state []. By combining the 15 hydrosites inventoried in these previous studies with seven additional sites identified using the same assessment methodologies [,], a total of 22 hydrosites were recognized in the study area.
Furthermore, a geodiversity assessment conducted across the entire state [] was considered, which produced an index that incorporates geological, hydrological, geomorphological, pedological, and mineral resource variables. Even though this work did not focus on a detailed assessment of hydrodiversity nor involved the identification of hydrosites, it was considered as a reference to compare the results regarding the hydrodiversity of Rio Grande do Norte state.
Therefore, the guiding question for our study is whether a Hydrodiversity Index can be used to identify hydrosites or if their occurrence can be linked to specific patterns of hydrodiversity. Accordingly, the main objective is to calculate a Hydrodiversity Index using selected hydrological variables and to compare the resulting spatial patterns with the distribution of the 22 previously identified hydrosites. Other goals are to compare the Hydrodiversity Index results with (i) the geodiversity index applied by Dias et al. [] and (ii) the land use in Rio Grande do Norte state [].
Unlike previous studies on geodiversity and geoheritage, which typically address water resources as one of several variables, this research focuses specifically on hydrological features of geodiversity. By applying a Hydrodiversity Index and correlating it with hydrological heritage, the study seeks to advance the understanding of water-related features within the broader framework of geodiversity. This targeted approach allows for a more detailed assessment of hydrological elements, trying to contribute to geoheritage research by treating water resources as a distinct and significant focus of analysis.
The 22 hydrosites inventoried in Rio Grande do Norte fall into four categories: waterfalls, lagoons, springs, and thermal springs. Considering the diverse characteristics of the region, the results of this study can contribute to the development of geoconservation strategies, which may also be adapted for application in other regions. From a geological perspective, the study area has distinct characteristics, with water resources located in a semi-arid environment and rivers that are generally intermittent and low-flowing. The primary rivers include the Piranhas–Açu, Apodi–Mossoró, and Potengi. Due to the combination of climatic constraints and social water management challenges, this region faces persistent difficulties in ensuring sustainable water use [].

2. Materials and Methods

2.1. Study Area: Rio Grande do Norte State, Brazil

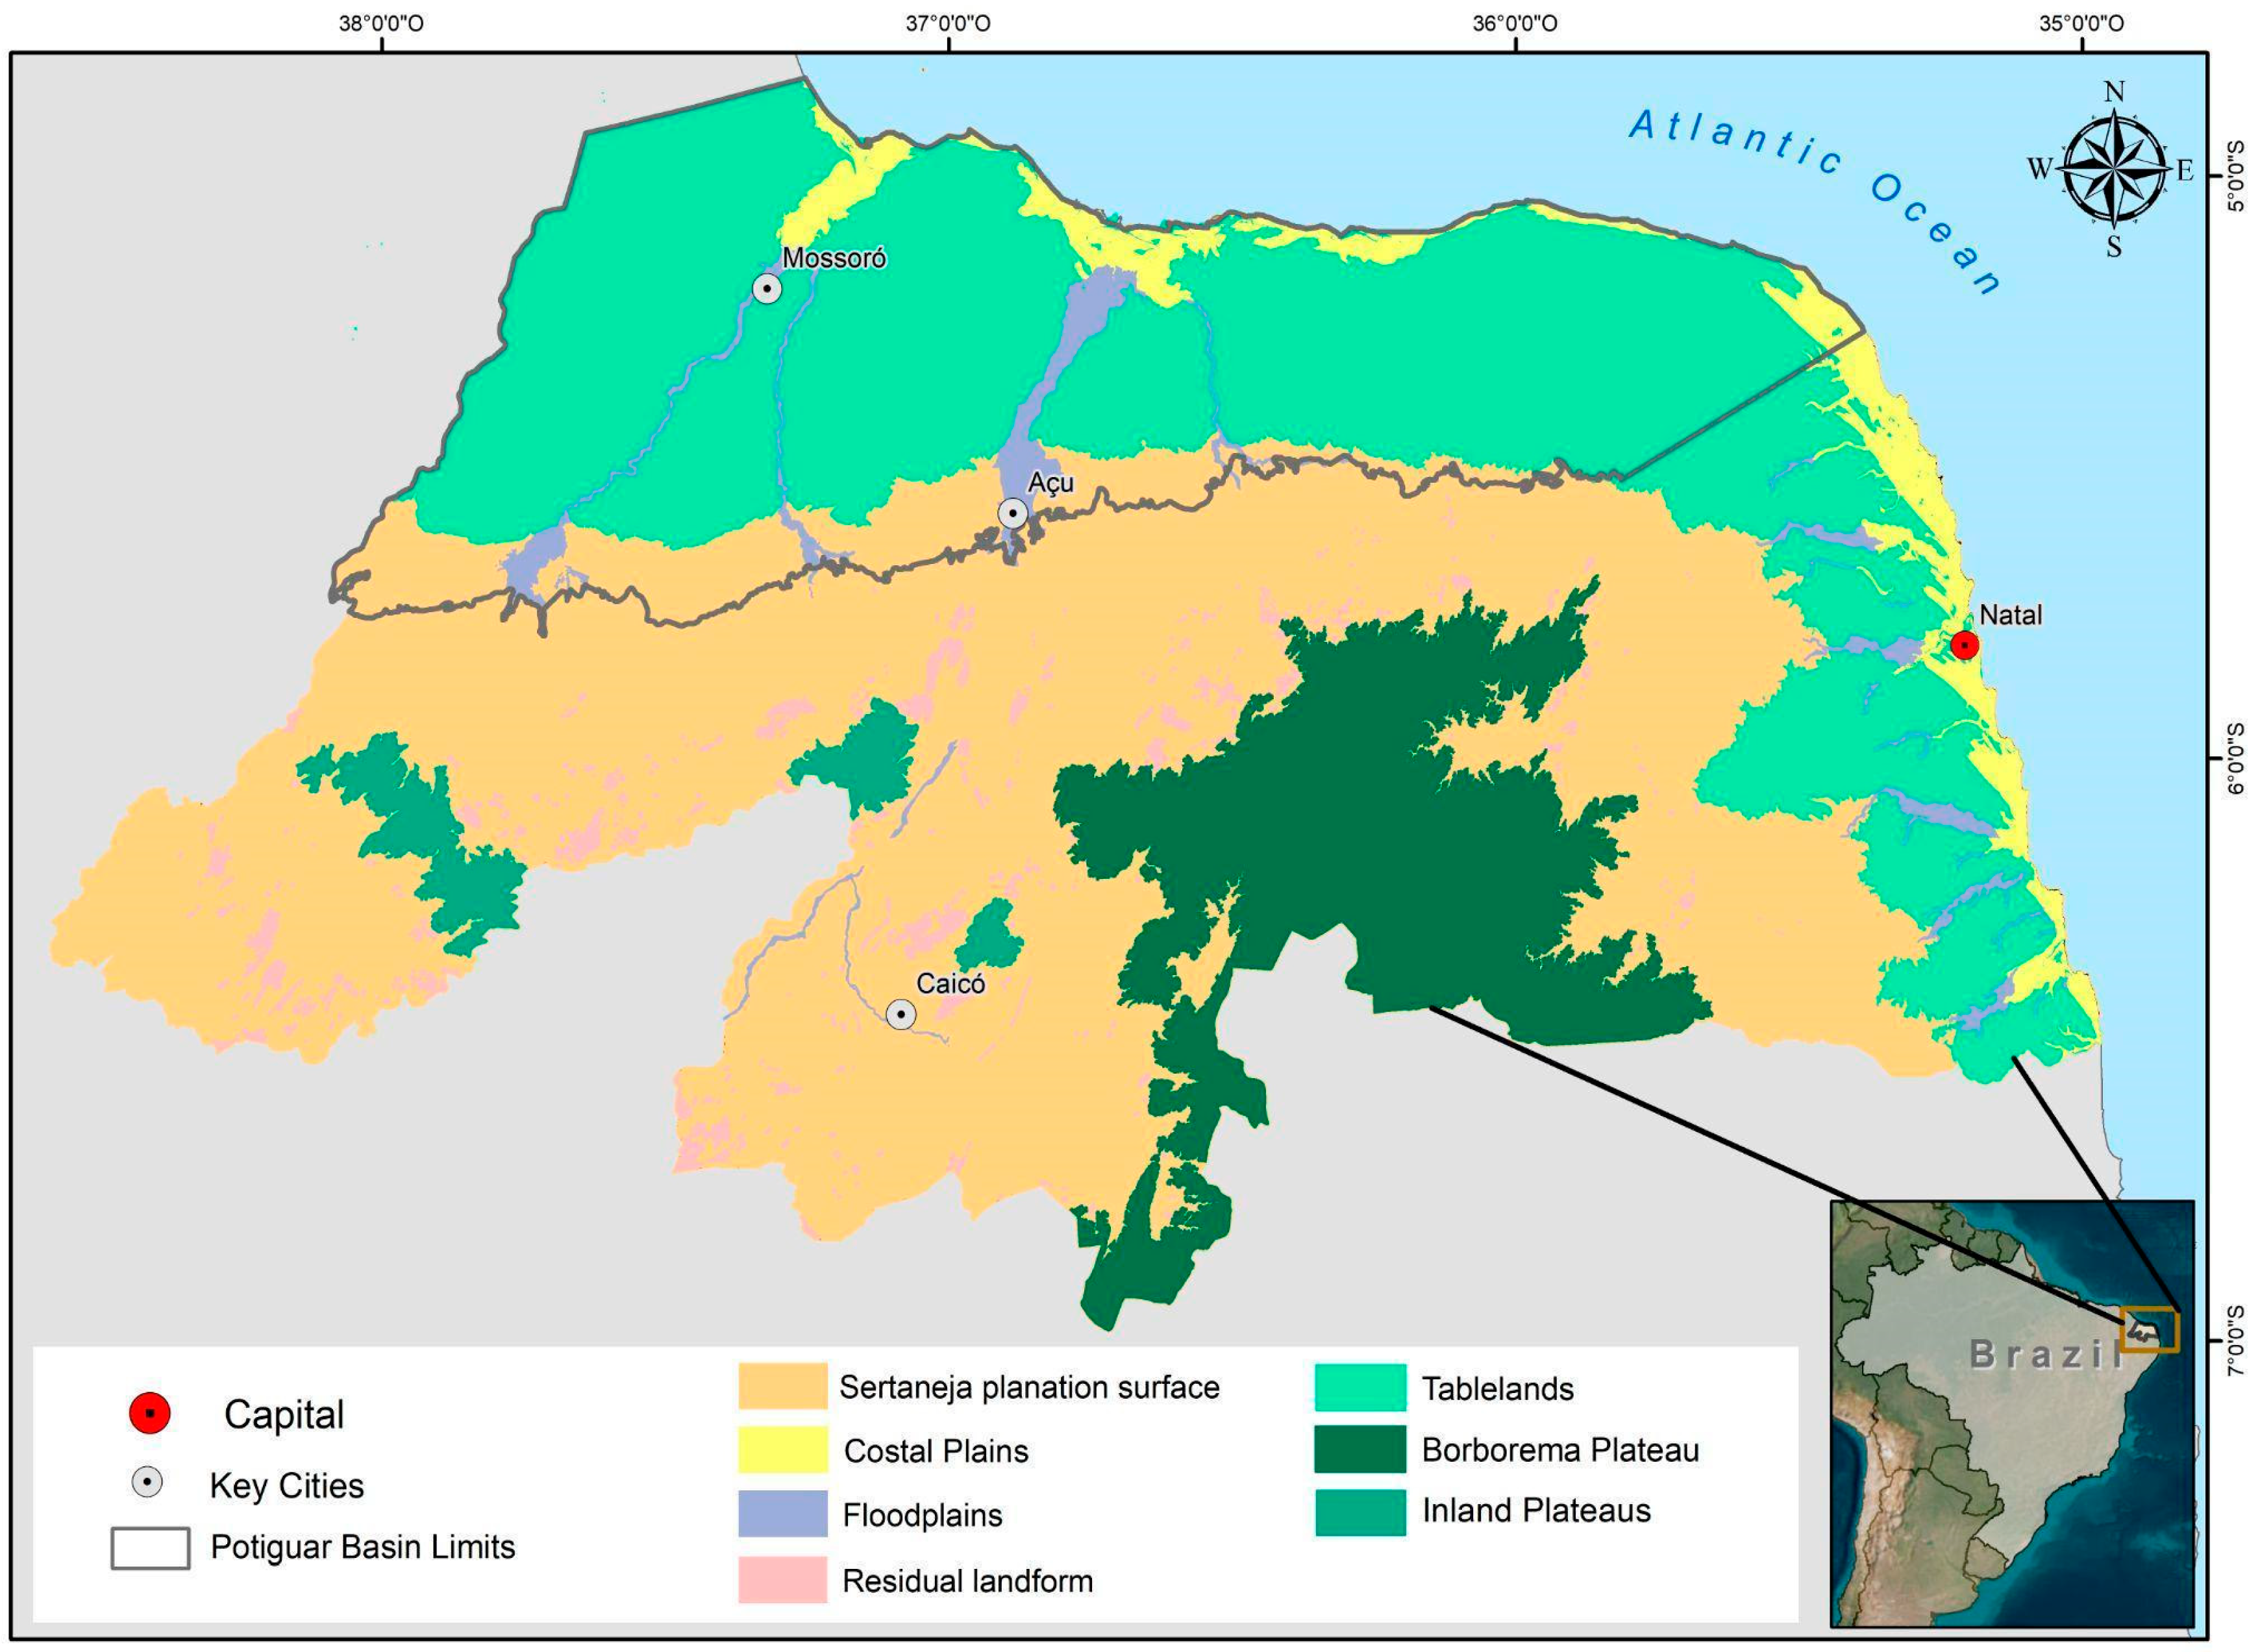
The state of Rio Grande do Norte, located in the northeastern region of Brazil (Figure 1), encompasses an area of 52,809.6 km2 and has a population of 3,302,729 inhabitants []. Geologically, the state is situated in the northern segment of the Borborema Province, as described by Almeida et al. (1981) []. Its lithostructural framework comprises three principal geological domains: the Jaguaribeano, Piranhas–Seridó, and São José de Campestre domains. Each of these domains exhibits distinct lithological features, including sedimentary formations as well as metaplutonic and metavolcanic rocks, with ages ranging from the Archean to the Neoproterozoic. In addition to this crystalline basement, the northern portion of the state is overlain by the Meso-Cenozoic Potiguar Basin (Figure 1), a marginal basin that began to form following the opening of the South Atlantic Ocean. This complex geological setting underpins the state’s rich geodiversity and directly influences its hydrological and geomorphological characteristics.
Figure 1. Simplified Geomorphological Map of the Study Area. Source: Adapted with permission from Diniz et al. (2017) [].
The relief of Rio Grande do Norte is the product of a sequence of three major geological events: the Brasiliano Orogeny, the fragmentation of Gondwana, and Cenozoic reactivations []. These events contributed to the structuring of the Potiguar Basin sediments, forming coastal plains, coastal tablelands, and residual plateaus along the north coast. In the interior crystalline basement terrain, notable landforms include the Eastern Interplateau Depression, the Piranhas–Açu and Apodi–Mossoró depressions, the Borborema Plateau, and the Sertanejo residual plateaus (Figure 1) [].
Climatically, the state is primarily influenced by the Intertropical Convergence Zone (ITCZ), which constitutes the main rainfall-generating system in northern Northeast Brazil. Average annual rainfall varies significantly across the territory, ranging from approximately 1250 mm/year in the eastern and western regions to around 400 mm/year in the central semi-arid zone [].
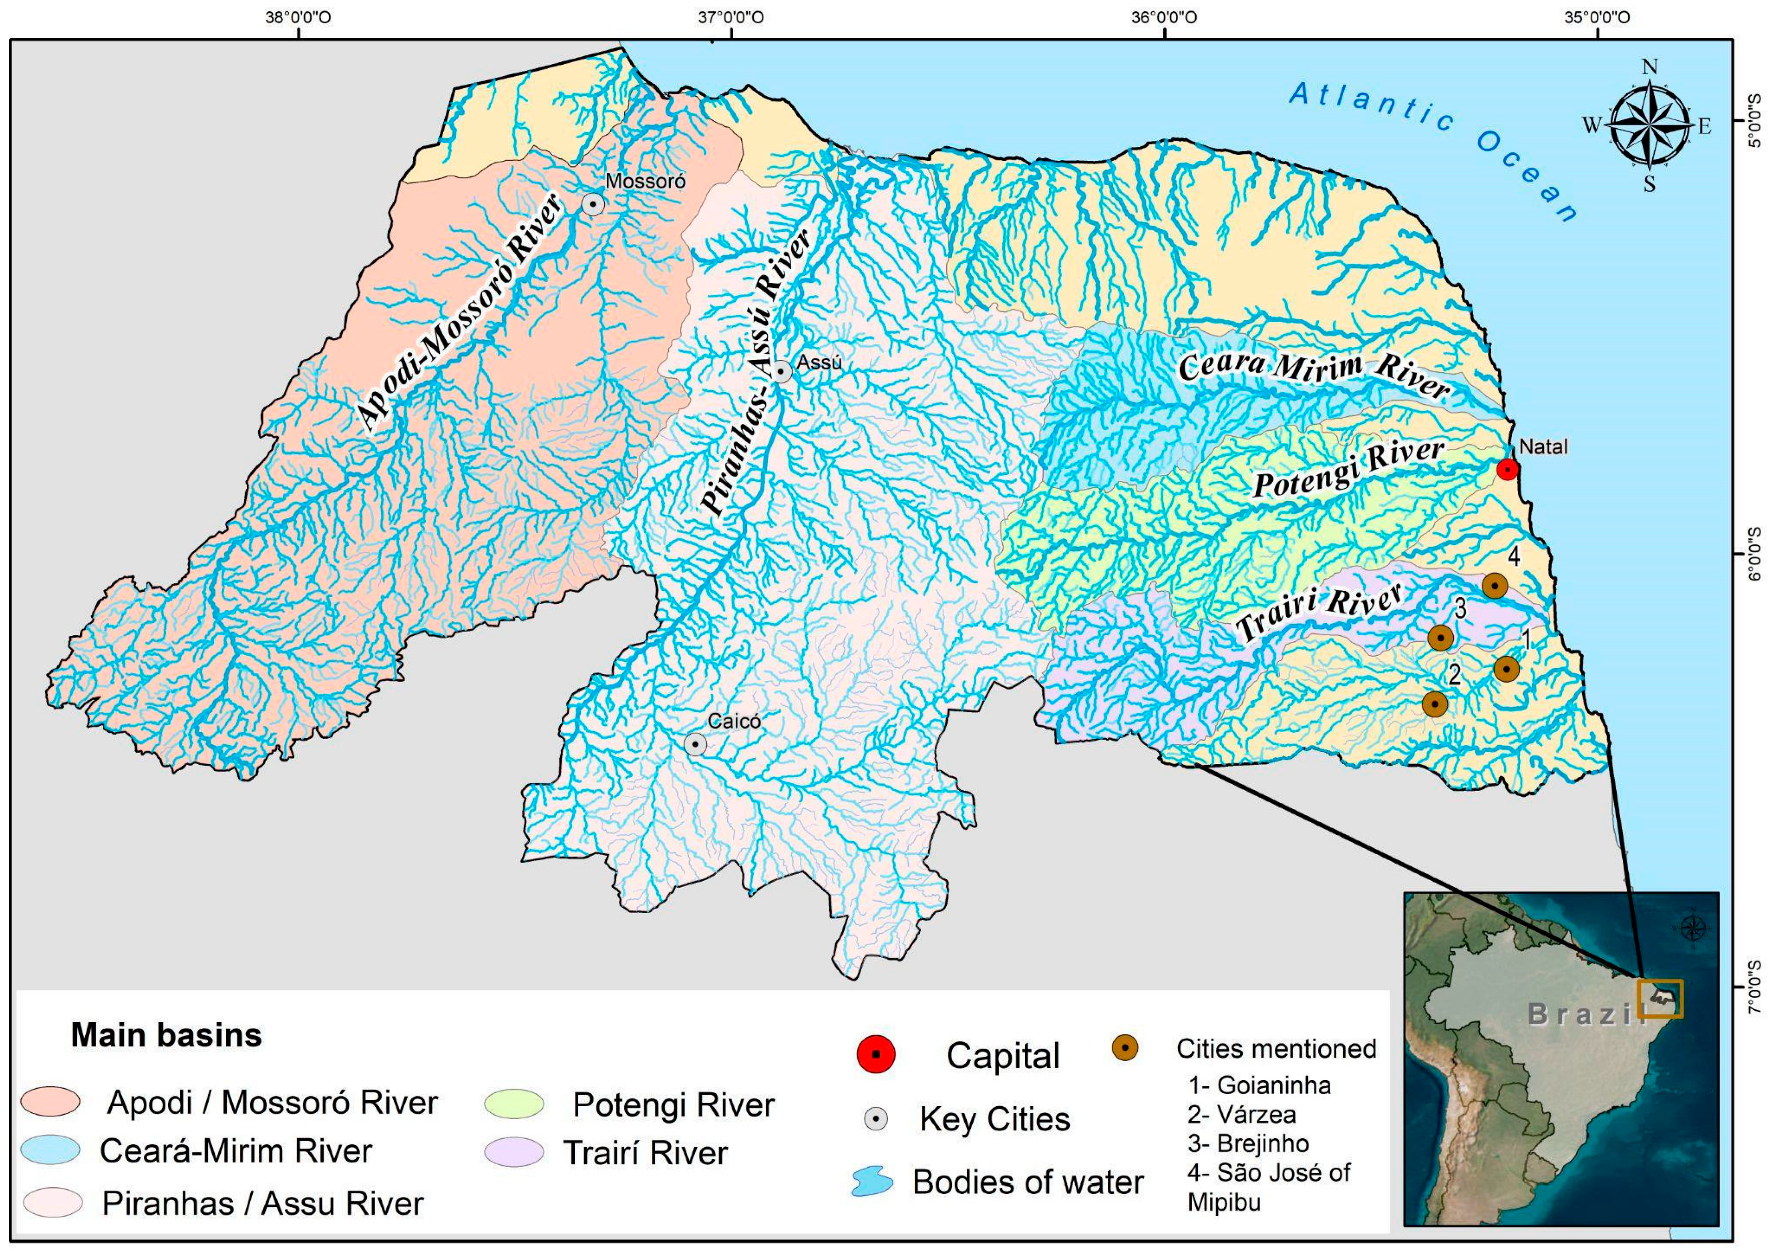
Despite its relatively small territorial extent, Rio Grande do Norte exhibits notable hydrological diversity, with water resources distributed unevenly. The eastern coast, characterized by higher precipitation and extensive dune fields, supports the formation of numerous lagoons and is marked by small, densely packed hydrographic basins. Among these, the Potengi River Basin is the most prominent, alongside the Ceará–Mirim and Trairi river basins (Figure 1). This hydrological configuration contrasts with that of the interior regions, particularly the central and western zones, where hydrographic basins are larger and predominantly intermittent. These basins are situated in terrains lowered by pediplanation processes, often at elevations below 50 m, and support the flow of major rivers such as the Piranhas–Açu and Apodi–Mossoró toward the northern coast (Figure 2). These rivers are vital for regional water supply, supporting both domestic consumption and agricultural irrigation []. In contrast, elevated areas shaped on the Martins Formation—composed of sedimentary layers resting atop crystalline basement rocks—reach altitudes of 600 to 780 m. Such formations outcrop predominantly in the Piranhas–Açu and Apodi–Mossoró river basins, where they originate distinct topographical features and contribute to the formation of waterfalls. These landforms represent a geomorphological transition between the wetter eastern coastal region and the semi-arid interior, where river drainage is more diffuse and occurs over less rugged terrain.
Figure 2. Main river basins and surface water bodies in the state of Rio Grande do Norte, Brazil.
Water storage in Rio Grande do Norte is largely dependent on artificial reservoirs, constructed to accumulate runoff. While some of these reservoirs are temporary, others—such as the Armando Ribeiro Gonçalves Dam in the Piranhas–Açu River valley—are critical to the state’s water security. These reservoirs are dispersed across the state, with the greatest concentrations found in the eastern and western regions. The largest reservoirs are typically located near the estuaries of the Piranhas–Açu and Apodi–Mossoró rivers, where they benefit from the hydrodynamic behavior of the basins [].
Rainfall is most abundant in the eastern region, contributing to variations in water availability. Hydrogeologically, the specific discharge of aquifers varies between 3 and 100 m3/h, depending on the lithological characteristics of the geological formations. The spatial distribution of rainfall, reservoir locations, and aquifer discharge capacity highlights the interconnections between climatic, surface water, and groundwater elements.
This variability in rainfall patterns and the resultant water scarcity in certain regions underscore the urgent need for integrated and adaptive water resource management strategies. Such strategies should consider the multiple dimensions of hydrodiversity that influence water availability and access throughout the state.

2.2. Methodology

In the domain of geodiversity quantitative assessment methods, indices have emerged as effective tools for the integrated evaluation of natural resources. A notable contribution in this area was made with the development of an index to identify and differentiate geodiversity across varying levels of richness []. This methodology improves the interpretation of environmental data by integrating variables from pedology, geomorphology, hydrology, geology, and mineral resources. Complementary methodological frameworks [,,] were also key for advancements in geodiversity quantitative assessment.
In Brazil, such a methodological framework has been successfully applied in recent studies [,,]. For example, it sustained the assessment of water resources within the geodiversity context of the state of Ceará, in which the hydrological diversity was emphasized []. It was also adapted to assess the geodiversity in the Amazon Basin using global datasets, with findings indicating increased hydrological diversity in proximity to major river channels, highlighting waterfalls and other prominent features as key components of hydrological geodiversity [].
In the state of Rio de Janeiro, similar index-based techniques were employed to assess the geodiversity [,]. In the municipality of Armação dos Búzios, on the coast of Rio de Janeiro state, geodiversity data were correlated with patterns of urban expansion [].
In Ceará State, studies using Geographic Information Systems (GIS) have revealed substantial spatial variation in hydrological indices, particularly in rainfall (ranging from 284 mm to 1400 mm annually) and river discharge (ranging from 7 m3/s to 12,069 m3/s), depending on the river analyzed [].
In Rio Grande do Norte state, Dias et al. (2021) [] applied a Geodiversity Index to identify areas of high geodiversity. The study used a grid-based approach (5.5 × 5.5 km2) over maps of lithology, mineral occurrences, geomorphology, pedology, and hydrography to calculate thematic subindices that were combined to create a geodiversity index map. The results indicate that most of the state exhibits low geodiversity, with areas of high geodiversity occurring predominantly in the Seridó, Center-East, and Eastern Coast regions, where a greater concentration of diverse geodiversity features is observed.
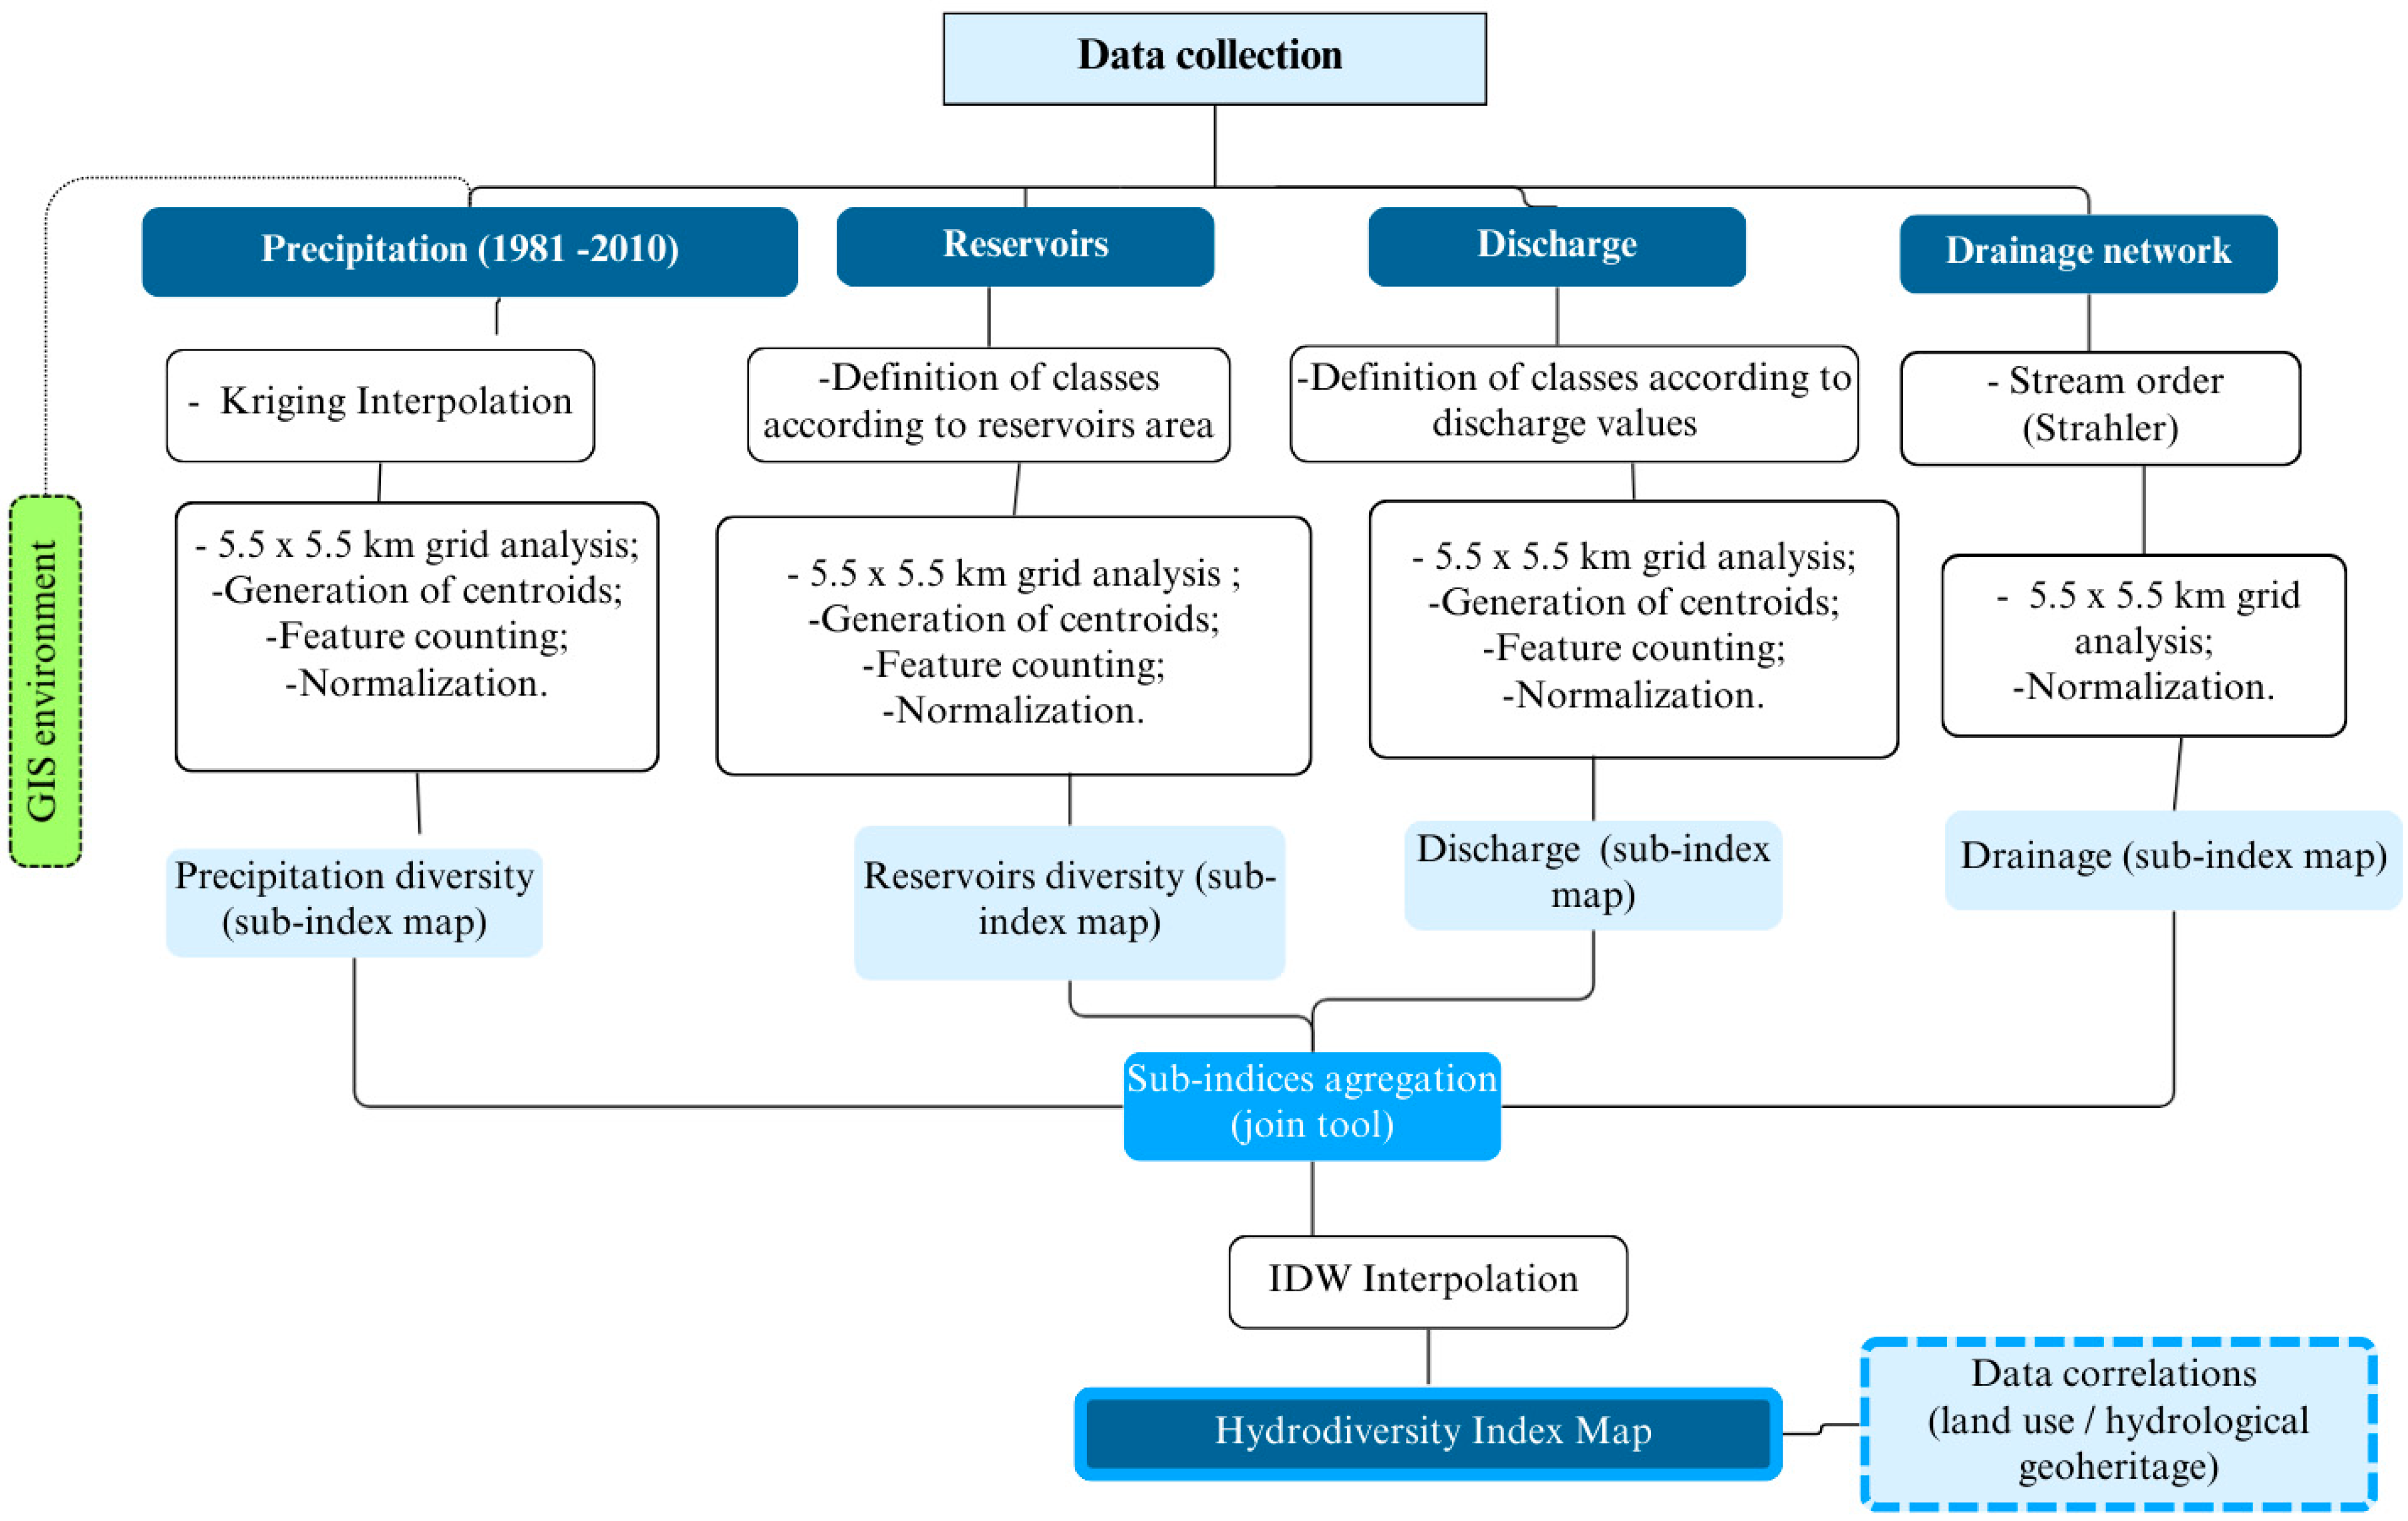
To expand the analysis of the hydrological component of geodiversity in Rio Grande do Norte, we adopted the methodology of Pereira et al. (2013) [] as a foundational framework. In the same manner that a geodiversity index is the aggregate of its subindices, a Hydrodiversity Index is the sum of the variables employed in its calculation. The overall methodology and analytical workflow are illustrated in Figure 3. In this study, a Hydrodiversity Index incorporates both general and specific aspects of hydrodiversity (Figure 4), using some of the criteria proposed by Araújo (2016) [] as a reference. The analysis employed a 5.5 × 5.5 km2 grid, consistent with the spatial resolution used in the Geodiversity Index developed by Dias et al. (2021) [] for Rio Grande do Norte state.
Figure 3. Schematic representation of the methodological procedures carried out as part of this work, with a view to quantitatively assessing the hydrological diversity (hydrodiversity) of the state of Rio Grande do Norte, Brazil, and analyzing correlations with land use and the occurrence of hydrological geoheritage.
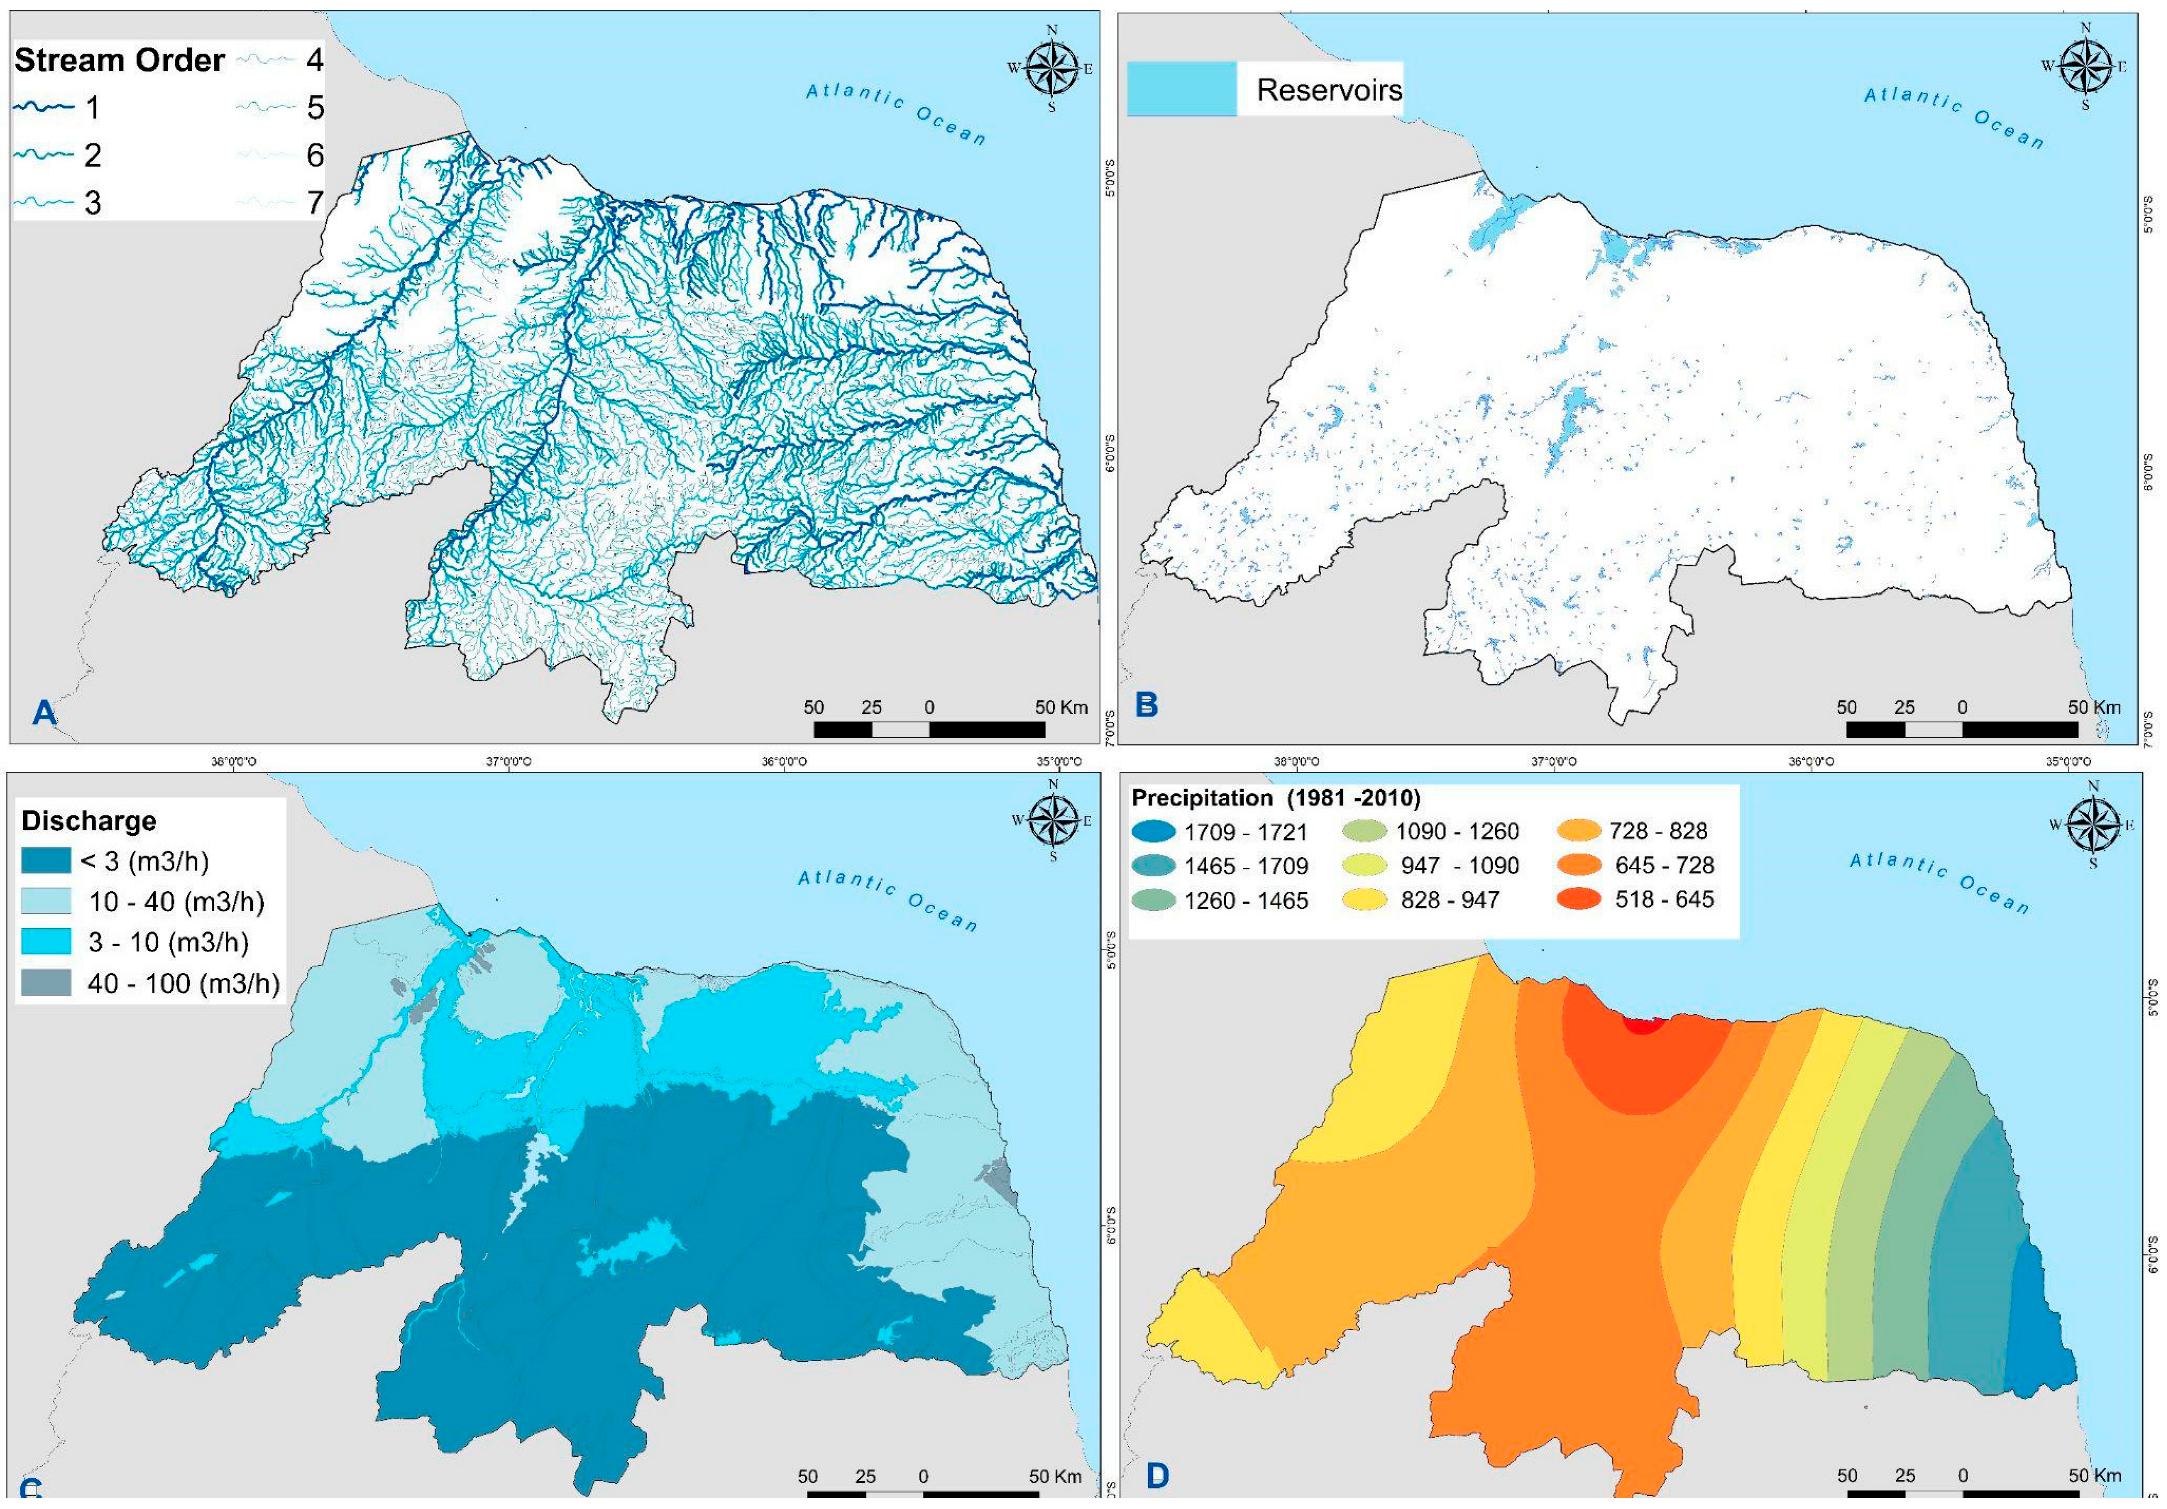
Figure 4. Cartographic data used to generate the hydrodiversity sub-indices for the state of Rio Grande do Norte, Brazil: (A) Hydrographic network with stream order classification; (B) Spatial distribution of water reservoirs; (C) Surface water discharge (flow rate) map; (D) Average annual precipitation map for the period 1981–2010.
The variables integrated into the analysis include average precipitation over 30 years, land use and land cover, river discharge distribution (as proposed by Araújo et al. (2015) []), the presence of reservoirs, and river hierarchy based on stream order.

2.2.1. Precipitation

Thirty-year average annual rainfall (1981–2010) was sourced from the Brazilian National Meteorological Institute (INMET) [], selected for their broader data availability (Figure 4D). Recent datasets have shown a reduction in the number of operational meteorological stations—from eight to five—limiting spatial coverage.
For the precipitation sub-index, 30-year climatological normals (1981–2010) were used, derived from data collected at eight meteorological stations distributed across the study area. Spatial interpolation was performed using the Kriging method, which is widely regarded as the most suitable technique for rainfall data due to its unbiased estimations and geostatistical robustness []. The resulting interpolated map was reclassified into nine discrete precipitation intervals, with values ranging from 1 (lowest rainfall) to 9 (highest rainfall). These classes were then normalized using the Least Possible Value (LPV) method, transforming the range to a scale from 0 to 1. The outcome was a sub-index map representing the normalized spatial distribution of precipitation within the study area.

2.2.2. Discharge

Discharge data were obtained in vector format from the National Water Agency [], at a 1:500,000 scale, and specific discharge values were extracted for each hydrological unit (Figure 4C). For the discharge sub-index, data on hydrogeological potential were 4utilized, specifically incorporating specific discharge values per aquifer. These values were categorized into four distinct classes based on discharge magnitude and reclassified with integer values from 1 to 4, where higher values correspond to greater specific discharge, as detailed in Table 1. This classification facilitated the construction of the discharge sub-index within the broader Hydrodiversity Index framework.
Table 1. Classification of specific discharge values and their corresponding scores used in the evaluation of the discharge sub-index supporting the Hydrodiversity Index in the State of Rio Grande do Norte, Brazil.

2.2.3. Reservoirs

Reservoir data were sourced in shapefile format from the Rio Grande do Norte Institute for Sustainable Development and the Environment [], detailing the spatial extent of reservoir areas (Figure 4B). Estuaries along the eastern coast were included due to their ecological significance, complementing the pre-existing data that already accounted for estuaries along the northern coast.
For the reservoirs sub-index, the primary mapped features included dam lakes, estuaries, reservoirs, and lagoons, with considerable variation in their spatial extent. Priority was given to perennial water bodies, as they offer greater hydrological significance compared to temporary features. In alignment with Brazil’s Forest Code (Law No. 12.651/2012), which designates the surroundings of natural lakes exceeding 20 hectares as Permanent Preservation Areas (APPs), only features with surface areas larger than 20 hectares were considered. This criterion was applied to prevent the overrepresentation of small, concentrated water bodies with limited ecological or hydrological relevance. Subsequently, water bodies exceeding this threshold were reclassified and assigned weights according to their size and relevance, as outlined in Table 2.
Table 2. Classification of reservoir area values and their corresponding scores used in the evaluation of the reservoirs sub-index supporting the Hydrodiversity Index in the State of Rio Grande do Norte, Brazil.

2.2.4. Stream Order

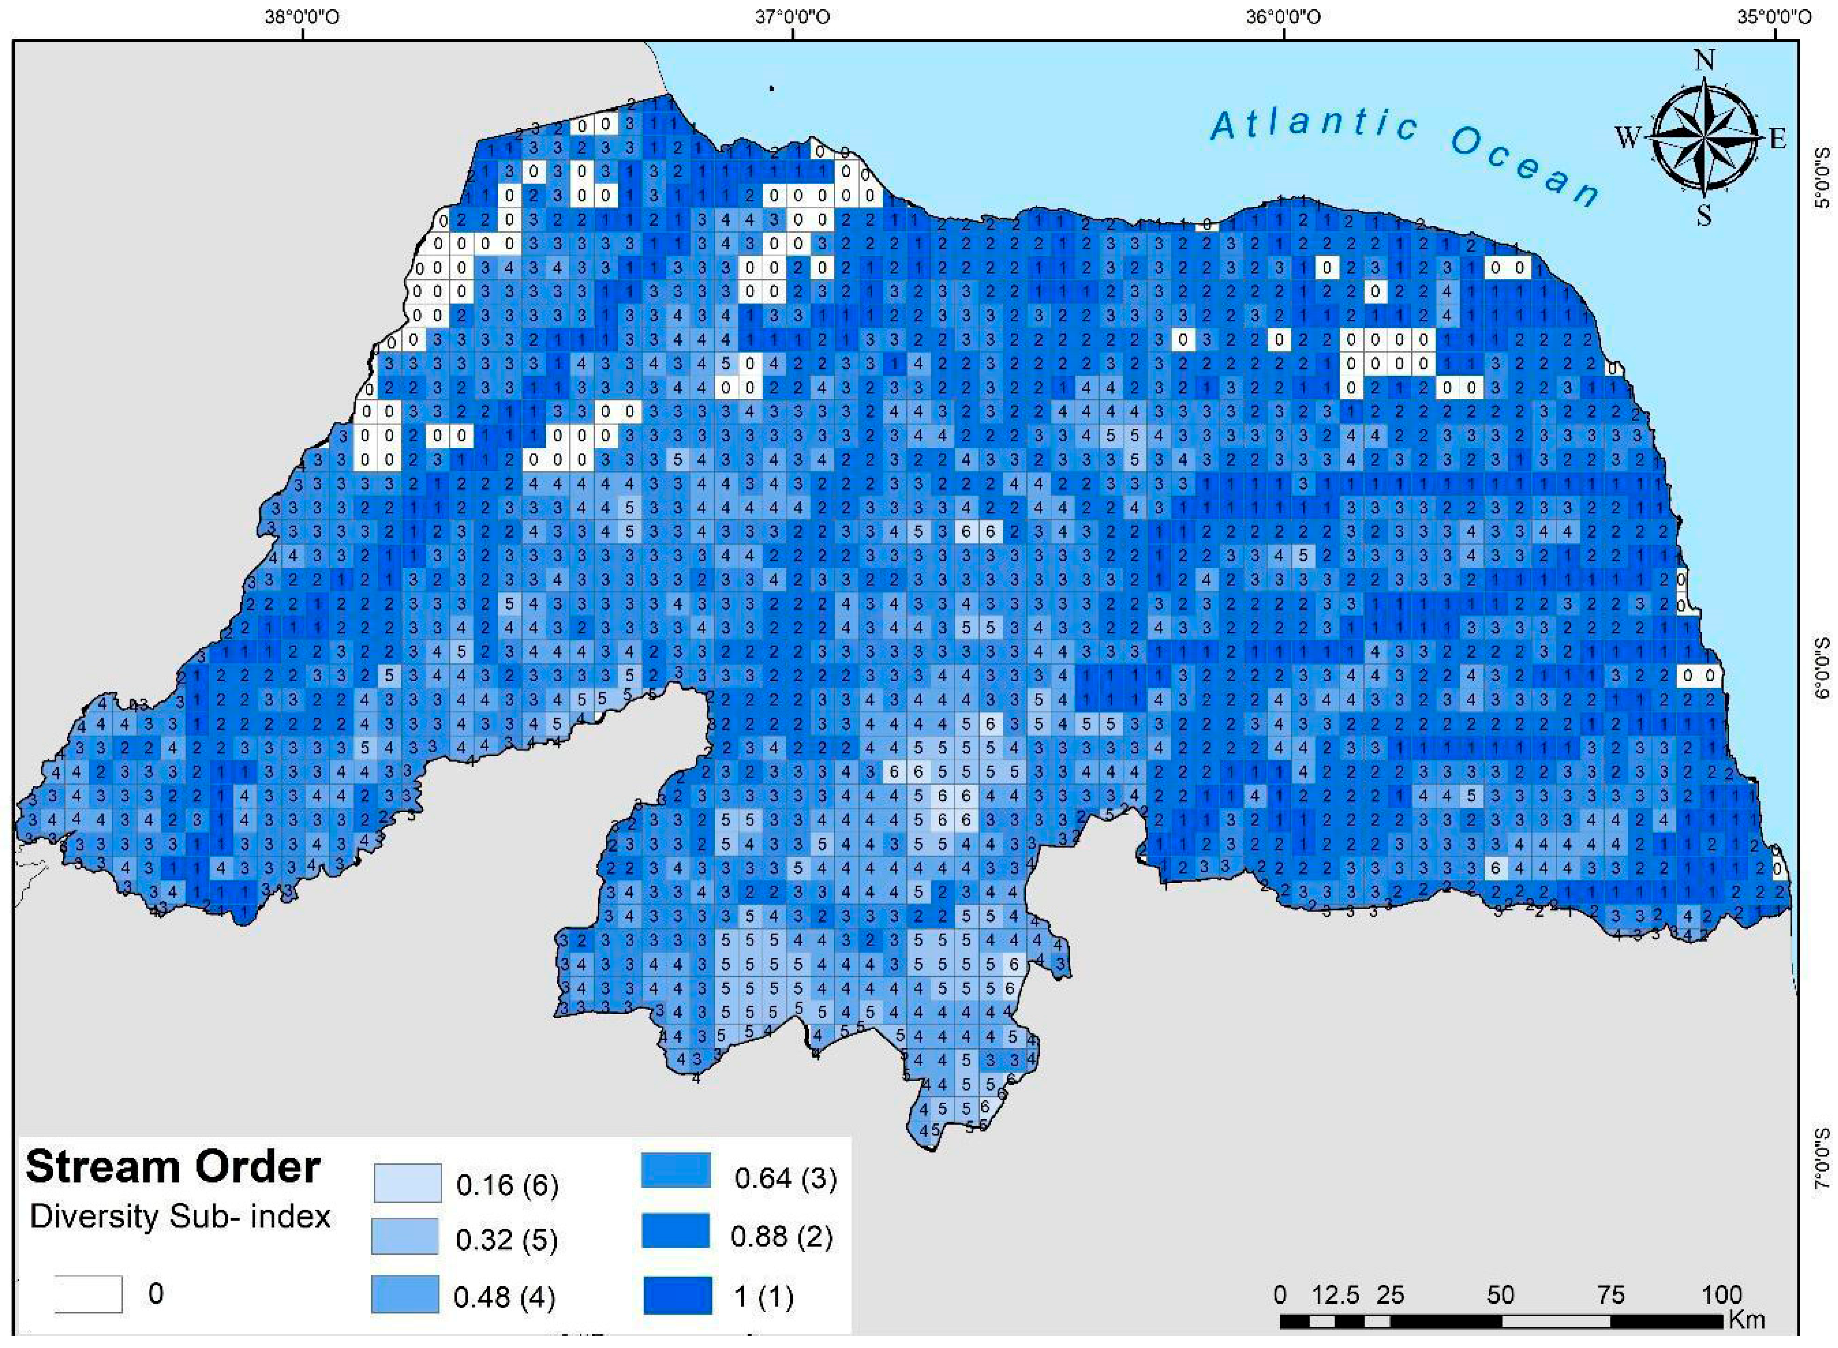
Hydrography data classified by stream order (Figure 4A), following the methodology proposed by Araújo and Pereira (2017) [], were obtained from the Geological Survey of Brazil [] at a 1:500,000 scale. This dataset was selected because it includes information on surface runoff, which is essential for identifying areas with higher runoff intensity [].
Based on this dataset, an integrated spatial analysis was conducted using Geographic Information System (GIS) tools within the open-source software QGIS 3.34. The sub-indices for discharge, reservoirs, and precipitation were quantified by generating centroids and counting the number of features within each grid unit. To avoid redundancy, each multipart geometry was counted only once, following the methodology outlined by Gonçalves et al. (2020) [].
For the stream order sub-index, a correlation between stream hierarchy and the grid cells was established, generating a tabulated record of hierarchical occurrences, as previously implemented by Dias et al. (2021) [] and Araújo and Pereira (2017) []. The hydrographic features were classified based on their hierarchical importance, with first-order streams assigned the highest weights. This approach is grounded in the premise that first-order rivers serve as key indicators of surface water availability due to their abundance and fine-scale representation of hydrological flow. To spatially integrate stream order values with the analytical grid, the union geoprocessing function was applied. This allowed the hierarchical information embedded in the hydrography vector data to be associated with the corresponding grid cells, in accordance with the methodologies employed by Araújo (2016) [] and Dias et al. (2021) [].

2.2.5. Index Aggregation

Following feature counting, each sub-index was normalized, and the resulting values were reclassified in the attribute table into new classes ranging from 0 to 1. This reclassification was based on the Maximum Possible Value (MPV) approach, which standardizes values relative to the highest potential score within each sub-index, thereby minimizing distortion and enabling a more accurate representation of the data [].
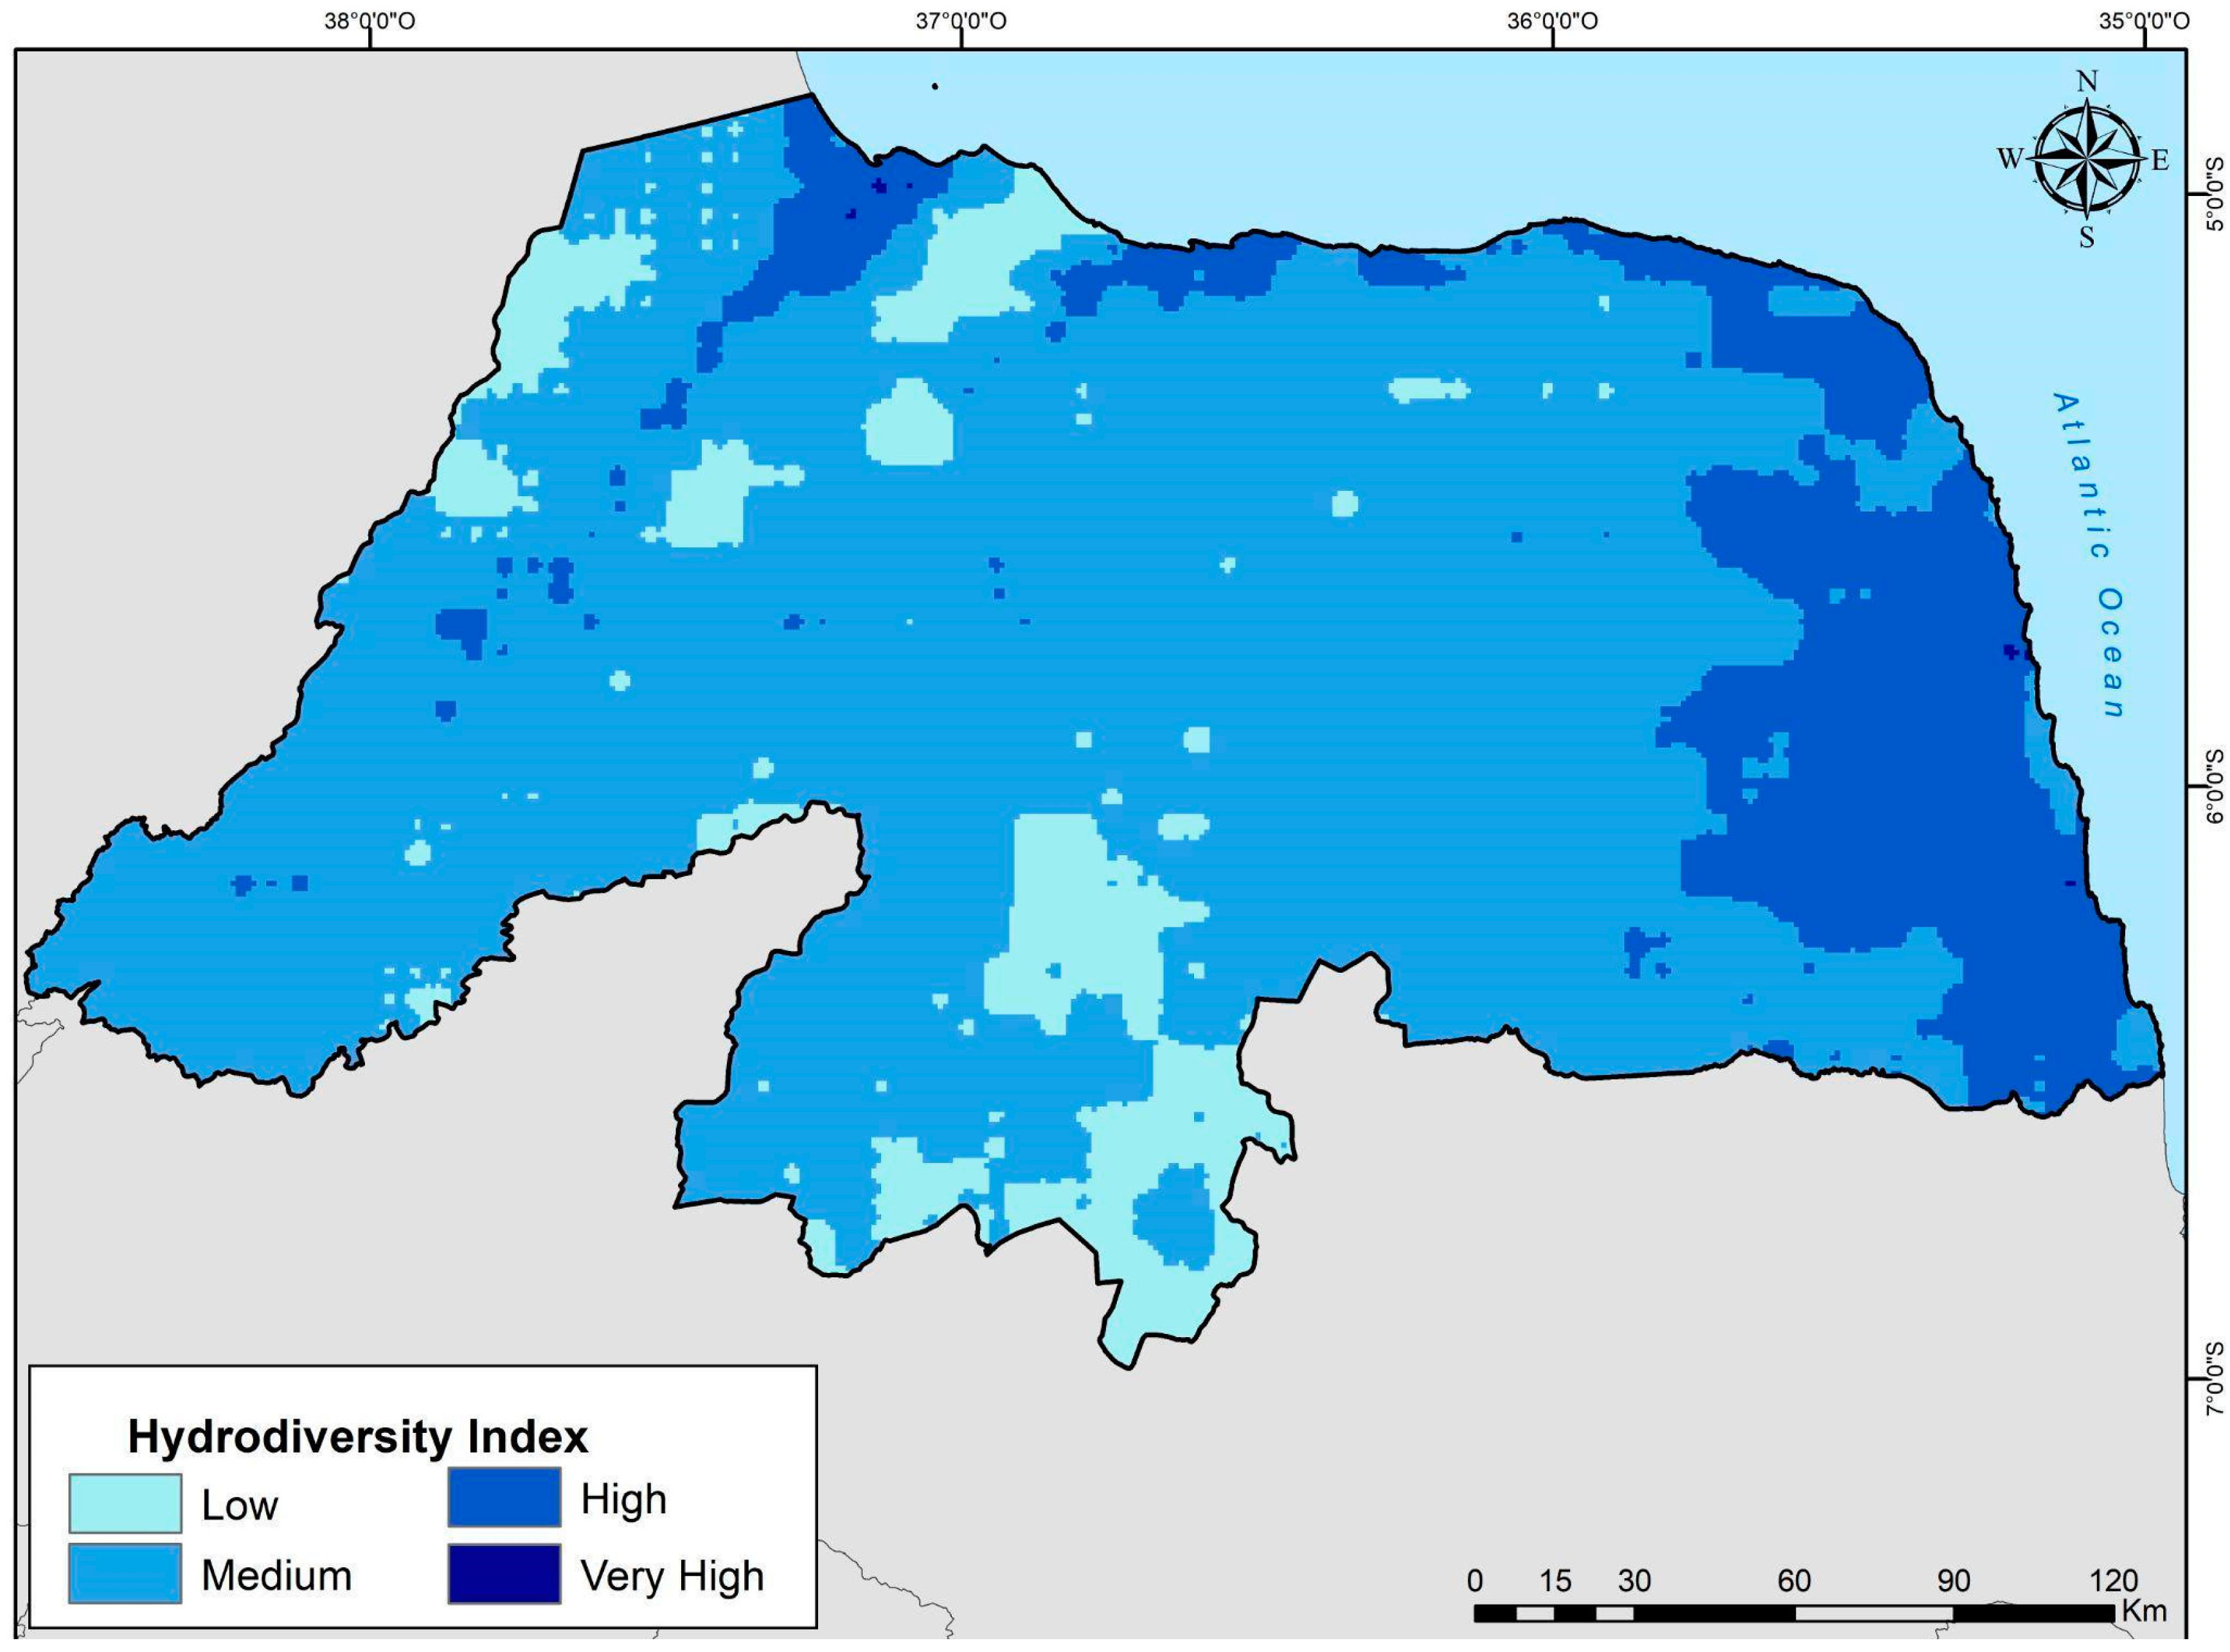
The sum of the normalized sub-indices produced a composite Hydrodiversity Index map. To improve spatial interpretation, the Inverse Distance Weighted (IDW) interpolation method was applied, which estimates values at unsampled locations based on the proximity of known values, generating a smoothed spatial distribution []. The interpolated values were subsequently reclassified into four categories—low, medium, high, and very high—using a blue color scale. Classification thresholds were aligned with the MPV framework and assigned the following ranges: 0–1 (low), 1–2 (medium), 2–3 (high), and 3–4 (very high), as detailed in Table 3.
Table 3. Classification thresholds of the Hydrodiversity Index of the Rio Grande do Norte State, Brazil, based on the sum of the normalized four sub-indices.
As noted by Dias et al. (2021) [], the use of IDW interpolation supports balanced spatial representation and facilitates the visualization of geodiversity classification.

2.2.6. Comparison with Land Use and Hydrological Heritage

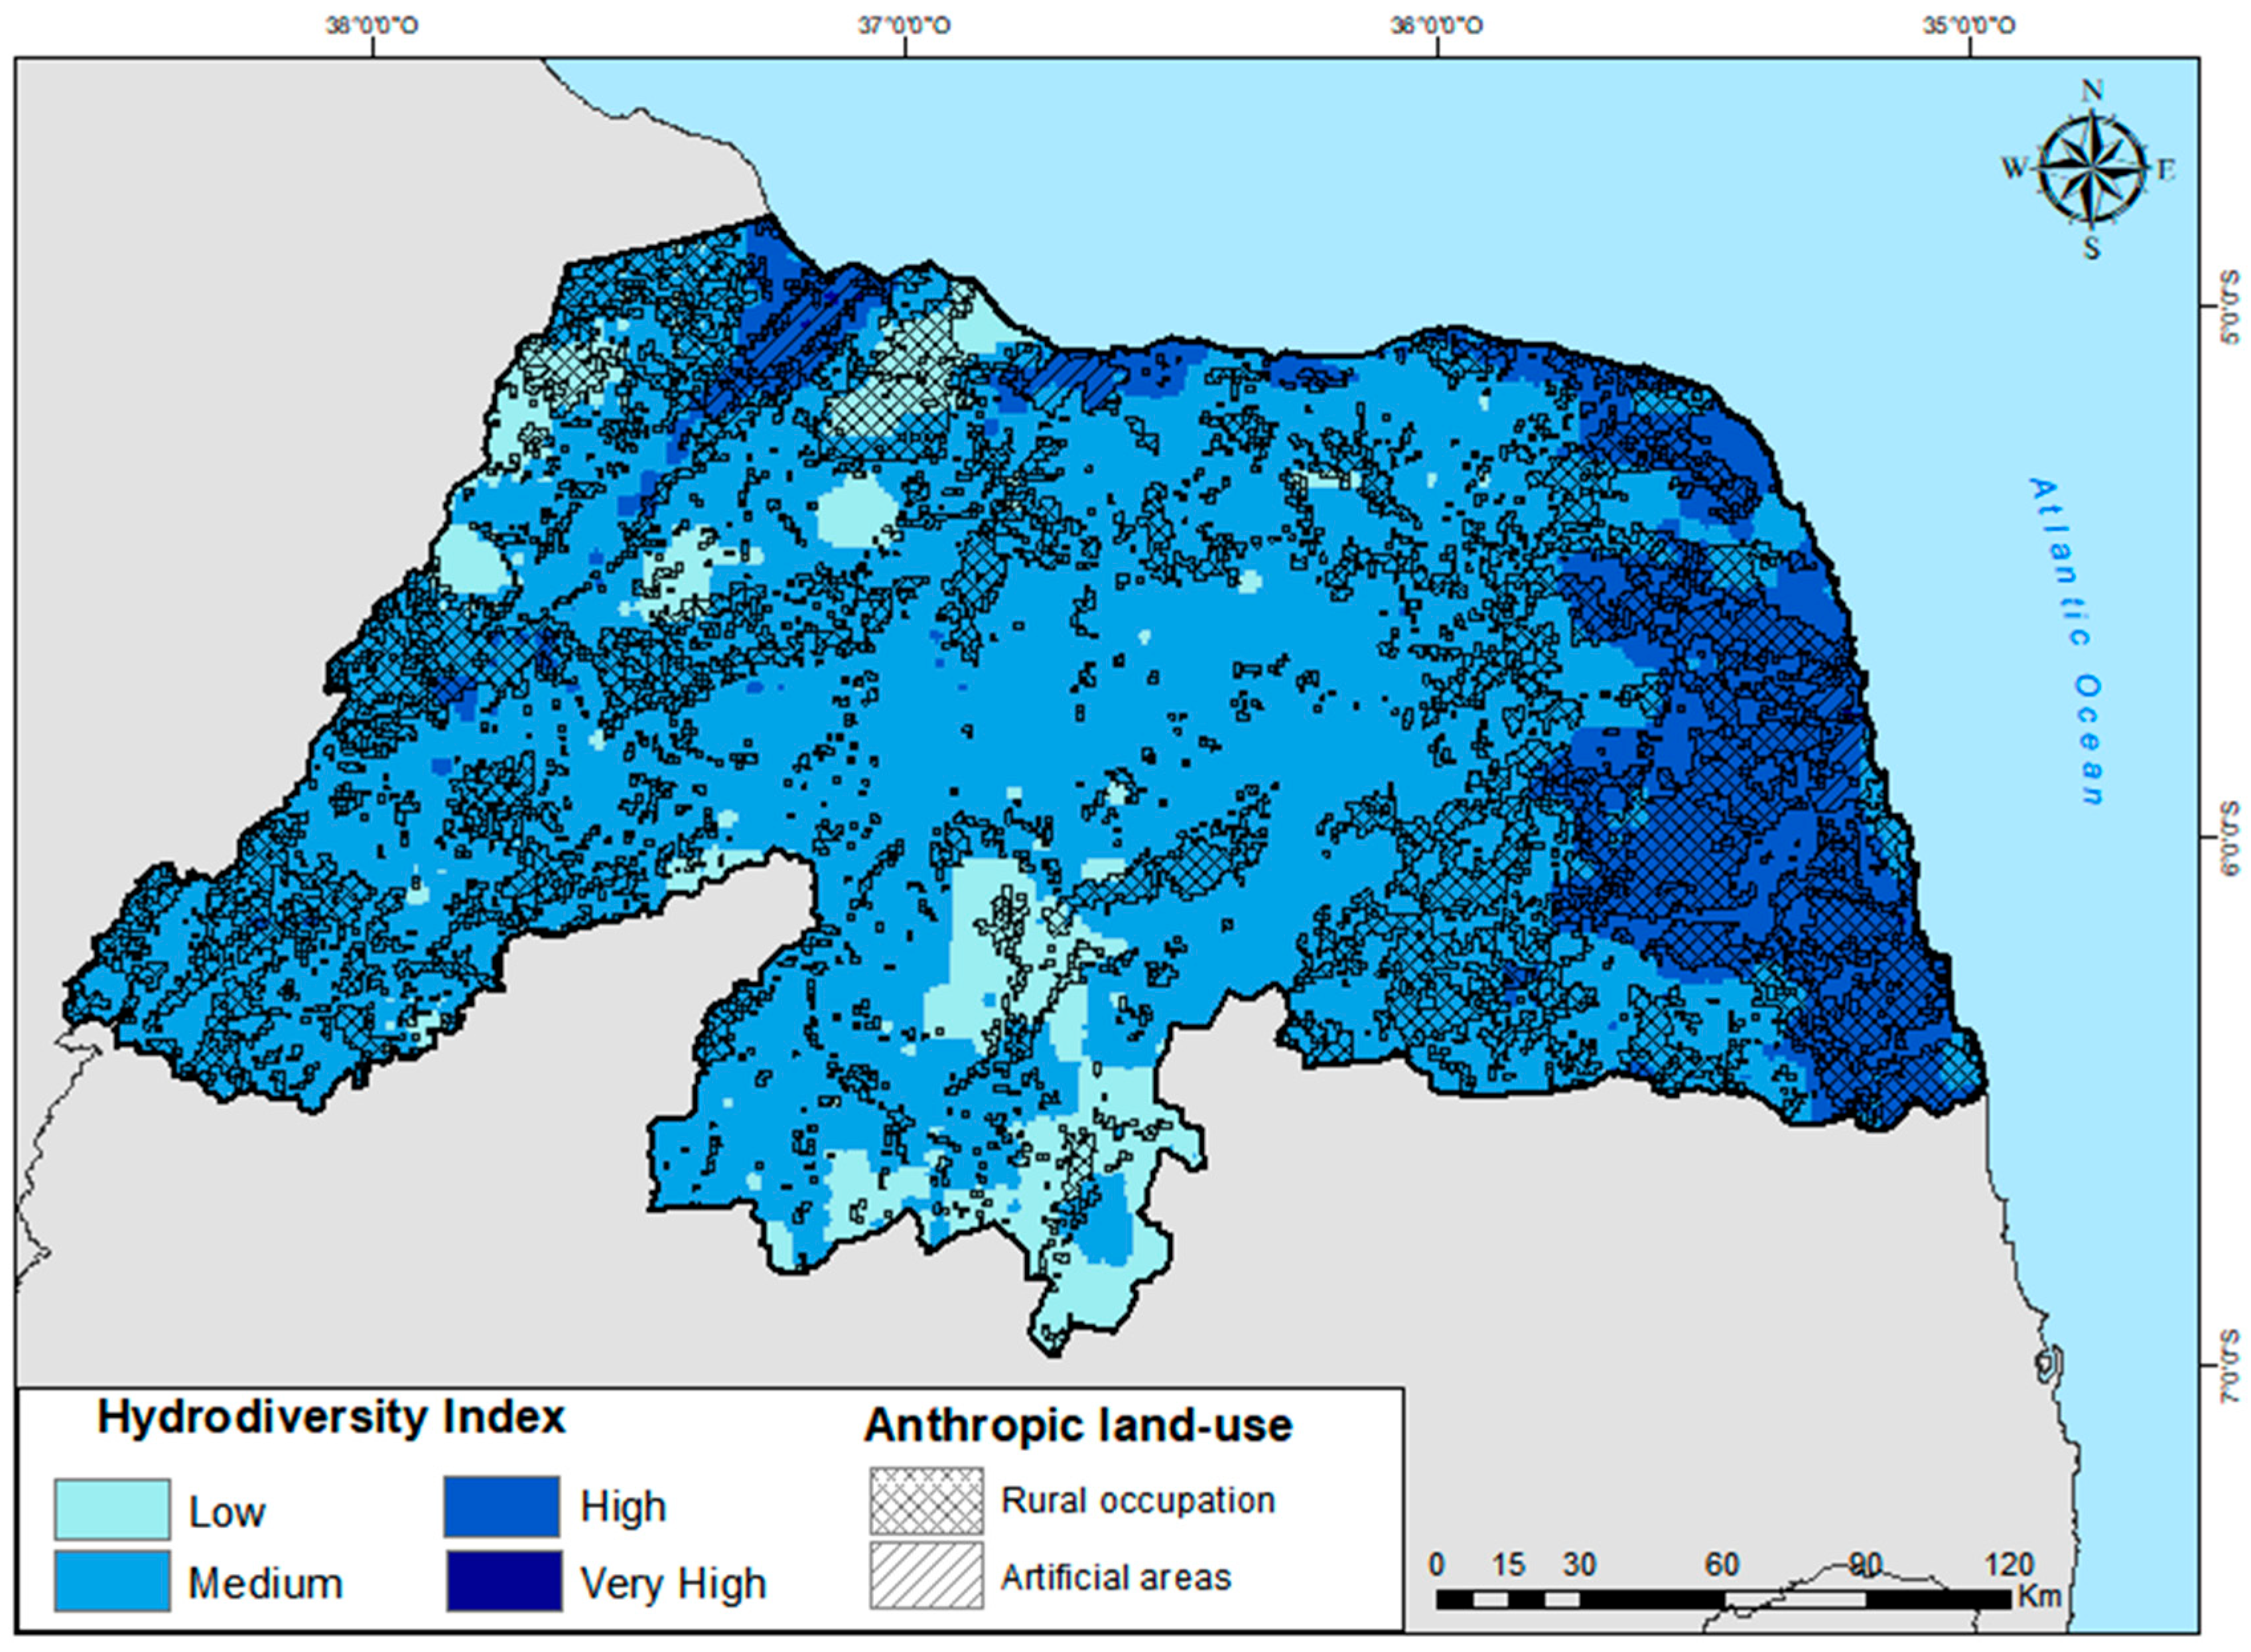
To assess the relationship between the distribution of water resources and the spatial configuration of key anthropogenic pressures, land use, and land cover data from the Brazilian Institute of Geography and Statistics [] were incorporated into the analysis. This dataset includes twelve distinct land use classes, encompassing both anthropogenic and natural features. For the purposes of this study, two classes were considered: artificial areas and rural occupation. These were chosen for their relevance in representing anthropic land use patterns. The resulting land use map was superimposed onto the hydrodiversity index surface generated via the Inverse Distance Weighted (IDW) interpolation method, thereby enabling a spatially integrated analysis of the relationship between land use and water resource distribution.
Furthermore, the study included a comparative analysis involving the 22 hydrosites inventoried in Rio Grande do Norte based on representativeness, integrity, rarity, and scientific knowledge criteria [,]. Fifteen of these hydrosites were inventoried in previous studies, with seven additional sites now being added using the same assessment criteria. This comparison aimed to evaluate the correspondence between areas of high hydrodiversity values and the spatial occurrence of hydrological heritage.

3. Results

3.1. Sub-Indices

3.1.1. Precipitation Diversity Sub-Index

The precipitation diversity sub-index map was generated from annual rainfall data collected over thirty years (1981–2010) and interpolated within a GIS environment (Figure 5). This map provides a spatial representation of the state, highlighting the stark contrast in precipitation levels between the eastern coastal region and the central interior of Rio Grande do Norte.
Figure 5. Precipitation diversity sub-index map of the state of Rio Grande do Norte, Brazil. Data source: Thirty-year average annual rainfall (1981–2010) [].

3.1.2. Discharge Diversity Sub-Index

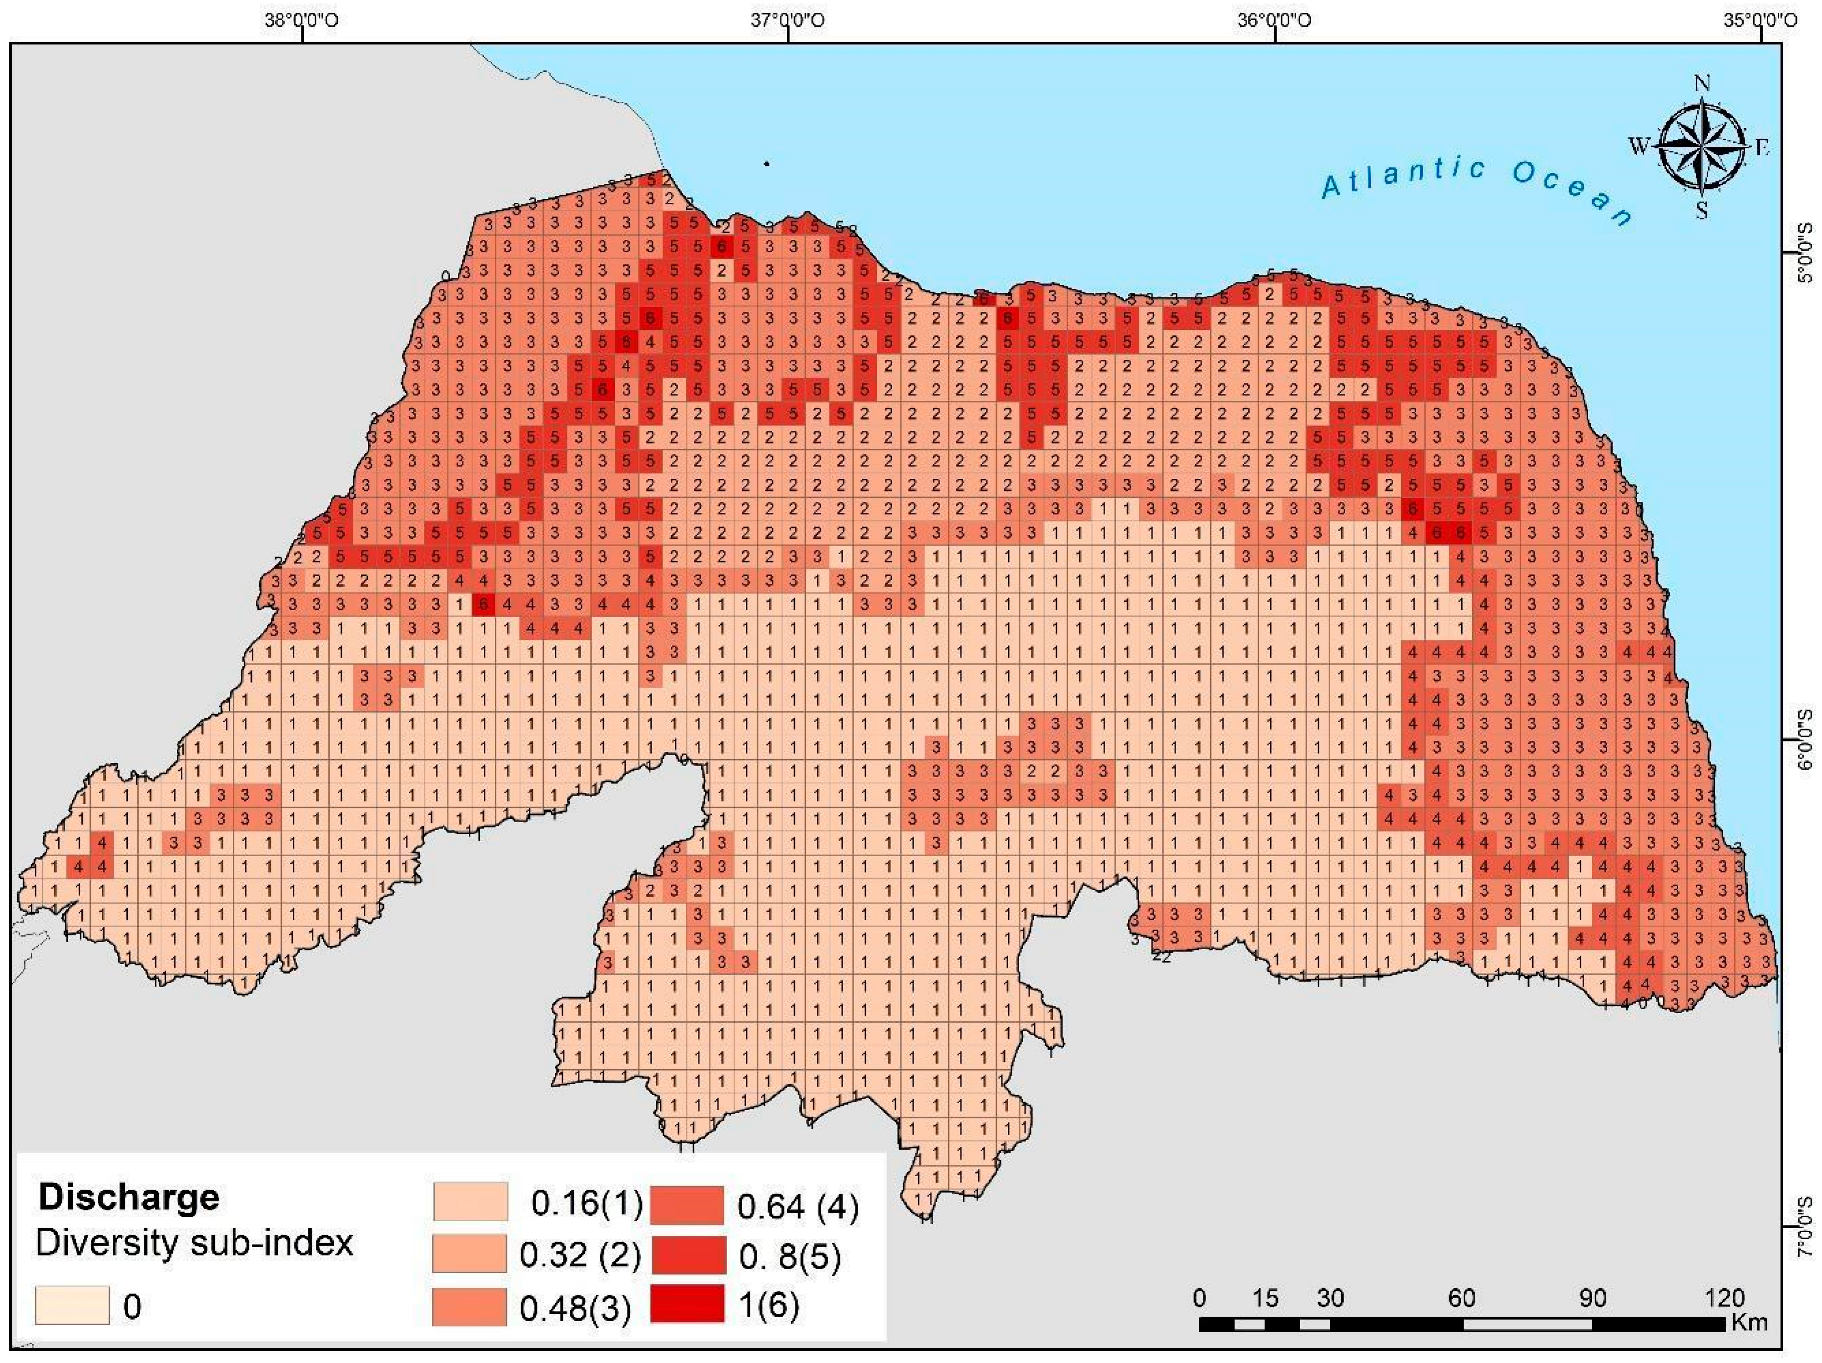
With the discharge diversity sub-index ranging from 1 to 6 points, the highest values are primarily concentrated in areas where major rivers converge, particularly in the middle and lower reaches of the Apodi–Mossoró River basin. These elevated values are especially prominent throughout the Potiguar basin (Figure 6).
Figure 6. Discharge diversity sub-index map of the state of Rio Grande do Norte, Brazil. Data source: National Water Agency [].

3.1.3. Reservoirs Diversity Sub-Index

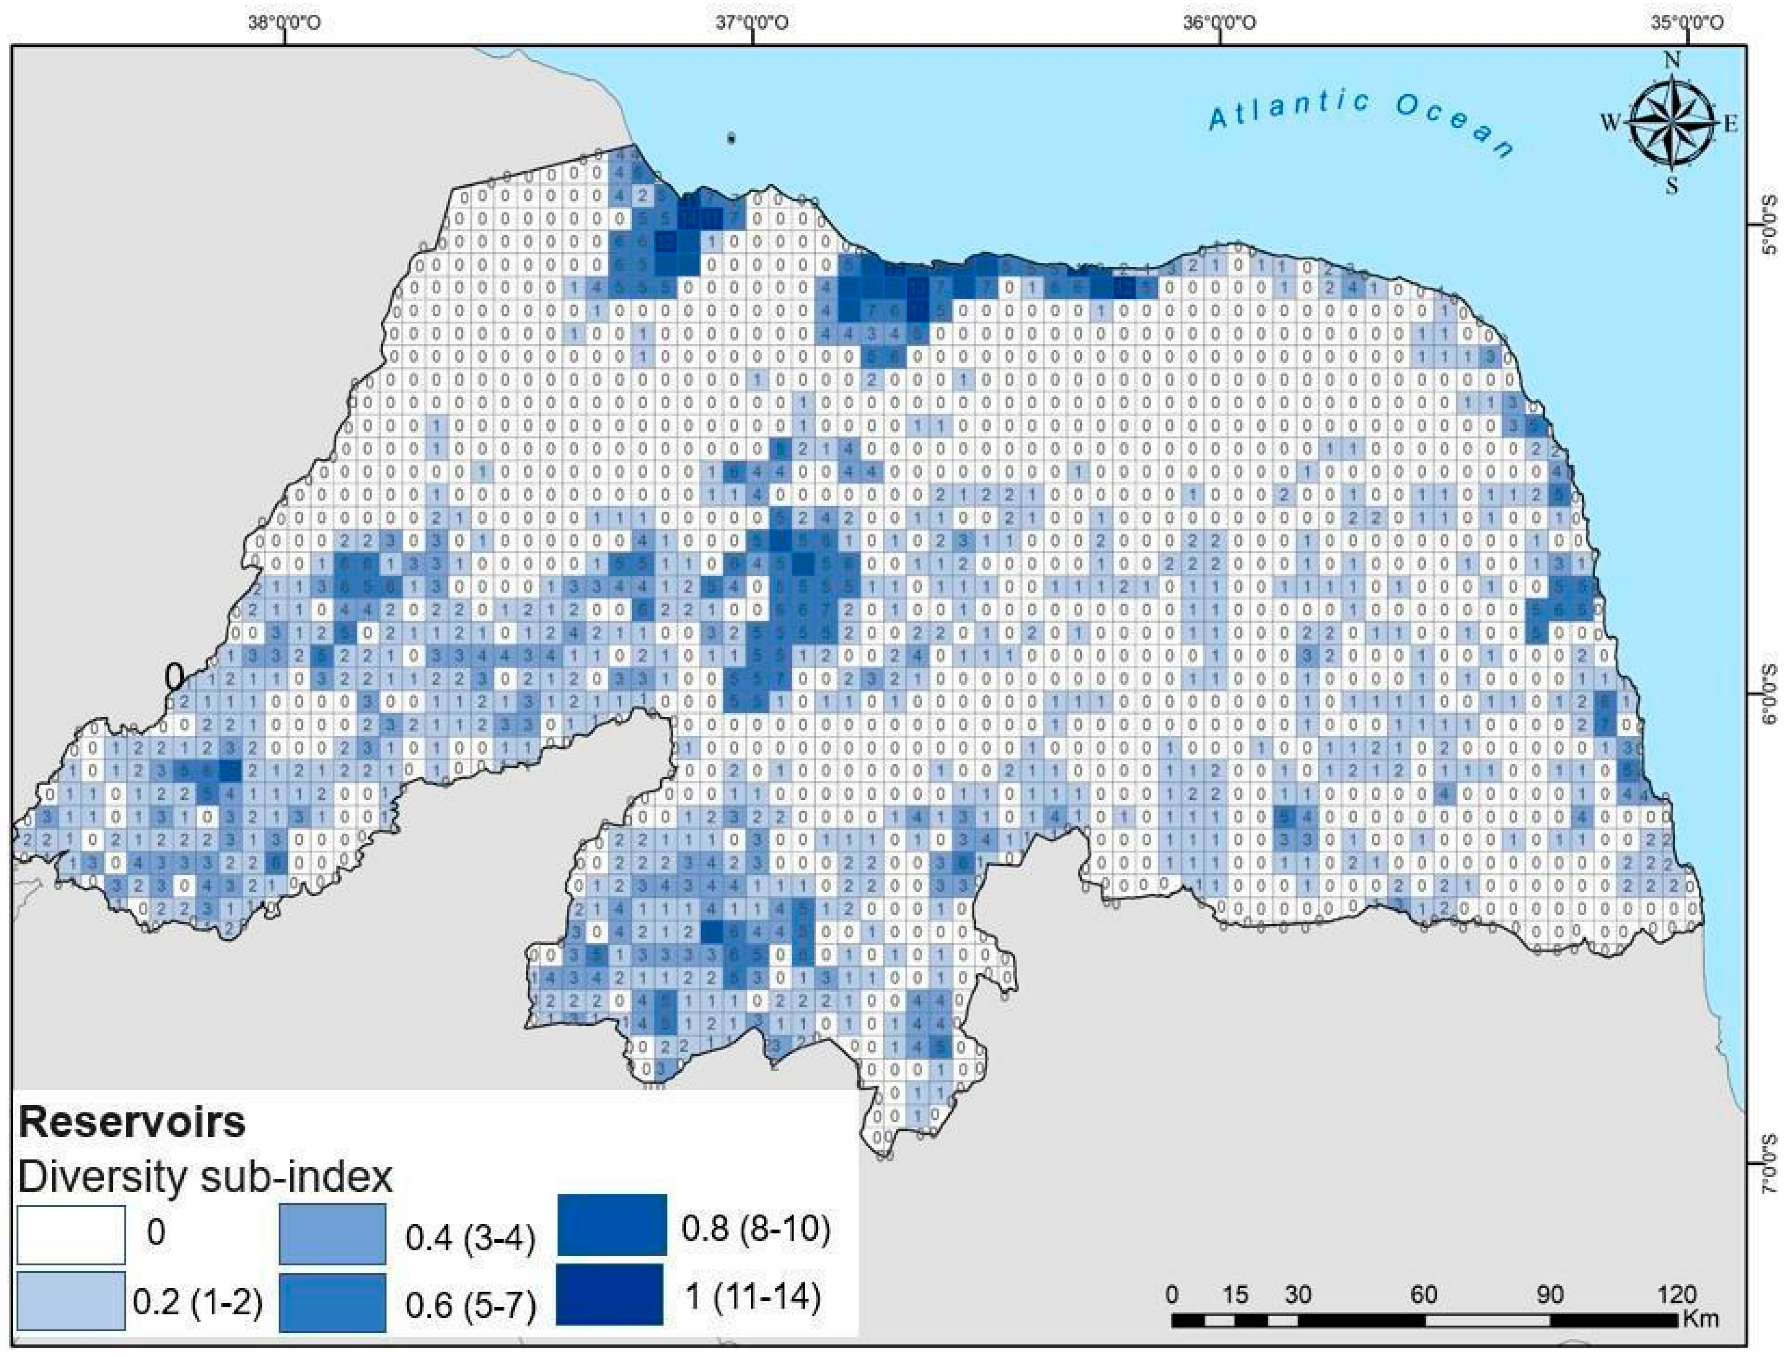
The high concentration of reservoirs in the south-central and southeastern regions of Rio Grande do Norte (Figure 4B) reflects the state government’s strategy to address local water demands, particularly in areas where climatic and geographical conditions restrict access to broader water sources. In these regions, small reservoirs—typically less than 400 hectares in size—predominate and primarily serve water supply functions.
In contrast, larger reservoirs, such as the Armando Ribeiro Gonçalves Dam—the largest in the state, located in the Assú Valley River (Figure 2)—play a critical role in supporting multiple uses, including irrigation, water regulation, and drought mitigation. Similarly, the estuarine systems along the northern coast, due to their representativeness and size, contribute significantly to hydrological regulation and environmental balance, while also serving as areas of ecological and economic relevance. These regions, therefore, exhibit the highest values in the reservoirs diversity sub-index (Figure 7).
Figure 7. Reservoirs diversity sub-index map of the state of Rio Grande do Norte, Brazil. Data source: Rio Grande do Norte Institute for Sustainable Development and the Environment [].
The variation in reservoir size and function reflects adaptation to the natural characteristics and specific water demands of each region, illustrating both human interventions to enhance water availability and the strategic importance of large-scale infrastructure for the water sustainability of Rio Grande do Norte. Additionally, the Potiguar basin contains relatively few reservoirs, primarily due to the presence of groundwater wells, extremely flat terrain unsuitable for dam construction, and the high permeability of local rock formations.

3.1.4. Stream Order Diversity Sub-Index

The stream order diversity sub-index reflects the hierarchical organization of surface water networks across the state. The final map reflects the existence of principal river channels throughout all regions of Rio Grande do Norte (Figure 8), with particular prominence in the Piranhas–Açú and Ceará-Mirim basins (Figure 2), situated in the central area, as well as in the river mouth areas along the entire eastern coastline. However, certain areas remain unmapped in terms of drainage, particularly in regions characterized by diffuse surface flow, such as northeastern Rio Grande do Norte and the northern boundary with the state of Ceará.
Figure 8. Stream order diversity sub-index map of the state of Rio Grande do Norte, Brazil. Data source: Geological Survey of Brazil [].

3.2. Hydrodiversity Index

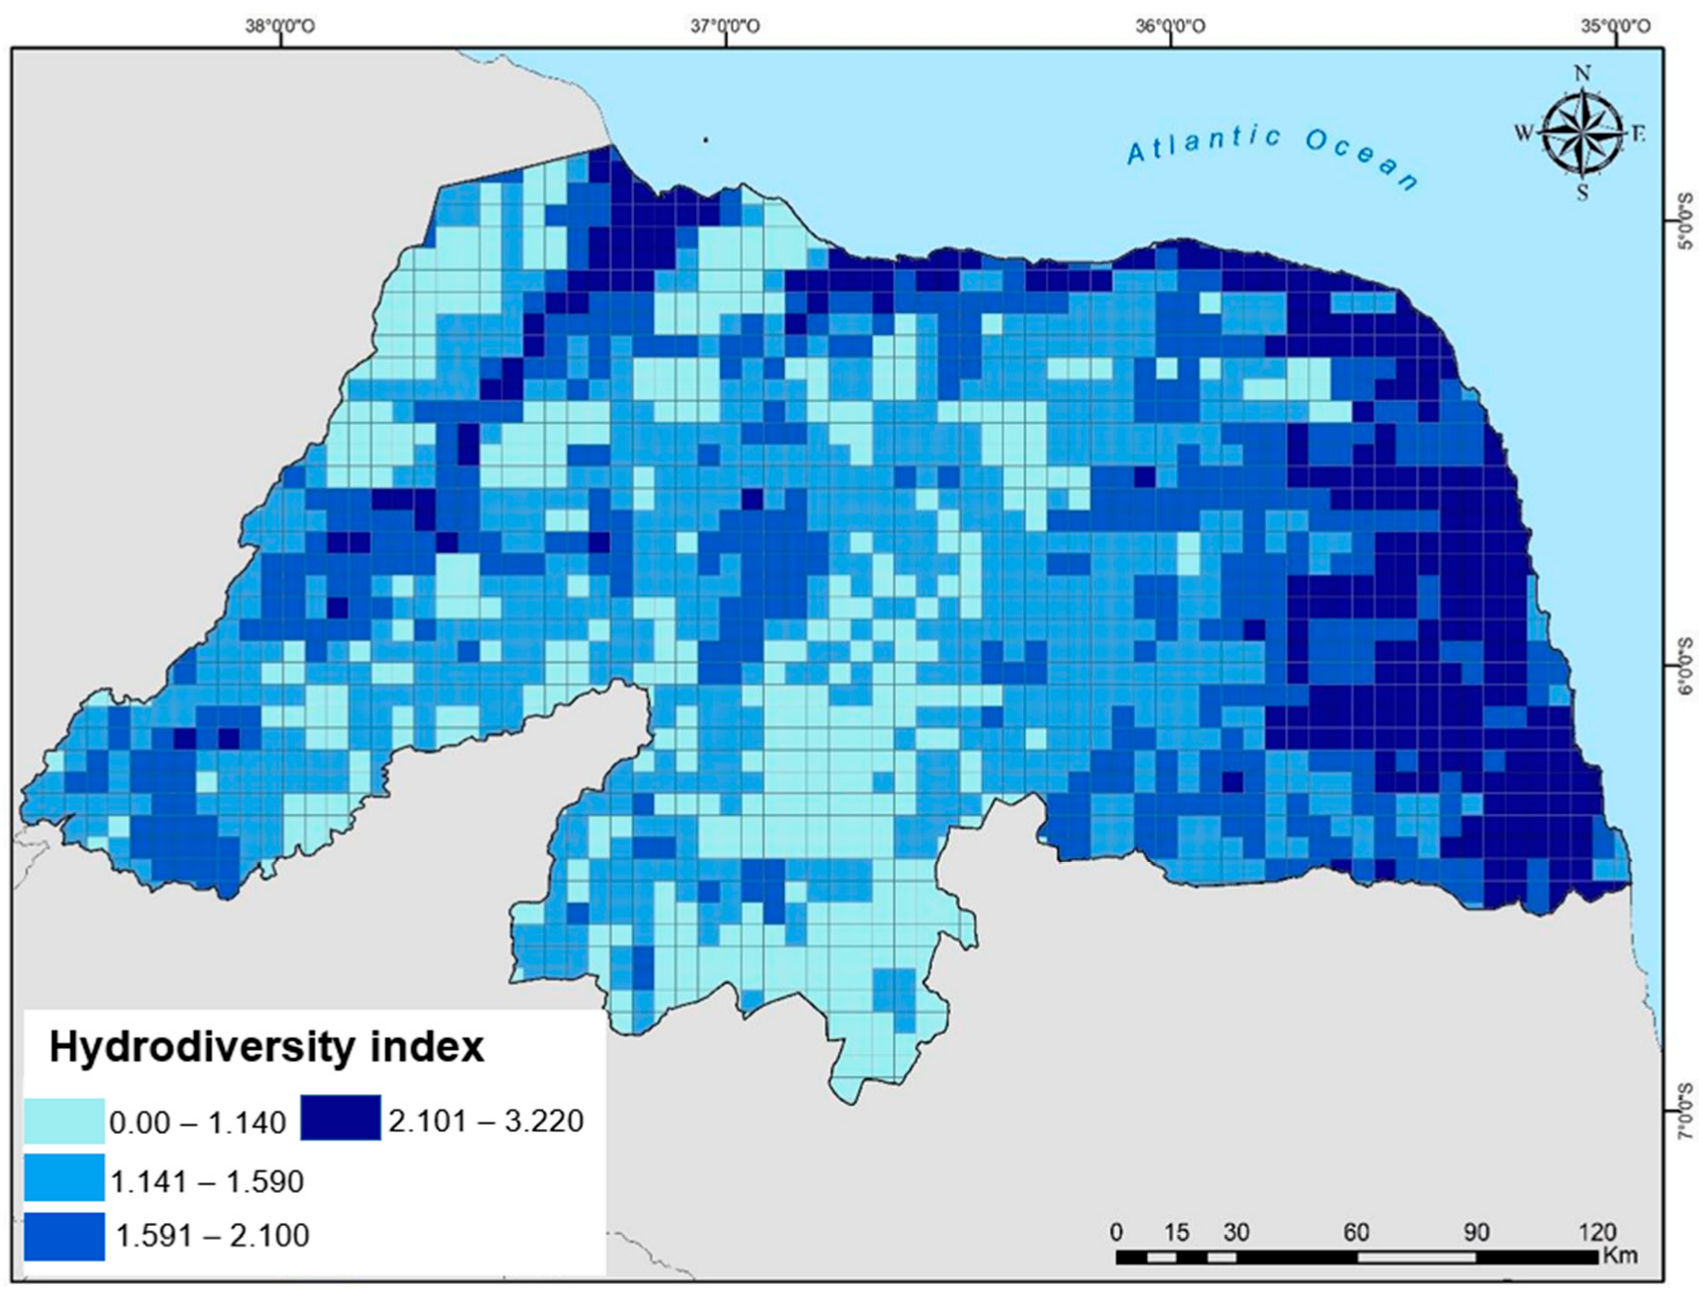
The Hydrodiversity Index, which integrates the interaction among the aforementioned variables, enabled a detailed analysis of hydrological distribution across the study area. The normalization process, based on the MPV, resulted in final index values ranging from 0.38 to 3.22 out of a possible 4. This adjustment facilitated the integration of variables without disproportionately emphasizing any individual component (Figure 9).
Figure 9. Hydrodiversity Index map of the state of Rio Grande do Norte, Brazil. The values were obtained from the sum of the precipitation, discharge, reservoirs, and stream order diversity sub-indices (Figure 5, Figure 6, Figure 7 and Figure 8).
The highest index values were primarily concentrated along the eastern coast (Figure 9), particularly in the municipalities of Goianinha, Várzea, Brejinho, and São José de Mipibu (Figure 2). This pattern is attributed to a favorable combination of factors, including high rainfall and a denser drainage network, which together enhance water availability. Historically, this region has been characterized by sugarcane cultivation, an activity that relies heavily on both water availability and fertile soils.
Additionally, high index values were observed along the Apodi–Mossoró River, in the western part of the study area, reflecting the interplay between the river’s high stream order and the presence of a dense distribution of smaller reservoirs in its upper reaches and more prominent reservoirs downstream. This pattern underscores the importance of an integrated approach for understanding the interactions among hydrological variables and their influence on regional water dynamics.
The analysis revealed that the majority of the state falls within the medium-value category of the Hydrodiversity Index. The use of IDW interpolation significantly enhanced the visualization of spatial patterns, enabling clearer interpretation of the index’s distribution (Figure 10).
Figure 10. Hydrodiversity Index map of the state of Rio Grande do Norte, Brazil, classified into four categories (low, medium, high, and very high). Spatial representation was generated using the Inverse Distance Weighted (IDW) interpolation method.

3.3. Hydrodiversity and Land Use

Two categories of anthropogenic land use—rural occupation and artificial areas—were incorporated into the analysis (Figure 11). A comparison between Hydrodiversity Index values and land use patterns indicates that high-value areas are predominantly located in regions with significant rural and artificial occupation, particularly along the eastern coast. This region serves as the state’s industrial hub, notably for the textile, food processing, and sugarcane sectors.
Figure 11. Anthropic land use in the state of Rio Grande do Norte, Brazil, overlaid on the Hydrodiversity Index map. Data source: Brazilian Institute of Geography and Statistics [].
On the northern coast, where economic activities focus on shrimp farming and salt production, high-value Hydrodiversity Index zones were also identified in association with anthropogenic land use, particularly in estuarine areas. In contrast, the central region is characterized by more dispersed rural occupation and an economy centered on livestock farming. This area exhibits a lower frequency of high or very high index values, which appear only sporadically. In the western region, however, high-value rural settlements are present, reflecting the region’s predominantly agricultural character.
Overall, this analysis highlights the strong relationship between land use and the distribution of hydrodiversity in Rio Grande do Norte. It demonstrates how economic activities—particularly rural activities—and human settlement patterns are closely influenced by hydrological environmental dynamics (Table 4). 67.27% of the Artificial areas correlate with the High Hydrodiversity class, while Rural areas correlate predominantly with Medium (64.38%) and High Hydrodiversity (27.97%) classes. Distinct contrasts emerge between the eastern coastal zone, characterized by higher rainfall, and the interior of the state, marked by arid conditions and dependence on reservoirs for water storage. The prominence of rivers such as the Apodi–Mossoró, which flows through the Apodi Plateau, further illustrates areas of high hydrodiversity along its course to the river mouth.
Table 4. Hydrodiversity Index classes distribution in anthropogenic land use areas in the Rio Grande do Norte State, Brazil.

3.4. Hydrodiversity and Hydrological Geoheritage

The 22 hydrosites inventoried in the state are mainly concentrated in three regions (Table 5 and Figure 12). In the northwestern region of the state (Figure 12A), the hydrosites are primarily located along the course of the Apodi–Mossoró River, which includes a hot spring in the city of Mossoró and two waterfalls. The hot spring occurs in a high Hydrodiversity area, while the waterfalls are in Medium Hydrodiversity areas (Figure 12A). In the southwestern region (Figure 12C), five hydrosites occur in Medium Hydrodiversity areas and one in a Low Hydrodiversity area. On the eastern coast (Figure 12B), 11 of the 13 hydrosites are in High Hydrodiversity areas, with the other two located in Medium Hydrodiversity areas.
Table 5. Number of hydrosites occuring in each of the Hydrodiversity Index classes calculated for Rio Grande do Norte State, Brazil.
Figure 12. Hydrological sites (hydrosites) inventoried in the state of Rio Grande do Norte, Brazil, overlaid on the Hydrodiversity Index map. The detail is increased for the northwestern (A), eastern (B) and southwestern (C) regions of the state, where the hydrosites concentrate. Data source: [,].
These results seem to establish a correlation between the occurrence of hydrosites and areas of greater hydrodiversity. More than 50% of hydrosites occur in areas of high hydrodiversity and 95.5% of them in areas of medium or high hydrodiversity. However, these data must be interpreted with some caution, as these high percentages are in the same order of magnitude as the area occupied by these classes of hydrodiversity, which is more than 90% of the entire state. Similarly, there is not a single hydrosite located in an area of Very High Hydrodiversity, and there is only one hydrosite in an area of Low Hydrodiversity.
Therefore, the findings may expose the fragility of an approach that compares diversity with scientific value of hydrological features, which were assessed using different criteria.

4. Discussion

4.1. Hydrodiversity of Rio Grande do Norte

When considering the results obtained by Dias et al. (2021) [] on the geodiversity of Rio Grande do Norte, a notable homogeneity across the territory is observed, including in relation to hydrographic elements. In their study, regions with high and very high indices were identified in areas of lithological contact, geomorphological transitions, and mineral occurrences. A comparison between the hydrographic diversity sub-index presented by Dias et al. (2021) [] and the final geodiversity index of their study reveals differences in the spatial distribution of results, as the latter incorporates additional variables. Specifically, in some areas—particularly around the Apodi–Mossoró River and in the central and northern regions—scores were not assigned in the hydrographic diversity sub-index and are represented with a value of zero, due to the absence of rivers or bodies of water. Nevertheless, many of these areas have water representation, albeit low, which is not captured by a single sub-index.
In our study, the hydrological sub-index proposed by Dias et al. (2021) [] was employed as a starting point to understand the water-related issues in Rio Grande do Norte state. A more in-depth methodology, capable of encompassing different aspects of hydrodiversity could significantly enhance the detail of the assessment and become important for an integrated assessment of water resources.
As suggested by Dias et al. (2021) [], further studies on cartographic elements and the development of specific sub-indices are essential in this matter. In this context, the Hydrodiversity Index presented in this study broadens the understanding of territorial complexity by incorporating hydrological variables that emphasize regional differences. The significance of diverse and available cartographic data related to hydrological elements is paramount. This study was able to acquire information on key hydrological variables, including average annual rainfall, discharge, hydrographic networks, and water bodies of varying sizes. It is important to note that the inclusion of additional variables, should the relevant data be available, would enable a more comprehensive analysis of water diversity.
In general, the Hydrodiversity Index presented appears to be a reliable indicator of water resource diversity and availability within the state. In addition to highlighting the representativeness of estuaries on the northern and eastern coasts, as well as inland water bodies, the index incorporates variables such as precipitation and discharge, which highlight the highest hydrodiversity values along the eastern coast and within the Apodi–Mossoró River drainage basin.

4.2. Hydrodiversity vs. Hydrological Heritage

Dias et al. (2021) [] highlighted specific areas with a high geodiversity index, which were associated with geosites of heritage value. One of the primary objectives of the present study was to identify if the same observation could be performed specifically for the hydrological features of geodiversity and geoheritage.
Along the eastern coast of Rio Grande do Norte, numerous springs are located in palaeodunes, near areas exhibiting High Hydrodiversity values. Similarly, waterfalls in the western region are situated near the contact between the Serra de Martins Formation and the crystalline basement. In contrast, the estuaries of the Potengi and Piranhas–Açú rivers—both of which exhibit very High Hydrodiversity—do not host any identified hydrosites. Of the 22 hydrosites, 12 are located in areas with a high Hydrodiversity Index, while the remaining 10 hydrosites are found in areas with medium or low index values (Table 5 and Figure 12). However, it must be considered that High and Medium Hydrodiversity areas correspond to more than 90% of the total area of the state, which correlates with the occurrence of hydrosites in these areas. Moreover, there are no hydrosites located in Very High Hydrodiversity areas while one hydrosite is located an area of Low Hydrodiversity.
The methodology to set the hydrodiversity classes was based on the sum of the four normalized sub-indices, as presented in Table 3. Very High Hydrodiversity class contains scores ranging from 3 to 4, what occurs only in restricted areas of the study region. Nevertheless, it must be stated that the IDW interpolation, although it is a tool that allows results to be made more objective and less locally biased, it can have a decisive influence on the definition of these classes. Without this interpolation, there would be more areas with Very High Hydrodiversity and, therefore, more hydrosites corresponding to this category.
The findings show that the proposed Hidrodiversity Index is useful to identify hotspots of water resources diversity based on the parameters used, although it seems to have limitations to establish connections between these areas and the actual occurrence of hydrosites. This suggests that hydrological heritage can occur independently of quantity of water resources.
Moreover, the criteria used to assess geoheritage and geodiversity differ, resulting in divergent, uncorrelated outcomes. In geodiversity quantitative assessment, the goal is to identify the spatial distribution of certain elements by measuring the richness of occurrences per spatial unit. In contrast, the evaluation of geoheritage focuses on the value of these geodiversity elements, with an emphasis on scientific, ecological, cultural, and aesthetic value. While the high diversity of elements or processes may be a relevant criterion for assessing geoheritage, other criteria, such as rarity, may conflict with this approach, further underscoring the lack of correspondence between the two assessments.

4.3. Hydrodiversity vs. Land Use

The correlation between hydrodiversity and land use is particularly evident in areas with high values on the Hydrodiversity Index. Regions with high or very high hydrodiversity values have historically influenced land use and occupation patterns in Rio Grande do Norte. For example, human settlement in the Chapada do Apodi and Serra do Mel areas (north coast) is largely supported by the flow of wells used for irrigated agriculture. The mapping conducted reveals how hydrodiversity has shaped land occupation, with the exception of these two areas, which have seen recent expansion due to the drilling of extremely deep wells, some exceeding 500 m in depth.
On the north coast, which is focused on shrimp farming and salt production, high-value hydrodiversity spots associated with anthropic land use were identified. These areas correspond to infrastructure that supports these economic activities. In contrast, the central region has a more sparsely populated rural area, primarily engaged in livestock farming, and exhibits a lower incidence of high or very high Hydrodiversity Index values, which appear sporadically. In the Upper West, however, there is a concentration of high-value hydrodiversity in rural areas, reflecting the predominantly agricultural nature of this region. This analysis reinforces the relationship between land use and the distribution of the Hydrodiversity Index values.

4.4. Limitations of the Study

The quality of quantitative geodiversity assessment always depends on the quantity and quality of the cartographic information used as a basis for this analysis. Furthermore, this information should be in digital vector format to facilitate procedures in a GIS environment. This means that the results presented here could be improved if more cartographic data regarding water resources were available. Specifically, the lack of comprehensive information on river discharge across all basins, groundwater resources, and detailed data on evapotranspiration posed challenges to achieving more refined results. Given the territorial diversity of the region, these gaps impeded a more exhaustive analysis, limiting the potential for incorporating additional variables. Although the Hydrodiversity Index could benefit from incorporating additional variables, it remains a valuable tool to identify the distribution of water resources throughout Rio Grande do Norte. Future studies should incorporate more data in the analysis to enhance the level of detail and a more comprehensive characterization and distribution of these resources.
The absence of a relationship between hydrodiversity and hydrological heritage as it is interpreted here may also be related to the baseline data used. The use of other variables, especially those related to the value of water resources rather than their spatial distribution, may influence the results. It is also important to acknowledge that many of the areas with the highest hydrodiversity values correspond to regions with the highest levels of human occupation, which could contribute to the natural degradation of these areas. Furthermore, it should be recognized that Rio Grande do Norte’s hydrological heritage has not been fully inventoried, and there may still be unidentified sites that warrant further investigation. In this regard, the proposed index can serve as a useful tool in the ongoing effort to inventory hydrosites, particularly in less explored areas. In that sense, further scientific research is needed to identify sites of exceptional value, which should be incorporated into geoconservation efforts and inform the development of public policies aimed at the balanced use of this vital resource.

5. Conclusions

Despite limitations in the availability of cartographic data to support the analysis, the application of the Hydrodiversity Index to Rio Grande do Norte successfully demonstrated the distribution of water resources across the state. The geodiversity-based quantitative assessment methodology, specifically applied to hydrological features, produced relevant findings. By highlighting the contrast between the eastern and interior regions, the index emphasized the critical role of water as an essential resource for both environmental and territorial management.
While previous studies provided a comprehensive analysis of the state’s geodiversity, they presented limitations regarding specific components, such as hydrodiversity. To address this gap, a dedicated hydrodiversity index methodology was developed to refine the analysis. The use of automated procedures in a GIS environment proved valuable, enabling the identification of areas with varying levels of hydrodiversity within the study region.
These tools can support the formulation of public policies and management strategies. The results of the hydrodiversity index are applicable to integrated territorial planning, particularly in identifying priority areas for the conservation and sustainable use of water resources. This is especially relevant when high-hydrodiversity areas coincide with greater anthropogenic occupation, as observed in this study.
On the other hand, the relationship between hydrodiversity and hydrological heritage appears to be limited. The results indicate that the vast majority of hydrosites are located in areas of High Hydrodiversity, although these areas also represent much of the studied territory. Nevertheless, no hydrosites were identified in areas of Very High Hydrodiversity, while at least one hydrosite was found in an area of Low Hydrodiversity. In our view, and considering these data, the results should be interpreted with caution, though they also highlight the potential for further research. Future analyses could be conducted at the river basin scale, incorporating additional variables into the hydrodiversity assessment. Similarly, a more comprehensive inventory of the hydrological heritage of Rio Grande do Norte could include different levels of site significance—ranging from local to international—and examine the association of various hydrosite types (e.g., waterfalls, springs, lagoons, hot springs) with different hydrological environments.
Author Contributions

Conceptualization, M.L.d.O.T. and P.P.; methodology, M.L.d.O.T.; validation, M.T.M.D. and P.P.; data curation, M.L.d.O.T. and P.P.; writing—original draft preparation, M.L.d.O.T. and P.P.; writing—review and editing, M.L.d.O.T., P.P. and M.T.M.D.; visualization, P.P. and M.T.M.D.; supervision, P.P. All authors have read and agreed to the published version of the manuscript.

Funding

Brazilian Biodiversity Fund (FUNBIO), Coordination for the Improvement of Higher Education Personnel—Brazil (CAPES) and National Council for Scientific and Technological Development (CNPq).

Data Availability Statement

The original contributions presented in this study are included in the article. Further inquiries can be directed to the corresponding author.

Conflicts of Interest

The authors declare no conflicts of interest.

References

  1. Gray, M. Geodiversity: Valuing and Conserving Abiotic Nature, 2nd ed.; John Wiley & Sons: Chichester, UK, 2013. [Google Scholar]
  2. Araújo, A.M.; Pereira, P.; Henriques, R.; Pereira, D. Water resources assessment using GIS procedures: Application in Ceará State (Brazil). In Geomorphometry for Geosciences; Jasiewicz, J., Zwoliński, Z., Mitasova, H., Hengl, T., Eds.; Adam Mickiewicz University in Poznań—Institute of Geoecology and Geoinformation, International Society for Geomorphometry: Poznań, Poland, 2015. [Google Scholar]
  3. Brilha, J.; Gray, M.; Pereira, D.I.; Pereira, P. Geodiversity: An integrative review as a contribution to the sustainable management of the whole of nature. Environ. Sci. Policy 2018, 86, 20–28. [Google Scholar] [CrossRef]
  4. Simić, S. Hydrological heritage within protection of geodiversity in Serbia—Legislation history. J. Geogr. Inst. Jovan Cvijić SASA 2011, 61, 17–32. [Google Scholar] [CrossRef]
  5. Pereira, P.; Pereira, D.; Santos, L.; Silva, J. Quantification of a new water diversity index for large areas using GIS: Examples in Paraná State, Xingu River Basin (Brazil) and Portugal. In Proceedings of the XIV Reunión Nacional de Cuaternario, Granada, Spain, 30 June–2 July 2015; Available online: https://core.ac.uk/download/pdf/154273262.pdf (accessed on 23 July 2025).
  6. Gonçalves, J.; Mansur, K.; Santos, D.; Henriques, R.; Pereira, P. Is it worth assessing geodiversity numerically? A comparative analysis between quantitative and qualitative approaches in Miguel Pereira Municipality, Rio de Janeiro, Brazil. Geosciences 2022, 12, 347. [Google Scholar] [CrossRef]
  7. Terto, M.L.O.; Diniz, M.T.M.; Araújo, I.G.D.; Queiroz, L.S. Method for evaluating the hydrological heritage of geodiversity: Case study in the Cerrado enclave–Rio Grande do Norte, Brazil. Geomorphology 2024, 460, 109265. [Google Scholar] [CrossRef]
  8. Araújo, F.H.R.; Souza, M.A.; Almeida, D.G.; Silva, F.E.B.; Chagas, M.D.; Terto, M.L.O.; Araújo, I.G.D.; Diniz, M.T.M. Geodiversidade e geoconservação na cachoeira dos cumarus, zona rural de Jucurutu-RN. In Proceedings of the XX SBGFA—Simpósio Brasileiro de Geografia Física Aplicada & IV ELAAGFA—Encontro Luso-Afro-Americano de Geografia Física e Ambiente, João Pessoa, Brazil, 21–27 October 2024; Realize Editora: Campina Grande, Brazil, 2024; Available online: https://editorarealize.com.br/artigo/visualizar/118015 (accessed on 23 July 2025).
  9. Santos, D.S.; Mansur, K.L.; Seoane, J.C.S.; Mucivuna, V.C.; Reynard, E. Methodological proposal for the inventory and assessment of geomorphosites: An integrated approach focused on territorial management and geoconservation. Environ. Manag. 2020, 66, 476–497. [Google Scholar] [CrossRef] [PubMed]
  10. Dias, M.C.S.S.; Domingos, J.O.; Costa, S.S.S.; Nascimento, M.A.L.; Silva, M.L.N.; Granjeiro, L.P.; Miranda, R.F.L. Geodiversity index map of Rio Grande do Norte State, Northeast Brazil: Cartography and quantitative assessment. Geoheritage 2021, 13, 10. [Google Scholar] [CrossRef]
  11. Medeiros, F.J.; Gomes, R.D.; Coutinho, M.; Lima, K.C. Meteorological droughts and water resources: Historical and future perspectives for Rio Grande do Norte State, Northeast Brazil. Int. J. Climatol. 2022, 42, 6976–6995. [Google Scholar] [CrossRef]
  12. IBGE (Instituto Brasileiro de Geografia e Estatística). Cobertura e Uso da Terra do Brasil; IBGE: Rio de Janeiro, Brazil, 2020. Available online: https://www.ibge.gov.br/geociencias/informacoes-ambientais/cobertura-e-uso-da-terra/15831-cobertura-e-uso-da-terra-do-brasil.html (accessed on 23 July 2025).
  13. Almeida, F.F.M.; Hasui, Y.; Brito Neves, B.B.; Fuck, R.A. Brazilian structural provinces: An introduction. Earth-Sci. Rev. 1981, 17, 1–29. [Google Scholar] [CrossRef]
  14. Diniz, M.T.M.; Oliveira, G.P.; Maia, R.P.; Ferreira, B. Geomorphological Mapping of the state of Rio Grande do Norte. Rev. Bras. Geomorfol. 2017, 18, 14. [Google Scholar] [CrossRef]
  15. Pereira, D.I.; Pereira, P.; Brilha, J.; Santos, L. Geodiversity assessment of Paraná State (Brazil): An innovative approach. Environ. Manag. 2013, 53, 542–552. [Google Scholar] [CrossRef] [PubMed]
  16. Serrano, E.; Ruiz-Flanõ, P. Geodiversity: A theoretical and applied concept. Geogr. Helv. 2007, 62, 140–148. [Google Scholar] [CrossRef]
  17. Forte, J.P.; Brilha, J.; Pereira, D.I.; Nolasco, M. Kernel density applied to the quantitative assessment of geodiversity. Geoheritage 2018, 10, 205–217. [Google Scholar] [CrossRef]
  18. Araújo, A.M.; Pereira, D.I. A new methodological contribution for the geodiversity assessment: Applicability to Ceará State (Brazil). Geoheritage 2017, 9, 463–475. [Google Scholar] [CrossRef]
  19. Gonçalves, J.; Mansur, K.; Santos, D.; Henriques, R.; Pereira, P. A discussion on the quantification and classification of geodiversity indices based on GIS methodological tests. Geoheritage 2020, 12, 38. [Google Scholar] [CrossRef]
  20. Araújo, A.M. Avaliação dos Recursos Hídricos no Âmbito da Geodiversidade: Aplicação ao Estado do Ceará. Ph.D. Thesis, Universidade do Minho, Braga, Portugal, 2016. [Google Scholar]
  21. Alsbach, C.M.E.; Seijmonsbergen, A.C.; Hoorn, C. Geodiversity in the Amazon drainage basin. Philos. Trans. R. Soc. A 2024, 382, 20230065. [Google Scholar] [CrossRef] [PubMed]
  22. Santos, D.S.; Mansur, K.L.; Gonçalves, J.B.; Arruda Junior, E.R.; Manosso, F.C. Quantitative assessment of geodiversity and urban growth impacts in Armação dos Búzios, Rio de Janeiro, Brazil. Appl. Geogr. 2017, 85, 184–195. [Google Scholar] [CrossRef]
  23. INMET (Instituto Nacional de Meteorologia). Climate Normals of Brazil: 1981–2010; INMET: Brasília, Brazil, 2018. Available online: https://portal.inmet.gov.br/normais (accessed on 23 July 2025).
  24. Tobin, C.; Nicotina, L.; Parlange, M.B.; Berne, A.; Rinaldo, A. Improved interpolation of meteorological forcings for hydrologic applications in a Swiss Alpine region. J. Hydrol. 2011, 401, 77–89. [Google Scholar] [CrossRef]
  25. ANA (Agência Nacional de Águas). Conjuntura dos Recursos Hídricos: Informe 2016; ANA: Brasília, Brazil, 2016.
  26. IDEMA (Instituto de Desenvolvimento Sustentável e Meio Ambiente). Base de Dados Geoespaciais dos Reservatórios do Rio Grande do Norte; IDEMA: Natal, Brazil, 2007.
  27. CPRM (Serviço Geológico do Brasil). Banco de Dados Hidrogeológicos. 2024. Available online: http://www.cprm.gov.br (accessed on 23 July 2025).
  28. Achilleos, G.A. The inverse distance weighted interpolation method and error propagation mechanism—Creating a DEM from an analogue topographical map. J. Spat. Sci. 2011, 56, 283–304. [Google Scholar] [CrossRef]
Disclaimer/Publisher’s Note: The statements, opinions and data contained in all publications are solely those of the individual author(s) and contributor(s) and not of MDPI and/or the editor(s). MDPI and/or the editor(s) disclaim responsibility for any injury to people or property resulting from any ideas, methods, instructions or products referred to in the content.

Article Metrics

Citations

Article Access Statistics

Multiple requests from the same IP address are counted as one view.