1. Introduction
Globally, flooding is a critical weather-related event with extensive financial and socioeconomic impacts [
1]. Previous research has highlighted a significant rise in flooding rates and durations at both global and latitudinal scales [
2]. Since 2000, tropical regions have experienced a fourfold increase in flooding events relative to other areas. This alarming flooding trend in the tropics has been attributed to coastal and urban hydrology alterations led by rapid urban development. In addition, approximately 62% of low-lying areas globally lie in the tropics at elevations less than 2 m above mean sea level (MSL) [
3]. This has increased exposure to several flow sources of infrastructure and humans, significantly increasing the risk associated with flooding in this region.
Traditionally, urban areas have adopted grey infrastructure, referring to engineered systems such as stormwater pipes, culverts, and concrete channels constructed to collect, transport, temporarily store, and discharge urban runoff to reduce the flood risk. The stormwater collection systems intercept flow from different catchments and transfer it to the nearest outlet or low-lying areas downstream, farther from the built-up areas. However, this inflexible system often fails to accommodate the runoff generated during extreme rainfall events [
4]. This has contributed to the propagation of flooding problems and as a result, several studies have questioned this approach [
5]. These measures help transfer flooding hotspots from one location to another, but they lack ecological utility, and the cost involved in improvement imposes an extreme economic burden. Attempts have been made to improve the hydraulic capacity of this infrastructure through redesign, rehabilitation, and rectification [
6]. These approaches are highly complex, inflexible, expensive, and unsustainable in resolving flooding problems. As a result, several studies have suggested alternative novel concepts incorporating nature-based solutions and green infrastructure to mitigate flooding [
7,
8].
Water-sensitive urban design (WSUD) techniques are alternative approaches that can contribute to flood mitigation in urban environments. Some of the WSUD techniques adopted for stormwater management and flood mitigation are rain gardens, bioretention systems, constructed wetlands, and porous pavements [
9]. These measures have been adopted globally for various purposes, such as stormwater management, attenuating surface/peak runoff, flood mitigation, and reducing urban heat effects and groundwater recharge [
8,
10,
11,
12]. Studies have demonstrated positive results showing that such measures can reduce surface runoff ranging from 3.6% to 78% [
13,
14] and peak runoff by 22.8% to 67.8% [
15,
16]. This has reduced flooding problems in urban areas, thereby decreasing the severity of flash flooding and inundation issues. Despite the results showing WSUD as a promising measure for reducing flooding problems, evidence of the suitability of these measures in tropical climatic zones is discussed in a limited amount of the literature [
5,
17]. Most of the published literature is from temperate or arid climatic zones [
18,
19]. Urban water management projects in tropical regions often adopt recommendations from the WSUD literature and guidelines as references [
9,
20]. However, these documents overlook the hydroclimate regime and catchment characteristics of the tropics. Relying on such studies only can lead to biased decision-making in the design, selection, and application of the WSUD system in tropical environments.
To improve decision-making and the implementation of robust WSUD systems, research is needed to assess WSUD performance in complex hydrological regimes and its interactions with other infrastructure to mitigate flooding explicitly in tropical regions. Therefore, this research adopted the approach of integrating WSUD measures into existing grey measures to evaluate the flood mitigation potential of the combined approach. We also assessed the strengths and weaknesses of both measures to highlight the need for an integrated approach to deal with the flooding challenges. Contributing to this knowledge gap, this study is designed for a wet tropical coastal sub-catchment to answer the following questions: (i) how effective are existing grey measures in mitigating flooding? (ii) how does integrating WSUD with existing grey infrastructure contribute to flood mitigation? and (iii) what are the factors that impact WSUD application in the tropics?
2. Materials and Methods
2.1. Study Site
Engineers Park is a small sub-catchment of the Saltwater Creek catchment in Cairns City, Queensland, Australia (Latitude = −16.911, Longitude = 145.72), as shown in
Figure 1. This catchment has a total area of 0.27 km
2, a small fraction of the Saltwater Creek catchment, which spans a total area of 16 km
2. The catchment is topographically characterised by a short width of approximately 600 m and a significant elevation difference, ranging from about 11 m Australian Height Datum (AHD) at the outlet to 139 m AHD at the upstream. The comprehensive flood modelling was undertaken at small spatial scale and focused on understanding rainfall driven localised flooding scenarios at this study site, before simulation work was expanded to whole catchment.
The Australian Bureau of Meteorology (BOM) notes that Cairns falls in the wet tropical climatic zone. The climate record from the Cairns Aero station (31,011), located at a latitude of −16.87°N and a longitude of 145.75°E, spanning the data period from 1943 to 2024, was analyzed [
21]. The maximum monthly precipitation received during the wet season from December to April can go up to 1417 mm, and the dry season, from July to November, has annual average rainfall ranging between 1997 mm and 3148 mm. In addition, Cairns experiences temperatures ranging from a mean maximum of 29.4 °C to a mean minimum of 21.0 °C; however, the maximum temperature can rise to 42.6 °C during hot, humid summer days.
2.2. Datasets and Methodology
2.2.1. Datasets
All the data sets used during this modelling work are listed in
Appendix A of this article. A high-resolution 0.5 m × 0.5 m digital elevation model (DEM) was generated from a 2021 Light Detection and Ranging (LiDAR) survey obtained from the Cairns Regional Council (CRC). The DEM defines the catchment topography and has been used for catchment delineation, determining land use characteristics, underpinning hydrological and hydraulic modelling.
The geological and soil types of setups of Saltwater Creek is complex and diverse. The Geology map compilation of the Geological Survey of Queensland (GSQ) shows this catchment has Hodgkinson formation [
22]. The uppermost ridge of this catchment is composed of highly deformed metamorphic bed rock including intermediate to basic volcanic is lava. the lower side of this catchment is underlain by a ferrosol (clay loam to clay texture) soil type.
Currently, the Council manages stormwater runoff in the catchment using grey infrastructure, such as inlets, pipe networks, and manholes, to intercept runoff and direct it to the nearest partially paved channels that run through the catchment. The CRC also provided the drainage network data, shown in
Figure 2. After receiving the grey infrastructure data, a desk study was followed by a discussion with CRC representatives through a field visit for onsite measurements.
Daily rainfall data were obtained from the CRC, which were collected using a tipping-bucket rain gauge as detailed in
Table 1. The rainfall data were supplied as cumulative rainfall totals in five minute increase over a day, with the accumulation retuning at the end of every day. However, none of the rain gauge stations were within the study site, as shown in
Figure 3. The inverse distance weighting (IDW) method as shown in Equation (1) was adopted to spatially distribute the rainfall data via interpolation over the sub-catchment centroid. Among several other methods, this method was selected due to its broader application in research and minimal calculation requirements [
23].
where, Z
p = interpolated rainfall value at the location of interest (mm), z
i = known rainfall value at I rainfall station, d
i = distance to I rainfall station from the location of interest, p = power parameter.
The four nearest rain gauge stations, highlighted in blue, with rainfall data, were considered for estimating the point rainfall value in this study.
The land use classification and area covered are presented in
Figure 4. The land use areas are categorized as rooftops, roads, driveways, forests, open spaces, and hardstands.
The area covered by each land use type is calculated and summarized in
Table 2. Green spaces and tropical rainforest cover about 50% of the study site. Specifically, the upper section of the catchment is forested, and the downstream location is urbanized.
Water level measurements were conducted in 5 min intervals using a pressure transducer sensor during wet periods from February 2023 to September 2023 in
Figure 5. Additionally, this sensor is well suited for use in both fresh and saltwater, thanks to its polypropylene housing and measurement accuracy of 0.1%.
The velocity measurements were conducted at the sensor location five times during the 2023 wet period, and a rating curve was developed. The measured water level from the pressure transducer sensor was converted to discharge using the rating curve shown in
Figure 6.
Besides rainfall depth, the additional hydrological inputs required for developing a design flood estimate, as guided by the Australian Rainfall and Runoff (ARR 2019), are temporal and spatial patterns and losses [
25]. The areal temporal patterns (ATP), areal reduction factors (ARF), and losses were obtained from the ARR Data Hub website for Latitude −16.92 and Longitude 145.727. Here, ATP is a data type representing how rainfall data varies over time within the catchment; this is required to provide a realistic simulation of storm behaviour [
26]. ARF adjusts the point rainfall data to represent average rainfall over a large catchment. Furthermore, initial and continuous loss accounts for losses from the system. In addition, the intensity–frequency–duration (IFD) data were downloaded from the BOM website [
27], which lists frequent and infrequent events extending from 1% Annual Exceedance Probability (AEP) corresponding to 100 years return period to 63.2% AEP (1.58 years) with durations of 1 min to 168 h. IFD data provides information on estimated extreme rainfall intensities over different durations and return periods, which is critical information for flood modelling and is used for generating design storms. These datasets are required for the RORB hydrological modelling software tool for runoff routing to ensure that flood peaks and volumes are correctly modelled.
2.2.2. Methods
The research methods flowchart adopted for this study is presented in
Figure 7 and discussed in detail.
2.3. Modelling Tools and Approach
A combination of open-source and commercial hydrological and hydraulic modelling tools was adopted. The open-source runoff-routing lumped conceptual RORB version 6.45 model was adopted for hydrological assessment [
28]. This tool is a streamflow routing software that computes hydrographs from rainfall, deducting losses from rainfall to produce runoff [
29]. This tool was selected for hydrological simulation due to its free availability and demonstrated a wide range of applications in Australian catchments. The RORB model was utilized to develop a catchment file for the study site, which was integrated with ArcGIS using Arc-RORB. This catchment file was used in the Storm injector is shown in
Figure 8, including areal temporal patterns, areal reduction factors, losses, and IFD results, as well as hydrological properties, to generate a rainfall design event and critical time for further modelling using MIKE+. Storm Injector is a commercial tool that offers a robust and user-friendly interface for applying Australian Rainfall & Runoff 2019 (ARR 2019) design storms across a variety of hydrologic models, including RORB, WBNM, XP-RAFTS, URBS, and HEC-HMS. It features built-in tools and visualisation capabilities to assist in analyzing model outputs—such as hydrographs, peak flows, and critical storm durations—supporting efficient selection for downstream hydraulic modelling.
Additionally, Storm Injector is another commercial tool utilized in this research work, which has an integrated platform for data insertion [
28]. The catchment file developed using RORB model was injected into this platform, including storm files from the ARR Data Hub, and intensity–frequency–duration curves from the BOM can be input into a single platform to obtain the temporal combination defined by the ARR 2019 requirements for flood modelling. A Storm Injector was adopted to generate rainfall design events and critical time for peak flow generation under current and future climate change scenarios.
Furthermore, this study adopted MIKE+ commercial modelling tool over other modelling tools, developed by the Danish Hydraulic Institute (DHI) [
30]. MIKE+ was adopted due to its being an integrated platform, including a model manager, water distribution function, water collection system, river network, and 2D overland flow [
31,
32,
33]. This tool enables the performance of hydrological and hydraulic simulations, with results that can be linked within a single platform. The kinematic wave method was adopted to handle the rapid flow in conduits and channels within catchments, where the influence of backwater and dynamic inertia is minimal, thereby allowing for an efficient simulation of surface runoff processes. While 2D geometry utilizes shallow water equations to capture ponding, surface routing, and overbank flooding across the terrain, MIKE 2D modelling provides a detailed representation of flow dynamics across composite topography, allowing for the accurate simulation of flood extents, velocities, levels, and interaction with structures such as roads and buildings [
34].
The MIKE+ model was used to perform 1-dimensional (1D) and 1D2D hydrological and hydrodynamic simulations to evaluate grey and WSUD approaches in measuring their performance in mitigating flooding. One of the challenging aspects of adopting MIKE+ for modelling was its lack of in-built tools to incorporate the hydrological properties, which was recommended by the ARR [
26,
35]. The design event hydrograph results are further utilized in MIKE+ as a boundary condition during one-dimensional (1D) and one-dimensional/two-dimensional (1D2D) simulations.
The MIKE+ 1D geometry and 2D geometry model setup is shown in
Figure 9. The MIKE+ model catchment and collection system (CS) platform was used to define the pipe networks, inlets, manholes, and canals at this study site. Additionally, the 2D overland flow platform within the model was utilized to develop a rectangular grid with a spatial resolution of 1 × 1 m. The nodes (inlets, manholes) in MIKE+ 1D collection system were linked to 2D overland cells. The water can be exchanged depending on the level difference and weir/orifice equation [
34]. The coupling platform within the tool connected the 1D2D model created in a separate MIKE+ platform. Finally, MIKE+ also has a platform to support the application of WSUD techniques and hydraulically connect these measures with existing drainage networks or each other.
The simulations results were mapped using QGIS tools, with grey measures and WSUD efficiency and rating curve development calculations performed in Microsoft Excel. The model simulated different magnitudes of design events, including a major event (1% Annual Exceedance Probability, AEP), a moderate event (20% AEP), and a minor event (63.2% AEP), to represent a broad range of events.
2.4. Model Calibration and Validation
The calibration and validation of both models were conducted considering a comparative assessment of simulated and measured flow hydrographs at the outlet locations. The event selection approach for model calibration and validation is critical for improving the accuracy of modelled results [
35]. The events selected for the model calibration and validation are shown in
Table 3.
The model calibration and validation were evaluated based on the goodness-of-fit criteria, as shown in
Table 4. The formula for calculating these fit criteria values is illustrated in Equations (2) to (7). The Nash–Sutcliffe efficiency (NSE) value ranges from 1 to −∞; NSE = 1 indicates perfect agreement between modelled and observed data; NSE = 0 means the mean of the observed data is as accurate as the model predictions; NSE < 0 means the mean of the observed data predicts better than the model. This value shows the predictive power of the hydrological model [
36]. Root mean square error (RMSE) is the standard deviation of the residual (prediction error), this parameter measures the spread of model results compared to the measured results [
36,
37,
38]. Finally, the Percentage Bias (PBIAS) parameter measures the tendency of modelled results below or above the measured results [
36].
- 1.
- 2.
Nash–Sutcliffe Efficiency (NSE)
NSE = Nash–Sutcliffe Efficiency
n = number of observations
Qobs,i = Observed value at time i
Qasim,i = Simulated value at time, i
Qobs mean = Mean of the observed values
- 3.
Relative Squared Error (RSR)
RMSE = Root means Square Error
STDEV
obs = Standard deviation of the observed value
Pi = Observed precipitation value
Pavg. = Sample average precipitation value
n = Total number of rainfall sample
- 4.
Percent Bias (PBIAS)
Qobs,i = Observed value at time i
Qasim,i = Simulated value at time, i
2.5. Simulation Scenarios
The current land use and grey measures are a base case scenario simulation. The hydrological effectiveness of WSUD applications as a point source control measure in urban catchments was assessed, considering the reduction of effective impervious area (EIA). The decrease in permeability in urban areas substantially reduces natural flora, and the interception, retention, and infiltration of stormwater runoff are also reduced. This positively impacts runoff rates and volumes, thereby decreasing interception and infiltration. The effective EIA is the portion of the urban area that directly contributes runoff to the drainage network, increasing peak flow and runoff volume [
39]. Literature has suggested that the reduction in EIA can lower the probable impact of climate change and urbanization on hydrology and the efficiency of grey measures [
40,
41,
42,
43].
This study tested three rainfall scenarios as part of the baseline scenarios. The rainfall design events considered for scenario testing are major (1% AEP), moderate (20% AEP), and minor (63.2% AEP). In addition, hydrological simulations for all three rainfall design events were conducted with the WSUD system, with EIA reduction ranging from 10% to 100%, as shown in
Table 5. Five different types of WSUD systems were selected for testing. Furthermore, earlier studies have reported that combining different WSUDs helps improve peak flow reduction [
16,
17,
44]. The WSUD systems combine to leverage the functions of both retention and infiltration-based systems, thereby improving overall efficiency. Infiltration measures primarily function to reduce the runoff volume, groundwater recharge and restore baseflow [
42]. Some of the approaches under this category are permeable pavement, swales, bio-retentions, and infiltration trenches [
9]. On the other hand, retention based approaches retain water, for short or time and released slowly to reduce peak flow and volumes [
42]. This technique uses measures such as wetlands, ponds, rain barrel and retarding basins [
45]. Thus, the individual WSUD systems were later combined from M1 to M4, as shown in
Table 5, to evaluate the efficiency of mixed systems. Finally, 1D2D hydrodynamic modelling was conducted for the best-performing individual and mixed systems, assuming a 100% EIA reduction, to assess flooding hotspots, inundation, and maximum water level (MWL) alterations.
2.6. Model Performance Evaluation Criteria
The following equations were adopted to evaluate the model performance.
Node flooding: A node refers to a manhole or inlet that discharges flow to the surface.
where, PF = peak flow reduction, TRV = total runoff reduction, MWL = maximum water level, FEA = flood extent area, CA = catchment area
3. Results
3.1. Hydrological Model Calibration and Validation
The RORB and MIKE+ model calibration and validation summary results, are presented in
Table 6 and
Table 7. Both models provided satisfactory estimates of peak flow. The RORB model’s simulated peak flow closely matched with the measured flow during calibration. The MIKE+ model overestimated the peak flow during three events. In contrast, during validation, both models performed relatively better.
Both models yielded satisfactory to very good NSE results during calibration and validation. However, despite the short dataset (8 months) used for calibration and validation, RORB performed better than the MIKE+ model in relation to PF and TRV estimation. Since the RORB model was specifically developed and extensively used in Australian catchments, the model parameters adopted appear to better represent the catchment characteristics, even with limited data. A major challenge during this process was to match the time of the modelled and measured peak flow of results, so different lag times were adopted to overcome this limitation. This study adopted a lag time of 10 to 130 min to adjust the timing of the results.
In the RORB fit run simulation, the kc and initial loss (IL) were manually entered, and continuous loss (CL) was adjusted by the model to match the simulated hydrograph. The kc value was initially estimated using the built-in empirical equations, and the IL value was established using regional reference results obtained from the ARR Data Hub [
46]. These parameters were fine-tuned using a trial-and-error approach until the simulated and measured hydrographs were closely matched. The median RORB-calibrated and validated parameters, such as m = 0.8, kc = 2.8, IL = 15 mm, and CL = 3.27 mm/hr, were further used to generate rainfall design events, which were later used as boundary conditions during the MIKE+ modelling.
MIKE+ calibrated and validated parameters, such as losses, infiltration capacity, and Manning roughness coefficients, were tuned through trial and error until the measured flow matched the simulated flow, as shown in
Table 8.
3.2. Catchment Hydrological Characteristics
The calibrated MIKE+ model was run for the 3 IFD design events (1%, 20%, 63.2% AEP) under three rainfall scenarios. Rainfall depth change was the only boundary condition that altered flow during these simulations, while other parameters, such as land use change, were held constant. The base case scenarios of PF and TRV results under different rainfall design scenarios are in
Table 9. The rainfall depth during moderate and major events was 29% and 48% higher, respectively, compared to minor events. Additionally, the corresponding PF and TRV during moderate and major rainfall events were 40% and 64% higher, respectively, compared to those during minor rainfall events. At the same time, the critical time to peak flow was similar (30 min) for minor and moderate rainfall. In contrast, the duration of major events was 25 min. Several other factors, such as land use features, antecedent moisture content [
47], and hydraulic structures [
4] guide the critical time to peak flow for a catchment.
3.3. Integrated Grey and Individual WSUD Performance
The calibrated MIKE+ model was run for EIA reductions ranging from 10% to 100%, considering all WSUD systems in the assessment. PF and TRV reduction are important parameters for assessing the effectiveness of flood mitigation measures. The results showed a decrease in PF and TRV for the test scenarios. PF and TRV reductions for different WSUD systems, along with their corresponding EIA reduction scenarios, are presented in
Figure 10 and
Figure 11 for Major, Moderate, and Minor rainfall scenarios.
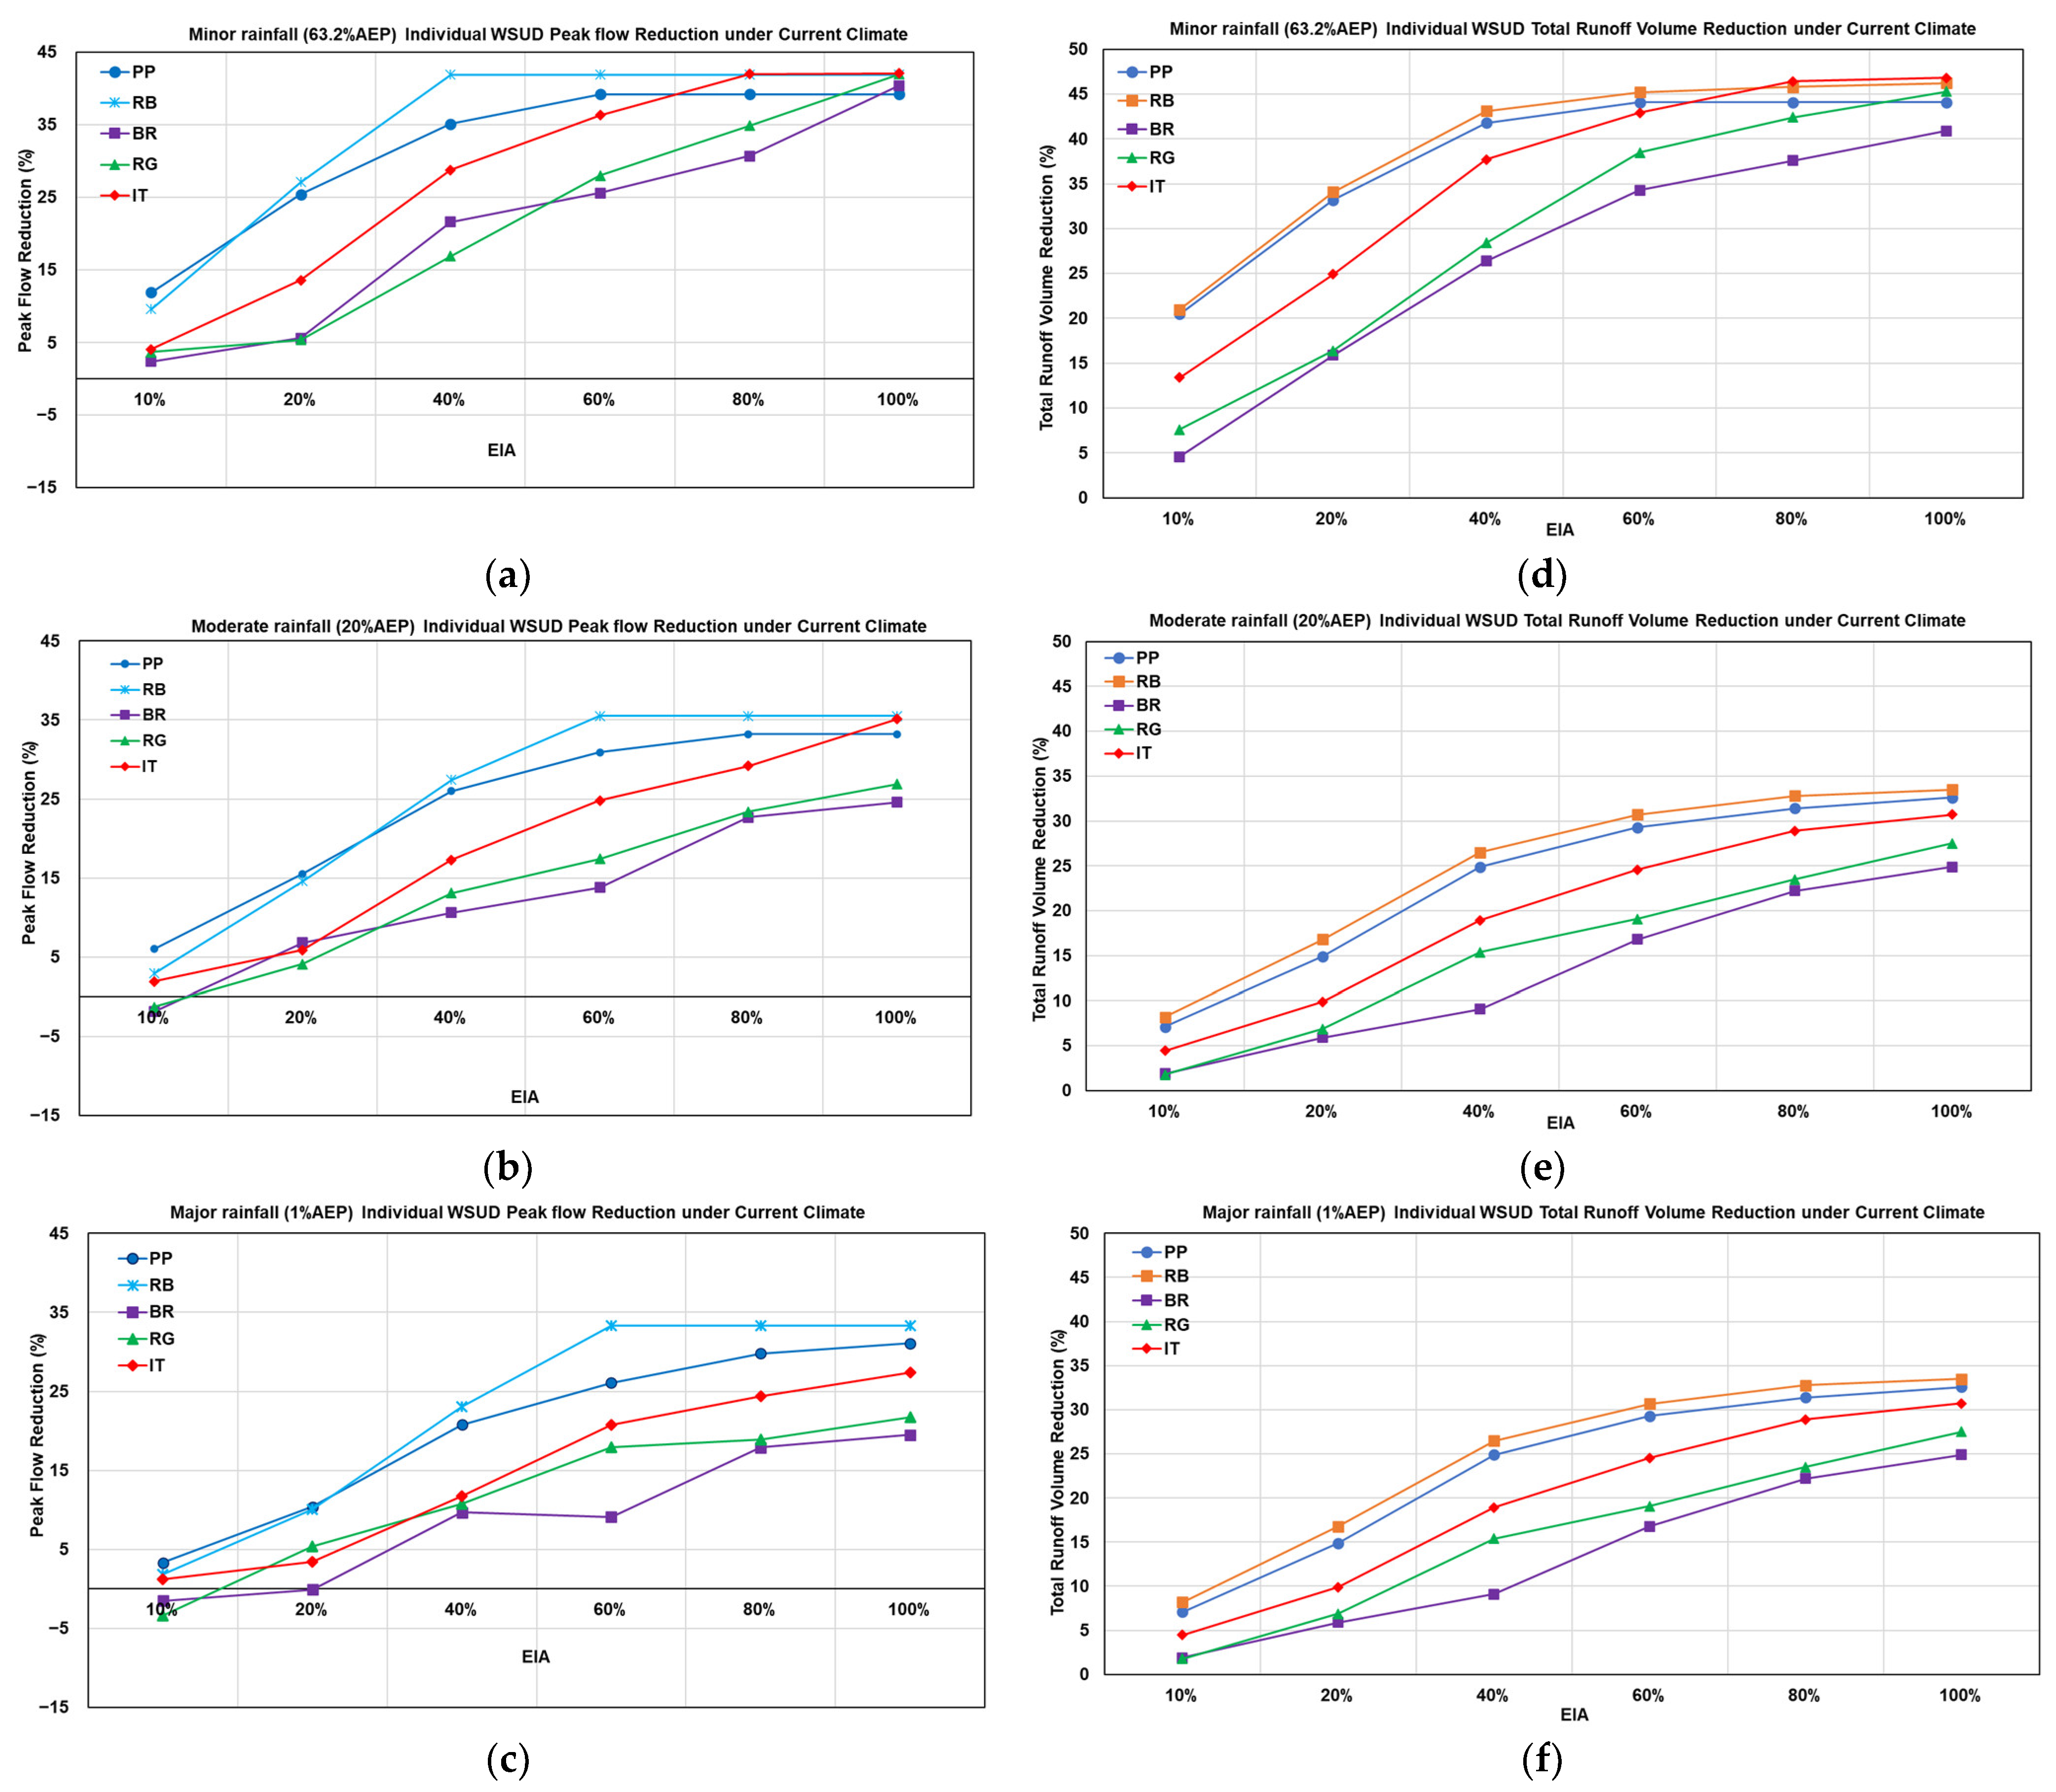
RB was the most efficient system, with PF and TRV reduction ranging from 0.9% to 41.9% and 6.7% to 46.2%, respectively. In contrast, BR was the worst-performing system, with PF and TRV reductions ranging from −6.0 % to 40.4% and 0.9% to 41.8%, respectively. The minimal or negative results imply the increment in PF and correspond to a 10% EIA reduction. In contrast, the maximum results were achieved with a 100% reduction in EIA. The individual WSUD systems’ PF and TRV reductions follow an ascending order of BR < RG < IT < PP < RB. This result demonstrates that retention-based systems, such as RB, are generally more effective than infiltration-based systems, including PP, BR, RG, and IT.
Under all rainfall scenarios, 10% to 60% EIA reduction achieved positive results for PF and TRV reduction for all types of WSUD. After a 60% EIA reduction, all WSUDs have either nominal or constant efficiency. This was because the amount of runoff the WSUD system can attenuate was insufficient relative to the increment in spatial area expansion to 100% EIA.
WSUD PF and TRV reduction efficiency for individual WSUD systems are sensitive to increased rainfall extremes. Under minor and major rainfall, the PF reduction difference between the best-performing and least-performing WSUD systems varies from 1.5% to 21.5% and 0.9% to 7.3%, respectively. In contrast, the TRV reduction performance difference between the best and least performing WSUDs during minor and major rainfall ranges from 5% to 16% and 1.5% to 3.9%, respectively. The wide range of WSUD performance differences was due to significant alterations in rainfall depth, specifically a 48% increase during major rainfall events compared to minor rainfall events. The runoff received by the system during major events was almost 3 times larger than the major design events compared to minor events. WSUD’s PF and TRV performance during major events declined, implying rainfall design event selection is a critical factor in determining WSUD performance for PF and TRV reduction, as highlighted previously [
48].
3.4. Integrated Grey and Mixed WSUD Performance
The mixed WSUD approach combines diverse types of individual WSUD and improves flood mitigation capacity [
4]. The mixed WSUD PF and TRV reductions under different rainfall scenarios for Engineers Park, along with the corresponding EIA reductions, are presented in
Figure 11.
M1 and M4 are the best and least-performing mixed WSUDs for PF and TRV reductions. Mixed WSUDs can be ranked in descending order by M1 > M2 > M3 > M4 for all rainfall scenarios. The efficiency of their individual WSUD systems governed the overall ranking of mixed WSUDs’ performance, and an in-depth performance evaluation of individual systems is critical before combining any system.
In contrast, this study did not find a noticeable PF or TRV reduction improvement, as found in earlier studies [
16,
17,
49]. Still, the improvement achieved during the simulations presented here by combining WSUD approaches cannot be underestimated.
One significant contribution following the combination was a reduction in inconsistency in the results relative to individual WSUDs. For illustration, the discrepancy in PF between the best- and worst-performing WSUDs during major rainfall is 2.1%, with a 10% EIA for individual WSUDs, which was reduced to 1.3%. Almost an 80% improvement was observed with the combination of different WSUDs. The reduction in result inconsistency stabilises the performance of the combined system under a broader range of uncertain scenarios, increasing its overall reliability.
Another significant contribution of combining different types of WSUD systems was an improvement in efficiency, even with small EIA reductions. For example, the combined WSUD system observed positive reductions in PF and TRV, with a 10% EIA reduction under all rainfall scenarios. However, in comparison with efficiency with an individual WSUD system with a 10% EIA reduction in general observed a negative PF or less than 10% TRV reduction efficiency across major and moderate rainfall events. Thus, combining WSUD systems positively contributed to improving the PF and TRV reduction efficiency, despite a minimal reduction in EIA.
3.5. Flood Maps with Grey and WSUD Measures
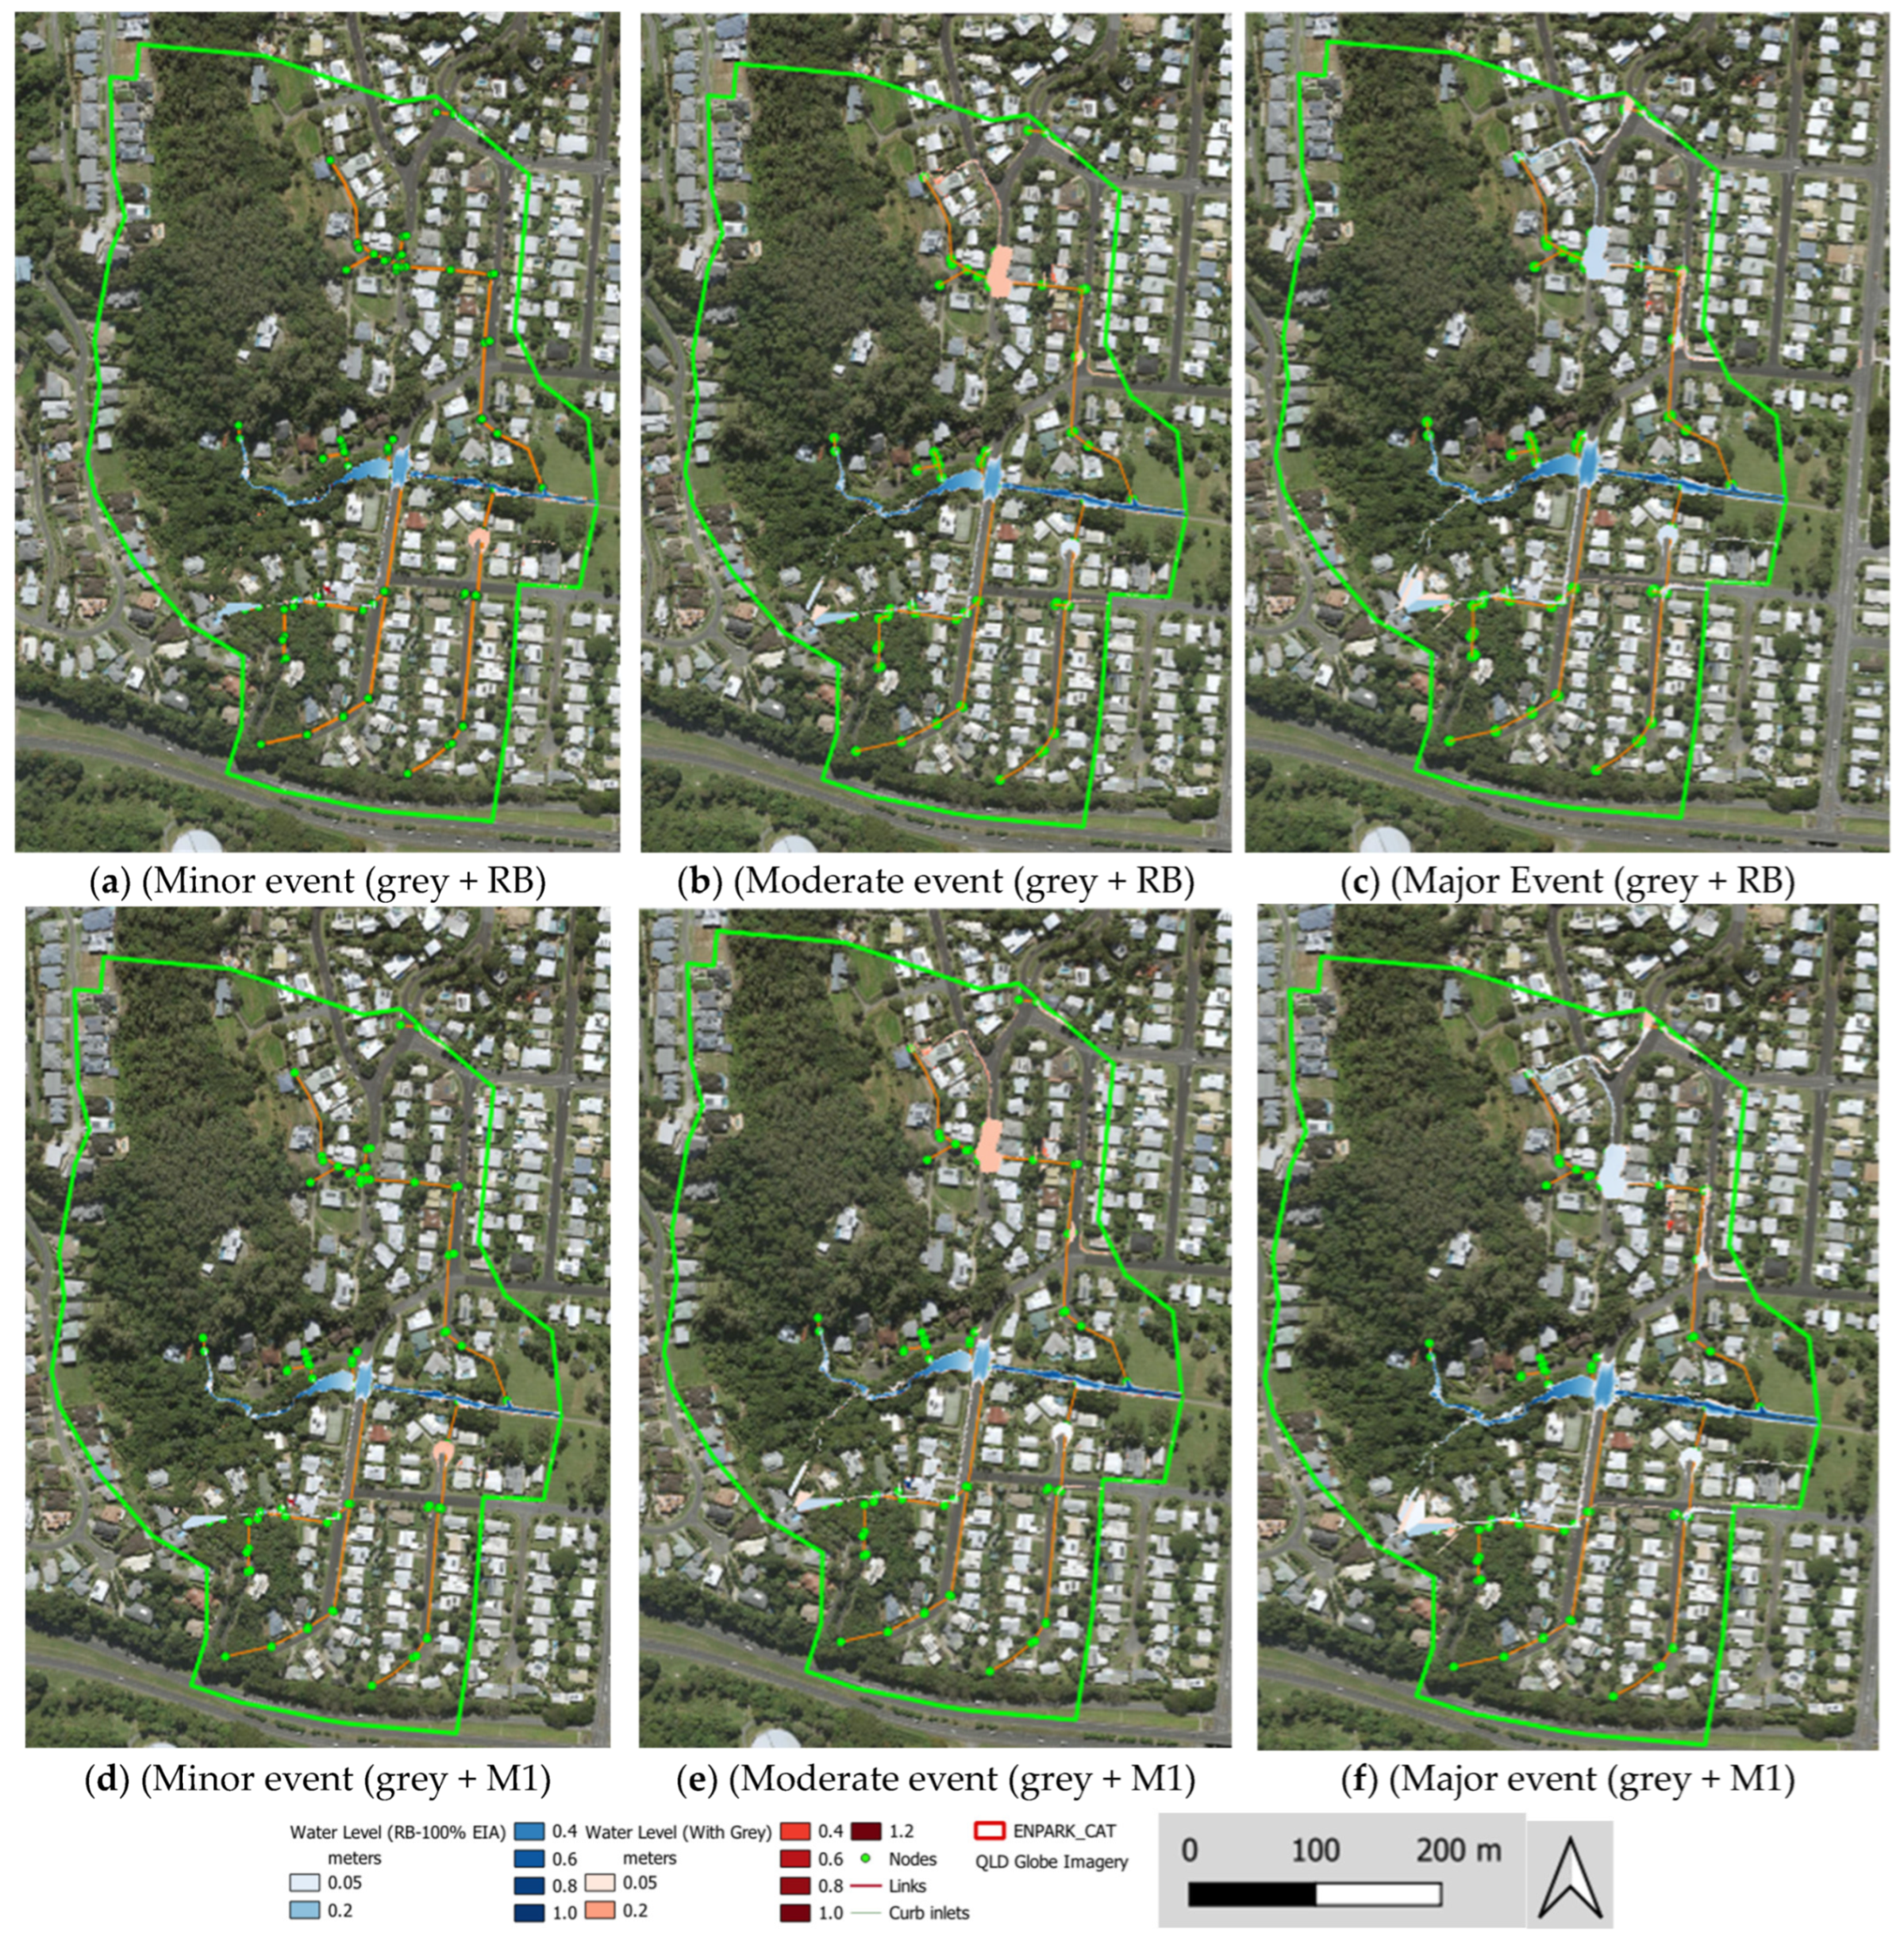
The study compared the flood mitigation performance of grey structures with that of the best-performing individual and mixed WSUD systems. The flood maps display the results for the base case scenario and after WSUD integration with grey infrastructure results, as illustrated in
Figure 12.
MWL alterations under three rainfall design events, with baseline, RB, and M1, are presented in
Figure 13. The maps show the water level variation ranging from 0.05 m to 0.76 m under different rainfall scenarios. Runoff from impervious surfaces, such as roads, paved areas, and roofs, is intercepted by nearby inlets and transported through a pipe network to the nearest drain. Under the base case scenario, the MWL variation during minor rainfall scenarios can be observed at the channel section. In contrast, water level variation propagates to the channels and the roadside as rainfall increases. However, as rainfall amounts increase during major events, the water level rises further in roadside areas, dead-end locations, and nearby hydraulic structures, such as culverts, at the study site. On the other hand, after the application of RB, the MWL at the outlet was reduced by 6.8%, 8.6%, and 20% during major, moderate, and minor rainfall, respectively. In addition, the MWL variation after the M1 system was 0.27%, 0.06%, and 10.07% during major, moderate, and minor events, respectively.
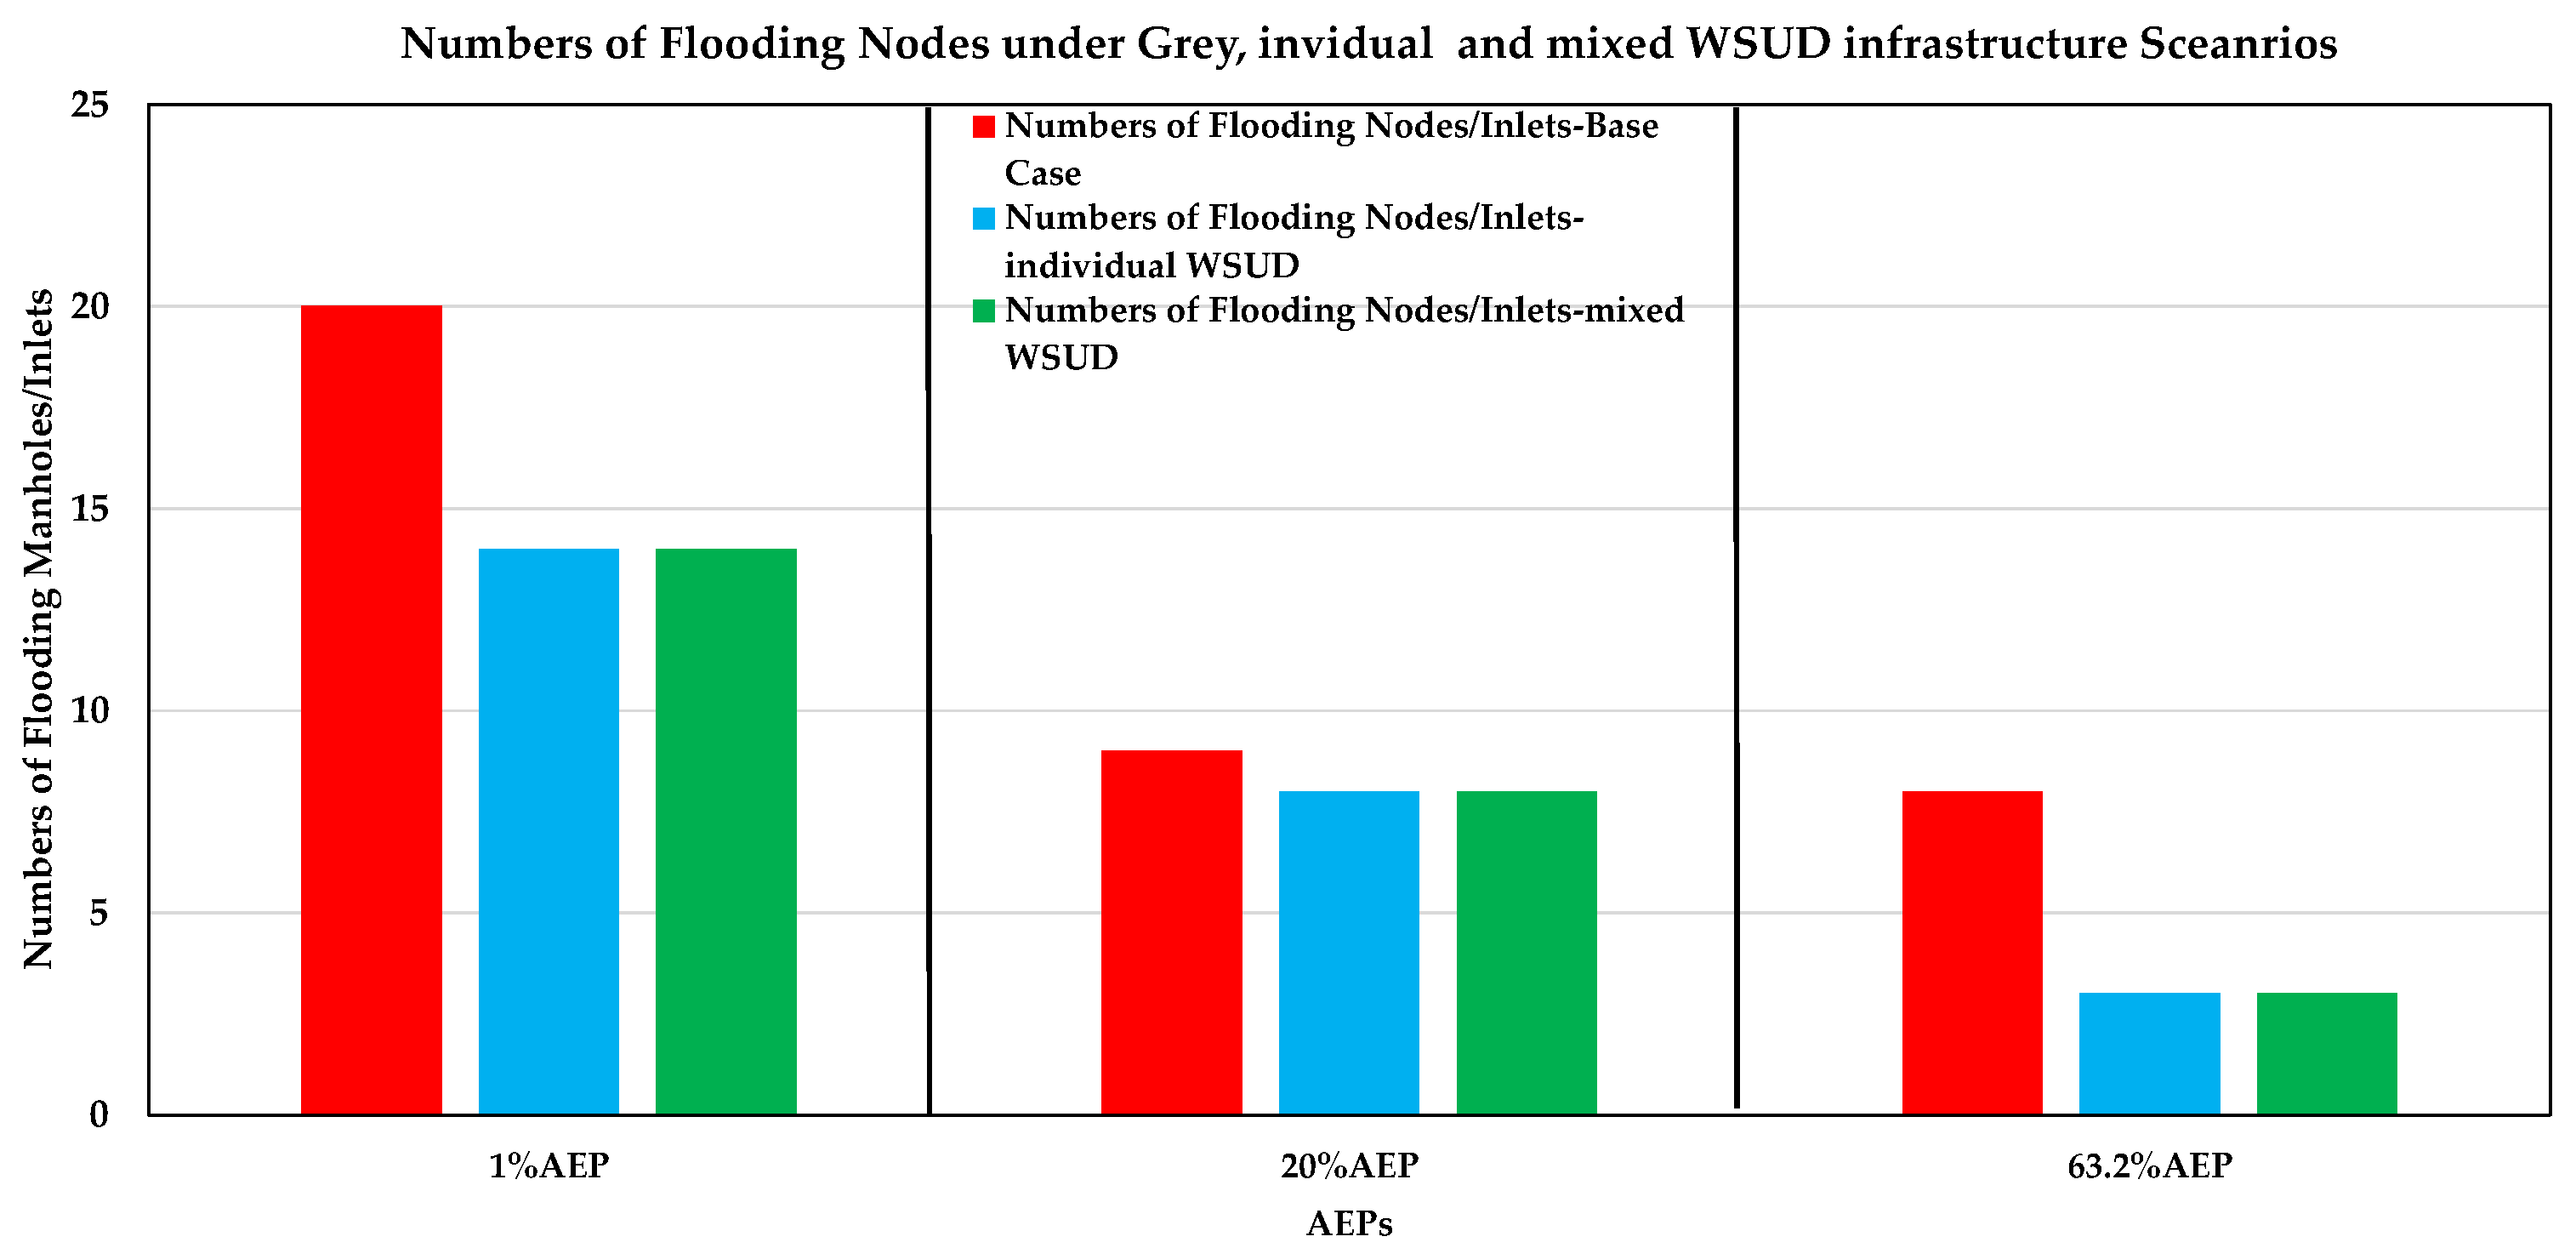
The number of flooded nodes, considering grey infrastructure and WSUD integration as mitigation measures for different rainfall scenarios, is presented in
Figure 14. The number of flooded nodes was 8 and 20 during minor and major events under the base case scenario, respectively. After the implementation of WSUD, the number of flooded nodes decreased by 30%, 11.1%, and 62.5% during major, moderate, and minor rainfall events, respectively. The node flooding reduction efficiency of WSUD was better under minor and moderate rainfall conditions. However, during major rainfall, nominal improvement was observed in the reduction of nodal flooding. The comparative assessment of flooded node variation between rainfall scenarios for similar rainfall design AEP alters by 0 to 4. With increments in rainfall amount, the capacity of inlets/manholes and pipes to deal with the inflow is reduced, initiating uncontrolled flow travelling along the roadside areas.
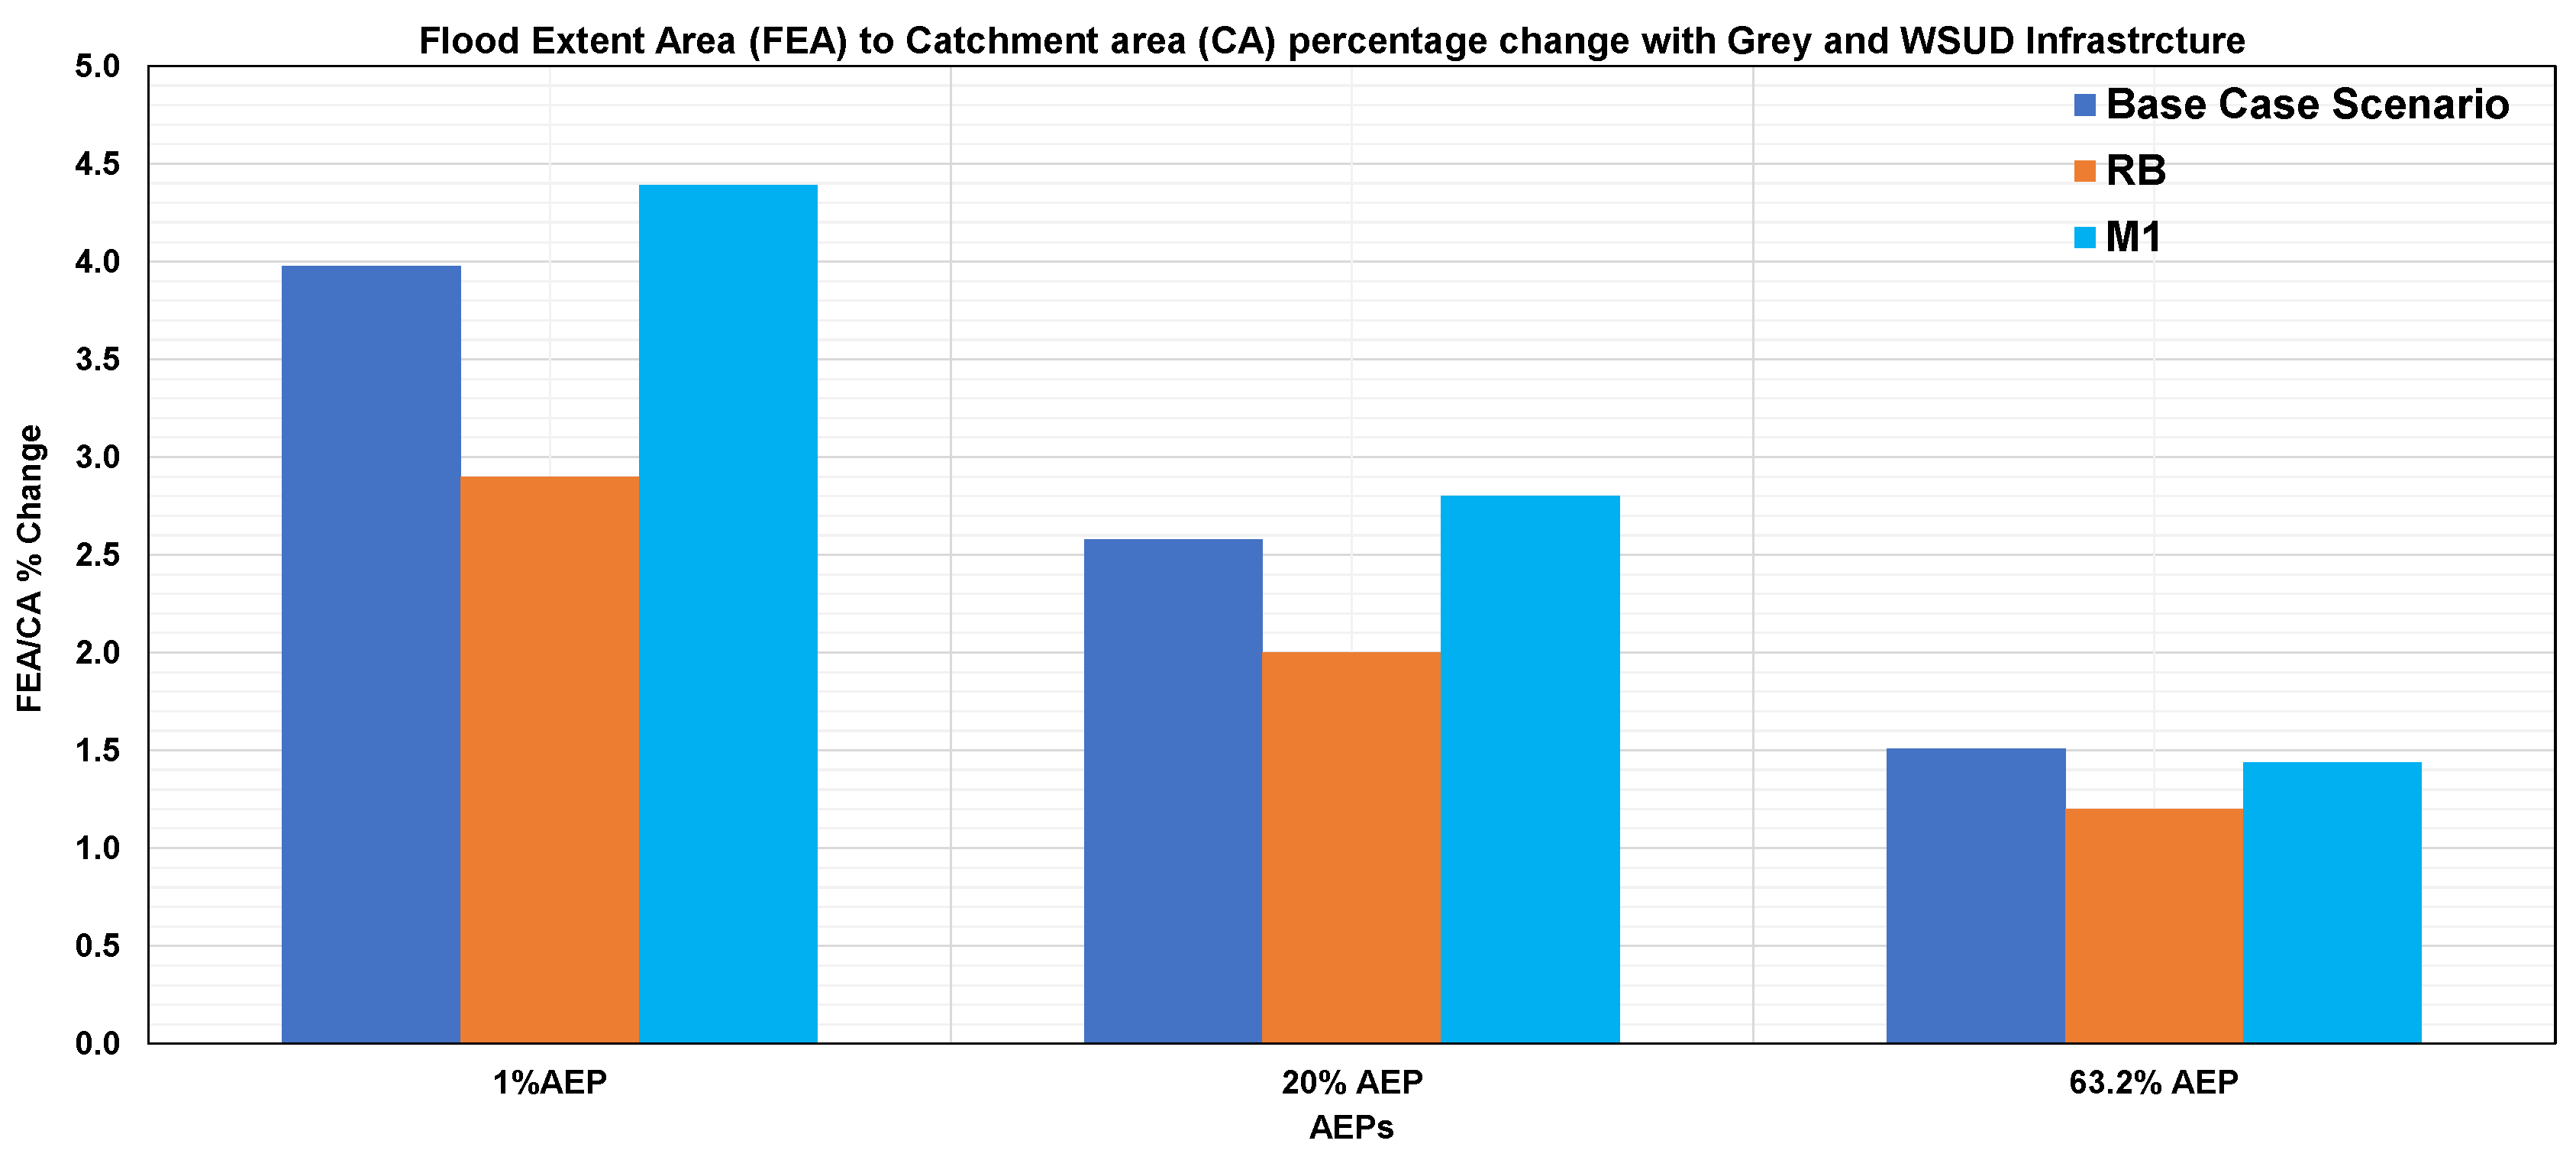
The FEA/CA ratio is another valuable parameter for the results presented in
Figure 15. The FEA/CA ratio percentage ranges from 1.5% to 4% during the base case scenario, with the small value corresponding to minor rainfall and the highest value corresponding to major events. However, using RB in all houses decreased the inundated area by 0.3% to 1.1%. However, for a mixed WSUD system (M1), the result was negative, indicating an increase in the inundated areas from 0.2% to 0.4% within the catchment. Generally, the mixed system has effectively reduced flooding [
29]. Nonetheless, it is a complex system whose performance depends on several factors, such as the types of combinations. In this case, the mixed system combines RB and PP; the infiltration-based individual system is unsuitable at this site, primarily due to increased runoff.
4. Discussion
The primary objective of this work was to understand the flooding conditions in this small tropical sub-catchment as the background to exploring the existing greywater infrastructure performance during flooding and the possibility of adding WSUD options to improve mitigation. Grey infrastructure is a potentially critical system for flood mitigation at the study site. This work investigated how grey measures perform during various rainfall events in a small tropical catchment.
4.1. Grey Infrastructure Flood Mitigation Performance
The results revealed that the performance of greywater infrastructure in mitigating floods during major events is low. During major storms, greywater infrastructure underperforms, resulting in less effective interception and transportation of the runoff generated. This condition resulted in excessive, uncontrolled overland flow along roadsides, overflow from culvert locations propagating flooding to the nearest surrounding area, and flow accumulation at dead-end sections.
On the other hand, during minor rainfall events, most of the flow is concentrated in the channel. This result implies that most of the runoff from the catchment is transported to the channel within short periods during minor rainfall, thereby limiting the water losses (infiltration and retention) during travel and increasing channel flow. As a result, greywater infrastructure contributes to the propagation of flooding from one location to another, thereby concentrating the flow and exacerbating the problem.
Furthermore, this study site is the most upstream section of the Saltwater Creek catchment. Due to the short distance between the coast and higher-elevated areas, the grey measures in the catchment quickly accelerate runoff from the catchment with minimal flow obstruction. The maximum flow travel to low-lying, highly urbanized areas increases flooding severity and flashiness downstream [
4]. The flow at roadsides was deep, and the velocity was significant, reaching up to 3.5 m/s, which can pose severe risks to vehicles during major rainfall events. This problem can be severe when other coastal factors, such as tidal surges, coincide with major rainfall events that result in extreme flows from the upstream catchment.
4.2. Grey Infrastructure Design: Philosophical Approach
Lately, approaches to improve the hydraulic capacity of existing greywater infrastructure or integrate them with other novel flood mitigation techniques are being developed, as the existing measures will not be able to handle the challenges of future rainfall conditions. Therefore, authoritative bodies such as councils must reassess their approach to enhance the design process. Such governing bodies must also reassess their approach, considering the new ARR 2019 guidelines [
50]. The new ARR approach considers extreme events, employs an IDF-based design approach, and incorporates climate change into the design of flood mitigation measures [
51]. However, there is also a debate that adopting a new approach leads to a maximum cost increment, oversizing, dysfunctional grey measures during dry periods and only contributes to shift the location of flooding [
4,
52]. Therefore, there insists on following the conservative approach suggested in the ARR to avoid this problem. In the meantime, other novel mitigation measures, such as WSUD system integration, are being adopted in new design philosophies to address future flooding challenges [
44,
49].
4.3. Individual WSUD Performance
The WSUD options tested here reduced runoff and diminished the inundated area and uncontrolled flow at roadside areas. Reducing uncontrolled flow and inundated depth at roadsides also decreases hazards to vehicles and people. In addition, on-site runoff control attributed to WSUD also reduced the runoff transported to the outlet channel, thereby reducing the extra runoff pressure on hydraulic structures, such as culverts, preventing overspilling from these locations.
Within the entire catchment context, WSUD implemented at Engineers Park helped minimise flashiness, severity, and inundation in downstream low-lying areas. WSUD’s efficiency in intercepting real-time onsite runoff from roofs, streets, and paved surfaces enhances infiltration and retention, reducing excess runoff transported to the nearest drainage network. Applying WSUD measures at this study site reduced flooding conditions at the site and in the whole catchment.
4.4. Mixed WSUD Performance
This study found that the combination of different WSUD systems improved the reliability of the results, thereby reducing discrepancies. The combination of different WSUD systems enhances the overall flood mitigation capacity compared to individual systems. This finding aligns with the study conducted by [
53]. This study observed a 10% peak flow reduction with green roofs (GRs) and bioretention basins (BRs), which increased to 23% after combining RB, BR, and permeable pavement (PP). Similarly, the reduction in the flooding area for GRs and BRs was only 33%, which increased to 56% after combining RB, BR, and PP. The results highlighted that the increase in the WSUD treatment train has a positive contribution to improving flood reduction capacity.
The combination of the WSUD system does not guarantee an increase in efficiency. A study observed a rise in flood inundation areas with the combination of WSUD. A standalone detention tank (DT) reduced the flooded area from 6% to 17% [
54]. However, after combining DT with RB and PP, the reduction of inundation was only achieved to 10% to 14%. Therefore, it is critical to understand the individual efficiency of a WSUD system within a catchment before integrating the different systems. For example, combining the least performing system with the best-performing WSUD can improve efficiency. In this study, a catchment infiltration-based system is less preferred than a retention-based system. The combination of infiltration systems might degrade the flood reduction capacity. Therefore, integrating different WSUD systems must be carefully conducted to achieve maximum benefit.
The positive result with the combination of WSUD can be a valuable finding for urban areas. Urban areas have limited land spaces, and applying the best-performing WSUD system throughout the whole catchment may not be feasible due to several reasons, such as topography, location, and soil infiltration. These features of land use areas better support the implementation of mixed types of WSUD systems, which can be utilized to address various kinds of WSUD systems and positively contribute to reducing the flooding problem in the catchment.
4.5. WSUD Flood Mitigation Performance
Overall, the WSUD modelling showed promising results for this tropical catchment. A few other studies, particularly in tropical catchments, have also shown promising results [
15,
16,
17] These studies observed PF reduction for BR (35%) [
17], RB (22% to 68%), PP (0.2–29%), VS (3.5%), IT (7% to 32%) [
17,
55]. In addition, TRV reduction efficiency ranges from BR (35%) [
17], RB (29%), PP (12%), VS (0.9%), IT (32%) [
17]. The flood reduction capacity of these measures ranges from 0 to 22% [
14,
17]. Most of these studies observed a good reduction percentage, contributing positively to flood reduction.
Although the WSUD inundation reduction is small, this value-added benefit has higher significance, indicating that WSUD measures effectively intercept direct runoff from roof surfaces, reducing roadway overland flow and runoff in channels across all rainfall scenarios. The reduction in the inundated area was substantial during major rainfall. These results suggest the possibility of rainwater harvesting. RB was the most efficient WSUD measure for this catchment. Runoff during a wet period can be stored and reused during a dry period for cleaning, watering gardens or household purposes. On the other hand, the reduction in the inundated area was almost nominal during minor rain events. This result suggests that the amount of runoff during a minor event was already insufficient, and the probability of flooding is minimal; therefore, adding WSUD measures does not significantly improve flooding reduction.
Another critical aspect of the WSUD application is its contribution to reducing the MWL during major events, thereby reducing the inundation depth. From the results, it can be observed that the most significant change in MWL occurred only for the minor design rainfall event. WSUD is effective for minor design rainfall events but has little to no effect on PF and TRV reductions for major events. This has an impact on the usefulness of WSUD in flood mitigation during major events. Thus, this result implies that the WSUD system is not a bulletproof solution for flood mitigation, especially during major rainfall events. Reasonably, integrating such measures with others can enhance contributions; however, inefficiencies during major events can limit contributions during these events.
4.6. Factors Affecting WSUD Application in Wet Tropics
Retention-based systems, such as RB, hold runoff for shorter or longer periods to reduce PF and TRV [
42]. However, the existing soil type and underlaid metamorphic rock base at this study site limited the infiltration capacity, reducing the performance of the infiltration-based systems.
On the other hand, the poorer performance of infiltration-based measures might be due to the duration of the storm and the time that water was present in the catchment. For instance, if a rainfall-runoff event takes 30 min to exit the catchment, water has 30 min to infiltrate the soil. At this study site, which has a short width and sharp gradient change, the small catchment provides only a limited time to initiate the infiltration mechanism. This significantly limits the performance of infiltration-based systems compared to retention-based systems. In contrast, runoff in a large catchment may take several days to travel from upstream to the outlet, allowing for a more extended period for water to infiltrate into the soil.
Another critical factor limiting the PF & TRV reduction performance of an individual WSUD system was EIA reduction. For example, during major rainfall events, WSUD was implemented in less than 20% of the EIA, resulting in either a negative or neutral outcome. This implies that without sufficient EIA decrease with the WSUD system, the PF reduction results achieved were less than 10% or negative. However, a gradual improvement was achieved with increased coverage of WSUD and up to 100% of EIA. For example, WSUDs such as BR and RG returned negative results with an EIA reduction of ≤20%; this was due to a reversal effect on PF reduction observed with lesser coverage of WSUD, particularly during major rainfall events [
56]. With increased rainfall extremes, the WSUD reversal effect becomes evident due to pore saturation, particularly in systems that utilize infiltration as a functional parameter for runoff attenuation.
The WSUD runoff reduction ability under different rainfall scenarios correlated with the EIA reduction [
47]. This means that the gradual increase in EIA reduction from 10% to 100% improved PF and TRV reduction for all types of WSUD. However, the performance of WSUD was altered for each WSUD under different rainfall scenarios. For example, a WSUD EIA reduction of less than 10% resulted in negative or nominal (<10%) PF and TRV increments relative to the base case scenario with greywater infrastructure. The maximum PF and TRV reductions were observed with an increment in EIA reduction up to 100%. However, all these systems suggested optimal PF and TRV results at an EIA reduction of 40% to 60%. After 60% EIA, all WSUDs considered for the assessment were observed to result in either nominal or constant reductions. This was because the direct runoff received by the WSUD was limited, even after the spatial area coverage was expanded to 100%. An earlier study has also reported similar types of results, claiming that maximum flood reduction can be achieved if 60% of the EIA of the catchment can be practically reduced [
57].
In contrast, even with a minor coverage of up to 10% EIA, TRV did not result in a reversal effect relative to the case of PF reduction. Consequently, WSUD PF reduction performance was susceptible to EIA reduction, and the types of WSUD selected were suitable for specific catchments compared to TRV reduction. Notably, urban areas with limited spaces for the application of the WSUD system can be integrated into the existing drainage system. A small area of WSUD application can benefit from reduced flooding.
Besides EIA, the PF reduction capacity of any WSUD system is governed by the study site’s topographical properties. The retention-based systems outperformed the infiltration-based systems. The selection of the wrong type of WSUD, neglecting topographic characteristics, might contribute to the increasing reversal effect of PF and TRV reduction. Overall, the study emphasized the importance of evaluating the many factors that affect WSUD performance in tropical climates.
The flood mitigation efficiency of WSUD infrastructure is critical to selecting rainfall design events. The variation between minor and major design rainfall events in this study ranged from a factor of 2 to 3. These results underscore the importance of selecting design rainfall events for WSUD flood mitigation capacity [
48]. Thus, the approach adopted in this study, which evaluates WSUD under a wide range of rainfall event sizes, increases the likelihood of reliable mitigation measures.
5. Limitations and Future Research
The DEM provided by the CRC was high-resolution and accurate. However, other data, such as greywater infrastructure measures and details like depth and invert level, are missing for some locations. These missing details were obtained by interpolation from the nearest known data.
Correct model set-up, calibration, and validation are fundamental for obtaining accurate results; some of the significant limitations encountered during this modelling work. The water level data used for model calibration and validation were collected only for a year, which is a potential limitation. Additionally, only five events were measured to develop the rating curve. Furthermore, the study catchment site lacks a rain gauge, necessitating the interpolation of rainfall data from four nearby stations for model calibration and validation. Despite these challenges, the model calibration and validation results range from fair to good.
On the other hand, the WSUD approach adopted during this study showed promising results. These results could have been further validated with measured data from the WSUD systems’ inflow and outflow. Despite the absence of a WSUD system at our study site, our results can serve as a preliminary guide for the future application of such measures in tropical regions and further validate the current findings.
Future research should focus on how flooding patterns change in response to the impact of climate change, including the effectiveness of existing flood mitigation measures. The impact of climate change on WSUD performance needs to be assessed. Most of the study focuses on the WSUD site-scale contribution; however, future research should also examine its catchment-scale implications and the suitability of centralized or decentralized application approaches.
6. Conclusions
This largely model-based study assessed the flood mitigation capacity of existing greywater infrastructure and several WSUD methods under various rainfall scenarios for a small, wet tropical catchment in Cairns City, Queensland, Australia. The interactions between runoff and the performance of the greywater infrastructure measures were evaluated under various rainfall scenarios. Furthermore, multiple WSUDs were integrated with the existing greywater infrastructure measures and assessed in comparison to base-case scenarios. It was found that the grey infrastructure implemented for flood mitigation further propagated the flooding conditions. The rainfall intensity is directly correlated with the peak and total runoff increment for the Engineers Park catchment. Grey infrastructure measures underperformed during extreme events, resulting in excessive overland flow, thereby propagating inundation.
In contrast, the existing measures were efficient during smaller rainfall events, transferring maximum runoff from various locations within the catchment to the channel and thereby propagating flooding. On the other hand, WSUD integration with greywater infrastructure has positively contributed to reducing flooding conditions within the catchment, including PF, TRV, node flooding, and the FEA ratio area, under all rainfall scenarios. The selection of individual WSUD for Engineers Park followed the ascending order of BR < RG < IT < PP < RB. In the meantime, the mixed WSUD measures suggest a descending order of M1 > M2 > M3 >M4, from best to worst. WSUD has positively contributed to reducing flooding conditions; however, the performance of such measures is influenced by several factors. With the major rainfall design events, these factors include spatial coverage (20% EIA), WSUD selection considering local topographical characteristics, rainfall design events, and climate change factors. Mixing different WSUD can positively mitigate this limitation; however, it requires careful assessment of individual WSUD performance in specific catchments before their combination.
Overall, WSUD has positively contributed to reducing flooding in this small catchment in a wet tropical climate; however, careful consideration is needed when selecting the types of WSUD and their combinations, as well as designing rainfall events. Based on the results of this study, this research approach has laid the foundation for expanding the analysis to the entire catchment, of which the Engineers Park sub-catchment represents 1.7%. In addition, this study’s results can provide a baseline for responsible bodies to decide whether to implement WSUD in this catchment and reduce the impact of flooding.
Author Contributions
Conceptualization, S.B.G. and B.J.; Data collection and modelling works, S.B.G.; investigation, S.B.G.; resources, S.B.G. and S.B.G.; writing—original draft preparation, S.B.G.; writing—review and editing, S.B.G., B.J., R.J.W. and M.B.; visualisation; supervision, B.J., R.J.W. and M.B.; All authors have read and agreed to the published version of the manuscript.
Funding
The authors gratefully acknowledge the support of James Cook University for providing the International Research Training Program (IRTPS-081386F) for funding this research. Additionally, the authors would like to acknowledge the Cairns Regional Council (PD23041 Saltwater Creek Flood Mitigation Project) and the Queensland Government Department of Environment and Science for funding this project. Furthermore, the authors would also like to thank the Hunter Research Grant [00117J] for providing the additional funds to purchase the software tools.
Data Availability Statement
The field data used in this study are available from the corresponding author upon request.
Acknowledgments
The authors would also like to acknowledge James Cook University, the Cairns Regional Council, and the Queensland Government Department of Environment, Science, and Innovation for their funding of this project. Specifically, we would like to thank Iain Brown and David Ryan for providing us with valuable data, reports, and information. The authors would like to acknowledge DHI Australia for providing the student version of the MIKE+ Tool license for research purposes. The authors also appreciate the Australian Bureau of Meteorology (BOM) and Queensland Longpaddock. The authors would also like to thank the Hunter Research Grant for providing the additional funds to purchase the tools. The authors also acknowledge all the anonymous reviewers whose comments have improved this manuscript.
Conflicts of Interest
The authors declare no conflicts of interest.
Abbreviations
The following abbreviations are used in this manuscript:
| Abbreviations | Meanings |
| WSUD | Water Sensitive Urban Design |
| NBS | Nature-based solutions |
| AEP | Annual Exceedance Probability |
| 1D | 1-Dimension |
| 2D | 2-Dimension |
| PF | Peak flow |
| TRV | Total runoff volume |
| IPCC | Intergovernmental panel on climate change |
| AHD | Australian Height Datum |
| CRC | Cairns Regional Council |
| BOM | Australian Bureau of Meteorology |
| DEM | Digital Elevations Model |
| IDW | Inverse Distance Weighting |
| ARR | Australian Rainfall and Runoff |
| ATP | Areal temporal patterns |
| ARF | Areal reduction factors |
| IFD | Intensity Frequency Duration |
| RORB | Runoff-routing |
| DHI | Danish Hydraulic Institute |
| CS | Collection system |
| GIS | Geographic Information System |
| NSE | Nash–Sutcliffe efficiency |
| RMSE | Root Mean Square Error |
| PBIAS | Percentage Bias |
| RSR | Ratio of the Root Mean Square Error to the Standard Deviation Ratio |
| PP | Porous pavement |
| RB | Rain Barrel |
| BR | Bio-retention |
| QGIS | Quantum Geographic Information System |
| EIA | Effective impervious area |
| RG | Rain garden |
| IT | Infiltration trench |
| VS | Vegetated Swales |
| TBF | Tree Box Filter |
| FEA | Flood extent area |
| DT | Detention tank |
| CA | Catchment area |
| MWL | Maximum water level |
| IL | Initial Loss |
| CL | Continuous loss |
| GHGs | Greenhouse Gases |
| RCPs | Representative concentration pathways |
| DCIA | Directly connected impervious Area |
| ICIA | Indirectly connected impervious Area |
| TIA | Total Impervious Area |
| CC | Current Climate |
Appendix A
Table A1.
List of dataset types, source, resolution and tools used in this research [
22,
24,
27,
28,
30,
46,
58].
Table A1.
List of dataset types, source, resolution and tools used in this research [
22,
24,
27,
28,
30,
46,
58].
| Data | Sources | Open/Purchase | Resolution |
|---|
| Rainfall Data | CRC | - | Tipping bucket rain gauge |
| Digital Elevation Model (DEM) | CRC | | High resolution (0.5 × 0.5 ×, 2021) |
| Shapefile (Land use/Land cover) | CRC | - | |
| Drainage network (pipe, manhole, inlets details) | CRC | - | |
| Hydrological input (ARF, ATP, IDF) | [27,46] | Open source | |
| Soil type | [22] | Open source | |
| Water level data | [24] | Field work | Pressure transducer (short duration) |
| RORB Model | [28] | Open source | |
| Storm Injector | [58] | Purchase | |
| MIKE+ | [30] | Open source (student version-unlimited) | |
References
- Kirezci, E.; Young, I.R.; Ranasinghe, R.; Lincke, D.; Hinkel, J. Global-scale analysis of socioeconomic impacts of coastal flooding over the 21st century. Front. Mar. Sci. 2023, 9, 1024111. [Google Scholar] [CrossRef]
- Najibi, N.; Devineni, N. Recent trends in the frequency and duration of global floods. Earth Syst. Dyn. 2018, 9, 757–783. [Google Scholar] [CrossRef]
- Hooijer, A.; Vernimmen, R. Global LiDAR land elevation data reveal greatest sea-level rise vulnerability in the tropics. Nat. Commun. 2021, 12, 1–7. [Google Scholar] [CrossRef] [PubMed]
- Chen, W.; Wang, W.; Huang, G.; Wang, Z.; Lai, C.; Yang, Z. The capacity of grey infrastructure in urban flood management: A comprehensive analysis of grey infrastructure and the green-grey approach. Int. J. Disaster Risk Reduct. 2021, 54, 102045. [Google Scholar] [CrossRef]
- Miguez, M.G.; Rezende, O.M.; Veról, A.P. City Growth and Urban Drainage Alternatives: Sustainability Challenge. J. Urban Plan. Dev. 2015, 141, 04014026. [Google Scholar] [CrossRef]
- Martínez, C.; Vojinovic, Z.; Sanchez, A. Multi-Objective Model-Based Assessment of Green-Grey Infrastructures for Urban Flood Mitigation. Hydrology 2021, 8, 110. [Google Scholar] [CrossRef]
- Hoban, A. Water Sensitive Urban Design Approaches and Their Description; Elsevier: Amsterdam, The Netherlands, 2019; pp. 25–47. [Google Scholar]
- Zhu, Z.; Chen, X. Evaluating the effects of low impact development practices on urban flooding under different rainfall intensities. Water 2017, 9, 548. [Google Scholar] [CrossRef]
- Cook, S.; van Roon, M.; Ehrenfried, L.; LaGro, J.; Yu, Q. WSUD “Best in Class”-Case Studies From Australia, New Zealand, United States, Europe, and Asia; Elsevier: Amsterdam, The Netherlands, 2018; pp. 561–585. [Google Scholar]
- Eckart, K.; McPhee, Z.; Bolisetti, T. Performance and implementation of low impact development—A review. Sci. Total Environ. 2017, 607, 413–432. [Google Scholar] [CrossRef]
- Walker, C.; Lucke, T. Urban Lakes as a WSUD System; Elsevier: Amsterdam, The Netherlands, 2018; pp. 269–285. [Google Scholar]
- Ferrini, F.; Fini, A.; Mori, J.; Gori, A. Role of vegetation as a mitigating factor in the urban context. Sustainability 2020, 12, 4247. [Google Scholar] [CrossRef]
- Patel, P.; Karmakar, S.; Ghosh, S.; Aliaga, D.G.; Niyogi, D. Impact of green roofs on heavy rainfall in tropical, coastal urban area. Environ. Res. Lett. 2021, 16, 074051. [Google Scholar] [CrossRef]
- Teang, L.; Wongwatcharapaiboon, J.; Irvine, K.; Jamieson, I.; Rinchumphu, D. Modelling the Impact of Water Sensitive Urban Design on Pluvial Flood Management in a Tropical Climate. In Proceedings of the 12th Built Environment Research Associates Conference, BERAC2021, Bangkok, Thailand, 28 June 2021. [Google Scholar]
- Yau, W.K.; Radhakrishnan, M.; Liong, S.Y.; Zevenbergen, C.; Pathirana, A. Effectiveness of ABC waters design features for runoff quantity control in Urban Singapore. Water 2017, 9, 577. [Google Scholar] [CrossRef]
- Goncalves, M.L.R.; Zischg, J.; Rau, S.; Sitzmann, M.; Rauch, W.; Kleidorfer, M. Modeling the effects of introducing low impact development in a tropical city: A case study from Joinville, Brazil. Sustainability 2018, 10, 728. [Google Scholar] [CrossRef]
- Vojinovic, Z.; Alves, A.; Gómez, J.P.; Weesakul, S.; Keerakamolchai, W.; Meesuk, V.; Sanchez, A. Effectiveness of small- and large-scale Nature-Based Solutions for flood mitigation: The case of Ayutthaya, Thailand. Sci. Total Environ. 2021, 789, 147725. [Google Scholar] [CrossRef]
- Leon, C.T. Towards a Water Sensitive Urban Design (WSUD) Approach for Lima—Peru. Ph.D. Dissertation, Frankfurt University of Applied Sciences, Frankfurt, Germany, September 2021. [Google Scholar]
- Avazpour, B.P.O.; Corkery, L. Rehabilitating dryland river systems in arid and semi-arid environments focusing on water sensitive urban design approaches. OIDA Int. J. Sustain. Dev. 2018, 11, 11–20. Available online: https://www.melbournewater.com.au/sites/default/files/South-Eastern-councils-WSUD-guidelines.pdf (accessed on 12 August 2023).
- Melbourne, W. Water Sensitive Urban Design Guidelines South Eastern Councils; WSUD: Melbourne, VI, Australia, 2013; p. 44. [Google Scholar]
- Available online: http://www.bom.gov.au/climate/averages/tables/cw_031011.shtml (accessed on 12 August 2023).
- Available online: https://geoscience.data.qld.gov.au/data/map-collection/mr002086 (accessed on 16 October 2023).
- Brown, I.W.; McDougall, K.; Alam, M.J.; Chowdhury, R.; Chadalavada, S. Calibration of a continuous hydrologic simulation model in the urban Gowrie Creek catchment in Toowoomba, Australia. J. Hydrol. Reg. Stud. 2022, 40, 101021. [Google Scholar] [CrossRef]
- Available online: https://www.hobodataloggers.com.au/ (accessed on 15 May 2023).
- Ball, J.; Kuczera, G.; Lambert, M.; Nathan, R.; Weeks, B.; Sharma, A.; Bates, B.; Finlay, S. A Guide to Flood Estimation Book 2: Rainfall Estimation; Australian Goverment: Canberra, Australia, 2019; p. 1074, 9781925848366.
- WMAwater. Australian Rainfall Runoff Revision Project 3: Temporal Patterns of Rainfall—Stage 3 Report; WMAwater: Brisbane, QLD, Australia, 2015; p. 62. [Google Scholar]
- Available online: http://www.bom.gov.au/water/designRainfalls/revised-ifd/?year=2016 (accessed on 12 August 2023).
- Available online: https://harc.com.au/software/rorb/ (accessed on 5 August 2023).
- Laurenson, E.M.; Mein, R.G.; Nathan, R.J. User Manual of RORB Version 6, Runoff Routing Program; Department of Civil Engineering, Monash University: Clayton, VI, Australia, 2010; Available online: https://www.monash.edu/engineering/departments/civil/research/research-themes/water-in-a-changing-environment/rorb/obtain (accessed on 12 August 2023).
- Available online: https://www.dhigroup.com/technologies/mikepoweredbydhi/mikeplus (accessed on 6 June 2022).
- DHI. MIKE 2022 MIKE+ User Guide Model Manager; DHI: Brisbane, QLD, Australia, 2022. [Google Scholar]
- Hernes, R.R. Evaluating Hydrological Performance of LID-Modules in Mike Urban-A Case Study of CSO Reduction in Grefsen Oslo, Norway. Master’s Thesis, Norwegian University of Science and Technology, Trondheim, Norway, 2018. [Google Scholar]
- Haghighatafshar, S.; Nordlöf, B.; Roldin, M.; Gustafsson, L.G.; la Cour Jansen, J.; Jönsson, K. Efficiency of blue-green stormwater retrofits for flood mitigation—Conclusions drawn from a case study in Malmö, Sweden. J. Environ. Manag. 2018, 207, 60–69. [Google Scholar] [CrossRef]
- DHI. MIKE Flood 1D-2D Modelling User Manual; DHI: Brisbane, QLD, Australia, 2017; pp. 1–160.
- Ball, J.; Babister, M.; Retallick, M.; Weinmann, E. Australian Rainfall & Runoff Book 1: A Guide to Flood Estimation; Australian Government: Canberra, Australia, 2019. [Google Scholar]
- Althoff, D.; Rodrigues, L.N. Goodness-of-fit criteria for hydrological models: Model calibration and performance assessment. J. Hydrol. 2021, 600, 126674. [Google Scholar] [CrossRef]
- Alam, M.S. Calibration of a flood model using the MIKE FLOOD modelling package employing the direct rainfall technique. In Proceedings of the 21st International Congress on Modelling and Simulation, Gold Coast, Australia, 29 November–4 December 2015. [Google Scholar]
- Wang, S.; Zhang, Z.; Sun, G.; Strauss, P.; Guo, J.; Tang, Y.; Yao, A. Multi-site calibration, validation, and sensitivity analysis of the MIKE SHE Model for a large watershed in northern China. Hydrol. Earth Syst. Sci. 2012, 16, 4621–4632. [Google Scholar] [CrossRef]
- Palla, A.; Gnecco, I. Hydrologic modelling of Low Impact Development systems at the urban catchment scale. J. Hydrol. 2015, 528, 361–368. [Google Scholar] [CrossRef]
- Alley, W.M.; Veenhuis, J.E. Effective Impervious Area in Urban Runoff Modelling. J. Hydraul. Eng. 1983, 109, 313–319. [Google Scholar] [CrossRef]
- Ebrahimian, A.; Wilson, B.N.; Gulliver, J.S. Improved methods to estimate the effective impervious area in urban catchments using rainfall-runoff data. J. Hydrol. 2016, 536, 109–118. [Google Scholar] [CrossRef]
- Ladson, A. Using WSUD to Restore Predevelopment Hydrology; Elsevier: Amsterdam, The Netherlands, 2018; pp. 209–228. [Google Scholar]
- Myers, B.R.; Pezzaniti, D. Flood and Peak Flow Management Using WSUD Systems; Elsevier: Amsterdam, The Netherlands, 2018; pp. 119–138. [Google Scholar]
- Vojinovic, Z.; van Teeffelen, J. An integrated stormwater management approach for small islands in tropical climates. Urban Water J. 2007, 4, 211–231. [Google Scholar] [CrossRef]
- Hamlyn-Harris, D.; McAlister, T.; Dillon, P. Water Harvesting Potential of WSUD Approaches; Elsevier: Amsterdam, The Netherlands, 2018; pp. 177–208. [Google Scholar]
- Available online: https://data.arr-software.org/ (accessed on 12 August 2023).
- Wasko, C.; Nathan, R.; Peel, M.C. Changes in Antecedent Soil Moisture Modulate Flood Seasonality in a Changing Climate. Water Resour. Res. 2020, 56, e2019WR026300. [Google Scholar] [CrossRef]
- Zhou, Q. A review of sustainable urban drainage systems considering the climate change and urbanization impacts. Water 2014, 6, 976–992. [Google Scholar] [CrossRef]
- Ruangpan, L.; Vojinovic, Z.; Di Sabatino, S.; Leo, L.S.; Capobianco, V.; Oen, A.M.P.; McClain, M.E.; Lopez-Gunn, E. Nature-based solutions for hydro-meteorological risk reduction: A state-of-the-art review of the research area. Nat. Hazards Earth Syst. Sci. 2020, 20, 243–270. [Google Scholar] [CrossRef]
- Ball, J.; Babister, M.; Nathan, R.; Weeks, W.; Weinmann, E.; Retallick, M.; Testoni, I. Australian Rainfall and Runoff, Version 4.2; Geoscience Australia: Canberra, Australia, 2019. [Google Scholar]
- Sui, X.; van de Ven, F. Can the implementation of Low Impact Development reduce basin runoff? Hydrol. Earth Syst. Sci. 2021, 2021, 1–24. [Google Scholar] [CrossRef]
- Haghighatafshar, S.; Becker, P.; Moddemeyer, S.; Persson, A.; Sörensen, J.; Aspegren, H.; Jönsson, K. Paradigm shift in engineering of pluvial floods: From historical recurrence intervals to risk-based design for an uncertain future. Sustain. Cities Soc. 2020, 61, 102317. [Google Scholar] [CrossRef]
- Boongaling, C.G.K.; Sevilla-Nastor, J.B.; Espaldon, M.V.O.; Sanchez, P.A.J.; Villanueva-Peyraube, J.D.; Jago-on, K.A.B. Assessment of low impact development (LID) strategies under different land uses in an urban sub-catchment in the Philippines. J. Environ. Manag. 2024, 369, 122328. [Google Scholar] [CrossRef]
- Liew, Y.S.; Desa, S.M.; Noh, M.N.; Tan, M.L.; Zakaria, N.A.; Chang, C.K. Assessing the effectiveness of mitigation strategies for flood risk reduction in the segamat river basin, Malaysia. Sustainability 2021, 13, 3286. [Google Scholar] [CrossRef]
- Suresh, A.; Pekkat, S.; Subbiah, S. Quantifying the efficacy of Low Impact Developments (LIDs) for flood reduction in micro-urban watersheds incorporating climate change. Sustain. Cities Soc. 2023, 95, 104601. [Google Scholar] [CrossRef]
- Tansar, H.; Duan, H.F.; Mark, O. Catchment-Scale and Local-Scale Based Evaluation of LID Effectiveness on Urban Drainage System Performance. Water Resour. Manag. 2022, 36, 507–526. [Google Scholar] [CrossRef]
- Feitosa, R.C.; Wilkinson, S. Modelling green roof stormwater response for different soil depths. Landsc. Urban Plan. 2016, 153, 170–179. [Google Scholar] [CrossRef]
- Available online: https://csse.com.au/index.php/products/storm-injector (accessed on 8 August 2023).
Figure 1.
Location of Engineers Park sub-catchment inside Saltwater Creek catchment, and in Australia. Drainage network and digital elevation model for Engineers Park, with key features shown.
Figure 1.
Location of Engineers Park sub-catchment inside Saltwater Creek catchment, and in Australia. Drainage network and digital elevation model for Engineers Park, with key features shown.
Figure 2.
Existing natural and grey infrastructure in Engineers Park catchment.
Figure 2.
Existing natural and grey infrastructure in Engineers Park catchment.
Figure 3.
Rain gauge stations near the study site.
Figure 3.
Rain gauge stations near the study site.
Figure 4.
Land use/land cover map for Engineers Park catchment.
Figure 4.
Land use/land cover map for Engineers Park catchment.
Figure 5.
Pressure transducer location at Engineers Park channel outlet to measure water depth [
24].
Figure 5.
Pressure transducer location at Engineers Park channel outlet to measure water depth [
24].
Figure 6.
Rating curve for Engineers Park channel outlet.
Figure 6.
Rating curve for Engineers Park channel outlet.
Figure 7.
Flood modelling approach and steps flowchart.
Figure 7.
Flood modelling approach and steps flowchart.
Figure 8.
RORB model catchment file for Engineers Park with key features.
Figure 8.
RORB model catchment file for Engineers Park with key features.
Figure 9.
Schematic setup in MIKE+ Model (modified and adapted from [
33,
34].
Figure 9.
Schematic setup in MIKE+ Model (modified and adapted from [
33,
34].
Figure 10.
WSUD PF and TRV reduction performance of an individual WSUD system integrated with grey measures under three designed rainfall scenarios ((a) = PF reduction under minor rainfall design event, (b) = PF reduction under moderate rainfall design event, (c) = PF reduction under major rainfall design event, (d) = TRV reduction under minor rainfall design event, (e) = TRV reduction under moderate rainfall design event, (f) = TRV reduction under major rainfall design event).
Figure 11.
WSUD PF and TRV reduction performance of a mixed WSUD system integration with grey measures under three design rainfall scenarios (a) = PF reduction under minor rainfall design event, (b) = PF reduction under moderate rainfall design event, (c) = PF reduction under major rainfall design event, (d) = TRV reduction under minor rainfall design event, (e) = TRV reduction under moderate rainfall design event, (f) = TRV reduction under major rainfall design event).
Figure 12.
The best-performing individual and mixed WSUD systems (PP+RB) integrated with grey measures result in an overlay inundation map with a base case scenario under minor, moderate, and major rainfall scenarios. Here, (a) = RB with 100% of EIA reduction during minor rainfall design, (b) = RB with 100% of EIA reduction during moderate rainfall, (c) = RB with 100% of EIA reduction during major rainfall, (d) = M1 with 100% of EIA reduction during minor rainfall, (e) = M1 with 100% of EIA reduction during moderate rain, (f) = M1 with 100% of EIA reduction during major rainfall event).
Figure 13.
Engineers Park MWL variation at the outlet location, with a base case scenario, best individual and mixed (RB & M1) WSUDs, and 100% EIA.
Figure 13.
Engineers Park MWL variation at the outlet location, with a base case scenario, best individual and mixed (RB & M1) WSUDs, and 100% EIA.
Figure 14.
Engineers Park nodal flooding under the CC with base case scenario and best individual and mixed WSUDs (RB & M1) with 100% EIA.
Figure 14.
Engineers Park nodal flooding under the CC with base case scenario and best individual and mixed WSUDs (RB & M1) with 100% EIA.
Figure 15.
Engineers Park FEA/CA with grey and individual (RB) and mixed WSUD (M1) with 100% EIA.
Figure 15.
Engineers Park FEA/CA with grey and individual (RB) and mixed WSUD (M1) with 100% EIA.
Table 1.
Description and location of rain gauges where rainfall data were collected for this study.
Table 1.
Description and location of rain gauges where rainfall data were collected for this study.
| Rain Gauge Notation | Descriptions | Latitude | Longitude | Distance to the Centroid of Catchment (km) |
|---|
| RESEDG | A rain gauge near the Botanical Garden | −16.89 | 145.74 | 2.725 |
| RESROB | Nearby Wood monk Close Park | −16.92 | 145.71 | 2.075 |
| RESWHG | Nearby detention basin | −16.91 | 145.72 | 0.572 |
| SPST1 | Lennon Street Park | −16.93 | 145.74 | 2.889 |
| Centroid of Engineers Park | −16.91 | 145.72 | |
Table 2.
Land use characteristics of the study site.
Table 2.
Land use characteristics of the study site.
| Land Use | Area (km2) | Percentage |
|---|
| Buildings | 0.063 | 23.3 |
| Roads | 0.059 | 21.9 |
| Open spaces | 0.001 | 0.4 |
| Forest | 0.136 | 50.4 |
| Partial Driveways | 0.008 | 3 |
| Pool/Hardstand | 0.003 | 1.1 |
| Total | 0.27 | 100 |
| Planned WSUD application area | 0.0127 | 4.7 |
Table 3.
Rainfall events considered for calibration and validation.
Table 3.
Rainfall events considered for calibration and validation.
| Events | Time (Hr.) | Rainfall Depth (mm) |
|---|
| Calibration Events |
| 6 March 2023 | 17.3 | 108.2 |
| 7 March 2023 | 10 | 6.8 |
| 24 April 2023 | 20 | 38.9 |
| 17 June 2023 | 4.8 | 3.8 |
| 26 July 2023 | 42.9 | 32.8 |
| Validation Events |
| 25 February 2023 | 20.8 | 5.03 |
| 5 March2023 | 17.3 | 131.4 |
| 17 April 2023 | 13.8 | 12.6 |
| 13 May 2023 | 8 | 5.8 |
| 03 July 2023 | 29 | 11.2 |
Table 4.
Goodness of fit criteria.
Table 4.
Goodness of fit criteria.
Performance
Rating | Peak Flow/Volume
Error (%) | NSE | PBIAS | RSR |
|---|
| Very Good | | 1 to 0.75 | <±10 | 0 to 0.5 |
| Good | | 0.65 to 0.75 | ±10 to ± 15 | 0.5 to 0.6 |
| Satisfactory | ±20 | 0.50 to 0.65 | ±15 to ± 25 | 0.6 to 0.7 |
| Unsatisfactory | >±20 | <0.5 | ±25 | >0.7 |
Table 5.
Model simulation scenarios.
Table 5.
Model simulation scenarios.
| Scenarios | | Descriptions |
|---|
| Current Climate (CC) | Base case
scenario | |
WSUD
Scenario | MIKE+ hydrological (kinematic wave) simulation using existing land-use data, existing grey infrastructure, and various WSUD systems. MIKE+ hydrological simulation with WSUD with 10%, 20%, 40%, 60%, 80% and 100% EIA reduction. Individual WSUD (Porous pavement–PP, Rain Barrel–RB, Bio-retention–BR, Rain garden–RG, Infiltration trench–IT). Mixed WSUD (M1 = PP + RB, M2 = PP + RB + BR, M3 = PP + RB + BR + RG and M4 = PP + RB + BR + RG + IT).
|
|
Table 6.
Summary of calibrated events.
Table 6.
Summary of calibrated events.
| Event | Peak Flow
Error (%) | Total Volume Error (%) | Lag Time (Minutes) | NSE | PBIAS | RSR |
|---|
| RORB Model Calibration Results |
| 6 March 2023 | −0.36 | −1.4 | 40 | 0.63 | −1.0 | 0.7 |
| 7 March 2023 | 0.89 | 1.97 | 25 | 0.56 | 2 | 0.7 |
| 24 April 2023 | 0.58 | 1.68 | 25 | 0.57 | −0.5 | 0.7 |
| 17 June 2023 | 0.09 | 0.25 | 20 | 0.81 | 0.3 | 0.14 |
| 26 July 2023 | 0 | 0.6 | 55 | 0.62 | 1 | 0.56 |
| MIKE + Model Calibration Results |
| 6 March 2023 | 2.57 | 1.64 | 10 | 0.55 | 1.6 | 0.53 |
| 7 March 2023 | 0.89 | 1.97 | 15 | 0.65 | 2 | 0.69 |
| 24 April 2023 | −0.38 | −0.51 | 30 | 0.6 | 0.1 | 0.66 |
| 17 June 2023 | 0.05 | 1.2 | 20 | 0.77 | 0.8 | 0.55 |
| 26 July 2023 | −4.1 | 4.7 | 65 | 0.66 | 4.7 | 0.69 |
Table 7.
Summary of validation events.
Table 7.
Summary of validation events.
| Event | Peak Flow
Error (%) | Total Volume Error (%) | Lag TIME (Minutes) | NSE | PBIAS | RSR |
|---|
| RORB Model Validation Results |
| 25 February 2023 | −0.15 | −0.05 | 70 | 0.73 | −0.05 | 0.71 |
| 5 March 2023 | −0.01 | 0.08 | 60 | 0.55 | 0.1 | 1.01 |
| 17 April 2023 | 0.04 | −0.03 | 20 | 0.76 | −0.03 | 0.52 |
| 13 May 2023 | 0.00 | 1.41 | 130 | 0.89 | 1.4 | 0.33 |
| 3 July 2023 | −0.50 | −0.18 | 15 | 0.65 | 1.2 | 0.46 |
| MIKE + Model Validation Results |
| 25 February 2023 | −0.01 | −0.89 | 80 | 0.65 | 1 | 0.75 |
| 5 March 2023 | −0.02 | 17.27 | 20 | 0.54 | 0.1 | 0.7 |
| 17 April 2023 | 0.32 | −0.153 | 20 | 0.76 | 0.01 | 0.60 |
| 13 May 2023 | −0.38 | −0.51 | 130 | 0.74 | −0.5 | 0.7 |
| 3 July 2023 | −0.35 | 2.45 | 35 | 0.66 | 2.5 | 0.52 |
Table 8.
MIKE+ calibrated and validated parameters against those adopted to develop rainfall design events.
Table 8.
MIKE+ calibrated and validated parameters against those adopted to develop rainfall design events.
| Components | Parameters | Calibrated Value |
|---|
| | Impervious | Pervious |
| | Steep | Flat | Low | Moderate | High |
| Initial Loss | 0.05 | 0.05 | 1 | 1 to 2 | 1 to 3 |
| Wetting loss (mm) | | 0.1 to 1 | 1 to 2 | 1 to 3 | 1 to 4 |
| Storage (mm) | | 0 to 0.6 | 0 to 1 | 0 to 2 | 0 to 3 |
| Horton’s infiltration capacity (mm/hr) |
| Maximum (mm/hr.) | | | 0 to 40 | 10 to 50 | 90 (20–90) |
| Minimum (mm/hr) | | | 0 to 15 | 60 to 20 | 9 to 30 |
| Horton’s infiltration exponent (/s) |
| Wet condition | | | 0.0015 | 0.0015 | 0.0015 |
| Dry condition | | | 1E-10 | 1E-09 | 1E-08 |
| Roughness- Manning Coefficient (n)-s/m(1/3) | 0.011 | 0.012 | 0.016 | 0.05 | 0.1 |
Table 9.
PF and TRV alteration under different rainfall scenarios.
Table 9.
PF and TRV alteration under different rainfall scenarios.
| AEP/Critical Time | Design Rainfall Depth (mm) | PF (m3/s) | TRV—m3 |
|---|
| Minor (63.2% AEP), Critical time: 30 min | 33.71 | 3.63 | 0.33 × 10⁶ |
| Moderate (20% AEP), Critical time: 30 min | 47.4 | 6.03 | 0.47 × 10⁶ |
| Major (1% AEP), Critical time: 25 min | 64.5 | 10.18 | 1.56 × 10⁶ |
| Disclaimer/Publisher’s Note: The statements, opinions and data contained in all publications are solely those of the individual author(s) and contributor(s) and not of MDPI and/or the editor(s). MDPI and/or the editor(s) disclaim responsibility for any injury to people or property resulting from any ideas, methods, instructions or products referred to in the content. |
© 2025 by the authors. Licensee MDPI, Basel, Switzerland. This article is an open access article distributed under the terms and conditions of the Creative Commons Attribution (CC BY) license (https://creativecommons.org/licenses/by/4.0/).


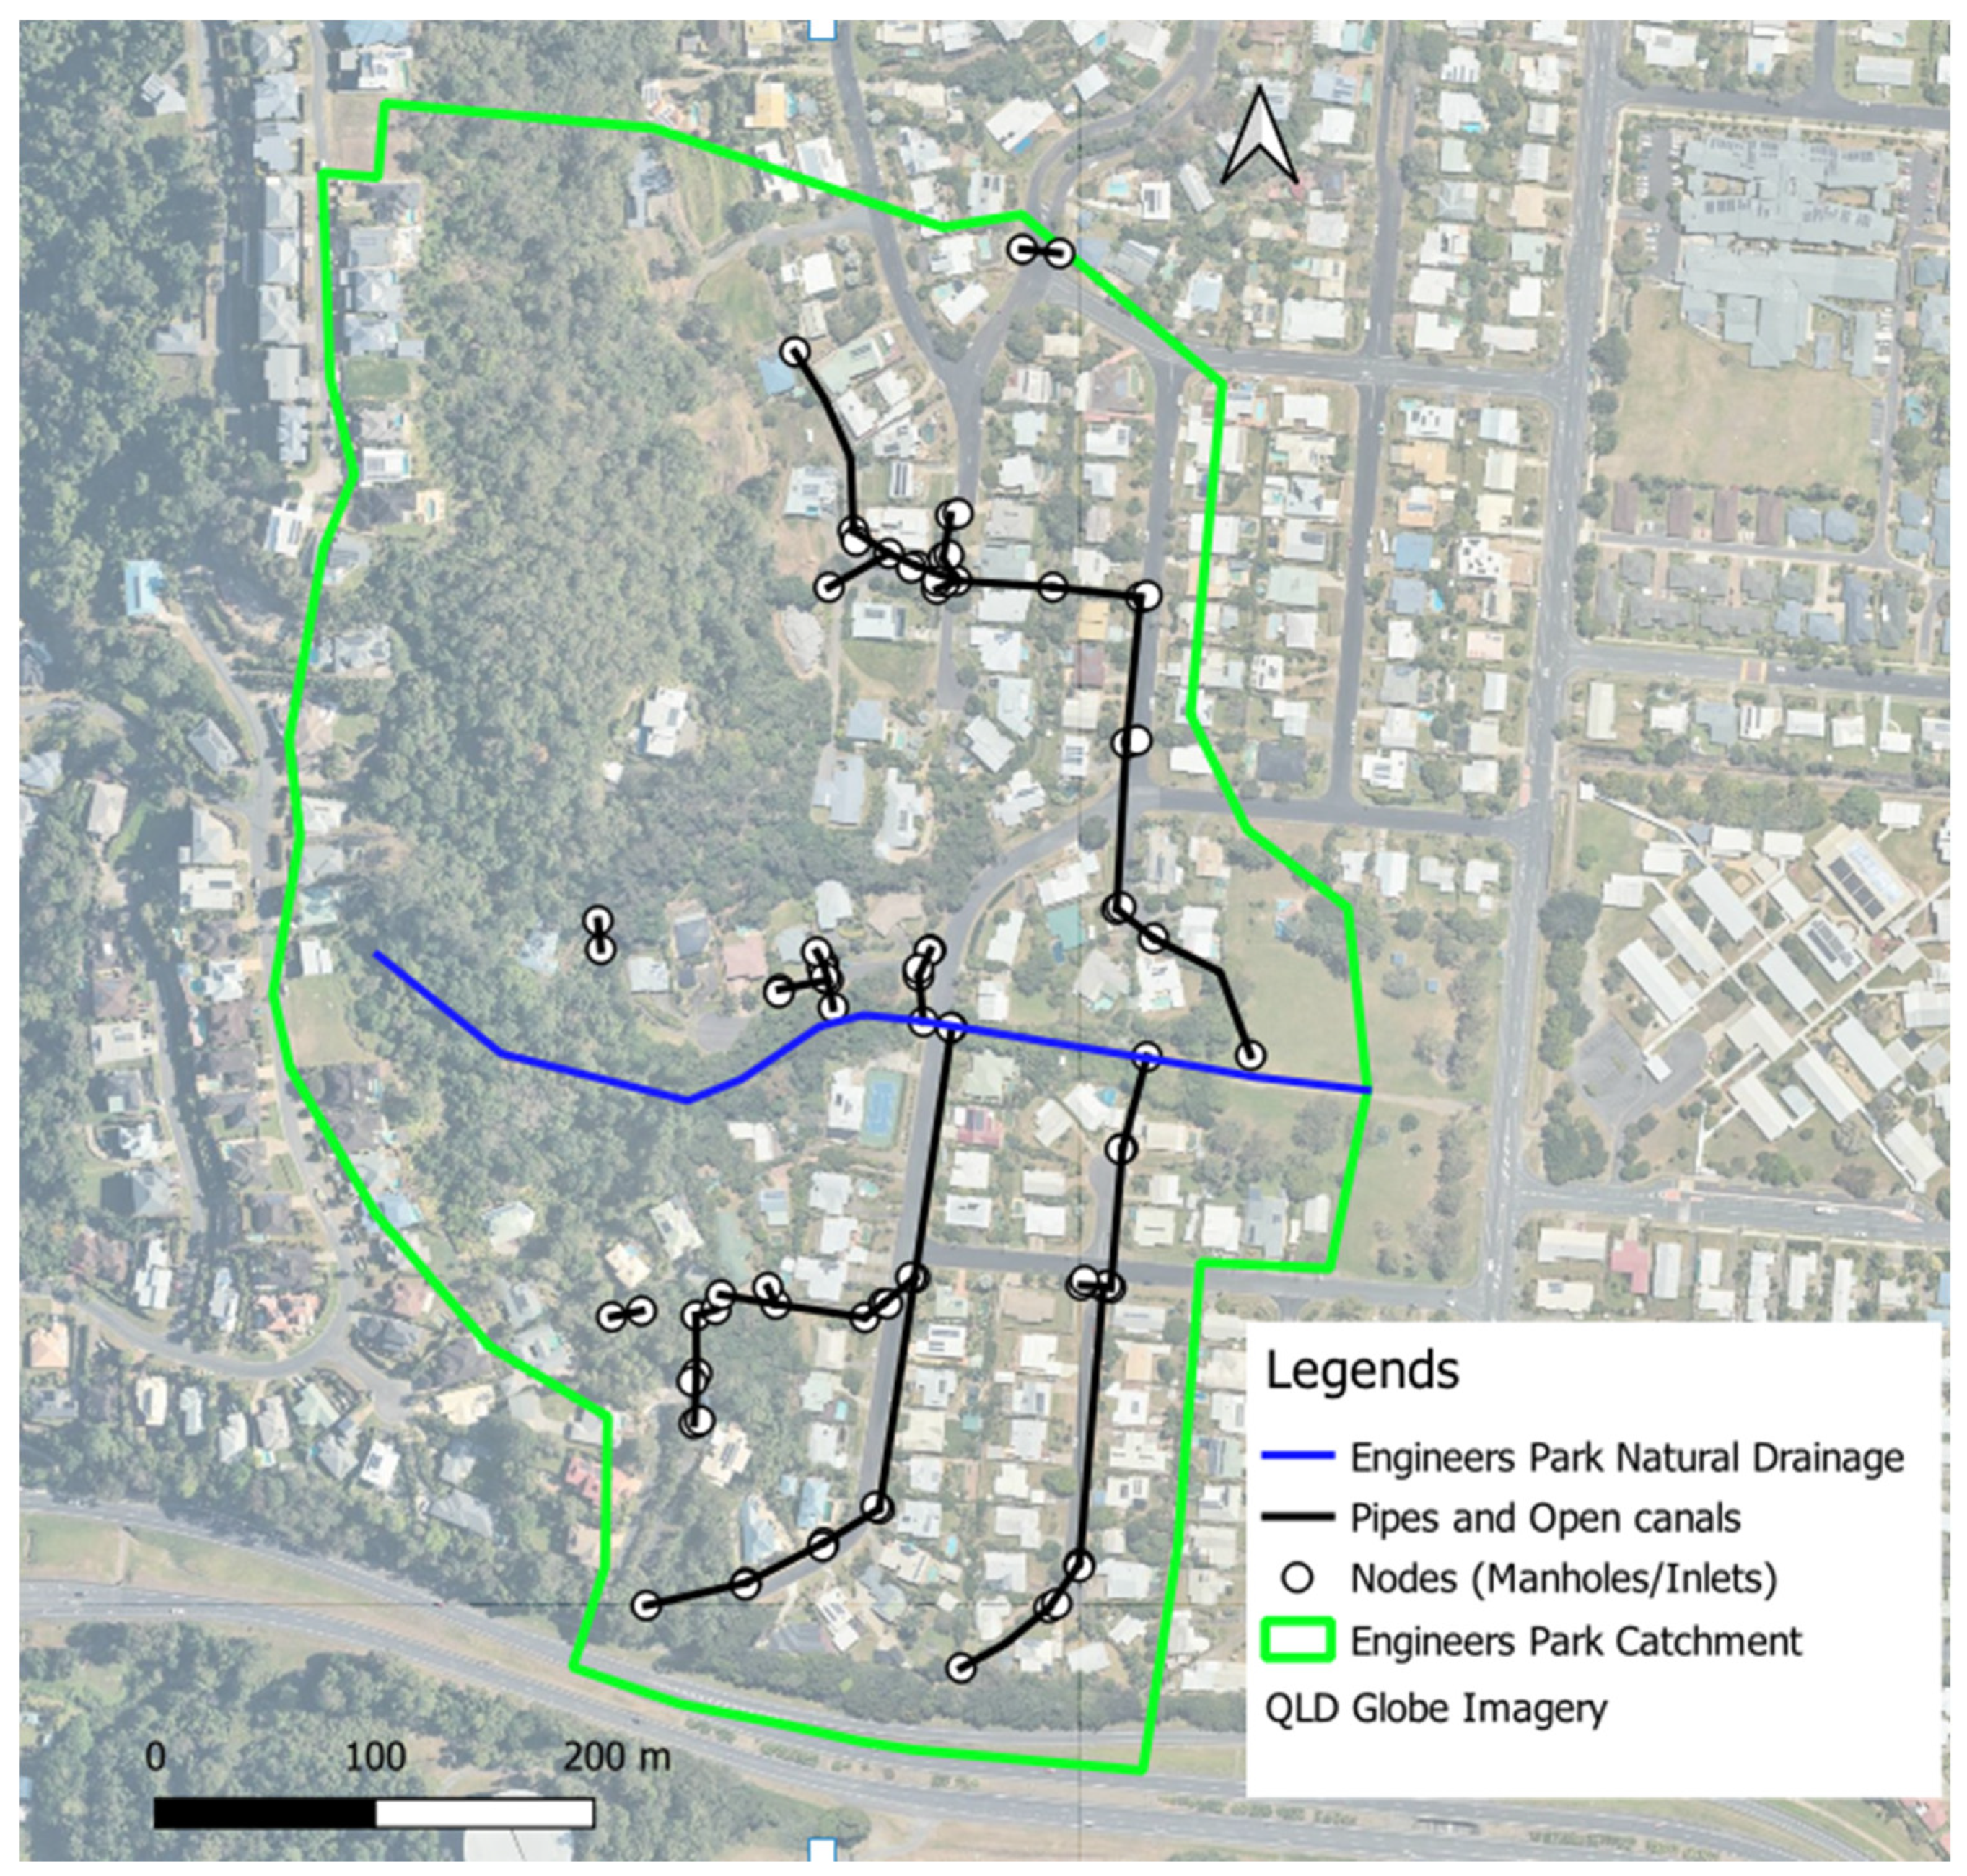
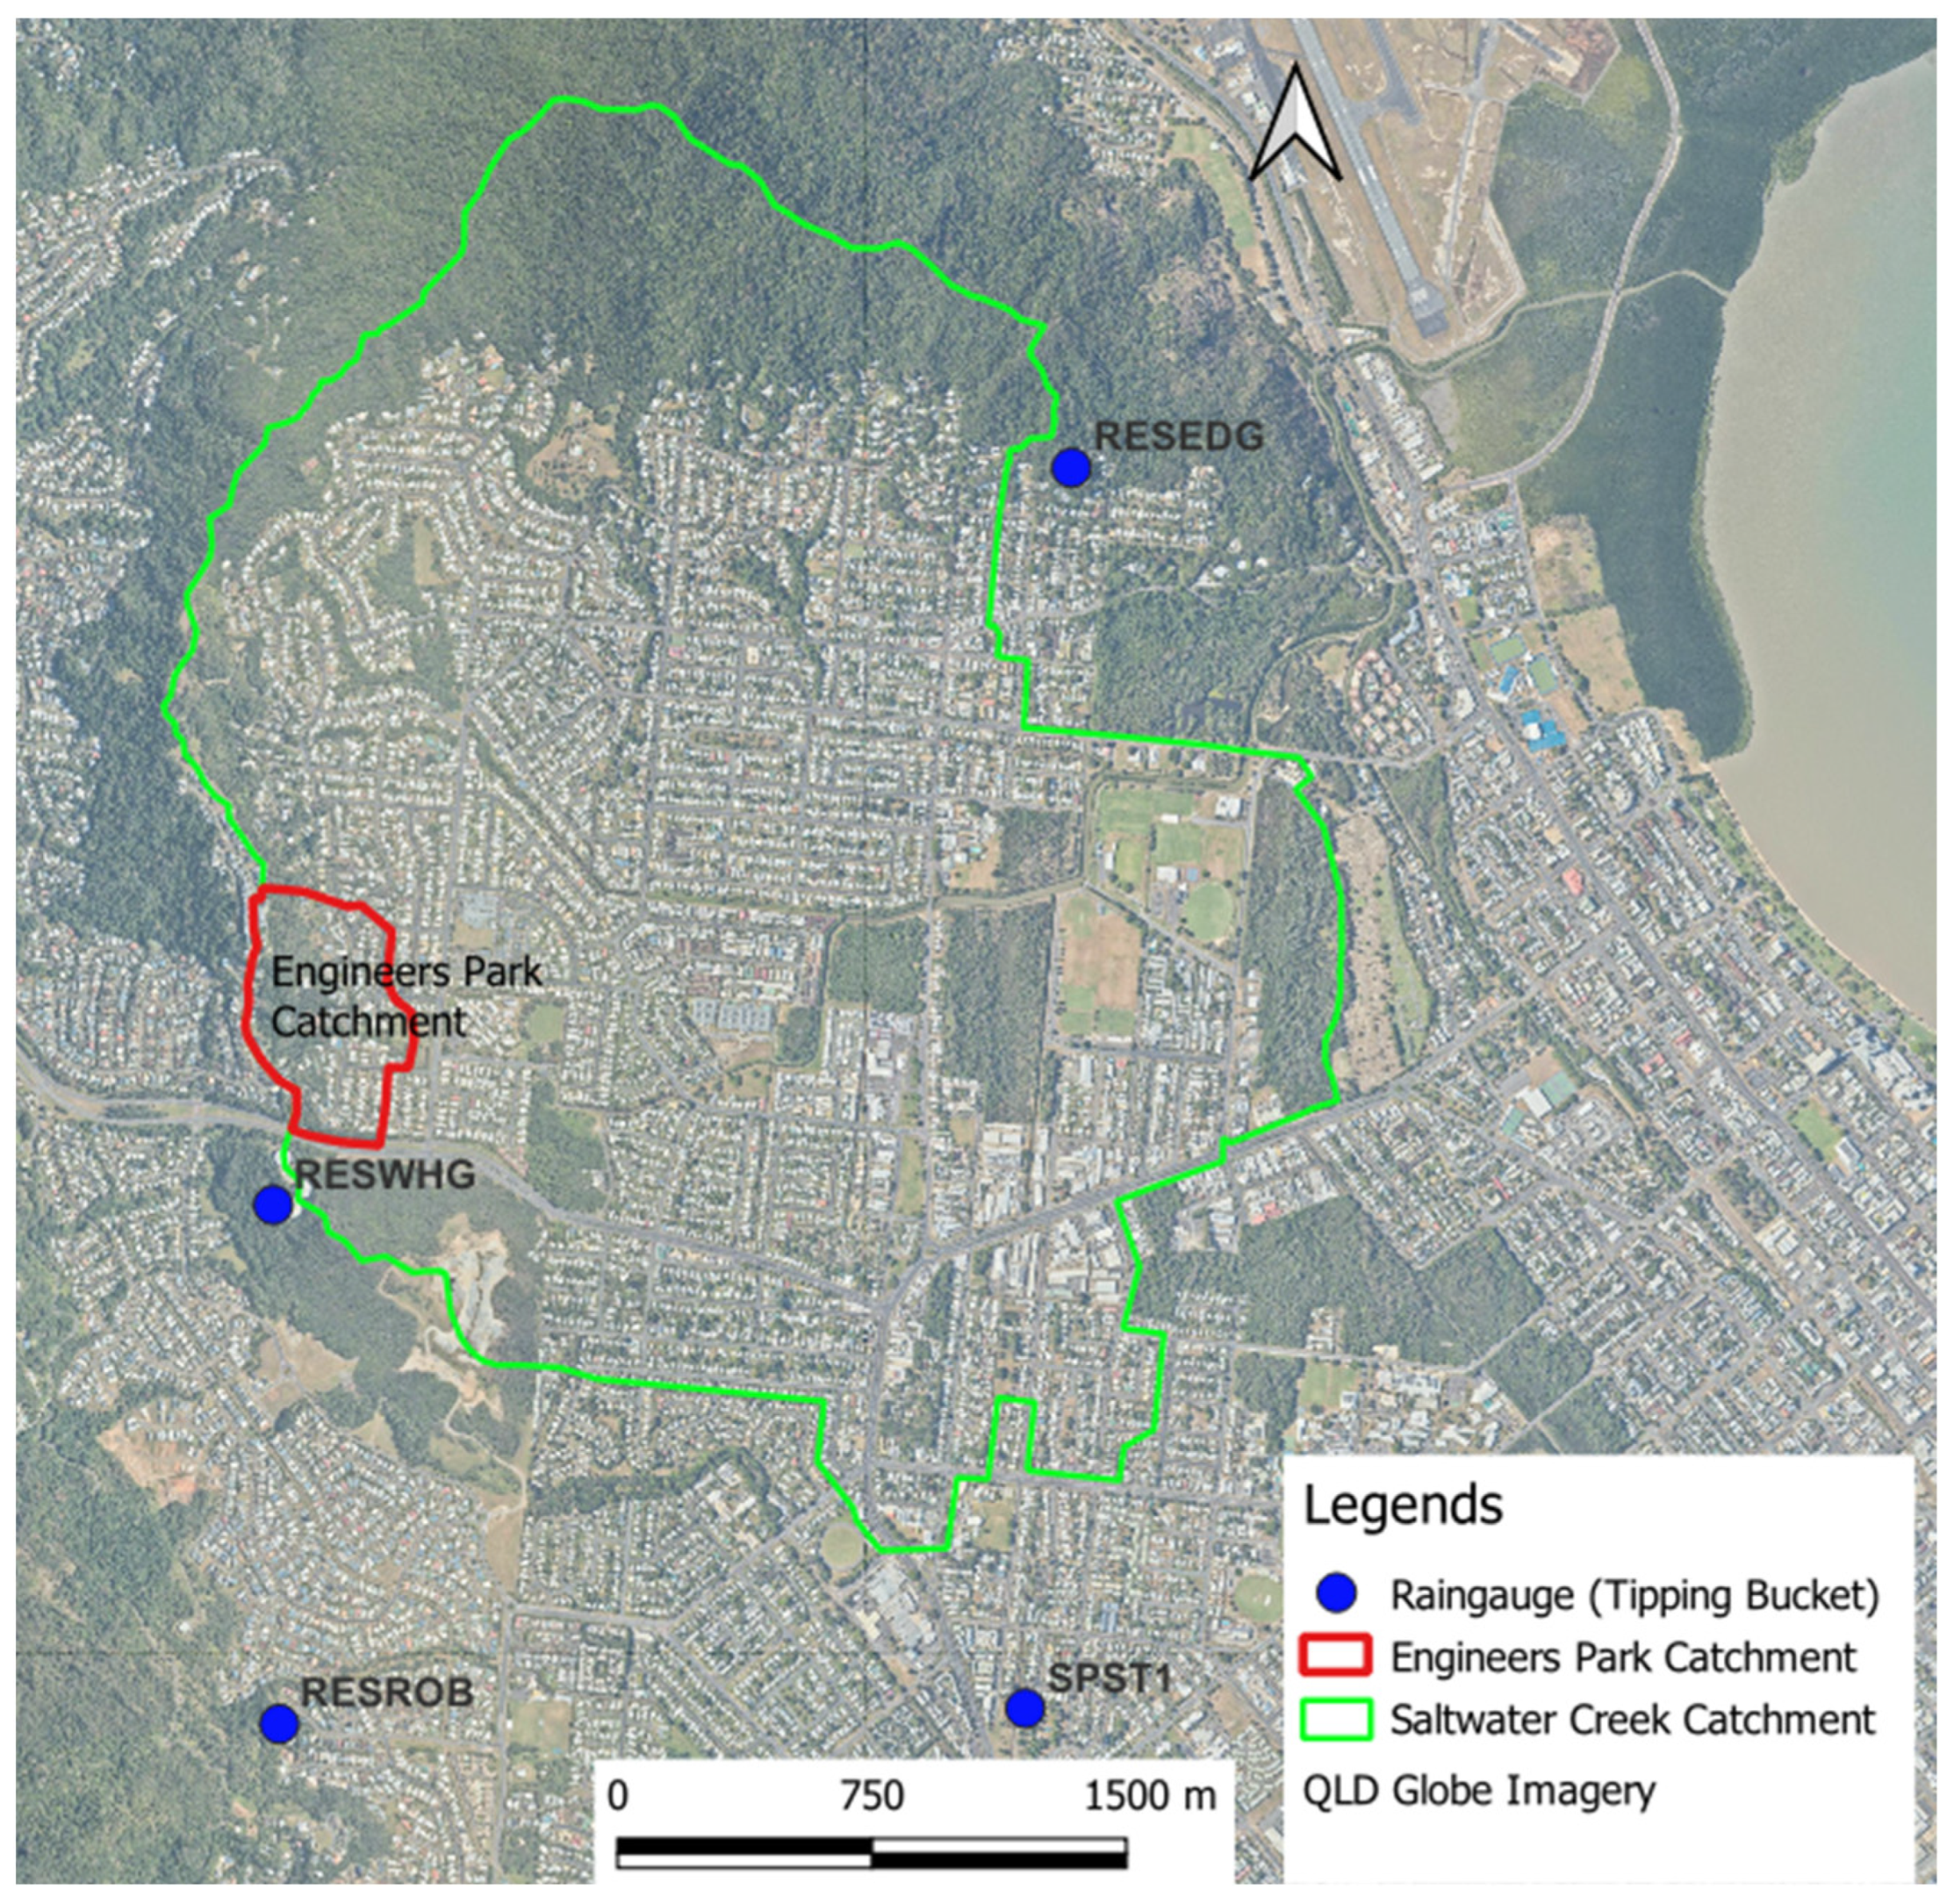
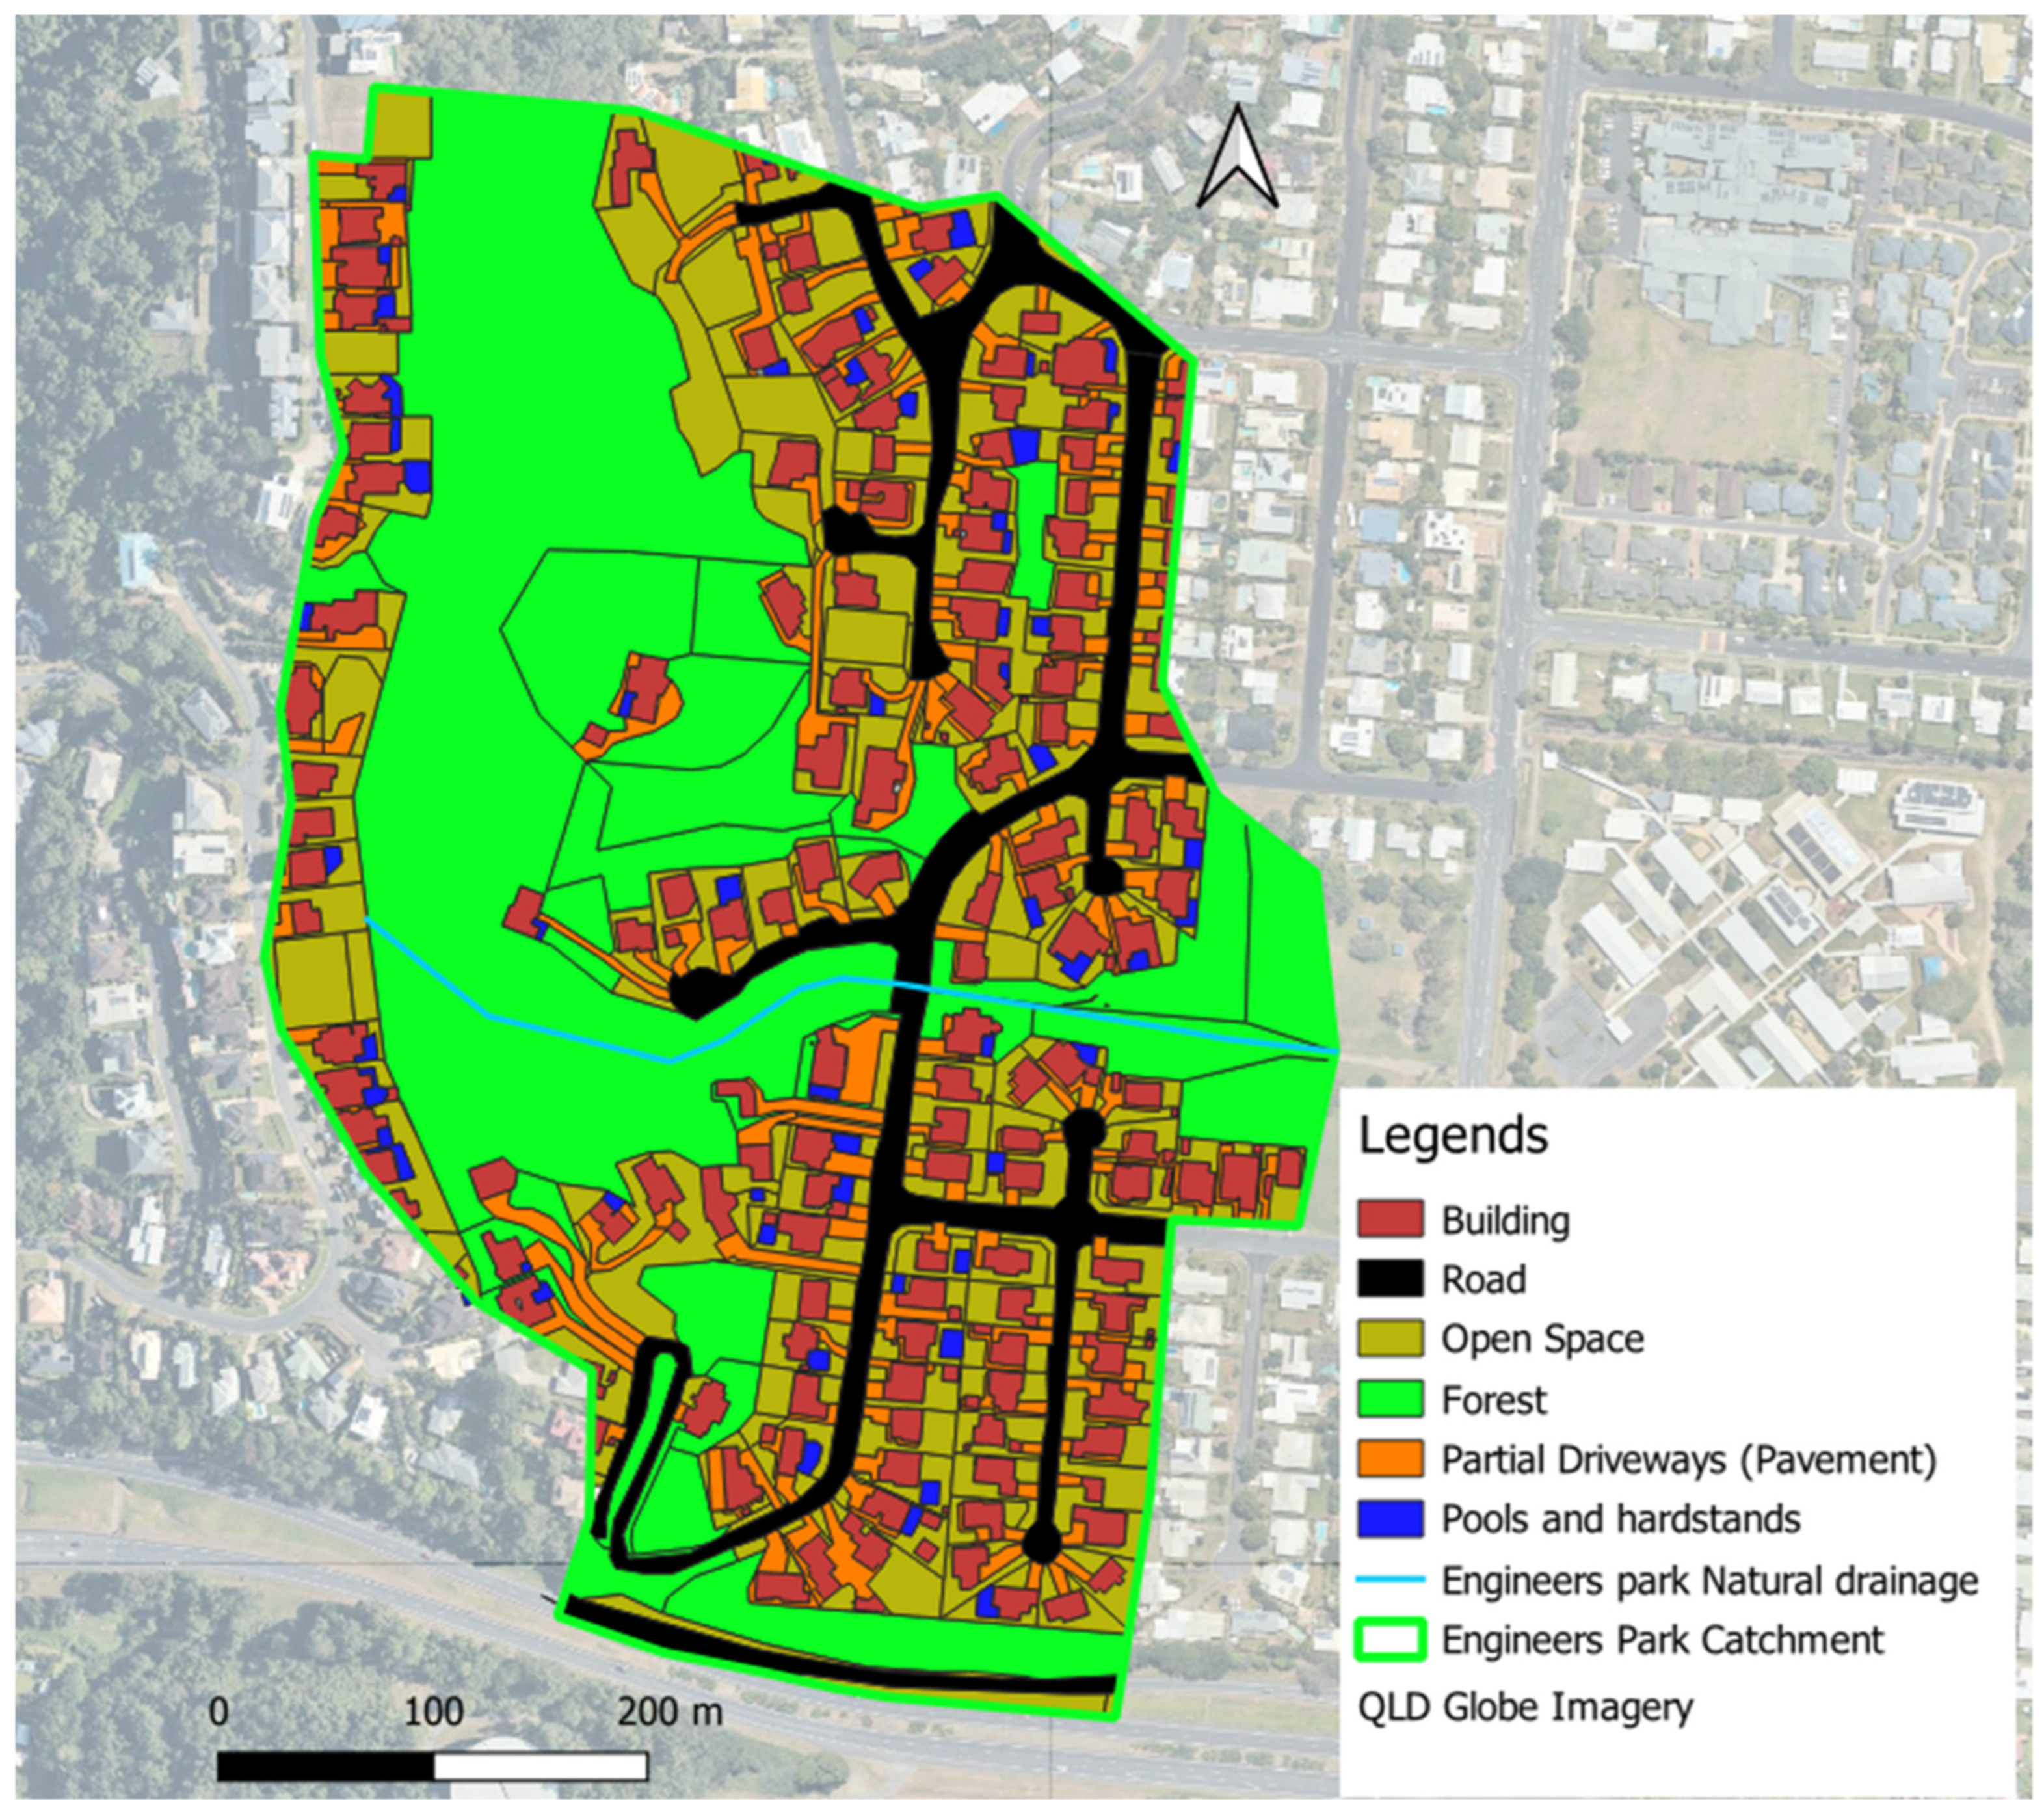
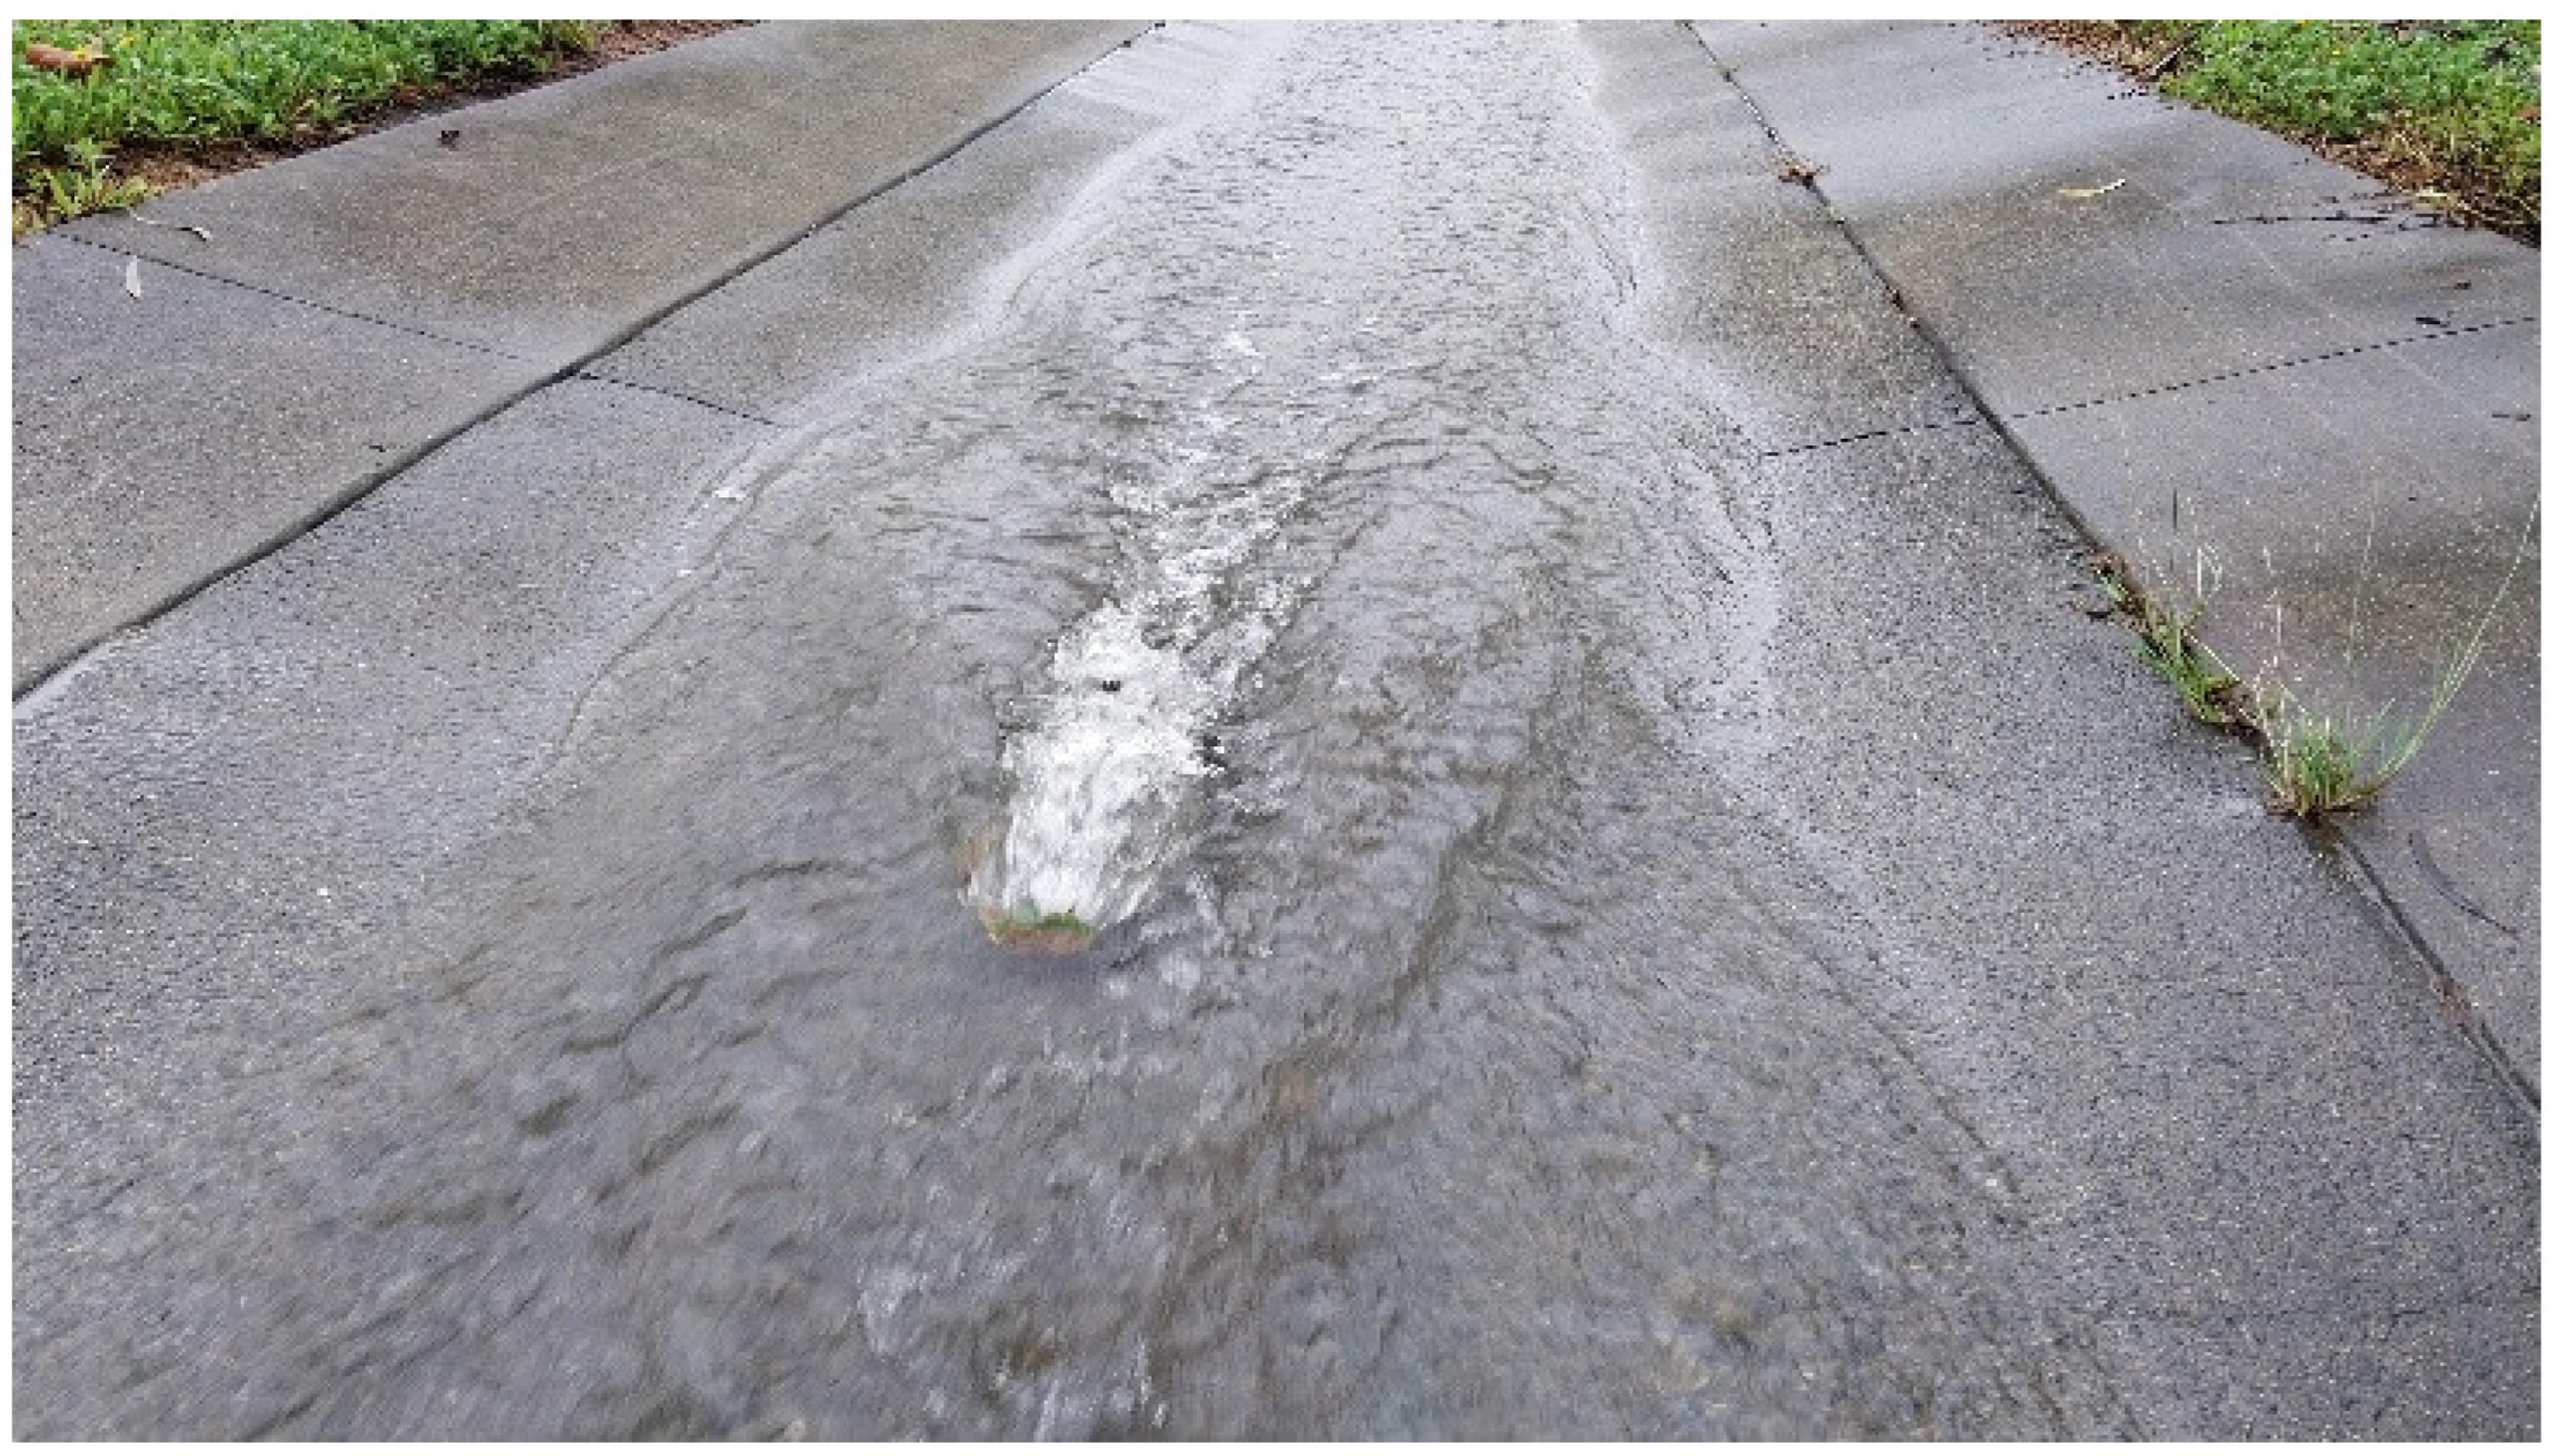
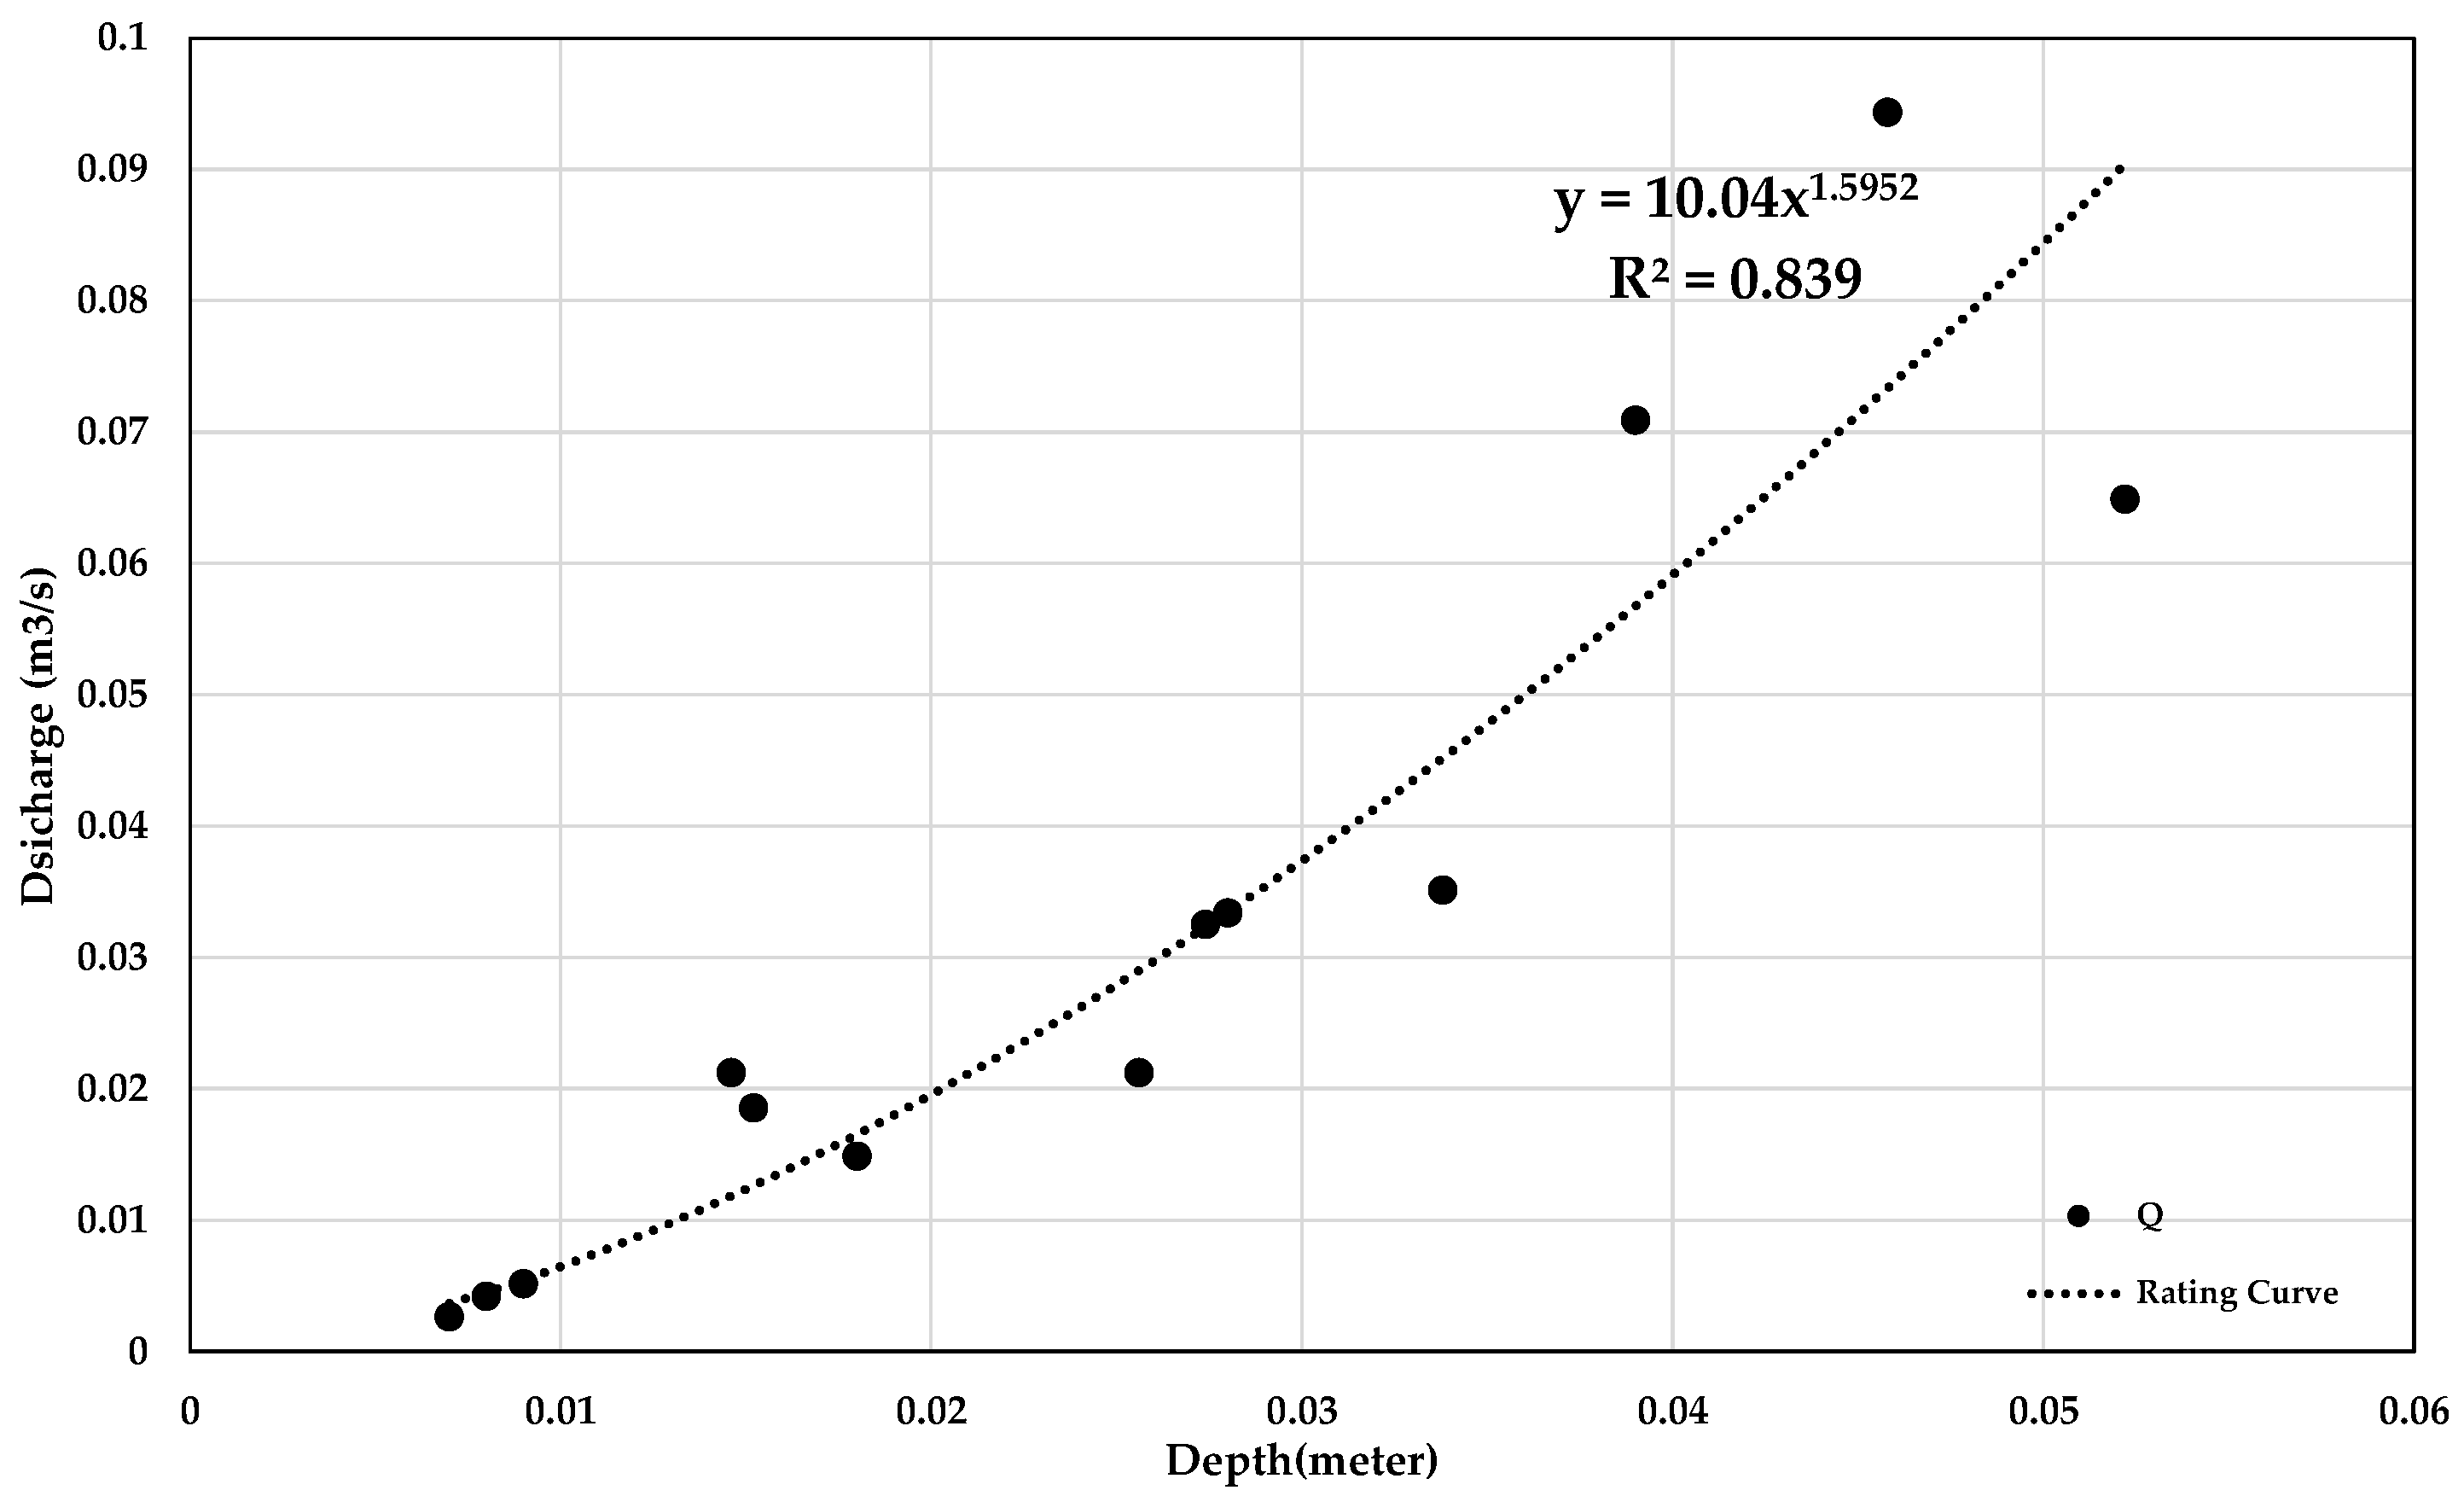
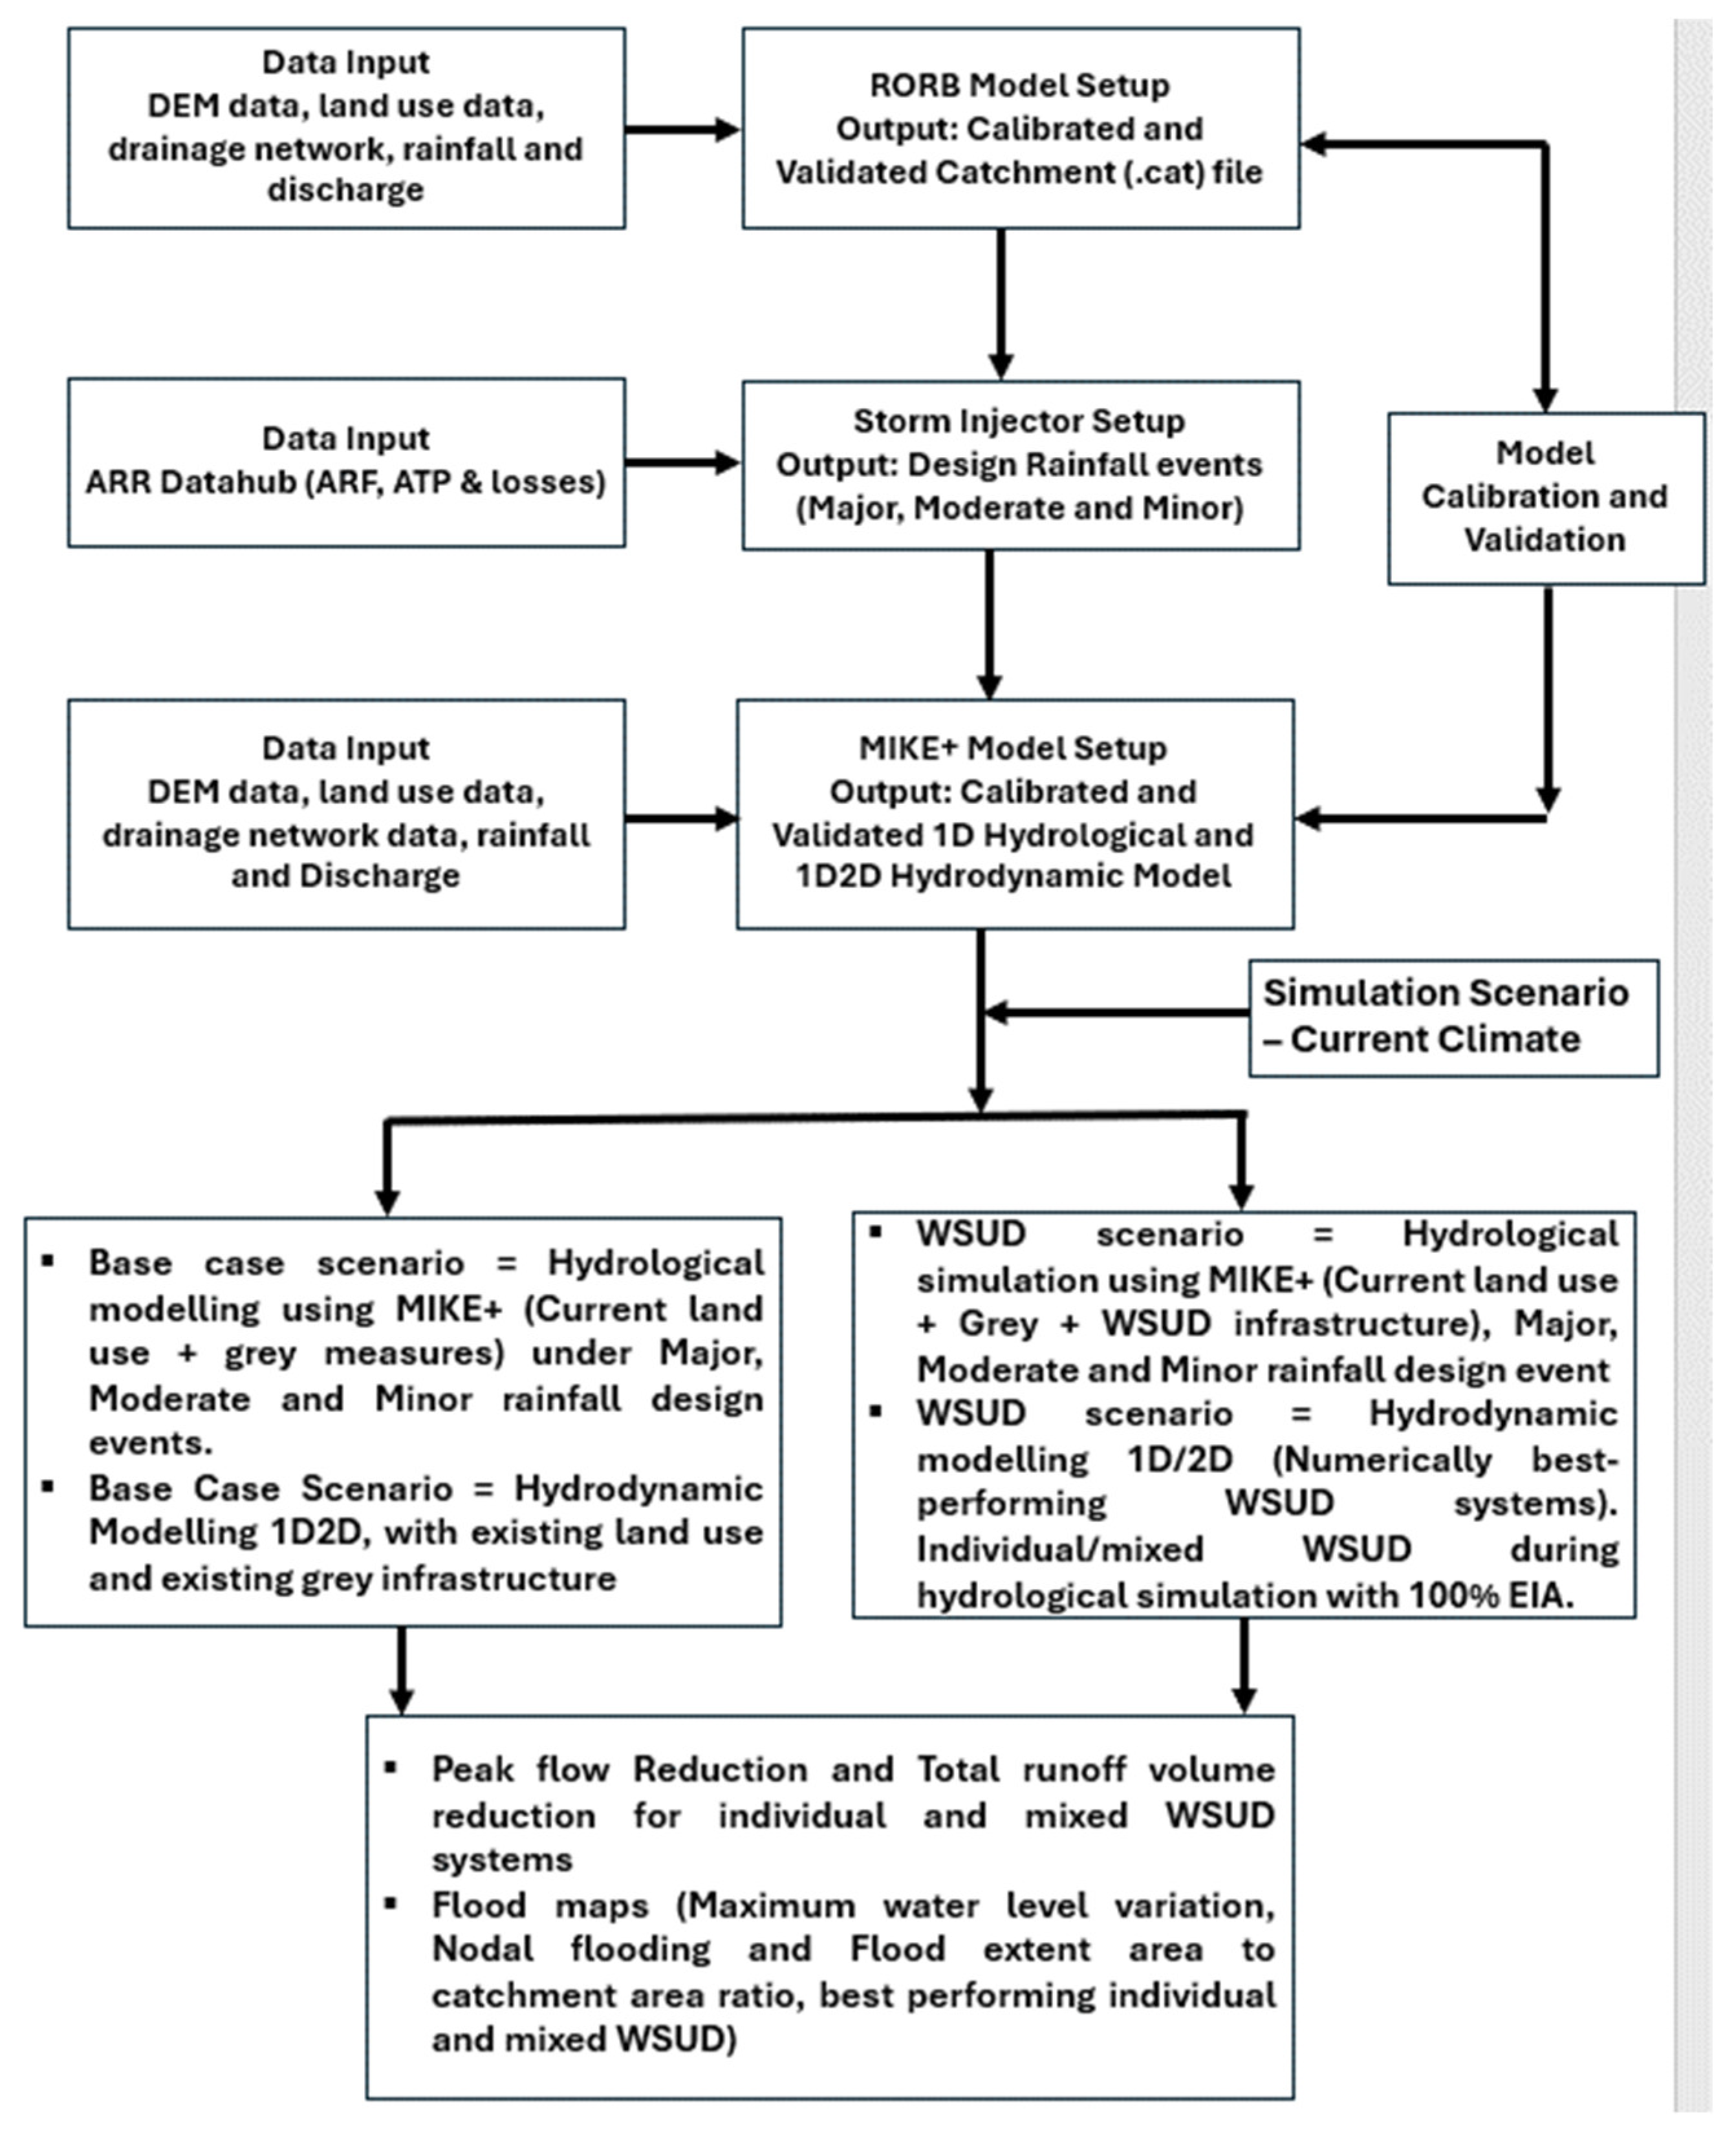
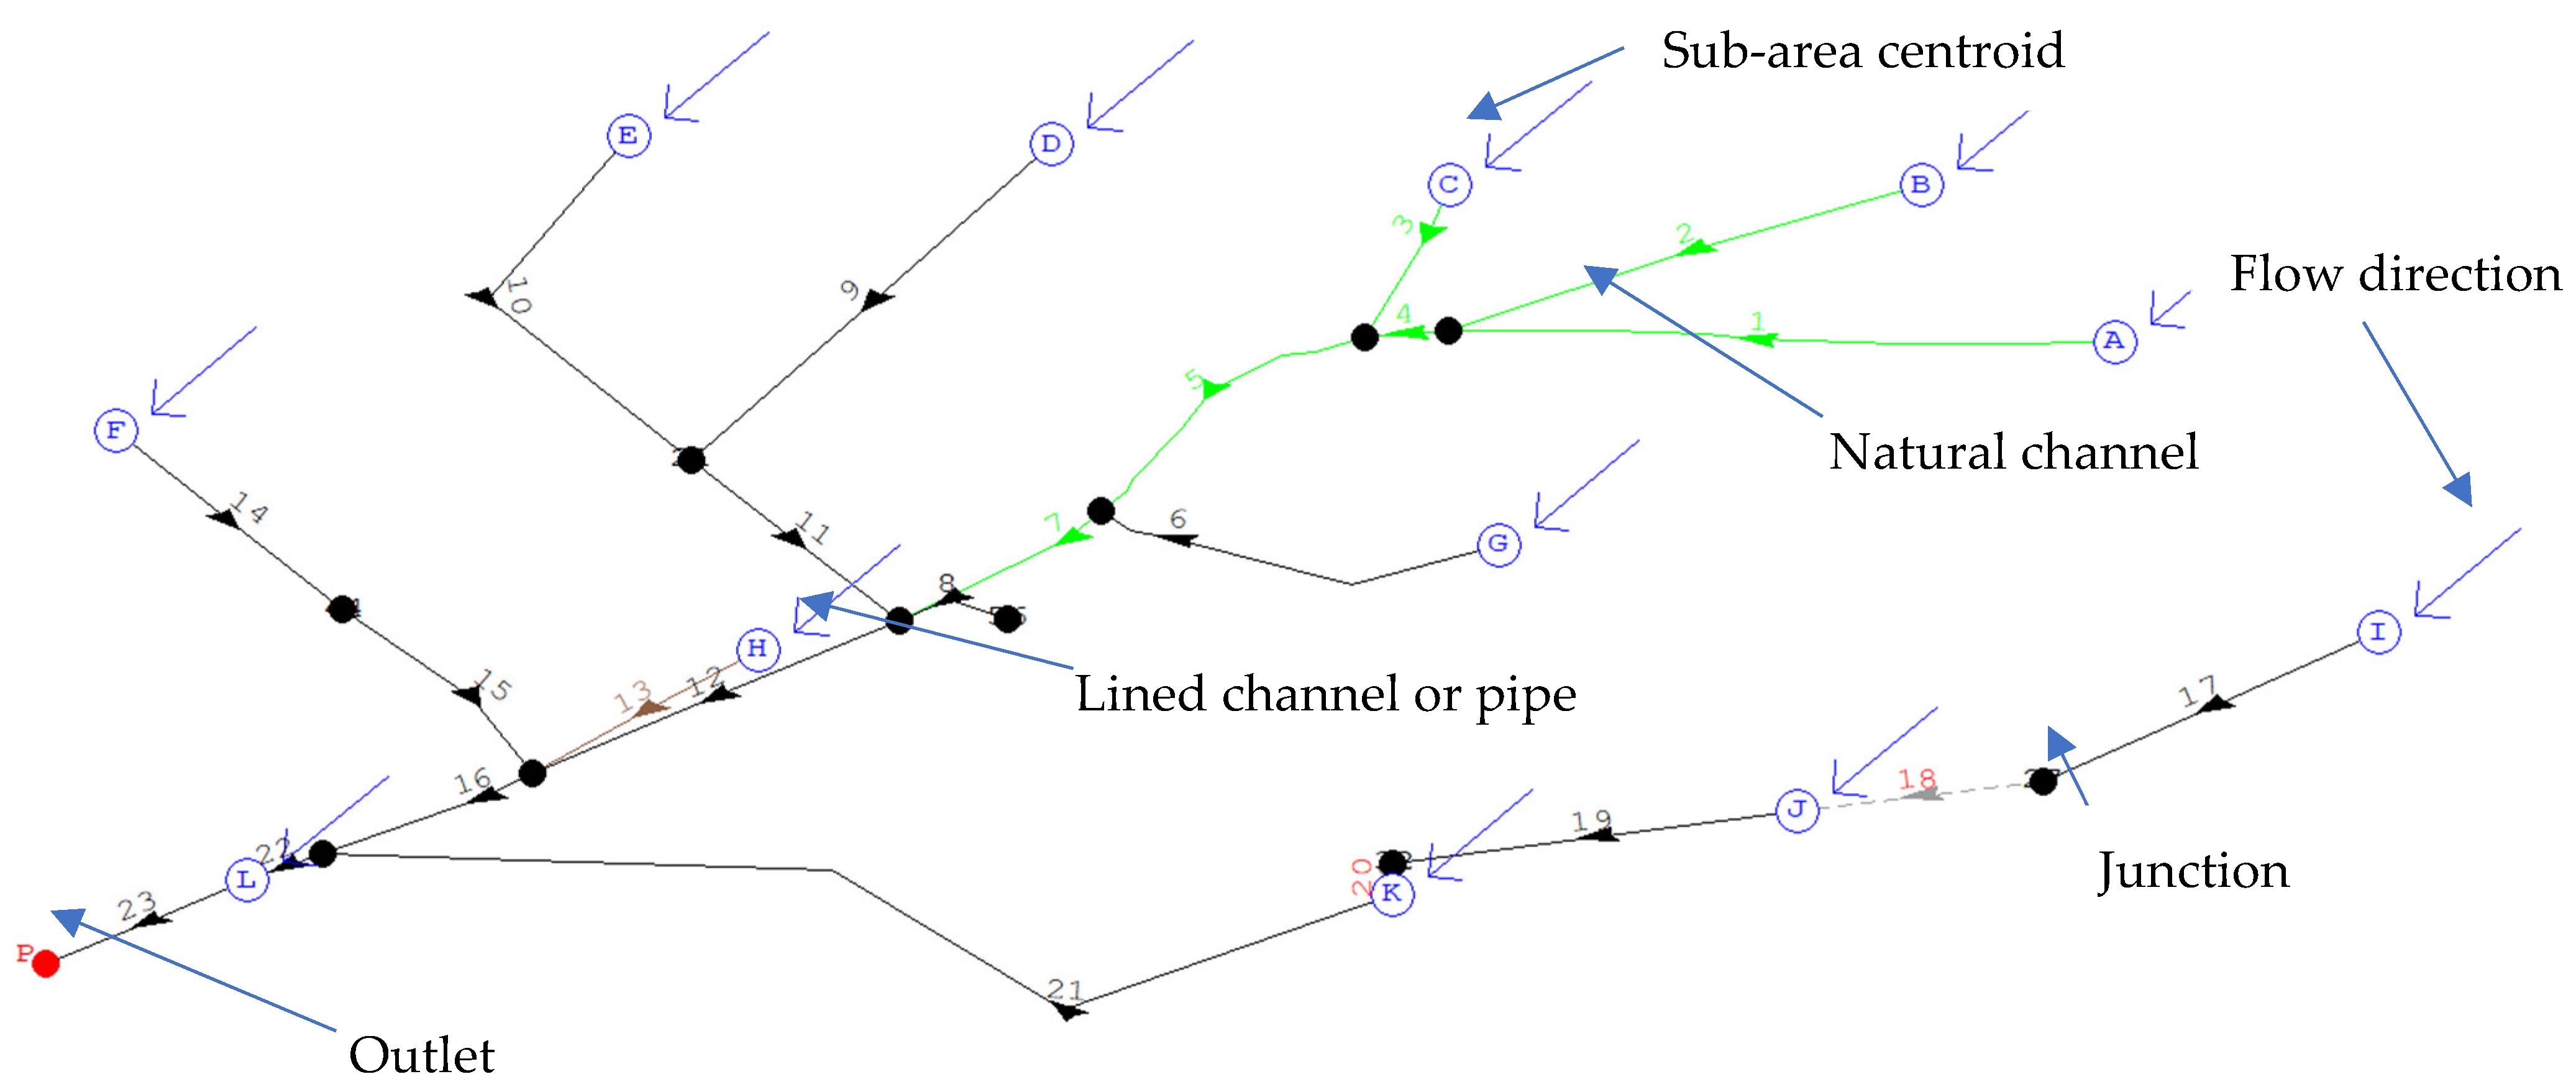
