1. Introduction
There is a vast set of information on the 1755 Lisbon earthquake provided by the 1756 records [
1] promoted by the then-Minister of the Kingdom Sebastião José de Carvalho e Mello (1699–1782), Marquês de Pombal, via questionnaires that had to be completed by all parish priests in the national context by 1756. In this sense, detailed information that can be georeferenced in areas historically defined by parishes, some of which are 2–10 km
2 (average), are important sources for characterizing the earthquake’s impact.
Although the targeting of buildings is prevalent in research on this subject, the present research focused on hydrological and hydrogeological data. The objective was to analyze the observed effects, considering that data from ancient earthquakes continue to be an invaluable source of knowledge to complement and compare with current data. Historical earthquakes provide crucial information, substantially expanding the amount of information for the period before monitoring was available (before 1980). Hence qualitative methods are used to analyze historical earthquakes and compare them with current events. Earthquakes, such as the 1755 Lisbon earthquake, with this level of variety of effects and devastation in Europe, are rare. In addition to analyzing the complexity, tectonic faults, and geological boundary zones, the authors intended to contribute to the discussion of descriptors for rivers and, thus, address the gaps found at international scales. These descriptors were calibrated based on other effects observed in urban areas nearby, namely, the damage to buildings and effects in springs, although hydrogeological effects were also addressed.
This study aimed to contribute to the discussion of descriptors for watercourses (rivers and streams) and their respective scale of intensities, which could be included in a future debate of the currently recognized Modified Mercalli Scale (MMI) (1956) [
2], the European Macroseismic Scale (EMS) (1998) [
3,
4], and Environmental Seismic Intensity (ESI) [
5]. The information gaps in these three documents at this level arise from the complexity of validating historical information, the geomorphological heterogeneity of the target observation areas, and the lack of comparative elements within the same area observed in both inhabited and non-inhabited areas.
Seismic intensity is a parameter that allows for a qualitative assessment of the observed (experienced/recorded) effects of an earthquake in a given location, referring to a series of key responses concerning nature and the reactions of people, buildings, objects, structures, etc.
The Lisbon earthquake of 1755 was one of the largest events in European seismological history [
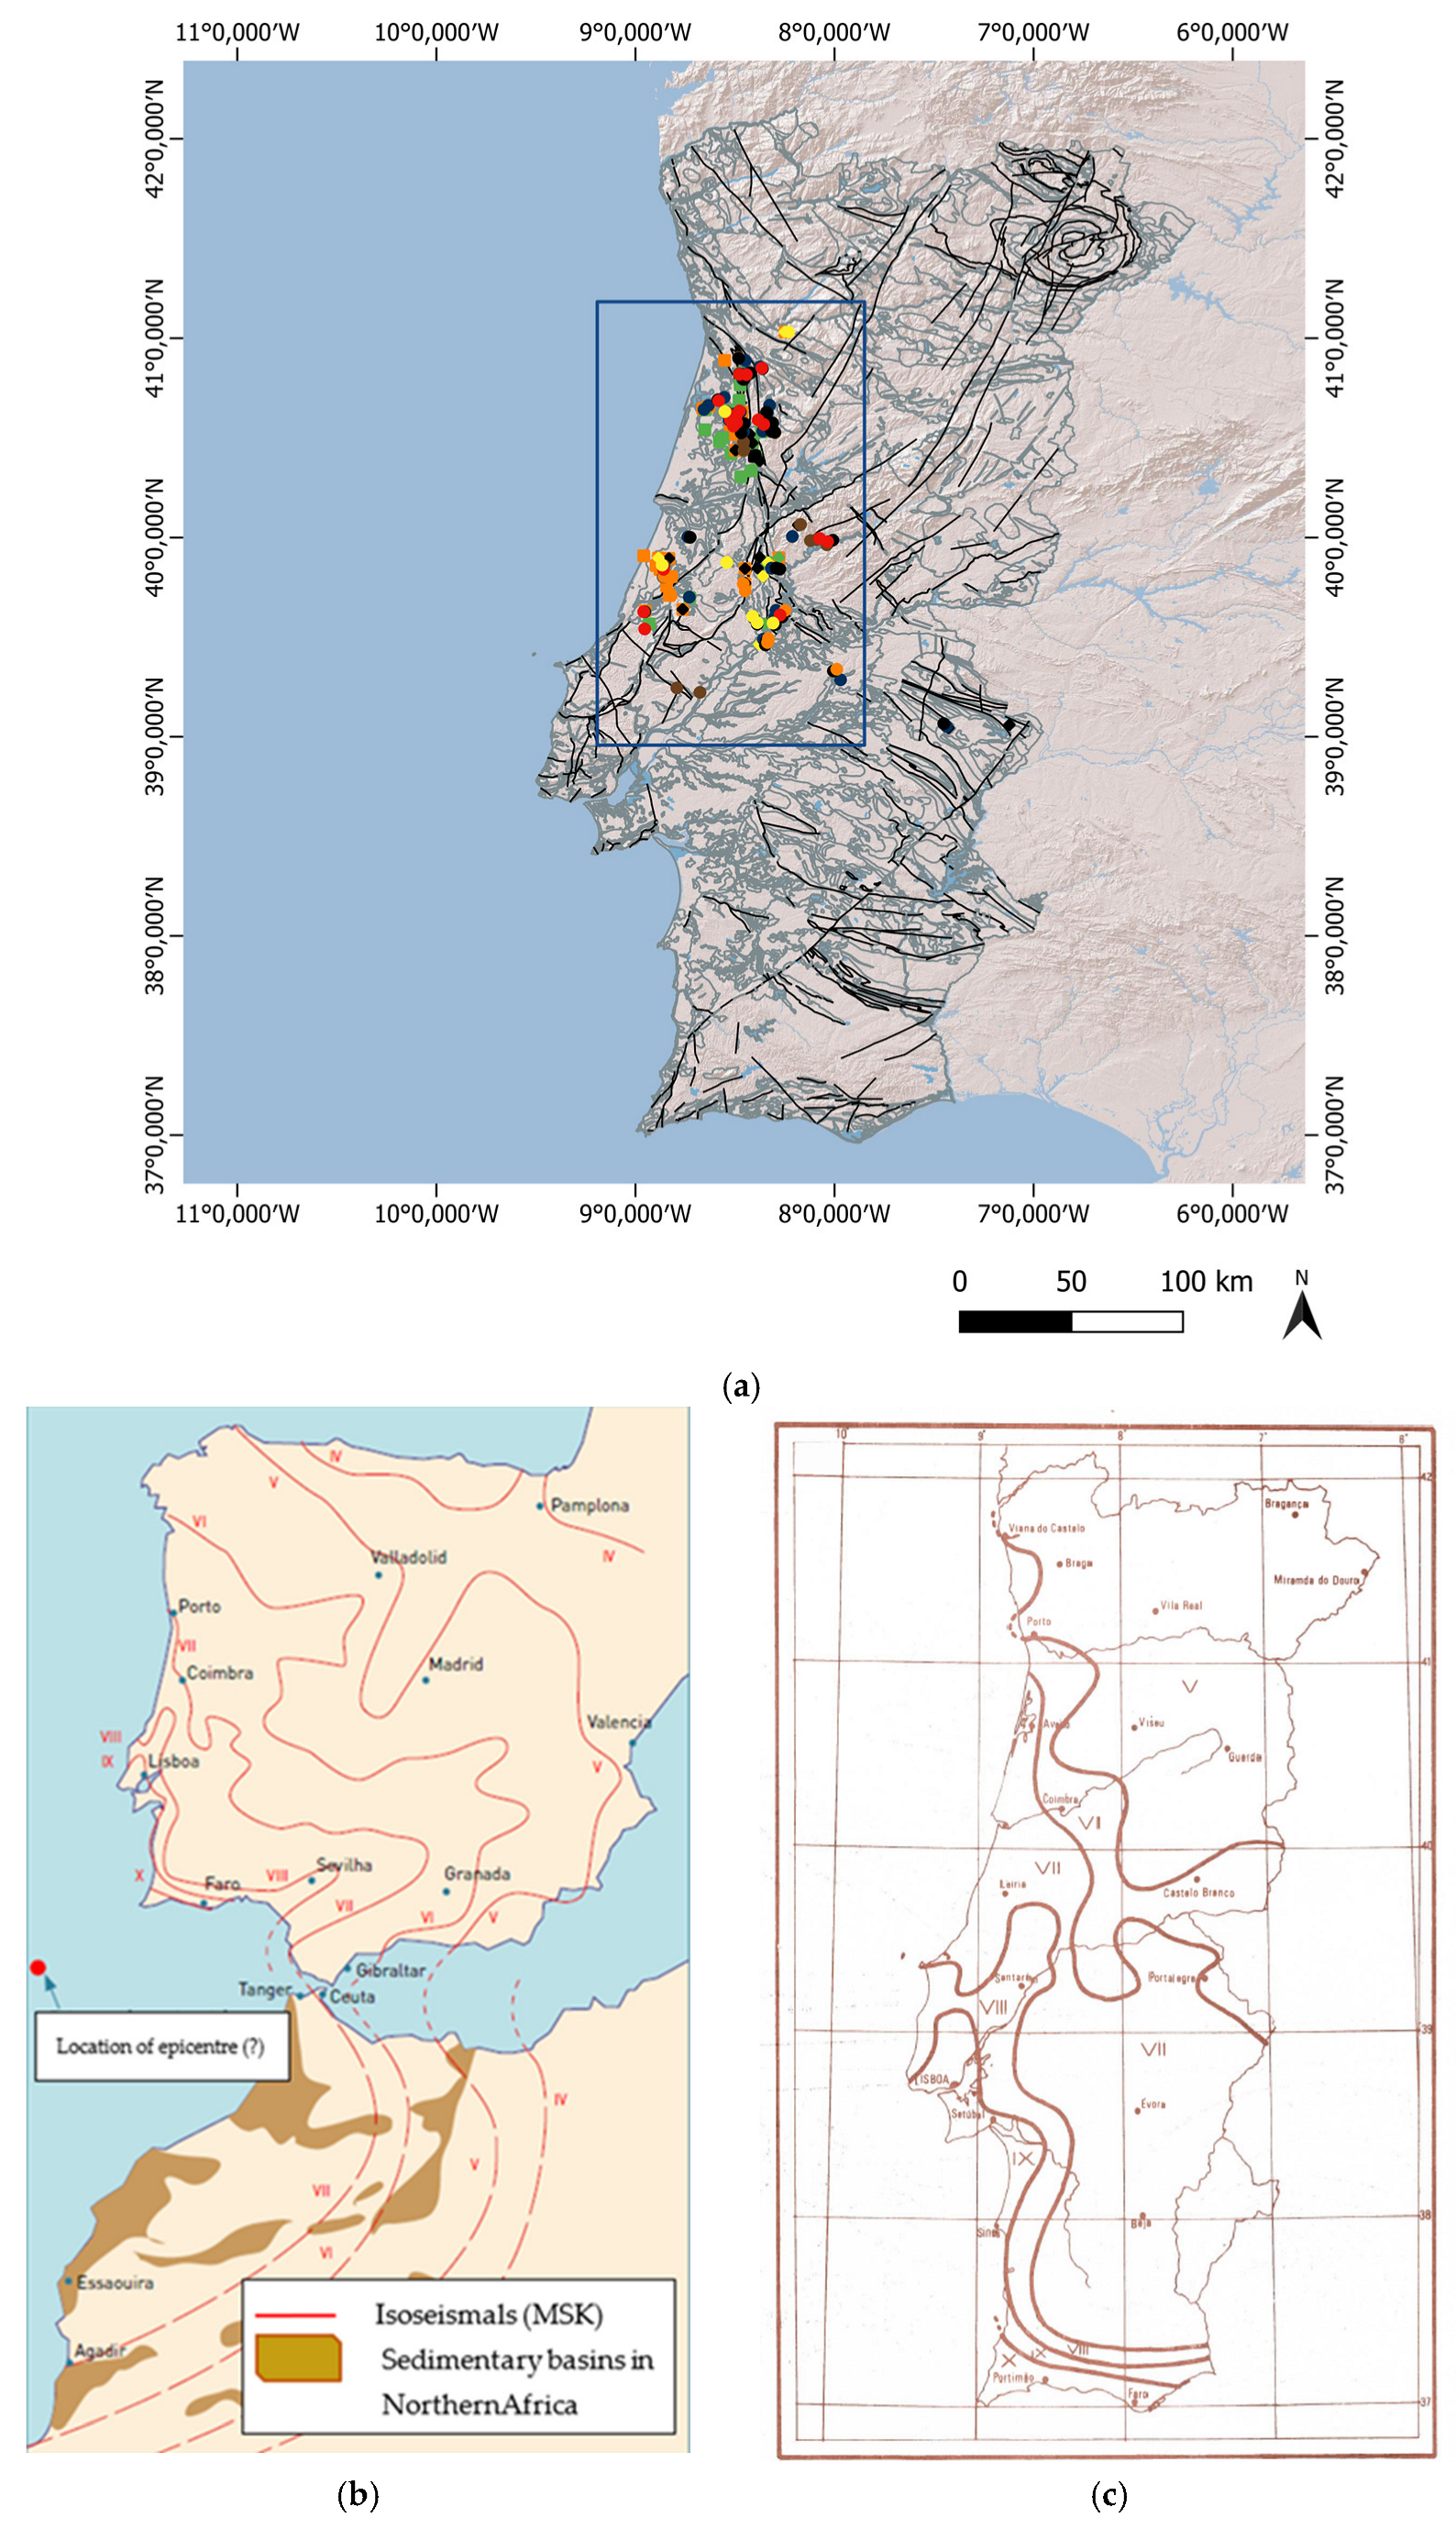
6]. It caused intense shaking in the Iberian Peninsula and the Northern African continent, which was felt as far as Central Europe, and provoked an impressive tsunami [
7] that struck all the coastal areas of these lands as well as Northern Europe, the Azores and Madeira Islands, and the eastern coast of the American continents. A description of the tsunami comes from the region of Aveiro, 250 km (approximately) from Lisbon, next to the coastal lagoon “Ria de Aveiro”, which mentions that “people from the maritime lands say that the inequality of its flow was great and reflux at the time of the earthquake and that the sea withdrew, leaving its bed uncovered for a large space and that after that it returned with great fury to occupy the beaches bringing such an exuberance of waters that it flooded some neighboring lands”.
The source mechanism is still a matter of great dispute among geology and seismology experts [
8,
9,
10,
11,
12,
13], but its epicenter (or multiple shocks) was in the Northern Atlantic Ocean, which is associated with several submarine faults that most probably ruptured in extended zones. The attributed magnitude is a rather complex issue due to the lack of a good proxy explaining the source mechanism. It is based on an estimated perceptibility radius of 2.500 km, which is consistent with recent earthquakes of similar size, approximately Mw 8.5. Such large magnitudes are not typically observed in collision tectonics, as in Southwestern Iberia, but are more common in subduction zones.
The areas that suffered the most were southern continental Portugal, particularly Lisbon, which was greatly destroyed by the shaking, tsunami inundation, and the fire that erupted and burned what was left [
1].
A few studies have been conducted on this topic, such as those by Silva et al. [
14] and Duarte [
15], with data gathered for Portugal by Vaz et al. [
16] on landslides and other geomorphologic and hydrologic effects observed in the 1755 Lisbon earthquake, including 196 recorded points of “Earthquake Environmental Effects (EEEs)” in a database for Portugal. They did not correlate these EEEs with macroseismic intensity. They were mainly interested in the increasing flow discharges in springs and the elevation in water levels in wells.
Following this introduction, which provides details on the framework of the Lisbon earthquake of 1755, the paper is essentially divided into two main parts. The first part addresses the methods, hypotheses, and data gathering, while the second part presents the results and discussion where the most significant findings are presented. The final section is dedicated to the conclusions and further work.
2. Methods and Materials
The authors examined original manuscripts from 1756, housed in the Torre do Tombo Archive (Portugal) [
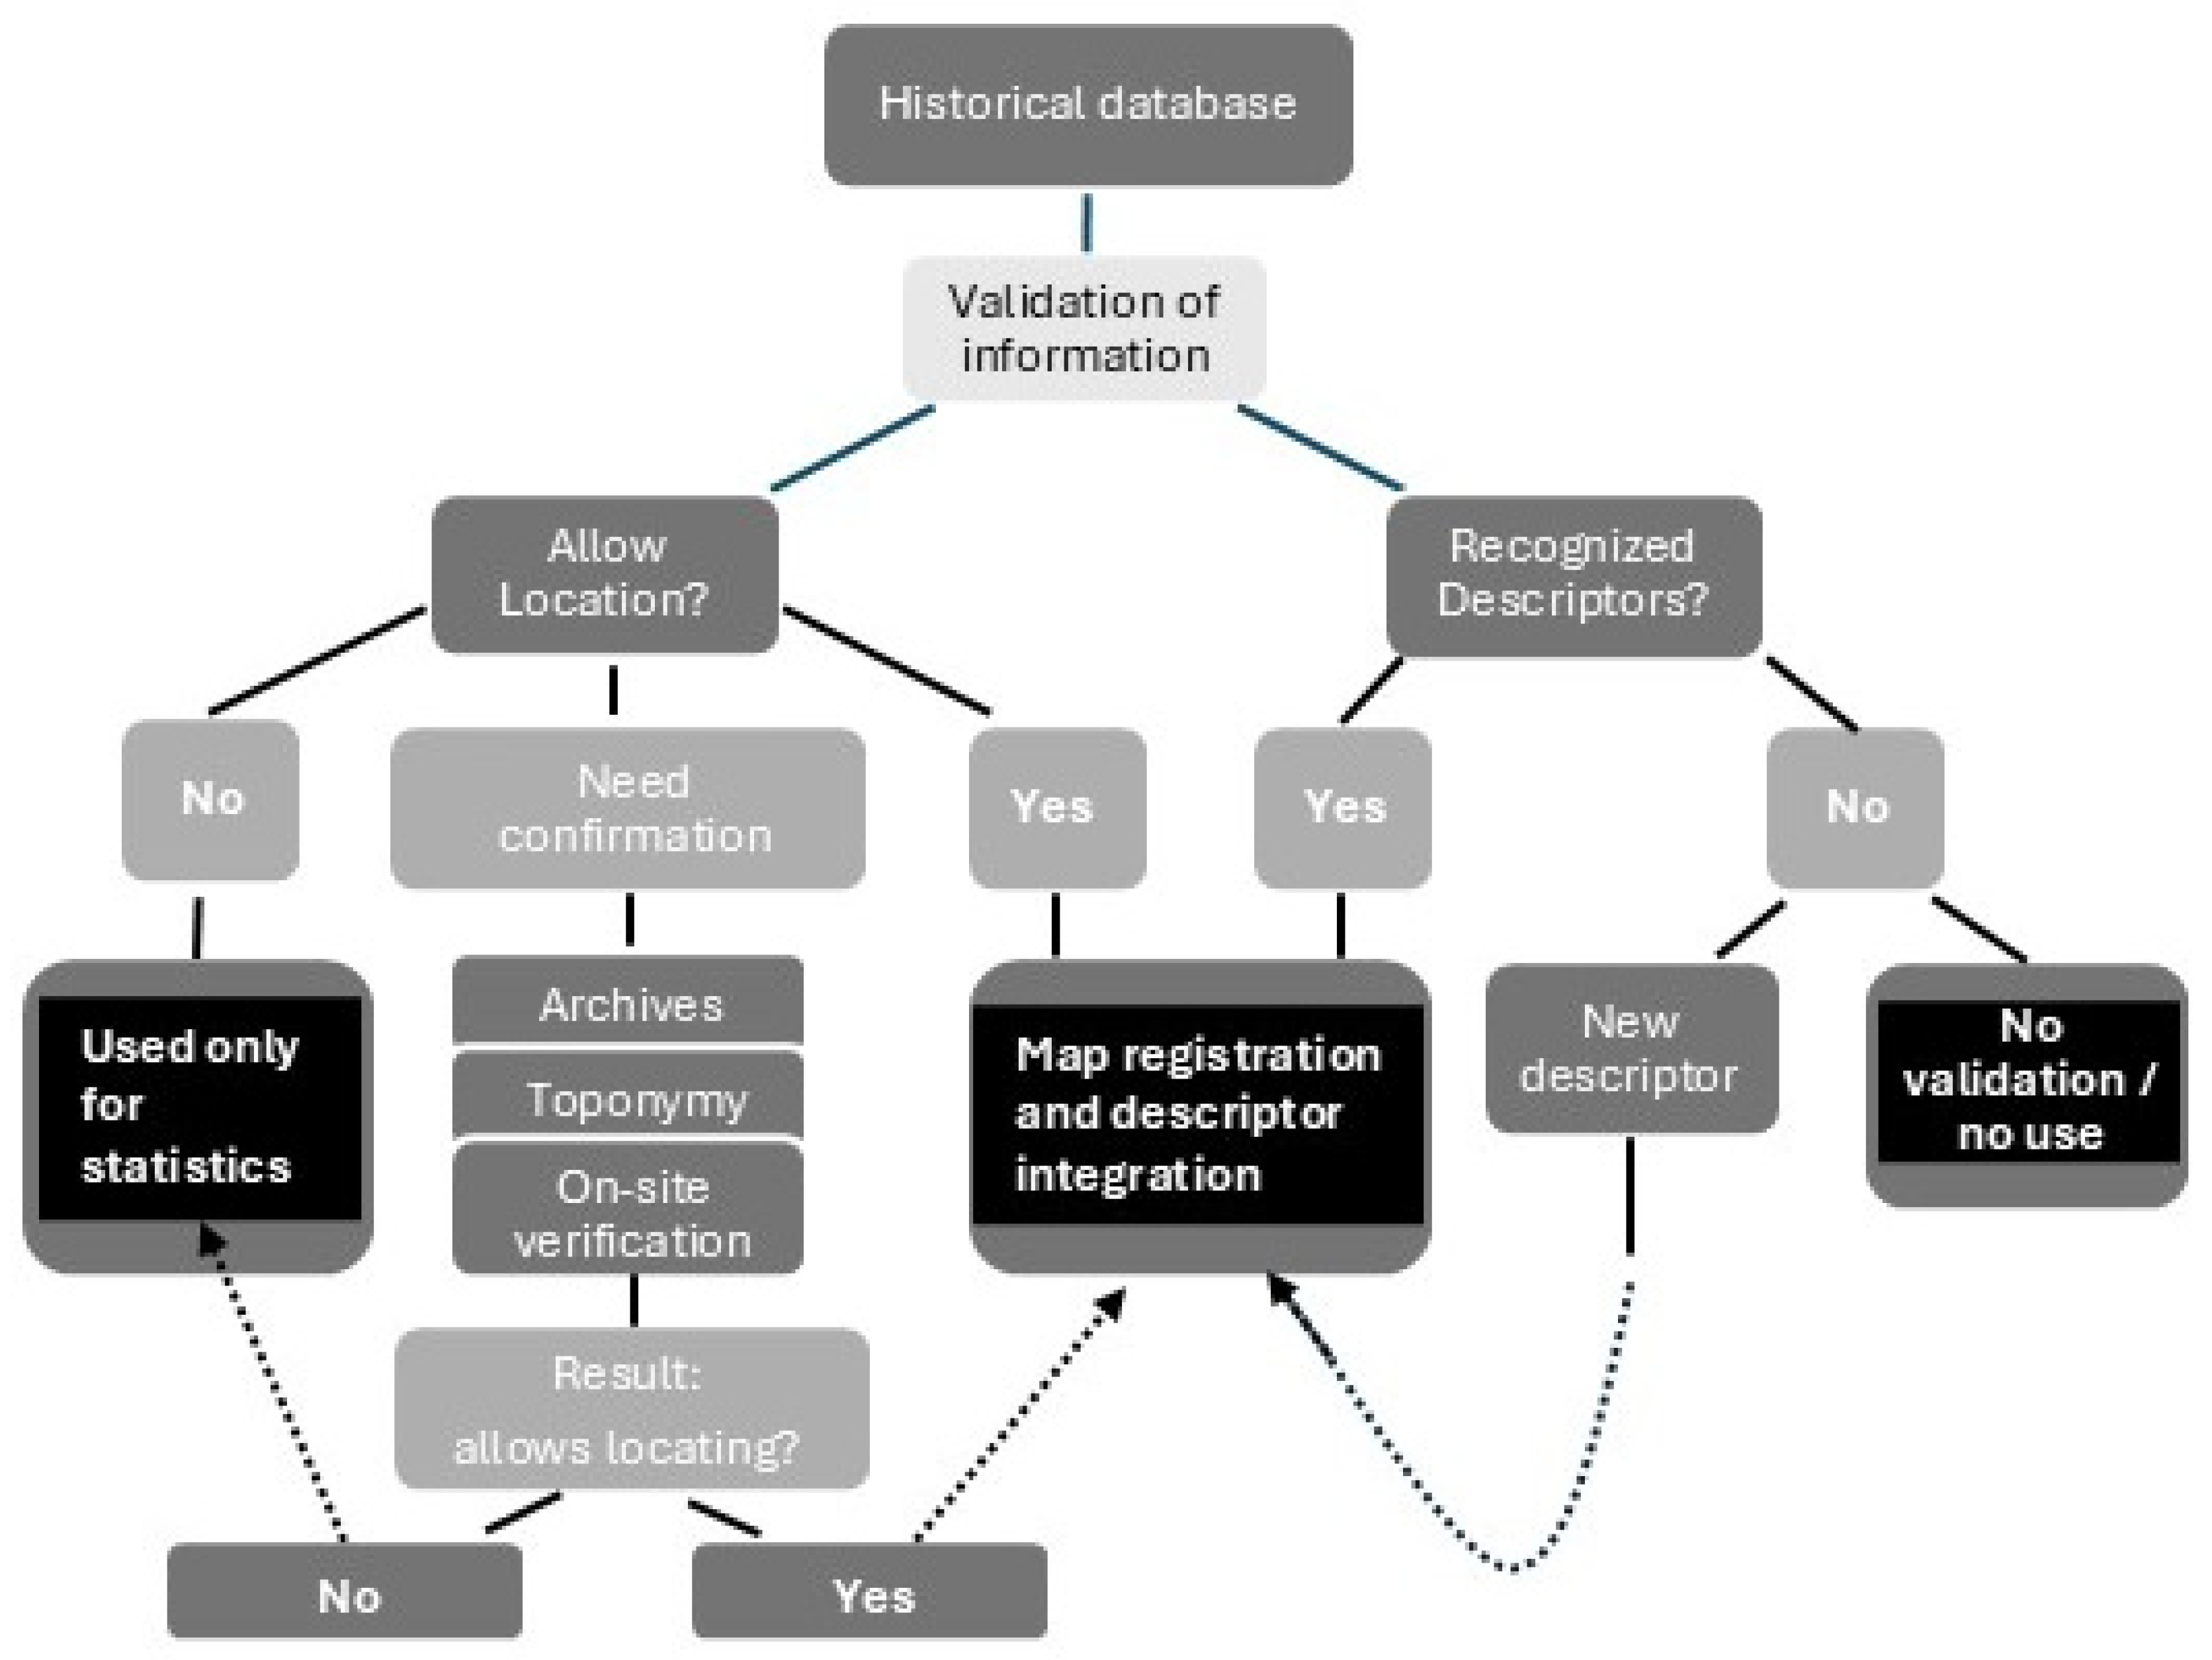
1], which contained records for the same region of simultaneous effects on rivers (hydrological), wells and springs (hydrogeological), buildings (structural engineering), and soil and ground cracks, as well as probable liquefaction, among other elements. This allowed for a robust approach to analyzing the intensity scale. Although the data collected from the original documents covered other regions, it was in these two main regions that the quality and scope of the data allowed for cross-referenced analysis. The data underwent multilevel validation (
Figure 2) and a verification process to assign an intensity grade (or range of grades). Although it was not possible to use some information because of the handwriting and state of conservation of some manuscripts, most of the information could be processed after a due interpretation of the linguistic terms of the time. This was possible because the 1756 questionnaire contained direct questions that revealed knowledge of the possible effects that could be observed during an earthquake, as expressed in question 5 (Are there any news regarding the Ocean, Springs, or Rivers?) and question 7 (Are there any cracks in the ground? What has been observed, and have any new springs emerged?).
The information validation process, whose flowchart is shown in
Figure 2, was initially undertaken at two levels: first, the precise identification of the location in accordance with the analyzed descriptions; and second, the validation of those descriptions for potential integration into existing descriptors recognized by international standards (see
Supplementary Materials—Tables S1–S5). Regarding the identification of the location, it was considered that since the earthquake occurred on a holy day, a non-working day, people’s observations would be closer to the locations, within the parish limits. Meanwhile, the identification of the parishes needed to be verified, since several do not currently have the same names, nor do they belong to the current city. In some cases, this circumstance required consulting toponymy, local knowledge, and visits to the sites. In case of doubt regarding the approximate location, the reference was used only as an indicator for defining the intensity level. Regarding these descriptions, those deemed suitable for integration into international-scale descriptors were mapped. In certain cases—particularly where information about rivers was less condensed—they were incorporated into a more comprehensive descriptor developed by the authors. (
Figure 2 shows the structure of the validation process, summarized in
Figure 2 and the different stages of the process).
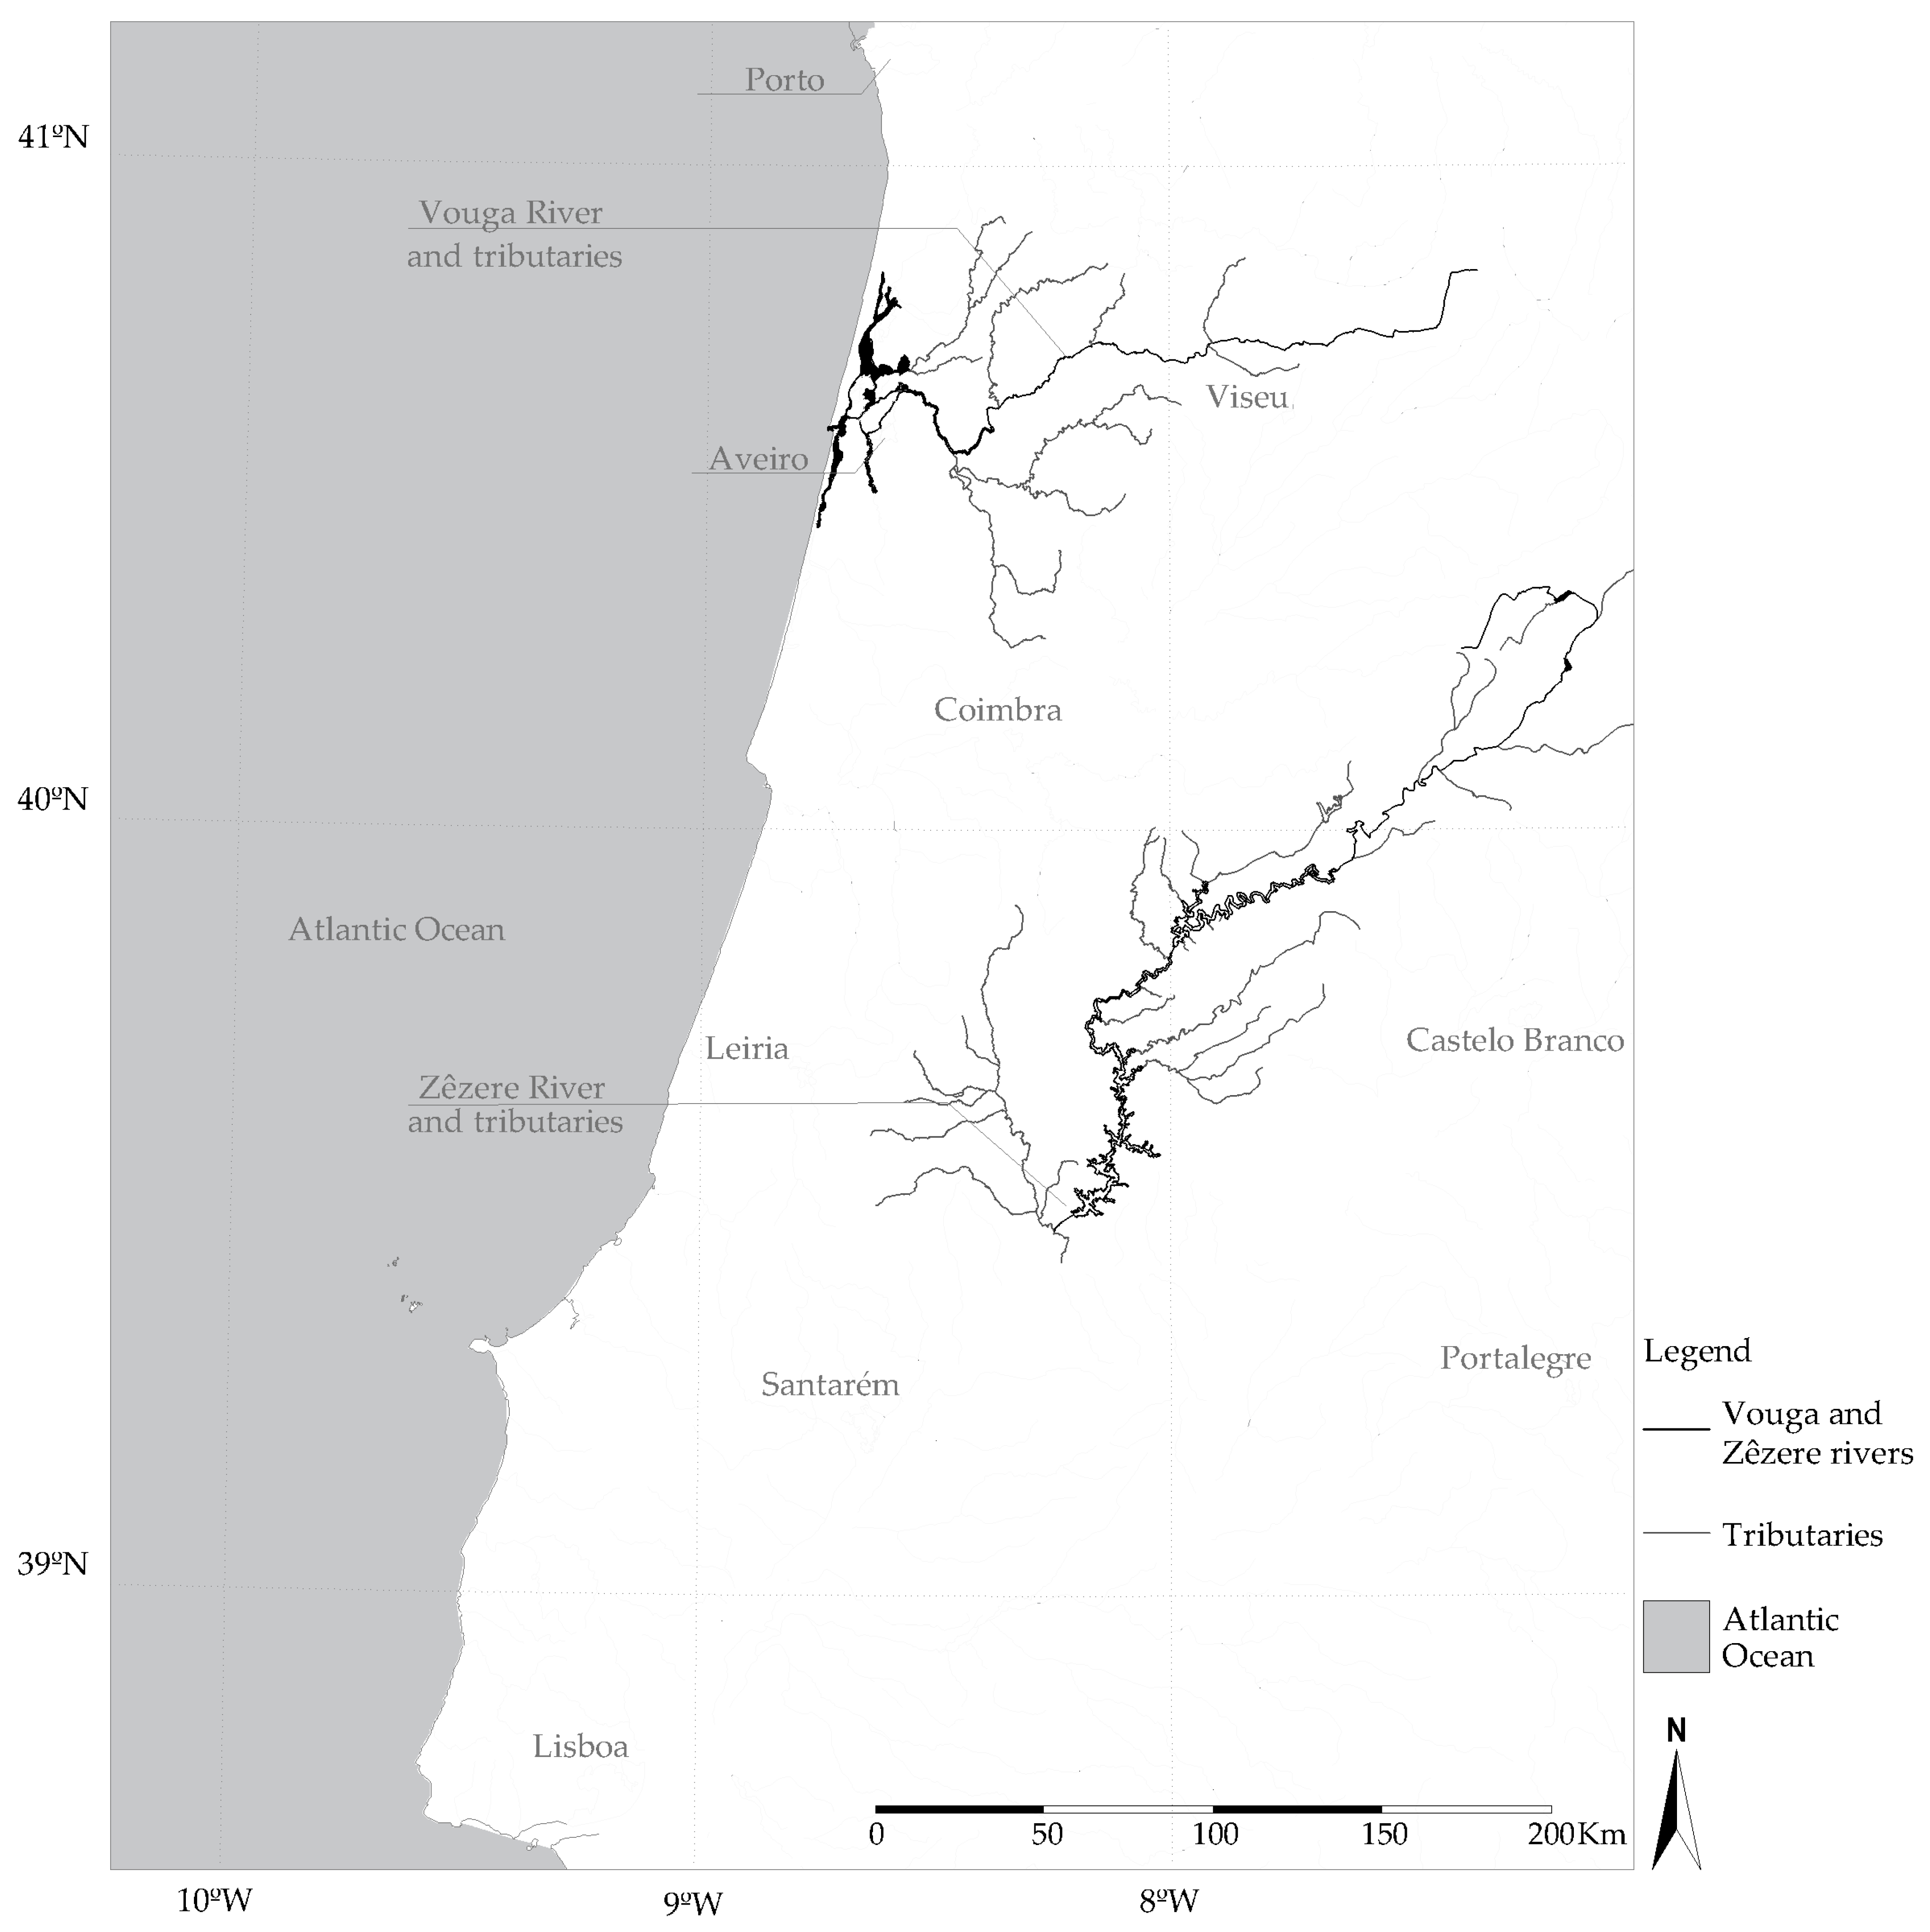
The second level of selection was implemented, focusing on the quality of the information contained within the materials to ensure that only the most reliable and relevant data were retained. Only those that could identify the location and type of observed phenomenon were considered. Consequently, many descriptions in the documents were not validated for this purpose. Data with highly dispersed locations and without the possibility of cross-referencing with other validated data types were not mapped. This analysis also integrated the multidisciplinary fields of structural and seismic engineering to assess the building damage described in the 1756 documents in the final validation stage. The authors identified two main regions with a high concentration of rivers and tributaries that have quality historical information and exhibit a variety of phenomena occurring near inhabited areas (
Figure 3): the areas around the Vouga and Zêzere rivers.
These regions had 351 validated records (EEEs) divided into 127 validated descriptions of locations related to rivers, water courses, and springs; 143 related to buildings; 49 related to soil effects; and 32 related to seiches. These locations were mapped and compared with various official maps from Portuguese national entities. The investigation concentrated on the following rivers, considering more than one record along their routes: Zêzere, Vouga, Caima, Nabão, Cértima, Águeda, Alfusqueiro, Tejo, Alcobaça, Lis, Unhais, Serra, Alva, and several rivers in the central region. Special attention was given to the Zêzere (an important Tejo River tributary) and Vouga (near the 45 km Ria de Aveiro coastal lagoon) Rivers and their tributaries (
Figure 3).
Mapping was performed after selecting the highest-quality data, which significantly contributed to this study and future analyses. The data were processed to substantiate the author’s proposal and comparison with international proposals. All the information was recorded using the QGIS 3.34.15® platform, with the ESRI Shaded Relief and USGS Tectonic Plates, combined with Portuguese hydrographic data to improve data processing and enhance the cartographic presentation of the study area.
3. Results
The existence of multiple scales highlights the complexity involved in defining descriptors and assigning intensity levels to earthquake effects. For this reason, the clarity of these descriptors is essential for distinguishing between degrees within the same scale. The integration of criteria recognized across disciplines—by geologists, seismologists, civil engineers, and other experts—strengthens the objectivity of a given scale and underscores the interdisciplinary nature of the approach.
In a preliminary analysis and according to these principles, the preponderant degrees of intensity relating to the effects resulting from the 1755 earthquake were determined as follows: (i) the suppression of water from sources/springs (between VII and VIII), (ii) cloudy water (between VI and VIII), and (iii) an increase in the flow rate (between VI and VIII). The authors developed a proposal for descriptors and respective intensity ranges for rivers and tributaries based on the MMI 56, the EMS 98, and the reference to the ESI 2007 based on records of the 1755 earthquake (after validation) of varying diversity and geographic locations. The assessment of the effects was conducted in a comparative study for each location using the records of the effects illustrated in MMI 56 on sources, soils, objects, etc. This was performed to define the intensity degree intervals attributed to watercourses on a sampling basis of more than 50 locations. We integrated descriptions relating to the seiches phenomenon into the analysis, as there are historical records that quantify the height of the swell. The analysis of recorded effects on rivers, streams, and sources enabled the subdivision and grouping of phenomena using proposed descriptors. These were mapped on QGIS
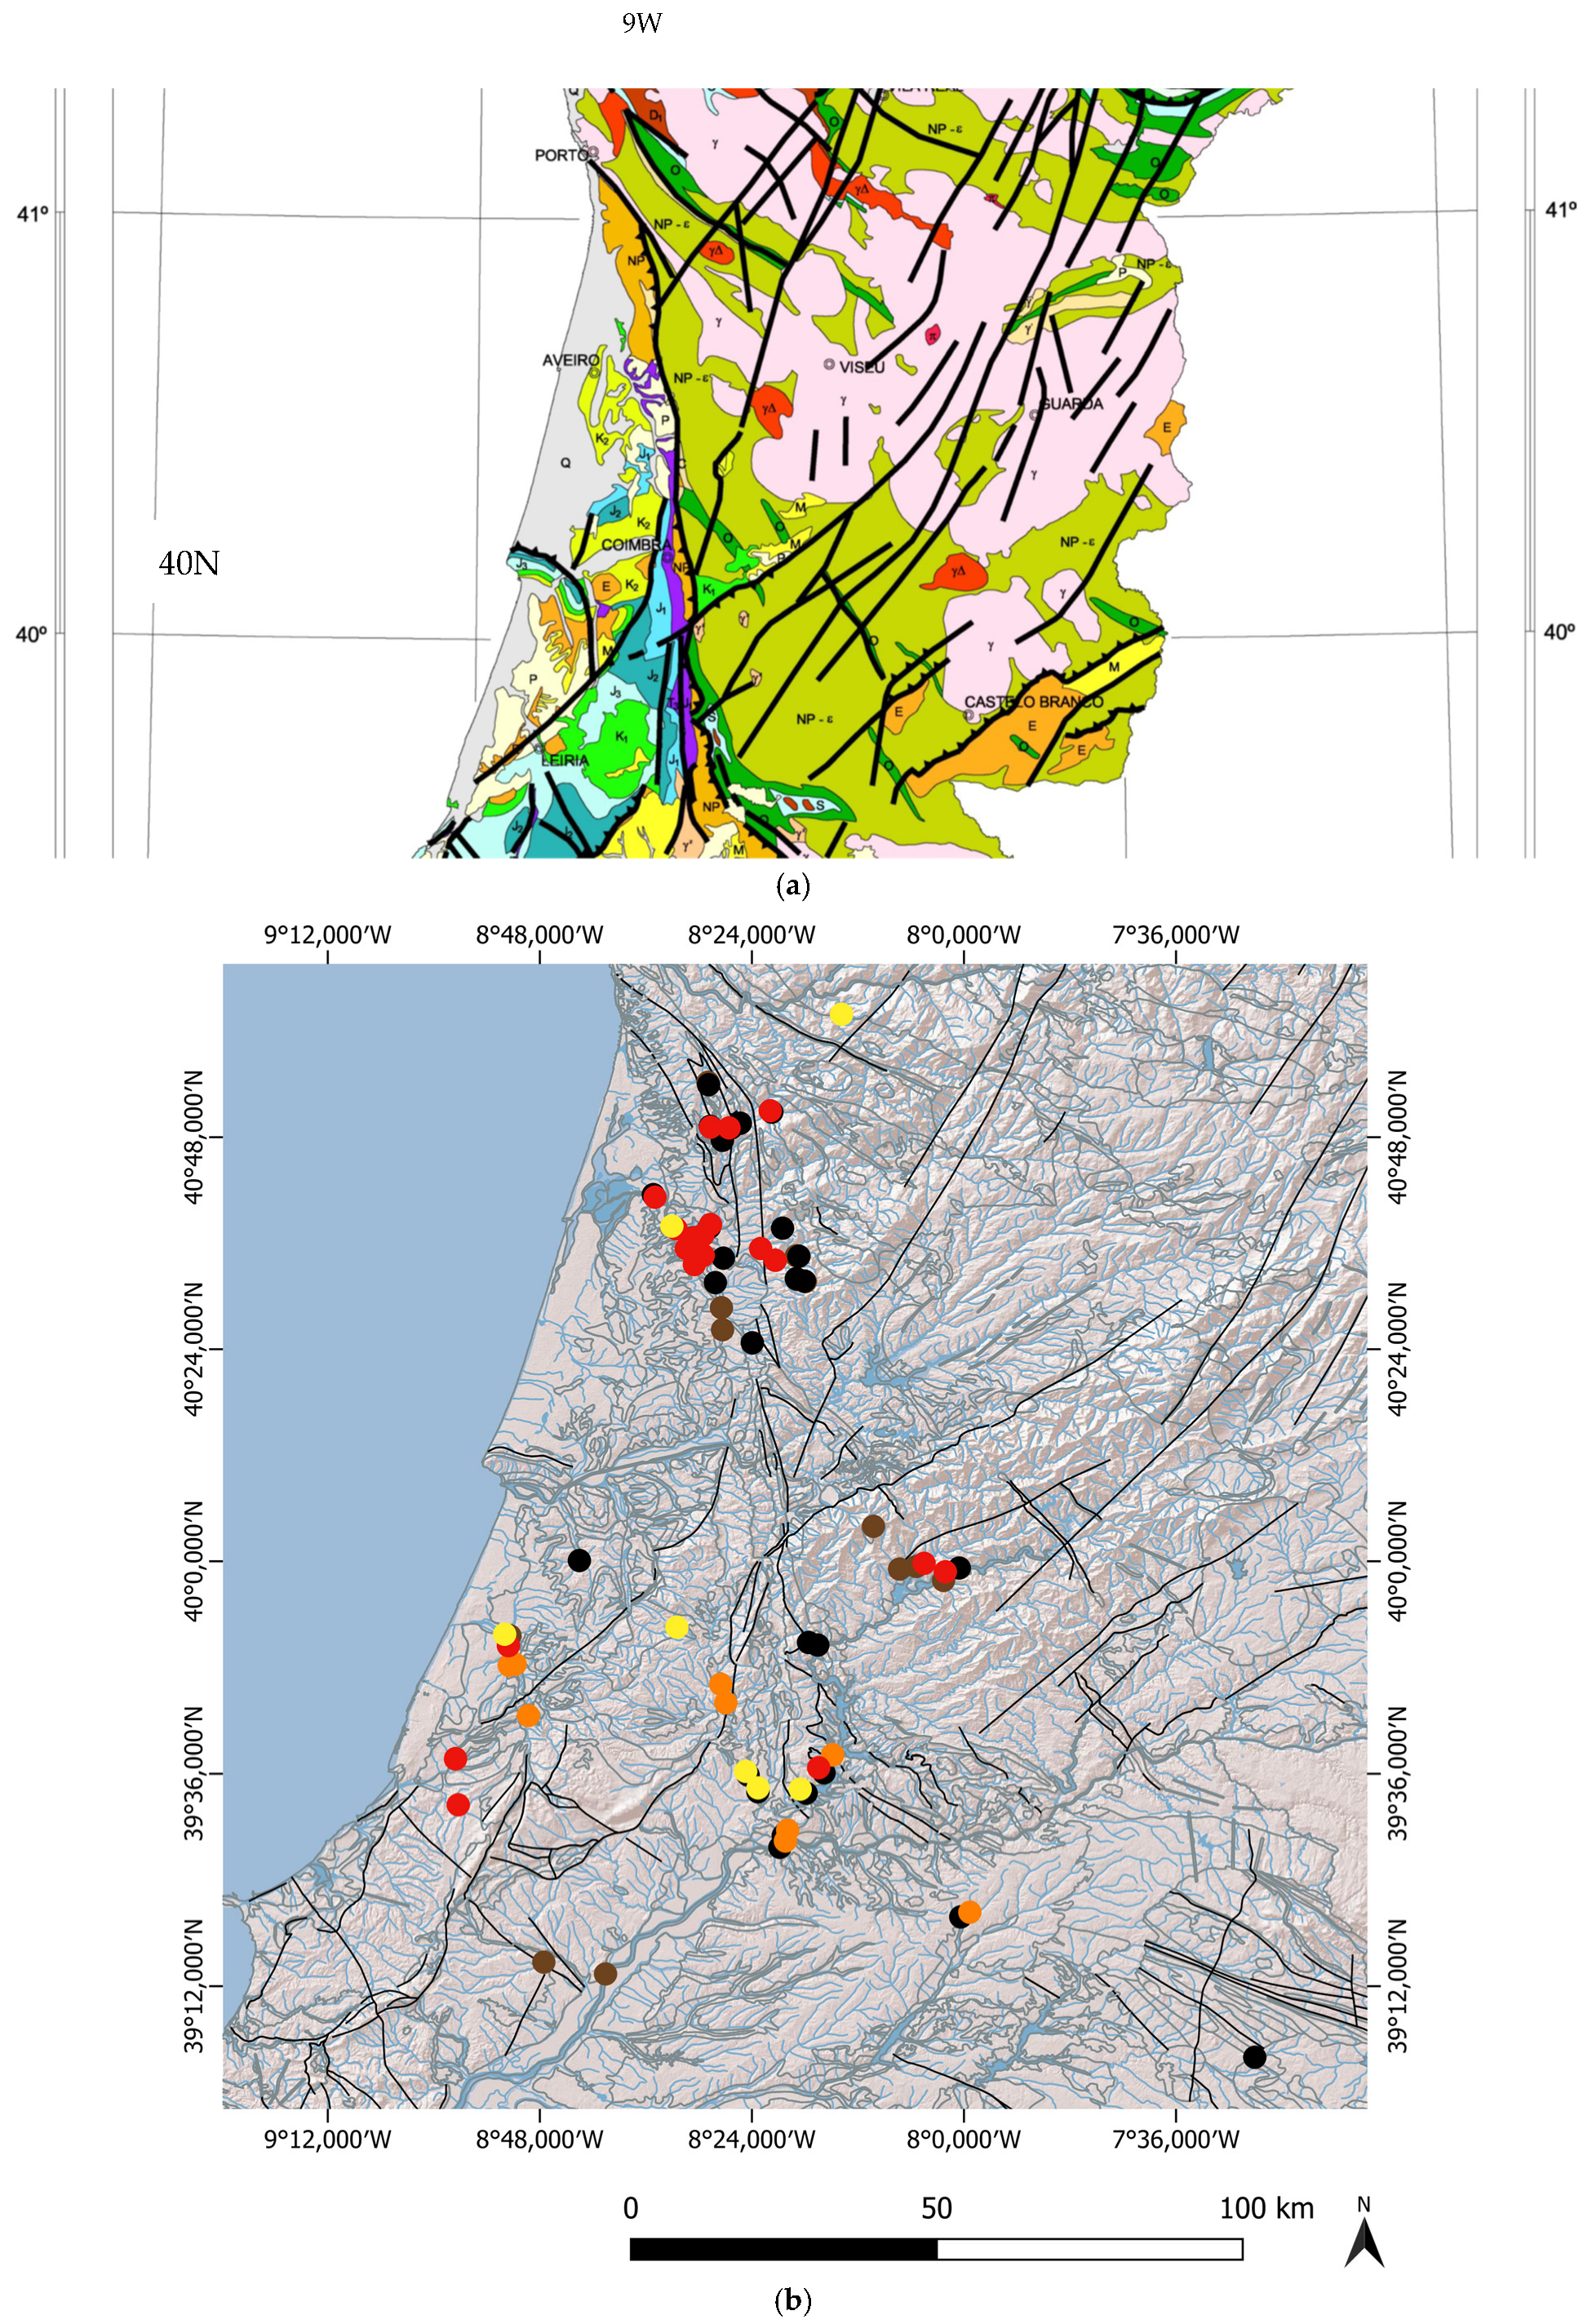
®. They were compared with the Geological Chart of Portugal [
17], shown in
Figure 4a,b, which includes tectonic faults. The analysis of the mapping performed (
Figure 3) indicated that the phenomena were more significantly concentrated in the region of the Vouga and Zêzere Rivers and their tributaries. Some of the registered locations were more than 250 km from Lisbon. The locations in the northernmost region predominantly presented intensity levels between VI and VII, and the southernmost regions had intensity levels of VIII and IX. The phenomena observed, whether in rivers, tributaries, or sources, corresponded to intensity levels of VI or above.
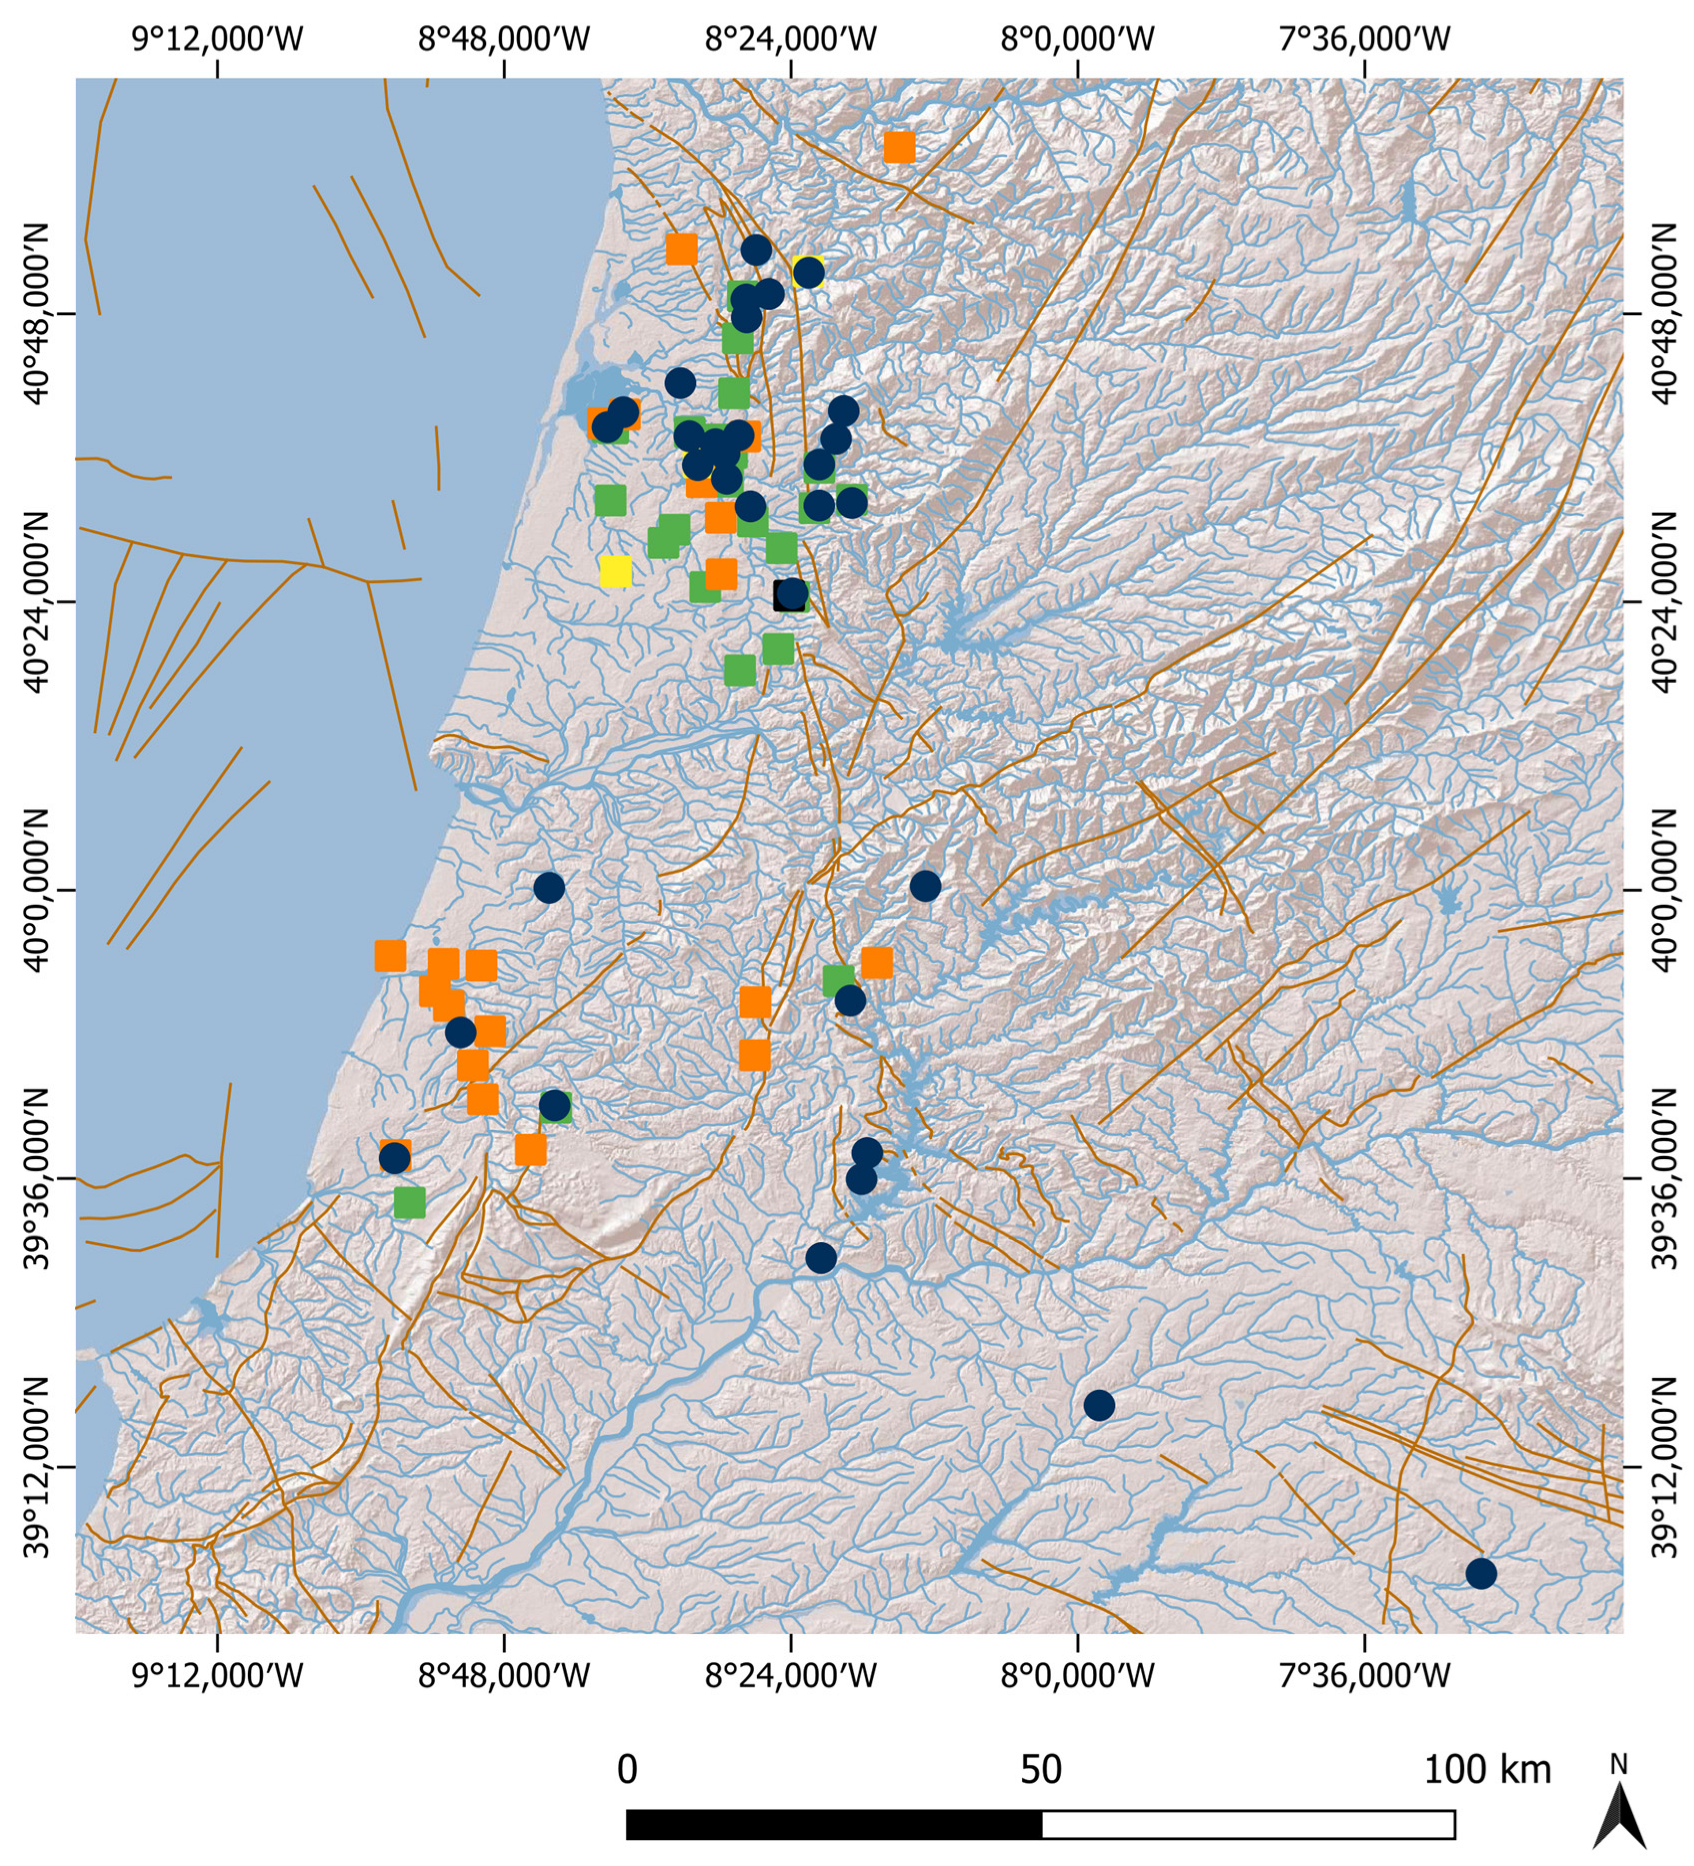
The phenomena associated with sources/springs in the north, mapped based on QGIS
® frameworks (
Figure 5), mainly appeared with the mention of turbid water or a color change, with occasional records of water suppression (
Figure 5). There were records of water suppression further south, with abundant flow restarting in some cases. There were fewer reports of turbid water, but they were concentrated along the Porto–Tomar tectonic fault. Most of the events took place on the geological limit between the ancient Meseta and the Mesozoic borders. This phenomenon might be due to the slight movement at the contact between the two different geological units, which allows water pressure beneath to create the observed springs.
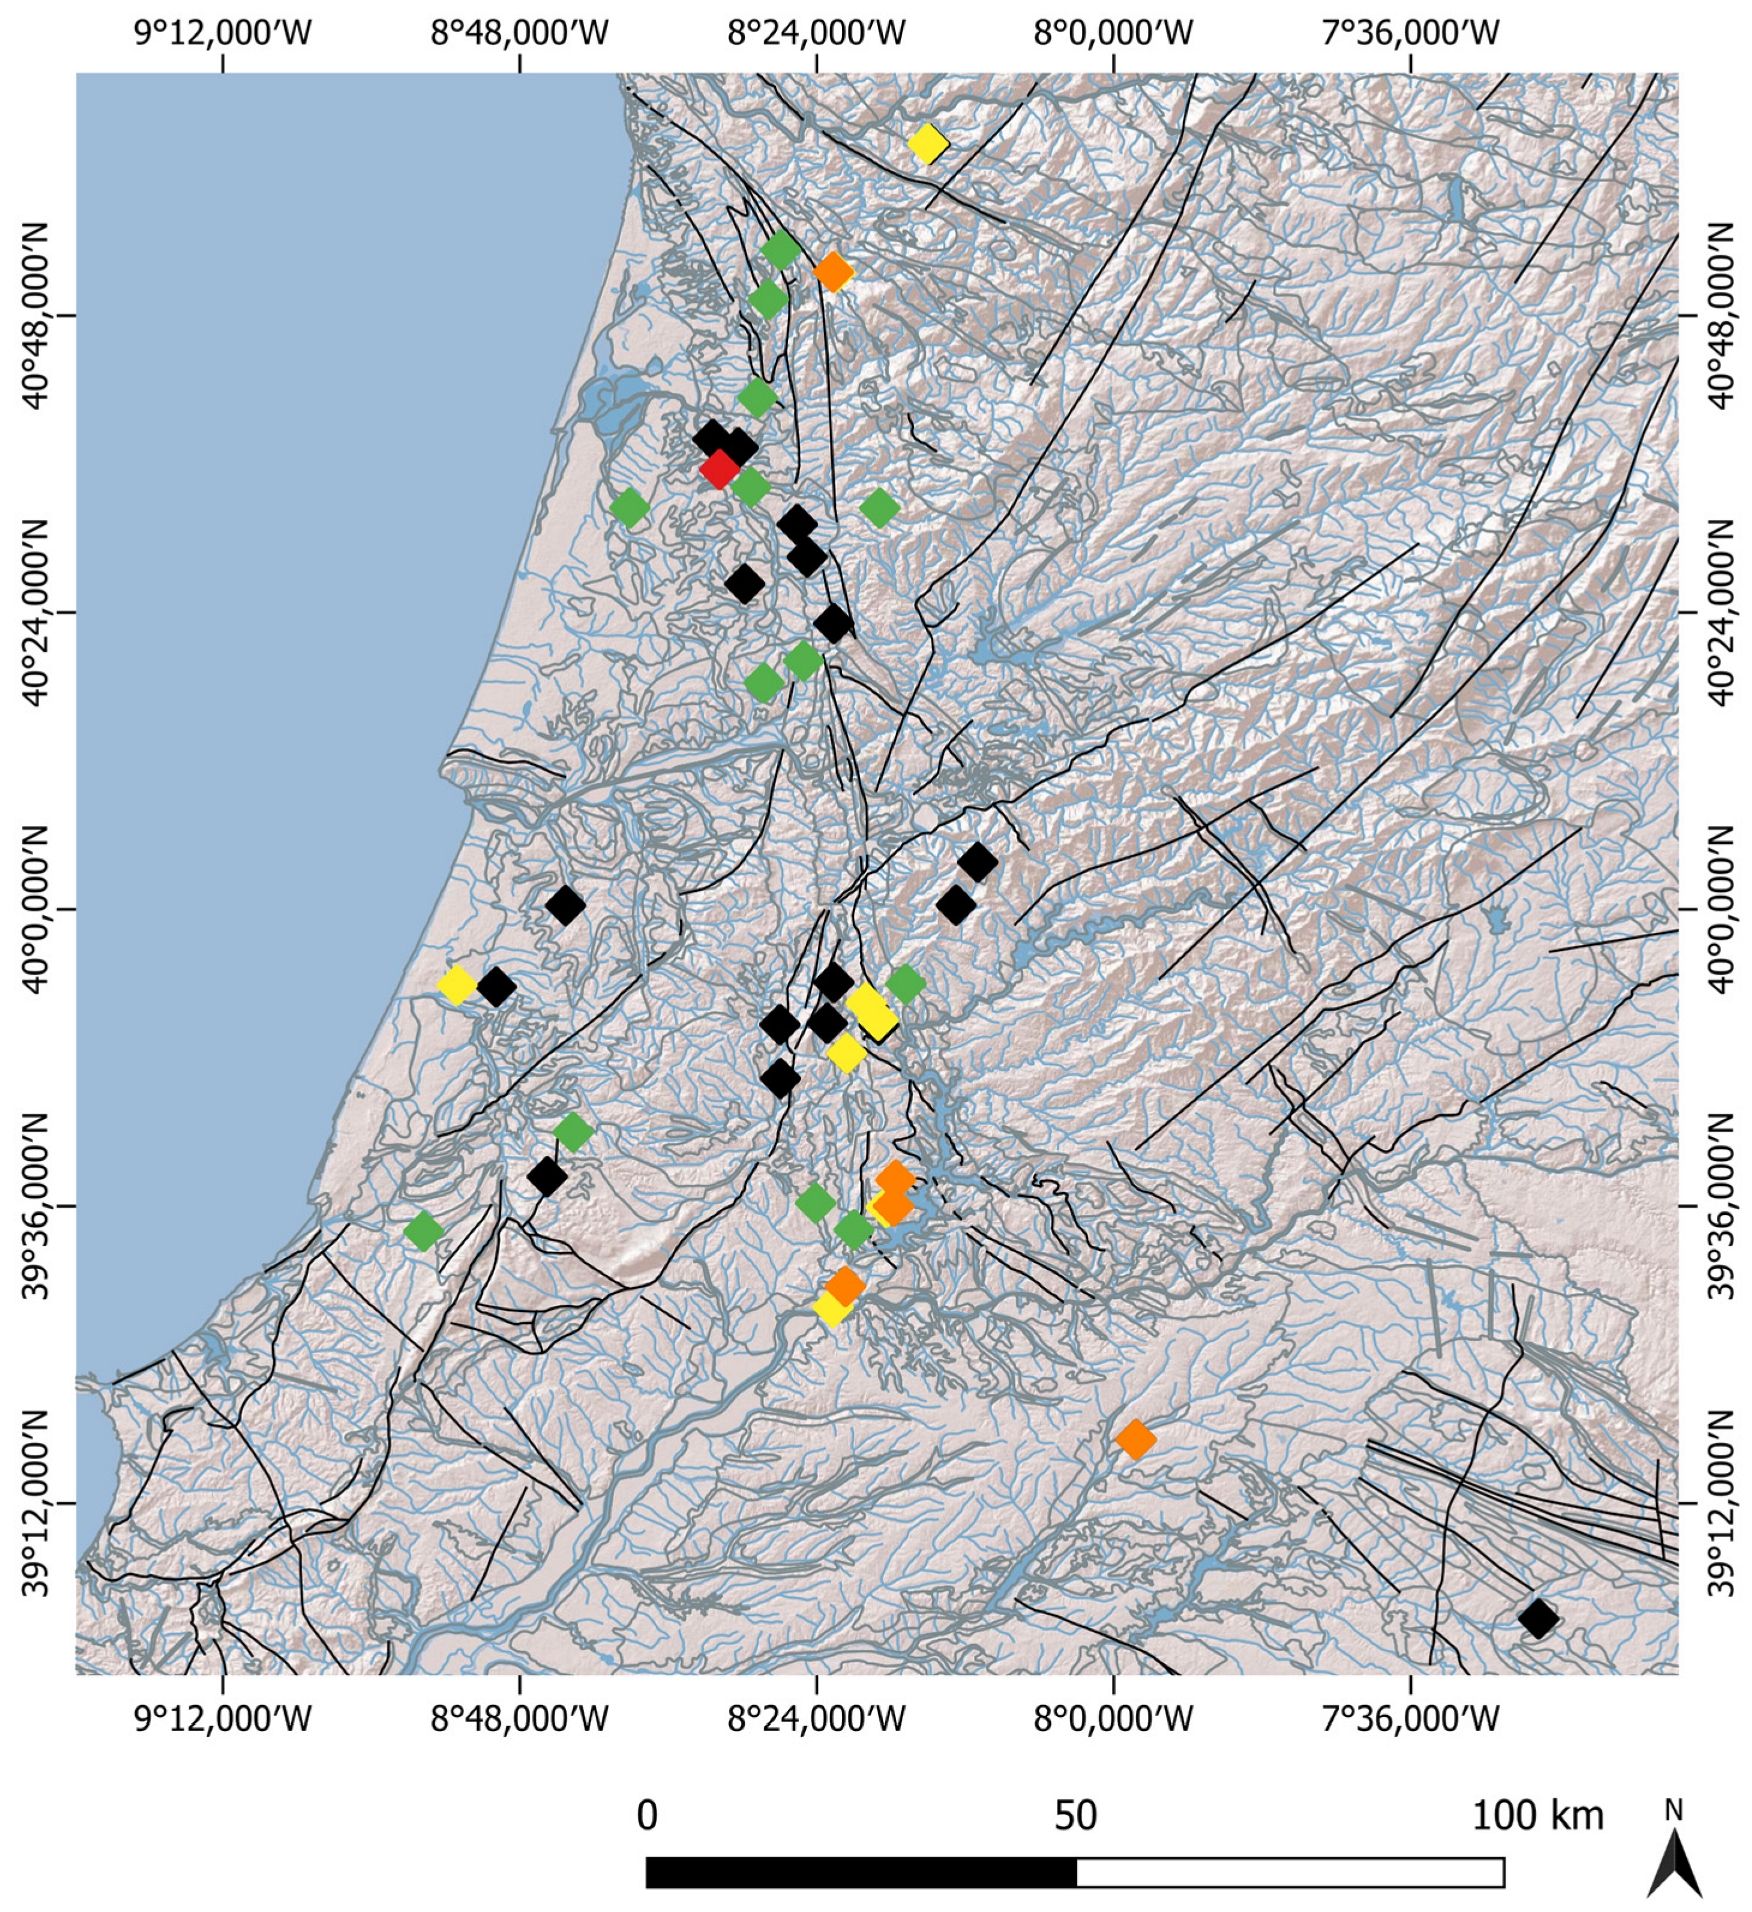
Regarding rivers mapped using QGIS frameworks (
Figure 4b), reports of currents with turbid waters were also identified in regions where such waters were mentioned in the sources. There was a greater increase in river flow to the north (
Figure 4b); meanwhile, there was a tendency for a decrease or stop in river flow to the south. There was only one case of increased flow recorded in an area where the same phenomenon in sources was observed, but it was surrounded by others with a decrease in flow. Generally, the phenomenon of great river water agitation follows a predominant north–south alignment. The predominant axes were recorded, given the characteristics of the distribution of phenomena in sources and rivers (
Figure 4a,b and
Figure 5). The mapping of the phenomena in 1755 was compared with the known and probable tectonic faults contained in the excerpt from the Neotectonic Map de Portugal [
17] (
Figure 4a) to better understand the registered phenomena. The mapping of the effects verified that most were in regions along the Porto–Tomar fault but with some derivations, possibly in the direction of other probable faults or geological soil contrast. Most cases of abnormal movement of river waters with an eventual rise in wave action were registered in this north–south direction, with two main focuses: in the Caima River region and the Zêzere River region (
Figure 4b). The Alvaiázere/Tomar region, aligning with the fault, experienced a concentration in the source’s changes, where more water was suppressed further north in this region, and the flow increased further south. Descriptions of river current suppression and recovery were found in locations with intensity degrees above VIII, both in the north and further south. When strong seismic waves traverse a region, weak areas tend to “open” and “close”, as observed in many video camera recordings [
18]. This movement in areas where water is under pressure results in “springs” and “suppression”. When compared with the results obtained by the authors, it was confirmed that the initial base value of intensity degree VI was consistent with EMS 98, and that the intervals of intensity degrees were, overall, similar. Since MMI 56 and EMS 98 do not include degrees of intensity for rivers and streams, the results obtained from the results of this study, which could be considered complementary for the future discussion of the addendum to Annex 7, are presented below (EMS 98):
An increase in flow with possible changes in the limit of the river course (between V and VIII);
Flow suppression and eventual replacement (VIII or higher);
Abnormal agitation of the current, with possible vertical movements of the waves (between VI and VIII);
Current with turbid water (between V and VIII).
Given the consistency of the results in various locations for the same type of phenomenon and the respective degree of intensity, these values can be regarded as a reference basis.
Two phenomena are important to observe, given the comparison with current records: first, seiches, which involve the movement of water in lakes or reservoirs, normally at large epicentral distances and revealing the presence of seismic energy over a long period, and second, the “sloshing” phenomenon [
19] (“Sloshing” is the movement of water contained in a closed recipient when submitted to vibrations at the support foundations. This movement is solved by eigen equations which gives frequencies and modal shapes important to represent the response of the liquid using the principle of superposition for the linearized cases. Frequencies of oscillation are in the interval 1 to 0.2 Hz [
20]. A good example of a sloshing effect was observed recently in high rise buildings in Bangkok where water in top swimming pools fall down due to the balance of buildings provoked by the Myanmar earthquake of 28 March 2025 [
21]. Similarly, we face seiches in large distances to the seismic fault causing oscillations in lakes, reservoirs and the different is their period is much larger of the order of minutes.). They are well mirrored in the case of earthquakes in video camera footage taken in various locations in Mexico City, such as the earthquake of 19 September 2017 (M8.1) [
18]. YouTube images show the water in swimming pools exceeding the edges of a tank and in a channel where pleasure boats were sailing, the vibration imposed on the base made them undulate significantly, with frequencies of the order of 0.5 Hz and amplitudes of at least half a meter. The wavelength of the ripple in the channel was about 2 m. In this area, the nearest seismographic station recorded a PGA of ~1.8 m/s
2—intensity VII/VIII. In the engravings showing views of Lisbon during the 1755 earthquake and attributed to the tsunami, this interpretation appears to be erroneous compared with the video camera images mentioned above, as they must be nothing more than local vibrations of the type represented by the “sloshing” phenomenon. Unfortunately, we do not have a good account of the arrival time of these short-period ripples to eliminate the possibility of a resonance caused by the tsunami influx.
In a recent review of records from 1755 for the central area of mainland Portugal (
Figure 6), water agitation was observed in more closed environments and rivers (Cértima and Águeda, Vouga, and Zêzere), as well as in the coastal lagoon “Ria de Aveiro”, which were transcribed for just a few cases: “The waters of the rivers rose agitatedly with the way the earth seemed to float”; “It was noted that the Vouga River lost its natural flow, its waters spreading and rising somehow, and changing as if they were boiling in waterfalls”; and “In the river Zêzere at the time of the earthquake the water rose more than a “côvado” (0.66 m). A phenomenon that warrants further study to determine the cause of these observations, which can be validated using video camera footage from other countries with similar seismo-tectonic environment as the one where 1755 took place (as recently observed with video cameras in swimming pools of the top of buildings during the Myanmar earthquake, 28 March 2025 [
21]).
4. Discussion: Comparison of Different Intensity Scales, Including a Preliminary Proposal for Rivers
This study considered the analysis of existing intensity scales: the Modified Mercalli Intensity Scale (MMI, 1956 [
2]), the European Macroseismic Scale (EMS) 98 [
4], and the Environmental Seismic Intensity (ESI) 2007 scale [
5]. A debated annex, Annex 7 on the “Effects on natural surroundings”, intended to be linked to the EMS 98 scale, was also analyzed since it contains a more extensive proposal than data from known scales in terms of hydrological and hydrogeological effects.
The Modified Mercalli Intensity Scale (MMI, 1956 [
2]) qualitatively evaluates the intensity of an earthquake, defining degrees of intensity presented in Roman numerals from I to XII. The defined degrees of intensity ranged from a minimum degree corresponding to a non-felt earthquake (I), through intermediate degrees, with a contribution from structural engineers being advisable above VIII to validate the information [
2], until reaching a maximum degree (XII), which indicates an almost complete collapse. Each intensity level is associated with a descriptor that captures a range of observed effects—from impacts on buildings and static or suspended objects to changes in soil conditions, hydrological and hydrogeological features, and human reactions, among others. However, the MMI 56 scale provides limited or absent descriptors concerning the effects of earthquakes on aquifers and watercourses such as rivers and streams.
The European Macroseismic Scale, initially proposed in 1992, was based on the MSK 64 [
22] scale. It was designed to provide consistency in seismic intensity assessments across European countries and was revised in 1998. The term “macroseismic intensity” is used in the EMS 98 to classify the severity of earth movements based on the effects observed in a given area. Annex 7 on the “Effects on natural surroundings” was developed to overcome the limitation of parameters involving hydrological effects, namely, water masses. A debate revolved around the scope of the EMS 98 (European Macroseismic Scale 1998) [
3], where intervals of degrees of intensity were established to categorize the effects of an earthquake on water springs and soils. The subdivision is presented in four categories, including hydrological phenomena, slips, lateral spreading, and complex cases involving convergent processes.
Silva et al., 2021 [
14] used the data compiled in Vaz et al. [
16] on the hydrogeological effects observed during the 1755 Lisbon earthquake to apply the ESI-07 scale. Their observation was more concentrated in large rivers, namely the Duero, Tagus, and Guadalquivir. Our study was more concentrated on areas with contrasting geological settings.
According to Michetti et al. [
5], in the Environmental Seismic Intensity ESI 2007 scale, geomarkers suitable for a paleoseismic assessment are grouped based on their physical relationship with the tectonic fault associated with the origin of the earthquake. In contrast, if these are directly related to the rupture of the fault surface, they are called direct (primary effects), with indicators not directly related to this being considered indirect (secondary effects). This second class of evidence can be further subdivided into three subclasses [
5]. The ESI-07 scale proposal developed by the INQUA Paleoseismology International Focus Group in 2007 [
23] and discussed in July 2019 (working group Macroseismic scales, ESC) presents a quantification and parameterization (EEE) in qualitative terms via traditional macroseismic scales. The supporting database refers to the 51 earthquakes in the Iberian Peninsula (mainly in Spain) compiled in the Spanish Catalog [
13].
The ESI-07 proposal scale graphically presents the effects resulting from earthquakes subdivided into primary effects and secondary effects, the latter of which include (i) geological and geomorphological effects, including changes in water level; (ii) temporary changes in turbidity; (iii) changes in water temperature; iv) physical–chemical changes; (v) permanent changes in watercourses; and (vi) changes in the level and flow of water from sources, wells, and rivers [
5].
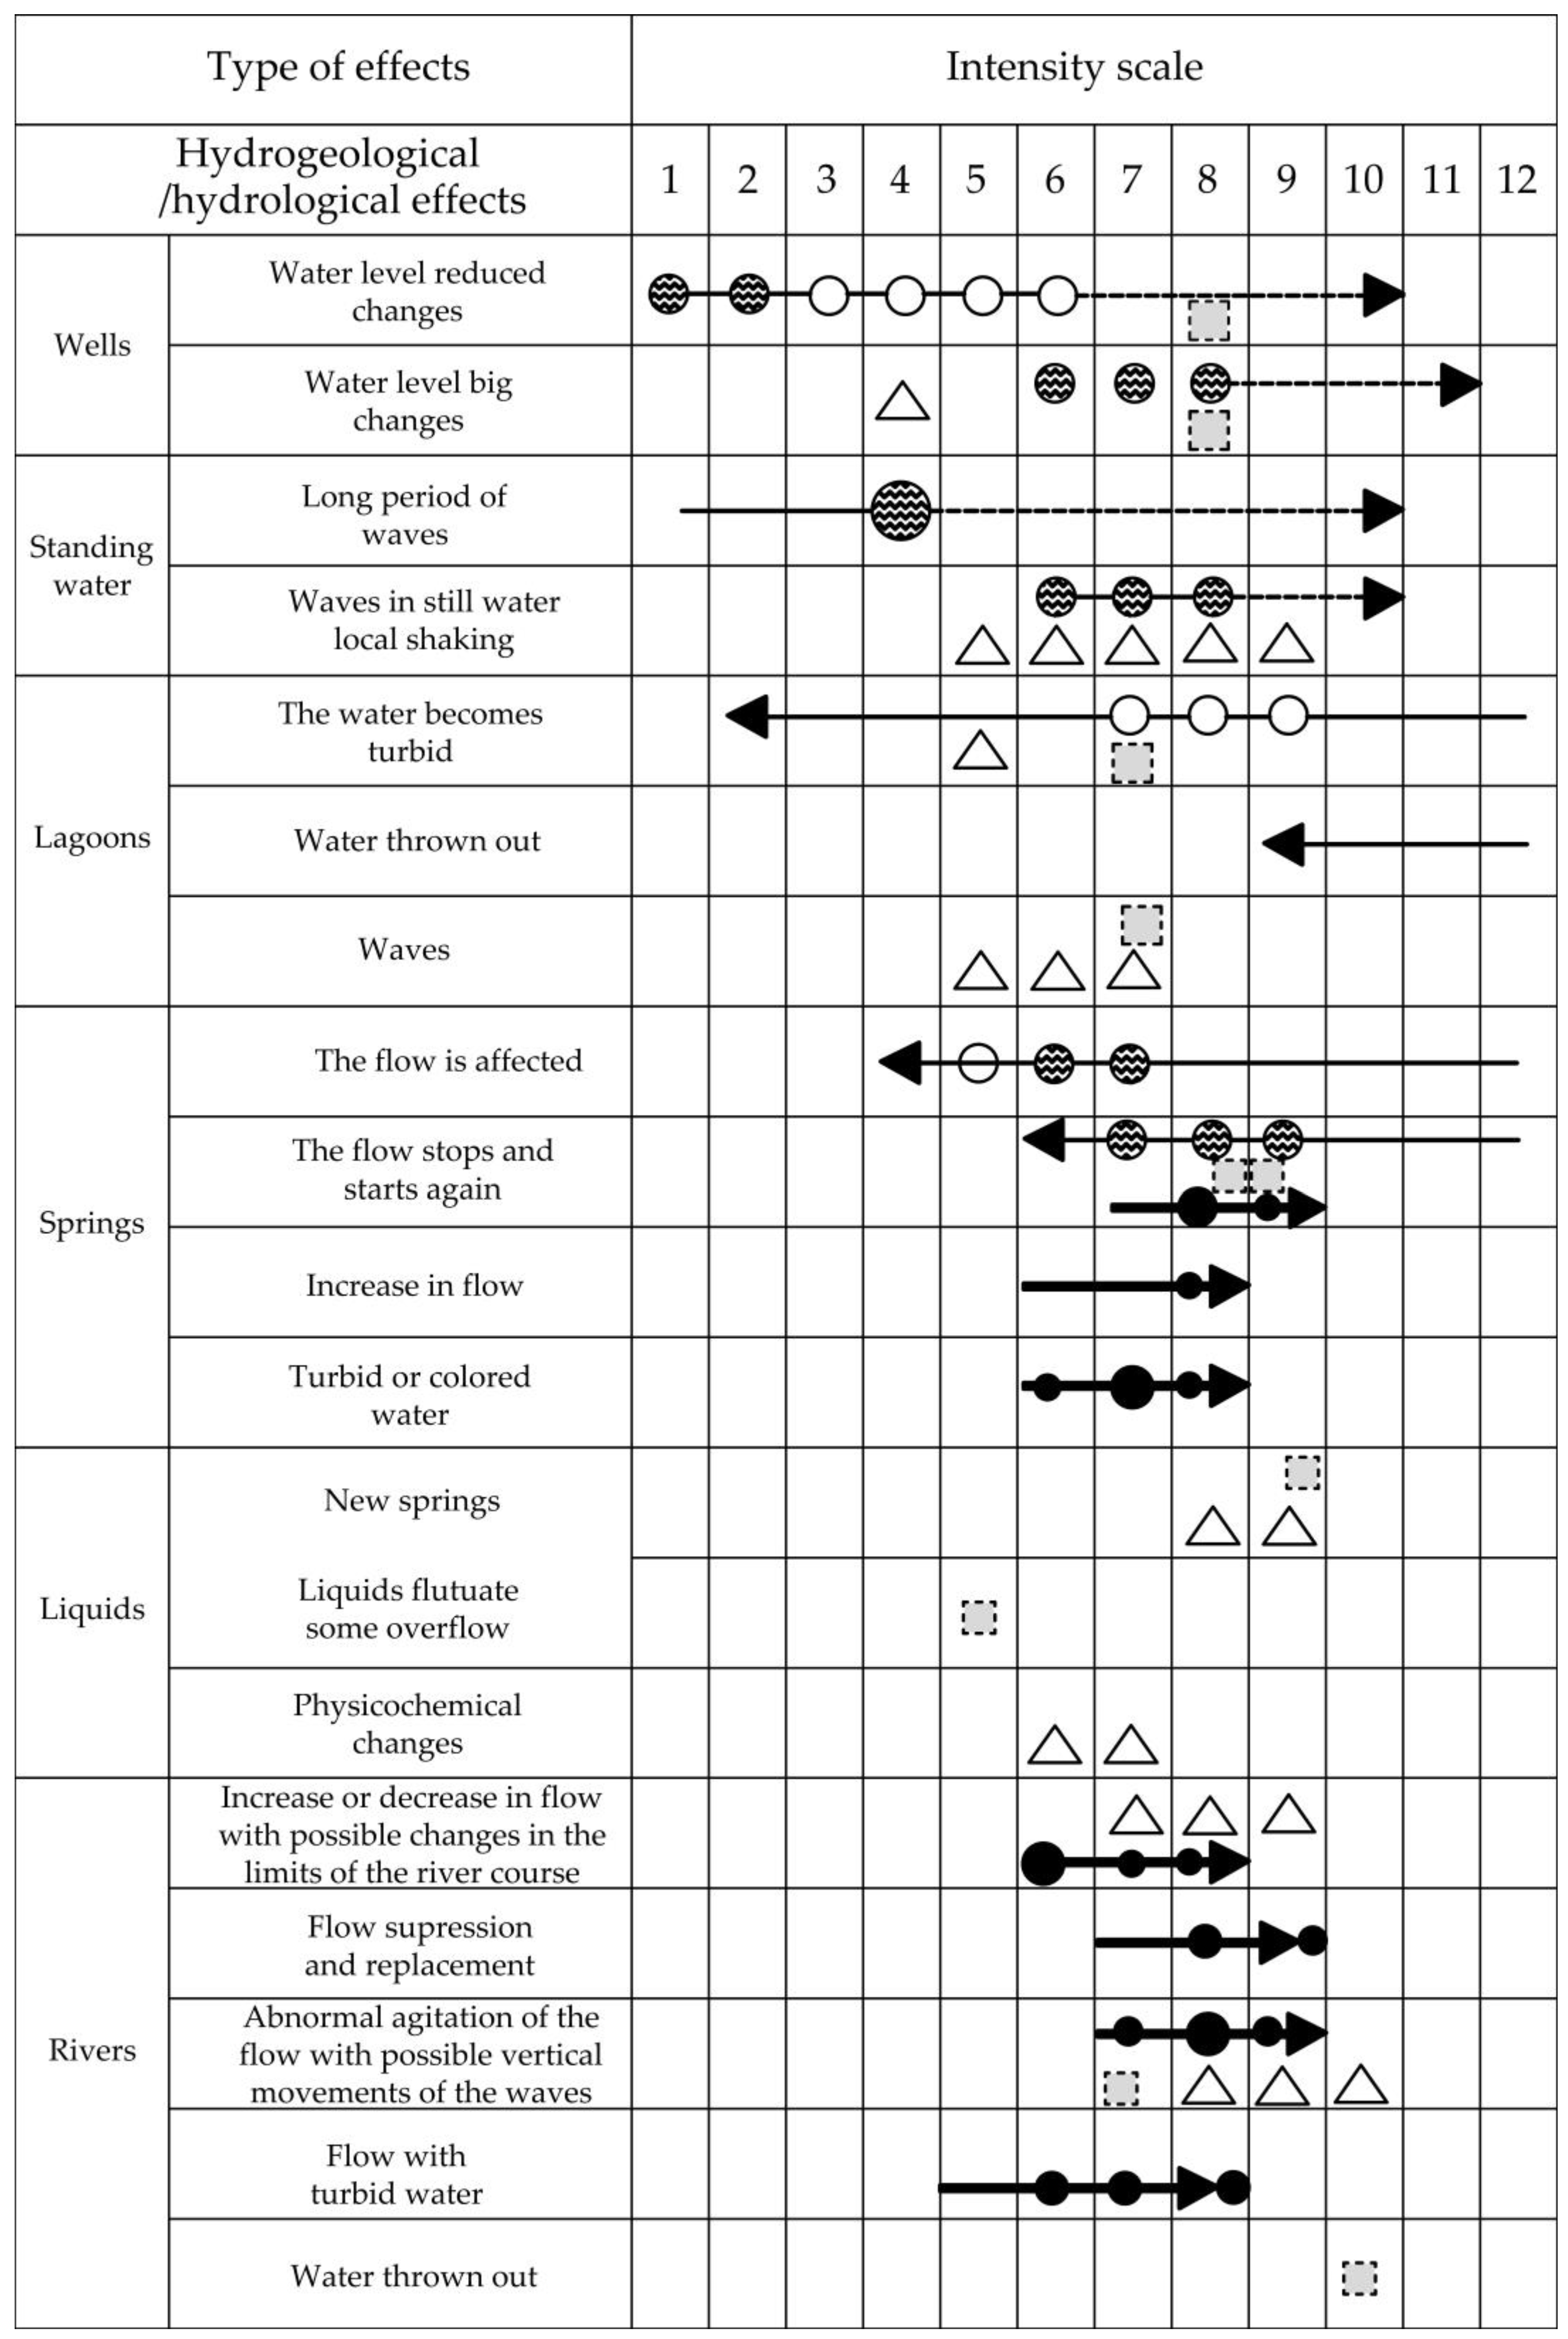
For a better understanding of the variants of scale proposals in relation to water bodies, sources, rivers, and streams, the references were aggregated into a single table (
Figure 7). As the descriptors did not fully agree between all scales, an attempt was made to group them whenever possible via comparable typologies, separating them when the descriptors could have a greater diversity of effects.
Figure 7 presents a comparative analysis by combining the scale proposals—MMI 56, EMS 98, ESI 2007/Annex 7 (2019 proposal), and L1755 (by the authors)—in a single table.
In this comparison, descriptors related to temperature or advanced physicochemical changes from the ESI 2019 scale were not included due to limited comparative data available for other scales and historical earthquakes.
The table (
Figure 7), more comprehensive than the ones by Vogt et al. [
24] and Silva et al. [
25], demonstrates that hydrological and hydrogeological effects were mainly predominant from level IV onward, extending up to the maximum limit of scale XII. Regarding wells, the most significant and frequent water level changes occurred between grades IV and VIII. Regarding lakes, there was some agreement between the different scales, placing the effects of abnormal waves with more emphasis on grade VII. These can occur starting at grade V, including water turbidity. Identical convergence existed in relation to the effects on sources and springs, especially those observed between VI and IX. Concerning watercourses, the authors placed the most common changes between grades VI and VIII, indicating greater intensities. However, the 2019 ESI proposal presented data that placed changes at grade IV.
5. Conclusions
Historical earthquake records are crucial for analyzing high-intensity earthquakes that occur over long periods. Since good instrumental data only date back to 1980, qualitative assessments remain essential as a complementary form of analysis, alongside intensity scales. The present study on the hydrological and hydrogeological effects of the 1755 Lisbon earthquake allowed the authors to establish a comparative framework of the occurrence of alterations in watercourses (rivers and streams) corresponding to intensity degrees between V and VIII. This was based on the analysis of the regions between the Vouga and Zêzere Rivers (central region of Portugal), located approximately 420–520 km from the likely epicenter at the Gorringe Bank. These regions had 351 validated records (EEEs), which included 127 validated descriptions of locations related to rivers, watercourses, and springs; 143 related to buildings; 49 related to soil effects; and 32 related to seiches/sloshing phenomena, all of which were mapped. The investigation concentrated on the following rivers with more than one record along their routes: Zêzere, Vouga, Caima, Nabão, Cértima, Águeda, Alfusqueiro, Tejo, Alcobaça, Lis, Unhais, Serra, Alva, and several rivers in the central region. Special attention was given to the Zêzere (an important Tejo River tributary) and Vouga (near the 45 km Ria de Aveiro coastal lagoon) Rivers and their tributaries. The most serious situations involved the suppression of flow and replacement or alterations in the limits of the river’s course as well as vertical movements of the water, at grades VII–VIII. The comparative analysis of commonly used scales, such as the MMI 56 and EMS 98, which were the basis for the analysis, provided valuable insights contributing to the ESI 2007 approach. The most recent proposal of ESI 2019 presented important data that should be considered in future studies but did not separate the degrees of intensity in relation to rivers. In this work, it was possible to narrow the variability in descriptors by proposing new, reasonably accurate intensity intervals for rivers that align well with source estimations compared to EMS 98 predictions. This preliminary study is still in progress, as it will be necessary to correlate the observed information with indications of a technical nature arising from the resolution of the “inverse problem” based on the theory of “seiches” and “sloshing”. Mapping revealed that most phenomena occurred along the Porto–Tomar tectonic fault, with some extending to other probable faults whose profiles and contributions to secondary effects remain unknown.
In brief, the main findings can be summarized as follows:
In addition to expanding the database on the effects of the 1755 Lisbon earthquake considering current state-of-the-art knowledge, this paper focuses on moderate macroseismic intensities, highlighting a gap in understanding the effects of seismic shaking on rivers, an aspect largely overlooked by existing scales, which primarily address high-intensity events. A key innovation is the introduction of new river descriptors, marked as “black circles”, which are intended to be used alongside established macroseismic scales. Additionally, river data was cross-validated by its proximity to fault traces from geological maps, revealing strong correlations with the Porto–Tomar fault and other minor faults. The study also suggests slightly higher macroseismic intensity values than those found in the existing literature.
The hypothesis suggests that seismic intensities can be modeled by comparing river-related effects to those observed in nearby constructions, where intensity values are more robust. The proximity of rivers to known fault lines provides further validation for this hypothesis.
Data was sourced from historical accounts at the Torre do Tombo Archive, allowing for the enhancement of previously identified values related to landslides. This process was challenging due to changes in village names over time, complicating location identification.
These data are also important for supporting the planning and management of water resources, risk management and mitigation, and territorial development, particularly when assessing the possible impacts of natural disasters such as earthquakes. In particular, reducing uncertainties in identifying hazards at a given location will benefit practical applications. Limited data points tend to increase uncertainty, often necessitating conservative estimates in practical applications to ensure safety. By improving our understanding, we can better control variables and decrease their values.
Future work will focus on analyzing the effects of ground motion on the building stock and investigating liquefaction phenomena within the same geographical region to establish correlations among various scale descriptors.
Supplementary Materials
The following supporting information can be downloaded at:
https://www.mdpi.com/article/10.3390/hydrology12060150/s1, Table S1: Process of validating historical descriptions of the 1755 earthquake by authors—case examples from 1756 documents; Table S2: Process of comparison of historical descriptions of the 1755 earthquake by authors—case examples from 1756 manuscripts with international descriptors; Table S3: Process of comparison of historical descriptions of the 1755 earthquake by authors—case examples from 1756 manuscripts with international descriptors; Table S4: Intensity scales (1); Table S5: Intensity Scale (2).
Author Contributions
Conceptualization, A.T., A.C. and C.S.O.; methodology and validation, A.T. and A.C.; formal analysis, A.T., A.C. and C.S.O.; investigation, A.T. and C.S.O.; resources, A.T.; data curation, A.T., A.C. and C.S.O.; writing—original draft preparation, A.T. and C.S.O.; writing—review and editing, A.T., A.C. and C.S.O.; visualization, A.T.; supervision, A.T.; project administration, A.T.; funding acquisition, A.T. All authors have read and agreed to the published version of the manuscript.
Funding
This research was funded by national funds through FCT/MCTES (PIDDAC) under grant numbers UIDB/50011/2020, UIDP/50011/2020, LA/P/0006/2020, and DOI 10.54499/2021.03830.CEECIND/CP1659/CT0032 and UIDB/04625/2020. This project also received funding from the European Union’s Horizon Europe Framework Programme under grant agreement number 101079377, and from UKRI under project number 10050486.
Data Availability Statement
The data presented in this study are available upon request from the corresponding author.
Acknowledgments
Author Alice Tavares is grateful for the financial support of the project CICECO—Aveiro Institute of Materials (UIDB/50011/2020, UIDP/50011/2020, LA/P/0006/2020, and DOI 10.54499/2021.03830.CEECIND/CP1659/CT0032), financed by national funds through FCT/MCTES (PIDDAC) and ENGINEER—European Union’s Horizon Europe Framework Programme under the grant agreement No 101079377 and the (project number 10050486). Carlos Sousa Oliveira and Aníbal Costa are grateful for the Portuguese Foundation for Science and Technology’s support through partial funding (UIDB/04625/2020) for the research unit CERIS.
Conflicts of Interest
The authors declare no conflicts of interest.
References
- Memórias Paroquiais de 1756. Arquivo Nacional Torre do Tombo, Ministério do Reino, Negócios eclesiasticos, Maço 638. Ref. MF 7497, 7498, 7499 (parishes of Vouga and Zêzere regions, Central region of Portugal Until Portalegre); Code PT/TT/MR/F/2/638, 1756; Ministério da Cultura, Instituto dos Arquivos Nacionais da Torre do Tombo, Direção de Serviços de Arquivistica, Divisão de Arquivos Definitivos: Lisbon, Portugal, 1756. [Google Scholar]
- MMI 56. Available online: http://www.geo.mtu.edu/UPSeis/Mercalli.html (accessed on 20 December 2024).
- EMS-98. Available online: https://www.gfz.de/en/section/seismic-hazard-and-risk-dynamics/data-products-services/ems-98-european-macroseismic-scale (accessed on 20 December 2024).
- Grunthal, G. European Macroseismic Scale. In Cahiers du Centre Européen de Geodynamique et de Séismologie; Centre Européen de Géodynamique et de Seismologie: Luxembourg, 1998; Volume 15. [Google Scholar]
- Michetti, A.M.; Esposito, E.; Guerrieri, L.; Porfido, S.; Serva, L.; Tatevossian, R.; Vittori, E.; Audemard, F.; Azuma, T.; Clague, J.; et al. Intensity scale ESI 2007. In Memorie Descrittive Della Carta Geologica d’Italia; Istituto Superiore per la Protezione e la Ricerca Ambientale: Rome, Italy, 2007; Volume 74, pp. 11–20. [Google Scholar]
- Pereira de Sousa, F.L. O Terremoto do 1o de Novembro de 1755 em Portugal, Um Estudo Demográfico; Serviços Geológicos de Portugal: Lisbon, Portugal, 1919; Volumes I and II. [Google Scholar]
- Baptista, M.A.; Heitor, S.; Miranda, J.M.; Miranda, P.; Mendes-Victor, L. The 1755 Lisbon Tsunami; Evaluation of the Tsunami Parameters. J. Geodyn. 1998, 25, 143–157. [Google Scholar] [CrossRef]
- Martinez-Solares, J.M. Los Efectos En España Del Terremoto de Lisboa (1 de Noviembre de 1755); Instituto Geográfico Nacional: Madrid, Spain, 2001; Monografia Núm 19. [Google Scholar]
- Fonseca, J.F.B.-D. A Reassessment of the Magnitude of the 1755 Lisbon Earthquake. Bull. Seismol. Am. Soc. Am. 2020, 110, 1–17. [Google Scholar] [CrossRef]
- Moreira, V.S. Sismicidade Histórica de Portugal Continental; Revista do Instituto Nacional de Meteorologia e Geofísica: Lisboa, Portugal, 1984. [Google Scholar]
- Martinez-Solares, J.M.; Lopez-Arroyo, A.; Mezcua, J. Isoseismal Map of the 1755 Lisbon Earthquake obtained from Spanish Data. Tectonophysics 1979, 53, 301–313. [Google Scholar] [CrossRef]
- Levret, A. The Effects of the November 1, 1755 Lisbon Earthquake in Morocco. Tectonophysics 1991, 193, 83–94. [Google Scholar] [CrossRef]
- Civiero, C.; Custódio, S.; Duarte, J.C.; Mendes, V.B.; Faccenna, C. Dynamics of the Gibraltar Arc System: A Complex Interaction Between Plate Convergence, Slab Pull, and Mantle Flow. J. Geophys. Res. Solid Earth. 2020, 125, e2019JB018873. [Google Scholar] [CrossRef]
- Silva, P.G.; Rodríguez-Pascua, M.A.; Robles, J.L.G.; Élez, J.; Pérez-López, R.; Bautista Davila, M.B. Catalogue of the Geological Effects of Earthquakes in Spain Based on the ESI-07 Macroseismic Scale: A New Database for Seismic Hazard Analysis. Geosciences 2019, 9, 334. [Google Scholar] [CrossRef]
- Duarte, J.C. Gibraltar Subduction Zone is Invading the Atlantic. Geology 2024, 52, 331–335. [Google Scholar] [CrossRef]
- Vaz, T.; Zêzere, J.L. Landslides and other geomorphologic and hydrologic effects induced by earthquakes in Portugal. Nat. Hazards 2016, 81, 71–98. [Google Scholar] [CrossRef]
- Serviços Geológicos de Portugal. Carta Neotectónica de Portugal Continental à escala 1:1 000 000, 1st ed.; Serviços Geológicos de Portugal: Lisbon, Portugal, 1988. [Google Scholar]
- Earthquake in Mexico. Earthquake Mexico Incredible Weird Video Earth ’Breathing’ 19-09-2017. (00:09–01:27). 2017. Available online: https://www.google.com/url?sa=t&source=web&rct=j&opi=89978449&url=https://www.youtube.com/watch%3Fv%3DTubNAD2kJDU&ved=2ahUKEwixotWXr-2NAxUwbvUHHYauKJkQwqsBegQIDhAG&usg=AOvVaw27EyFDrcvc1I4Ei2kYrUO3 (accessed on 15 March 2025).
- Jung, J.H.; Yoon, H.S.; Lee, C.Y. Effect of natural frequency modes on sloshing phenomenon in a rectangular tank. Int. J. Nav. Archit. Ocean. Eng. 2015, 7, 580–594. [Google Scholar] [CrossRef]
- Oliveira, C.S.; Ferreira, M.A. Following the video surveillance and personal video cameras: New tools and innovations to health monitor the earthquake wave field. Int. J. Disaster Risk Reduct. 2021, 64, 102489. [Google Scholar] [CrossRef]
- Myanmar Earthquake. Available online: https://www.youtube.com/watch?v=apzcPKc5e1s (accessed on 20 May 2025).
- Panel, A.H. Report on the Ad-hoc Panel meeting of experts on updating of the MSK-64 intensity scale, 10–14 March 1980. Gerlands Beitr. Geophys. 1980, 90, 261–268. [Google Scholar]
- Michetti, A.M.; Esposito, E.; Gürpinar, A.; Guerrieri, L.; Mohammadioun, J.; Mohammadioun, B.; Porfido, S.; Rogozhin, E.; Serva, L.; Tatevossian, R.; et al. The INQUA Scale: An Innovative Approach for Assessing Earthquake Intensities Based on Seismically-induced Ground Effects in Natural Environment. In Roma: Special Paper Memoire Descrittive Carta Geologica d’ Italia LXVII; Italy Servizio Geologico: Rome, Italy, 2004; Volume 118. [Google Scholar]
- Vogt, J.; Musson, R.M.W.; Stucchi, M. Seismological and hydrological criteria for the new European Macroseismic Scale (MSK-92). Nat. Hazards 1994, 10, 1–6. [Google Scholar] [CrossRef]
- Silva, P.G.; Élez, J.; Pérez-López, R.; Giner-Robles, J.L.; Gómes-Diego, P.V.; Roquero, E.; Rodríguez-Pascua, M.A.; Bardají, T. The AD 1755 Lisbon Earthquake-Tsunami: Seismic source modelling from the analysis of ESI-07 environmental data. Quat. Int. 2021, 651, 6–24. [Google Scholar] [CrossRef]
| Disclaimer/Publisher’s Note: The statements, opinions and data contained in all publications are solely those of the individual author(s) and contributor(s) and not of MDPI and/or the editor(s). MDPI and/or the editor(s) disclaim responsibility for any injury to people or property resulting from any ideas, methods, instructions or products referred to in the content. |
© 2025 by the authors. Licensee MDPI, Basel, Switzerland. This article is an open access article distributed under the terms and conditions of the Creative Commons Attribution (CC BY) license (https://creativecommons.org/licenses/by/4.0/).


