Abstract
Understanding and quantifying the coupled effects of land cover change and climate change on hydrological regimes is critical for sustainable water management in tropical mountainous regions. The Río Negro Basin in eastern Antioquia, Colombia, has undergone rapid urban expansion, agricultural intensification, and deforestation over recent decades, profoundly altering its hydrological dynamics. This study integrates advanced satellite image processing, AI-based land cover modeling, climate change projections, and distributed hydrological simulation to assess future streamflow responses. Multi-sensor satellite data (Landsat, Sentinel-1, Sentinel-2, ALOS) were processed using Random Forest classifiers, intelligent multisensor fusion, and probabilistic neural networks to generate high-resolution land cover maps and scenarios for 2060 (optimistic, trend, and pessimistic), with strict area constraints for urban growth and forest conservation. Future precipitation was derived from MPI-ESM CMIP6 outputs (SSP2-4.5, SSP3-7.0, SSP5-8.5) and statistically downscaled using Empirical Quantile Mapping (EQM) to match the basin scale and precipitation records from the national hydrometeorological service of the Colombia IDEAM (Instituto de Hidrología, Meteorología y Estudios Ambientales, Colombia). The TETIS hydrological model was calibrated and validated using observed streamflow records (1998–2023) and subsequently used to simulate hydrological responses under combined land cover and climate scenarios. Results indicate that urban expansion and forest loss significantly increase peak flows (Q90, Q95) and flood risk while decreasing baseflows (Q10, Q30), compromising water availability during dry seasons. Conversely, conservation-oriented scenarios mitigate these effects by enhancing flow regulation and groundwater recharge. The findings highlight that targeted land management can partially offset the negative impacts of climate change, underscoring the importance of integrated land–water planning in the Andes. This work provides a replicable framework for modeling hydrological futures in data-scarce mountainous basins, offering actionable insights for regional authorities, environmental agencies, and national institutions responsible for water security and disaster risk management.
1. Introduction
Land cover change is a fundamental driver of hydrological dynamics, especially in rapidly urbanizing Andean basins. The Río Negro watershed in Antioquia, Colombia, has experienced increasing anthropogenic pressure due to urban expansion, agriculture, and infrastructure development. These dynamics have direct consequences on runoff generation, groundwater recharge, and the overall water balance.
These changes often lead to modifications in runoff generation, peak flow magnitude, and baseflow stability, ultimately affecting water availability and flood risks. In this context, understanding the hydrological consequences of land cover change is crucial for the development of effective water management and planning strategies. This paper explores the relationship between land-use dynamics and streamflow behavior through the application of the TETIS model, using a multi-temporal approach grounded in satellite-based observations and hydrological simulations.
1.1. The Problem to Be Addressed
Over the past few decades, tropical mountainous regions have experienced accelerating environmental transformations due to land-use and land-cover changes (LULCC). In the Colombian Andes, these changes—driven by deforestation, urban expansion, agricultural intensification, and extractive industries—have significantly altered hydrological regimes, increasing the magnitude and frequency of peak flows while diminishing baseflow stability. The resulting impacts on water availability, ecosystem integrity, and flood risk underscore the urgent need for comprehensive hydrological research that links surface processes, precipitation variability, and water cycle dynamics. In particular, the Rio Negro basin in eastern Antioquia exemplifies the challenges of managing water resources in regions undergoing both rapid land cover transitions and growing exposure to climate extremes.
Land cover change is widely recognized as one of the most influential anthropogenic drivers of hydrological variability in mountainous regions. Alterations in vegetation cover, soil compaction, and the expansion of impervious surfaces directly affect the partitioning of rainfall into infiltration, evapotranspiration, and surface runoff. These processes are especially pronounced in steep headwater catchments, where small-scale land-use modifications often result in disproportionate hydrological responses. In the Andean context, studies have shown that deforestation typically leads to increased surface runoff, elevated sediment transport, and reduced groundwater recharge, while reforestation and conservation-oriented land management can contribute to greater flow regulation and soil moisture retention. However, assessing these impacts at the basin scale remains a major challenge, particularly in regions like eastern Antioquia, where long-term hydrometeorological data are scarce and land cover dynamics are highly heterogeneous.
1.2. The Approach Adopted
To address these limitations, the integration of satellite remote sensing with distributed hydrological modeling has become a cornerstone of modern water science. Remote sensing provides consistent and spatially continuous data for monitoring precipitation, land surface properties, vegetation dynamics, and topographic structure. These inputs are increasingly coupled with physically based or semi-distributed hydrological models that simulate basin responses under varying environmental conditions. Among these models, the TETIS model has gained prominence due to its capacity to ingest hydrologic data, operate effectively in data-scarce regions, and represent surface and subsurface hydrological processes across multiple spatial scales. TETIS has evolved into a flexible modeling framework applicable to a broad range of water resource assessments, including runoff generation, climate impact analysis, and scenario-based planning.
The motivation for this study is anchored in the need to strengthen decision-making tools for managing hydrological resources in highly dynamic and environmentally sensitive regions such as the Andes of eastern Antioquia. As urban and agricultural pressures intensify in these headwater basins, understanding the combined effects of land cover transitions and precipitation variability on runoff patterns becomes central to climate adaptation and sustainable watershed governance. Despite increasing awareness of these pressures, few studies have successfully integrated fine-scale land cover analysis with distributed hydrological models and climate change projections to examine temporal changes in streamflow behavior.
In light of these considerations, this paper explores the relationship between land cover change, climate change, and streamflow dynamics in the Rio Negro basin through the application of the TETIS model and the implementation of a multi-temporal land cover analysis framework. Specifically, the study addresses three main research questions: (1) How have historical land cover changes influenced runoff generation, peak discharge, and flow duration in the basin? (2) How can scenario-based simulations be used to project future hydrological responses under continued land-use and climate change? These questions guide the methodological design of the study and aim to advance the regional understanding of hydrological responses to anthropogenic and climatic drivers. Ultimately, the study contributes to the development of tools and strategies for adaptive watershed management in mountainous areas facing growing socio-environmental vulnerability.
The study implements the TETIS distributed hydrological model, coupled with a land cover change methodology designed to simulate future scenarios. By integrating satellite-based classification (SAR imagery), Markov transition matrices, and competitive allocation constrained by absolute land-use targets for 2060, we evaluate how alternative urbanization and conservation trajectories affect the hydrological response of the basin.
2. State of the Art
This section reviews the current research on hydroclimatic studies in tropical Andean catchments, emphasizing climate change scenarios, hydrological modelling, and land-cover dynamics. The focus lies on the integration of CMIP6-based climate projections, distributed conceptual models such as TETIS, and land-change modelling frameworks to understand hydrological responses to combined climatic and anthropogenic pressures. These advances provide a foundation for integrated water-resource assessments and adaptive management in data-scarce mountainous regions.
2.1. Land Cover Relevance
Land cover strongly regulates hydrological responses in Andean catchments, influencing peak flows, baseflow stability, and runoff seasonality. Deforestation, urbanization, and agricultural expansion alter infiltration and water storage capacities, thereby reshaping the hydrological regime. The Land Change Modeler (LCM) has been widely applied to simulate land-cover transitions and forecast landscape dynamics through transition potential modelling and Markov chains [1,2]. However, its dependence on historical trends and limited incorporation of socioeconomic or policy-driven constraints often restricts predictive realism [3]. Empirical evidence from Colombian and Andean basins reinforces these limitations. For instance, ref. [4] identified rapid urban expansion and loss of páramo and forest ecosystems in the Bogotá River Basin (1985–2014), with projections of continued degradation toward 2050. Their work highlights the need to embed socio-economic and conservation targets into LCM frameworks. Similarly, ref. [5] demonstrated that land-use change in tropical Andean headwaters reduces hydrological regulation capacity, increasing runoff variability and weakening the buffering role of natural vegetation. Collectively, these studies underscore that preserving native forest cover is crucial to maintain hydrological stability and mitigate flood and drought risks in rapidly changing Andean watersheds.
2.2. Climate Change MPI Model
In hydrology and climate modelling, the Max Planck Institute Earth System Model (MPI-ESM) under CMIP6 [6] provides simulations based on alternative socioeconomic and emissions pathways (SSPs), representing distinct radiative forcings by 2100 (4.5, 7.0, and 8.5 W/m2 for SSP2-4.5, SSP3-7.0, and SSP5-8.5, respectively) [7]. Within the MIP framework, future pathways are organized through the SSP architecture, which links socioeconomic narratives with forcing targets [8]. The MPI-ESM1.2-HR and MPI-ESM1.2-LR configurations couple the atmosphere (ECHAM6.3), ocean (MPIOM), sea ice, and terrestrial biosphere (JSBACH) components [9,10]. The higher-resolution HR version improves the representation of tropical convection, oceanic gradients, and precipitation extremes, which are crucial for downscaling and hydrological impact studies [9]. These CMIP6 configurations offer significant advances over CMIP3 and CMIP5 in simulating tropical rainfall and temperature variability, although bias correction remains essential in complex mountainous terrain [11,12]. The MPI Grand Ensemble (MPI-GE CMIP6) enhances reliability by separating internal variability from forced climate signals, improving hydroclimatic indicators such as maximum flows, drought duration, and IDF curves [13]. In the Andes, where ENSO strongly modulates precipitation and streamflow, multi-ensemble approaches are critical to capture low-frequency variability [14]. Across Colombia, CMIP6 simulations consistently project robust warming and spatially heterogeneous rainfall changes, often involving seasonal redistribution rather than monotonic trends, directly influencing water availability and flood risk [11,15]. These features justify the use of MPI-ESM as a robust driver for regional hydrological modelling.
2.3. TETIS Model
The TETIS distributed conceptual hydrological model represents the hydrological cycle through interconnected soil–subsurface reservoirs that simulate interception, evapotranspiration, surface runoff, interflow, and baseflow [16]. Its flexible structure enables application across diverse physiographic and climatic conditions, including tropical, arid, and alpine environments. Studies in Andean catchments show that deforestation and urban growth substantially increase peak discharges while reducing infiltration and baseflow stability, highlighting the model’s ability to reproduce hydrological impacts of land-cover change.
One of TETIS’s main strengths lies in its calibration framework based on dimensionless correction factors that reduce parameter uncertainty and enable regional transferability [16,17]. Research led by Félix Francés and collaborators established this split-parameter calibration scheme, later demonstrating the model’s scalability from small headwater basins to large river systems under contrasting land-use and management scenarios. Recent developments integrate TETIS with remote sensing and AI-based preprocessing tools, enhancing its capability to assess hydrological responses to extreme events and to support sustainable water-resource management.
2.4. Environmental Complex Interactions in the Andes
Interactions among land-cover change, precipitation variability, and hydrological dynamics are particularly intricate in tropical mountain regions, where rapid land-use transitions and climate variability converge. In Colombia and other Andean settings, satellite-based methods such as SAR and optical time series are increasingly used to monitor land dynamics and rainfall variability for hydrological modelling. Ref. [18] proposed a multitemporal radar-based framework for mapping urban expansion in complex Andean terrain, while ref. [19] demonstrated the use of Sentinel-1 imagery to track shoreline evolution in the Atrato delta. These approaches confirm the relevance of radar data for quantifying geomorphic and urban transformations in data-scarce regions.
At the basin scale, ref. [20] linked deforestation and urban growth to increased sediment yield in hydroelectric reservoirs, emphasizing the need for integrated sediment–land management. Ref. [21] used CMIP6-driven TETIS simulations to reveal reductions in dry-season flows and heightened variability in volcanic Andean basins, evidencing their high climate sensitivity. Complementary studies such as [22,23] have advanced flood and landslide risk modelling by coupling hydrological, hydraulic, and slope-stability modules, demonstrating the feasibility of multi-hazard assessment frameworks in data-limited Andean regions.
Together, these contributions reveal that combining remote sensing, process-based models, and climate scenarios provides a powerful pathway for understanding and managing the compounded hydrological impacts of land-use and climate change in tropical mountainous environments.
3. Study Area: Rio Negro Basin
3.1. Geographic and Climatic Characteristics
The Rio Negro Basin (Figure 1) is located in the eastern region of the department of Antioquia, Colombia, covering approximately 938 km2 and encompassing a diverse range of landscapes from high Andean ecosystems to urbanized areas [24]. The basin is geographically situated between the Central and Eastern Cordilleras of the Colombian Andes, with altitudes ranging from approximately 1800 to 2500 m above sea level. The main river, the Rio Negro, serves as a critical water resource for the surrounding municipalities, including Rionegro, Marinilla, El Carmen de Viboral, and La Ceja [25].
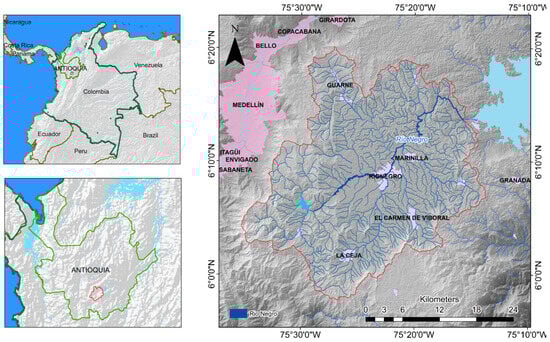
Figure 1.
Location of the Río Negro basin (eastern Antioquia, Colombia).
Climatically, the basin is characterized by a bimodal rainfall regime typical of tropical Andean catchments, with two distinct rainy seasons occurring from March to May and from September to November, and two relatively dry periods in December–February and June–August [26]. Mean annual precipitation ranges between 1800 and 2500 mm, with marked spatial variability driven by topography and orographic processes. The region’s temperature averages between 14 °C and 18 °C depending on elevation, and evapotranspiration plays a key role in local water balance dynamics [27]. Steep slopes in the Colombian Andes (as the case of the Rionegro basin) significantly increase the susceptibility of watersheds to landslides, particularly when combined with intense rainfall events. Historical analyses reveal that more than 90 percent of recorded landslides are triggered by precipitation, underscoring the dominant role of hydroclimatic factors in these mountainous regions [28]. Recent studies further show that the spatial and temporal variability of landslides is strongly influenced by rainfall patterns and large-scale climate drivers such as ENSO, which modulate both the frequency and magnitude of triggering events [29]. Moreover, under climate change scenarios, increasing rainfall intensity is expected to exacerbate landslide hazards, especially in the northwestern Andes, highlighting the urgent need for adaptive risk management strategies [30]. Steep slopes in the Colombian Andes (as the case of the Rionegro basin) significantly increase the susceptibility of watersheds to landslides, particularly when combined with intense rainfall events. Historical analyses reveal that more than 90 percent of recorded landslides are triggered by precipitation, underscoring the dominant role of hydroclimatic factors in these mountainous regions [28]. Recent studies further show that the spatial and temporal variability of landslides is strongly influenced by rainfall patterns and large-scale climate drivers such as ENSO, which modulate both the frequency and magnitude of triggering events [29]. Moreover, under climate change scenarios, increasing rainfall intensity is expected to exacerbate landslide hazards, especially in the northwestern Andes, highlighting the urgent need for adaptive risk management strategies [30]. In addition to hydroclimatic factors, the Rionegro basin has experienced rapid demographic growth and urban development over the past decades. This expansion has transformed rural landscapes into peri-urban and urban areas, intensifying land-use pressures and environmental degradation [31,32,33]. Such dynamics have increased the exposure of vulnerable populations and infrastructure to landslide risks, emphasizing the need for integrated land-use planning and sustainable urban growth policies in the region.
3.2. Historical Land Cover
Historically, the Rio Negro Basin was dominated by native forests and other green cover, including wetlands and natural pastures, which provided critical ecosystem services such as water regulation, soil stabilization, and biodiversity conservation [34]. However, over the last three decades, significant land-use changes have occurred due to urban expansion, agricultural intensification, and infrastructure development [35].
Urban growth has been particularly intense in and around the city of Rionegro, which has become a regional hub for commerce, industry, and services, driven in part by the presence of José María Córdova International Airport [25]. This urbanization has led to a marked increase in impervious surfaces, reducing infiltration and increasing surface runoff, which in turn affects flood peaks and groundwater recharge [34]. Agricultural activities, especially the cultivation of flowers and vegetables for export, have also expanded into previously forested areas, further altering the hydrological response of the basin.
Recent land cover analyses carried out by CORNARE [24,34] identified five main classes for the basin: (i) urban surfaces, (ii) forests, (iii) agricultural lands, (iv) other green cover, and (v) water bodies. These categories were used as the basis for this study to track historical trends and project future scenarios (optimistic, trend-based, and pessimistic) for the year 2060. Historical records reveal a marked decline in forests and other natural vegetation, accompanied by a rise in urban and agricultural areas, a pattern likely to persist in the absence of effective land management strategies. Based on the aforementioned sources, the five land cover classes summarized in Table 1 were used as a basis for the classification process.

Table 1.
Land cover classes defined for the Rio Negro Basin, based on CORNARE reports and regional studies [24,34].
3.3. Hydrological Behavior and Importance
The Rio Negro Basin plays a crucial role in water supply for multiple uses, including domestic consumption, industrial processes, agriculture, and ecological functions [27]. Its hydrological behavior is heavily influenced by the region’s topography and climatic regime, which drive rapid runoff generation during intense rainfall events and sustain baseflows during drier periods. The river system is characterized by high temporal variability, with quick responses to precipitation and a strong dependence on local infiltration and storage capacity [24].
The basin’s increasing urbanization has significantly altered its hydrological dynamics. The expansion of impervious surfaces has reduced infiltration rates, increased surface runoff, and elevated peak flows, making downstream areas more susceptible to flooding and erosion [36]. Simultaneously, the loss of forest cover and the spread of agriculture have weakened the natural ability of ecosystems, such as forests and wetlands, to regulate water flow, resulting in greater streamflow fluctuations and a decline in water quality caused by increased sediment and nutrient inputs.
CORNARE’s hydrological monitoring network, complemented by IDEAM data, has documented an increasing frequency of extreme hydrometeorological events in recent decades, which are linked to both climate variability and land-use changes [27,34]. These changes underscore the importance of integrated watershed management and highlight the need for hydrological modeling tools such as TETIS to evaluate potential future scenarios.
The basin’s importance extends beyond water resources to include socio-economic considerations. Rionegro and neighboring municipalities are part of Antioquia’s rapidly growing economic corridor, making water security and disaster risk management critical priorities for regional development planning [25]. As such, understanding the interplay between climate, land cover, and hydrology in the Rio Negro Basin is essential for informed decision-making and sustainable management strategies.
4. Materials and Methods
4.1. Materials
4.1.1. Phase 1—Satellite Image Processing and Land Cover Maps Generation
- Satellite imagery: Landsat (TM/ETM+/OLI), Sentinel-2 MSI, Sentinel-1 SAR, and ALOS PALSAR for 2007, 2010, 2018, and 2020, complemented with auxiliary scenes for training and validation.
- Ancillary spatial datasets: DEM for slope derivation, road network, hydrography, NDVI grids, and basin boundary polygon.
- Training and validation data: Field observations, historical land-cover maps, and reference photo-interpretation points.
- Software: Python (version 3.11.12.) libraries (numpy, rasterio, scikit-learn) and ARCGIS PRO (version 3.5.) software for preprocessing and QA/QC.
Figure 2 shows the elevation, drainage, and land-cover maps for 1986, 2014, and 2023, highlighting progressive deforestation in upper zones and urban expansion in valley bottoms. These spatial trends illustrate how land-use transformation has altered hydrological processes, reducing infiltration and increasing surface runoff.
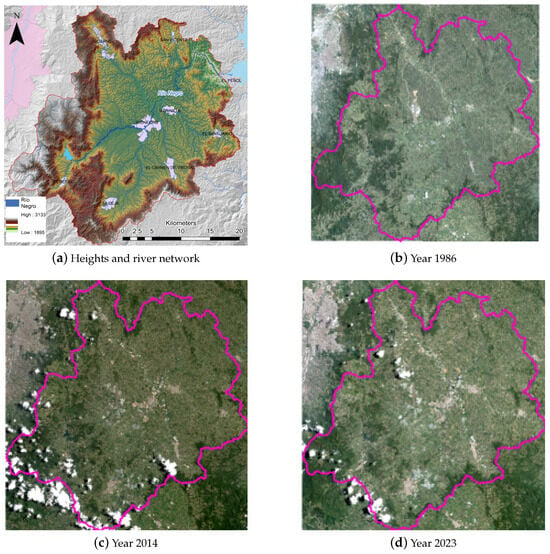
Figure 2.
Maps of elevations, river network, and land cover (RGB images) for different years across a 39-year period in the Río Negro basin.
4.1.2. Phase 2—Climate Projections and Downscaling Data
Precipitation projections were obtained from the high-resolution Max Planck Institute Earth System Model (MPI-ESM1-2-HR), developed within CMIP6 [6]. This model was selected because of its improved representation of tropical atmospheric processes and moisture transport, which enhances rainfall simulation over Colombia and tropical South America [9,11,37]. Three Shared Socioeconomic Pathways were analyzed: SSP2-4.5, SSP3-7.0, and SSP5-8.5.
To adjust the raw outputs to local conditions, daily bias correction was performed using the Empirical Quantile Mapping (EQM) technique [38,39,40,41]. This method aligns the cumulative distributions of modeled and observed precipitation, correcting both mean bias and variance while improving the representation of extremes. After correction, the precipitation series accurately reproduced observed seasonal cycles and was adopted as consistent forcing for the TETIS simulations.
4.1.3. Phase 3—TETIS Model Setup, Calibration, and Simulations
- Hydrological model: TETIS (version 9.1.) distributed conceptual model [17,42].
- Inputs: Downscaled precipitation and PET, land-cover maps from Phase 1, soil maps, and topography.
- Discharge data: Daily streamflow from the La Fresera station and supplementary IDEAM gauges.
- Software: TETIS tools, Python (Version 3.11.12.) and R (version 4.5.1.) scripts for evaluation metrics (NSE, KGE, PBIAS).
Calibration optimized nine dimensionless correction factors to represent runoff, infiltration, and storage processes (Table A1). The final calibration achieved NSE = 0.87 and RMSE = 9 m2 s−1, consistent with regional studies [43,44,45,46].
Validation using independent periods yielded NSE = 0.86, confirming the robustness of the calibration. Comparable studies in Andean basins show similar efficiency ranges, supporting the model’s reliability.
4.2. Methods
4.2.1. Overview
The workflow of this study (Figure 3) comprised three main phases: land-cover mapping, climate downscaling, and hydrological modeling. Historical land-cover maps were aggregated into five major classes: impervious surfaces, forests, croplands, other green areas, and water bodies. For 2060, two fixed urbanization targets (13 km2 optimistic; 45 km2 pessimistic) were applied, with proportional forest compensation to preserve basin balance.
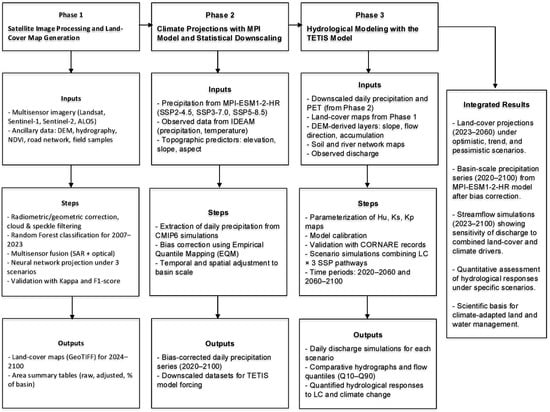
Figure 3.
Representation of the proposed methodology and its main results.
4.2.2. Phase 1—Satellite Image Processing and Generation of Land Cover Maps
The Río Negro basin (938 km2) was delineated using a DEM. Multisensor data (optical and SAR) were preprocessed for co-registration, cloud masking, and speckle reduction. Classification employed a Random Forest algorithm trained with ground and ancillary data, producing harmonized land-cover maps aligned to a 30 m grid. Probability fusion and AI-based allocation generated future maps for three scenarios (optimistic, trend, pessimistic). Validation used Kappa, F1-score, and spatial cross-validation. Annual maps and tabular summaries were produced for 2024–2100.
4.2.3. Phase 2—Climate Projections and Downscaling Corrections
Precipitation projections from MPI-ESM1-2-HR were bias-corrected with EQM using IDEAM records. The resulting series accurately represented local rainfall patterns and were selected as input for the TETIS simulations.
4.2.4. Phase 3—TETIS Model Setup, Calibration, and Execution
The TETIS distributed conceptual model represents the hydrological cycle through a set of interconnected soil and subsurface reservoirs, simulating surface runoff, interflow, and baseflow as emergent responses of the cell water balance [17,42]. Its structure and calibration strategy have been widely applied and validated in diverse Andean and Mediterranean basins, demonstrating robust performance in reproducing flow dynamics under varying climate and land-use conditions [21,47,48]. These precedents support the suitability of the model for the Río Negro basin application presented here.
Parameter maps were derived from POMCA datasets [24]. Calibration adjusted nine correction factors (Table A1) controlling production and transfer processes, achieving strong agreement with observed discharges. Simulations were conducted for three land-cover and three climate scenarios, covering two time windows: 2020–2060 and 2060–2100 (Table A2).
The integrated framework described above produced a coherent set of spatial and temporal datasets that enable consistent comparison of hydrological responses under alternative land-cover and climate trajectories. The bias-corrected precipitation series, together with the TETIS simulations parameterized for current and projected land-cover configurations, provided the basis for evaluating changes in streamflow magnitude, variability, and seasonal distribution. The following section presents the main results derived from these coupled analyses, emphasizing both the quantitative outcomes and their broader hydrological and management implications.
5. Results
5.1. Land Cover (LC) Projections
The Table 2 provides a comprehensive classification of land cover types identified in the Rio Negro basin. This level of detail allows for a nuanced assessment of land–hydrology interactions, especially distinguishing between different agricultural systems (e.g., permanent crops, tuber crops, agroforestry) and natural covers such as wetlands and riparian forests. Differentiating these categories is critical because each land cover type has distinct impacts on infiltration, evapotranspiration, and runoff behavior. For instance, wetlands and riparian forests enhance water retention and delay flood peaks, whereas discontinuous urban fabric and industrial areas promote rapid runoff.
Table 2.
Types of land cover present in the Río Negro basin.
To simplify modeling and interpretation, Table 3 groups the detailed land cover classes into five broader hydrological categories: hard surfaces, woods, crops, water bodies, and other green surfaces. Each group is associated with a specific RGB color scheme used in mapping outputs. This grouping facilitates the integration of land cover data into the TETIS model by linking hydrological response units to key functional landscape attributes. For example, hard surfaces are directly tied to increased imperviousness and rapid flow concentration, whereas “other green surfaces” represent transitional or degraded natural areas with intermediate hydrological behavior.
Table 3.
Land cover groups, LC types, RGB colors, and corresponding map colors.
Figure 4 shows land cover projections for 2060 under three contrasting scenarios: optimistic, trend, and pessimistic. Table 4 quantifies these scenarios in terms of the percentage of each hydrological group. In the optimistic scenario, forest cover (woods) increases to 11.2% while hard surfaces decrease to 0.2%, indicating strong conservation policies and urban growth control. The trend scenario reflects a continuation of current dynamics, with moderate forest loss and urban expansion. The pessimistic scenario exhibits extensive urbanization (hard surfaces reaching 34.6%) and severe reduction of forests to only 3.6%, signaling unregulated growth. These scenarios provide a basis for exploring how land management decisions will shape future hydrological responses. The sharp contrasts among scenarios allow the TETIS model to evaluate both the extremes and intermediate trajectories of basin development.
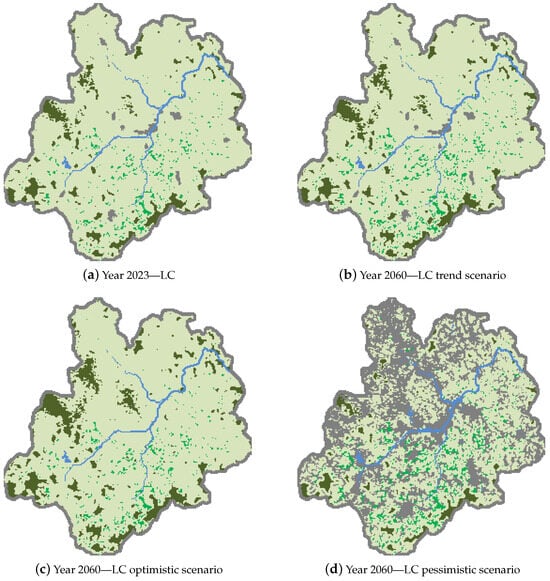
Figure 4.
Land cover (LC) maps for the year 2023 and projections for the year 2060 under three scenarios: trend, optimistic, and pessimistic.
Table 4.
Percentage of the Río Negro basin land cover main groups for the baseline year and projected scenarios.
5.2. Results of Climate Projections and Downscaling Process Using the MPI Model
For hydrological modeling, 12 precipitation stations and one evapotranspiration station with daily records from 1998 to 2023 were available, distributed across the basin and its surroundings. For these stations, downscaling and bias correction were performed using the empirical quantile mapping (EQM) method. Figure 5 illustrates the results for two representative stations. The red line corresponds to the downscaled but uncorrected historical model output, while the blue line shows the bias-corrected model output for the historical period. The black line represents the observed precipitation. Both the annual and daily cycles are presented, demonstrating that the bias correction significantly improves the agreement between model outputs and observations. In particular, the corrected series (blue) captures both the magnitude and the temporal distribution of precipitation across daily and monthly scales, reducing systematic biases such as the overestimation of wet-season totals and the underestimation of dry-season rainfall evident in the raw model outputs (red). The correction also reduces the temporal lag between modeled and observed peaks, leading to a more realistic representation of intra-annual precipitation variability.
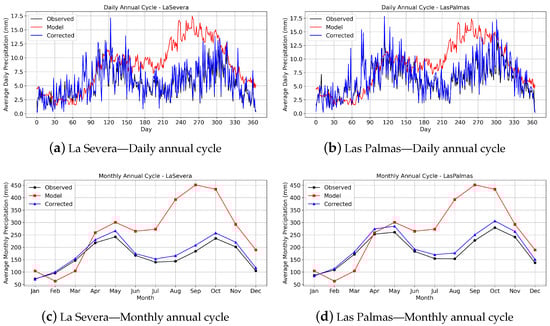
Figure 5.
Observed precipitation (black), raw downscaled model (red), and bias-corrected model (blue) for two representative stations. Top row: daily annual cycles. Bottom row: monthly annual cycles. Left column: La Severa station. Right column: Las Palmas station.
Figure 6 presents the multi-annual monthly and daily averages of projected precipitation from 2015 to 2100 for the same two stations, under three SSP scenarios (SSP245, SSP370, and SSP585). For both stations, the overall shape of the annual cycle is preserved across scenarios, reflecting the robustness of the seasonal precipitation regime. However, a consistent signal emerges across scenarios: an intensification of the second wet season (September–November), with higher monthly totals compared to the historical baseline. This signal is more pronounced under the higher-emission scenarios (SSP370 and SSP585). Additionally, while the inter-scenario spread is relatively small for most months, slight divergences appear in transitional months (e.g., May–June and October–November), suggesting increased uncertainty in the timing and intensity of seasonal transitions. Overall, the EQM bias correction ensures that the historical simulations reproduce observed variability with high fidelity, thereby providing greater confidence in the projected changes. The results highlight a potential increase in late-season precipitation, which could have important hydrological and water management implications for the basin.
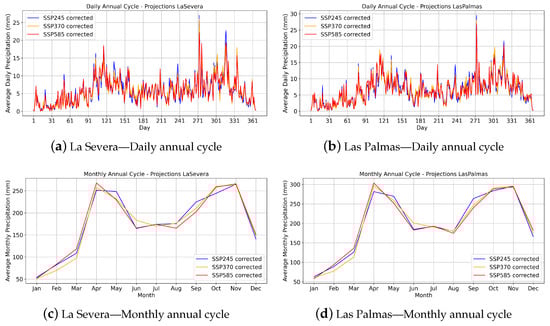
Figure 6.
Projected precipitation under SSP2.45 (blue), SSP3.70 (yellow), and SSP5.85 (red). Top: monthly annual cycle. Bottom: daily annual cycle. Bottom row: monthly annual cycles. Left column: La Severa station. Right column: Las Palmas station.
5.3. Highlighted Results of Discharge for the 2023–2100 Period Adopting the Land Cover Map of 2023 Year as Baseline
5.3.1. Time Series of Discharge for MPI245, MPI370 S and MPI585 Climate Change Scenarios
Figure 7 depicts projected streamflow (Q) under three climate change pathways (MPI245, MPI370, MPI585). From 2023 to 2059, simulations were performed using 2023 land cover as a fixed baseline. After 2060, streamflow projections incorporate three alternative land cover scenarios—pessimistic, trend-based, and optimistic—combined with each climate change pathway. Across all scenarios, discharge variability remains strongly seasonal, reflecting the bimodal rainfall regime characteristic of the region. However, the magnitude and frequency of high-flow events increase progressively from MPI245 to MPI585, indicating that intensified climate forcing enhances extreme hydrological responses. The inclusion of land cover trajectories after 2060 further highlights the potential compounding effects of climate and land-use change on future flood risk.
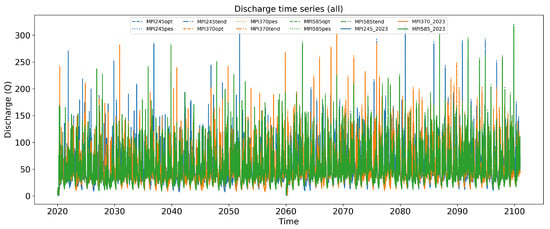
Figure 7.
Time series of river discharge Q (m3/s) for MPI245, MPI370, and MPI585 climate change scenarios.
5.3.2. Projected Streamflow for MPI245, MPI370, and MPI585: Fixed 2023 Land Cover (2023–2059) and Three Land Cover Trajectories (2060–2100)
Figure 8 shows the temporal evolution of annual low flows (Q10) and high flows (Q99) from 2023 to 2100 under three climate pathways (MPI245, MPI370, MPI585). From 2023 to 2059, simulations assume fixed land cover conditions (2023 baseline). After 2060, three alternative land cover trajectories—optimistic, trend-based, and pessimistic—are combined with each climate scenario. The Q10 series reflects baseflow conditions and remains relatively stable across scenarios, though variability increases after 2060, with differences linked to both climate forcing intensity and land cover changes. In contrast, the Q99 series, which represents flood peaks and surface runoff extremes, shows a marked increasing tendency under MPI370 and MPI585, indicating that climate change will disproportionately amplify high-flow events. These results suggest that while drought conditions may remain comparatively stable, the risk of flood extremes is likely to intensify under stronger climate forcing and adverse land cover trajectories.
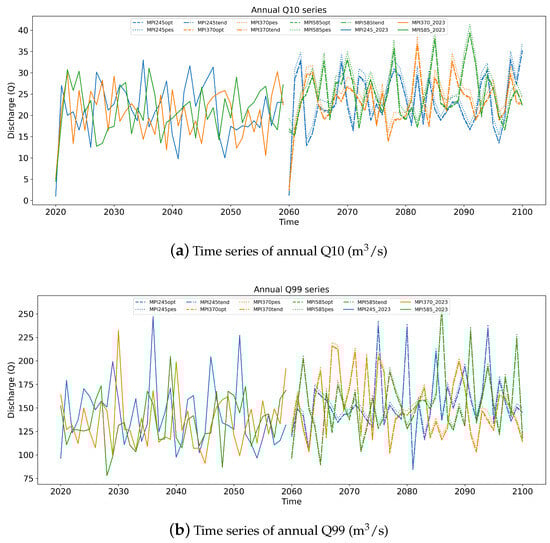
Figure 8.
Annual Q10 and Q99 discharge quantiles for MPI245, MPI370, and MPI585. Fixed 2023 land cover (2023–2059) and three land cover trajectories (2060–2100).
5.4. Results of Discharge for the 2023–2060 Period Adopting the Land Cover Map of 2023 Year as Baseline
5.4.1. Comparisons of Discharge for MPI245, MPI370 S and MPI585 Climate Change Scenarios
Scatter plots in Figure A2 compare simulated discharges between pairs of climate scenarios. Points aligning along the 1:1 line indicate similar performance between scenarios. Deviations highlight differences in hydrological response. Comparisons show that MPI245 and MPI370 are more closely aligned, whereas MPI585 consistently produces higher peak flows, confirming its more extreme nature. This analysis helps identify thresholds at which management strategies may need to diverge depending on the severity of climate forcing.
5.4.2. Comparisons of Time Series of Discharge from Low and High Quantiles
Figure A1 compares the temporal evolution of low quantiles (Q05, Q30) and high quantiles (Q90, Q95). Low quantiles reveal the stability of dry-season flows and are indicative of groundwater recharge and ecosystem resilience. High quantiles capture flood-generating conditions and rapid surface runoff. The divergence between low and high quantiles over time illustrates the increasing hydrological variability projected under climate change, with high quantiles showing sharper increases, especially under MPI585.
Figure 9 and Table 5 summarize mean and variance for key discharge metrics under the baseline land cover (2023) for the period 2023–2060. Higher variance in Q90 and Q95 under MPI585 indicates increased flood frequency and magnitude. Lower variance in Q05 and Q30 suggests relatively stable dry-season flows, although a slight downward trend is observed under pessimistic climate pathways. These patterns confirm that climate change primarily amplifies extreme events rather than uniformly altering all flow regimes.
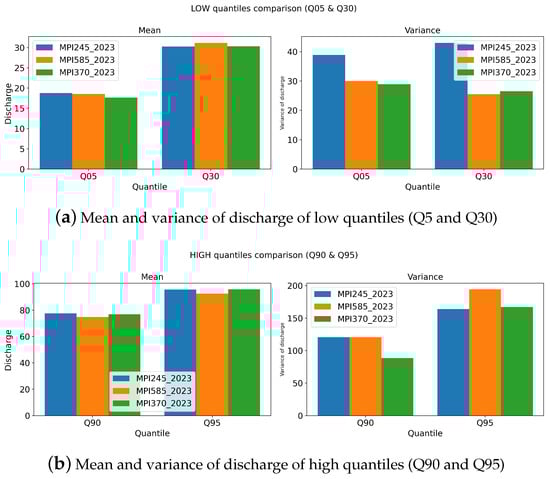
Figure 9.
Comparisons of mean and variance of river discharge for low (Q5, Q30) and high (Q90, Q95) quantiles during the 2023–2060 period.
Table 5.
Statistical summary of mean and variance for different metrics and scenarios.
5.5. Results of Discharge for the 2060–2100 Period Adopting Optimistic, Trend, and Pessimistic Land Cover Maps for 2060 Year as Baselines
Seeking a better contrast of the results, only MPI245 and MPI585 climate change scenarios are to be considered to show in this part of the text (results considering MPI370 were also reached).
5.5.1. Time Series of Discharge for MPI245 and MPI585 Climate Change Scenarios
Figure 10, Figure 11 and Figure 12 integrate both future land cover projections and climate scenarios to examine the compounded effects on streamflow dynamics: Figure 10 shows time series under MPI245 and MPI585, demonstrating that even moderate land cover changes significantly affect hydrological outputs.
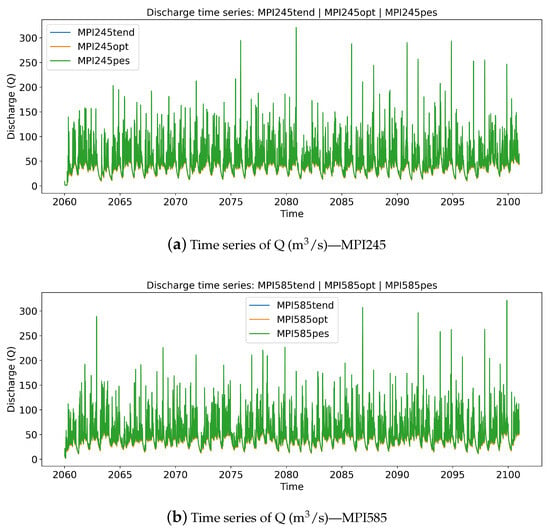
Figure 10.
Time series of river discharge Q (m3/s) under MPI245 and MPI585 climate change scenarios.
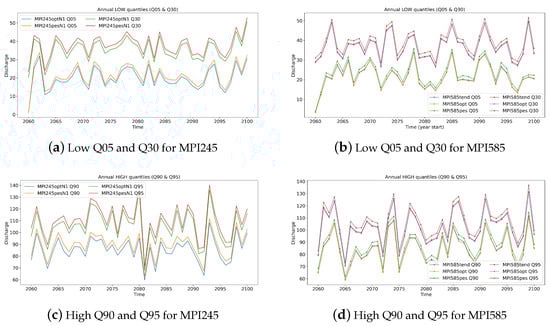
Figure 11.
Comparisons of low (Q05, Q30) and high (Q90, Q95) annual discharge quantiles for MPI245 and MPI585 scenarios during the 2060–2100 period. Q in m3/s.
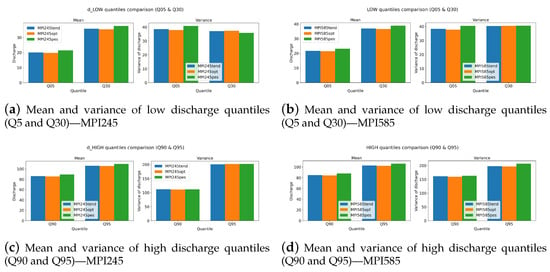
Figure 12.
Comparisons of mean and variance of discharge for low and high quantiles under MPI245 and MPI585 scenarios during the 2060–2100 period.
5.5.2. Comparisons of Discharge for MPI245 and MPI585 Climate Change Scenarios
Figure A3 presents scatter plots comparing simulated discharges for the optimistic, trend, and pessimistic land-cover trajectories under the MPI-ESM1-2-HR climate scenarios SSP2-4.5 (MPI245) and SSP5-8.5 (MPI585). Results indicate that variations in land-cover configuration produce hydrological effects of similar magnitude to those driven by the different climate forcings, underscoring the strong interaction between land-use and climate in shaping basin-scale flow regimes.
5.5.3. Annual Discharge for Low (Q5 and Q30) and for High (Q90 and Q95) Quantiles Time Series for MPI245 and MPI585 Climate Change Scenarios
Figure 11 emphasizes that under pessimistic land cover, both low and high quantiles deteriorate sharply: low flows decline due to reduced infiltration and groundwater recharge, while high flows surge because of impervious surface expansion.
5.5.4. Comparisons of Mean and Variance of Discharge from Low and High Quantiles
Figure 12 and Table A3 and Table A4 quantify these impacts through mean and variance statistics, showing that under pessimistic land cover combined with MPI585, variance of high-flow quantiles nearly doubles relative to optimistic scenarios. These findings underscore the interplay between land cover management and climate mitigation. They demonstrate that even under severe climate change, strategic land-use planning can partially offset hydrological degradation.
6. Discussion
A comprehensive overview of the proposed methodology and the corresponding results is presented in Figure 3. This figure illustrates a conceptual diagram that encapsulates the fundamental components of the methodological framework, highlighting their interconnections and emphasizing the significance of the principal outcomes derived from the proposed approach.
6.1. Interpretation of Hydrological Impacts
The results of this study reveal a strong sensitivity of the Río Negro basin to both land cover changes and climate variability. Under the baseline scenario (2023), the hydrological regime is characterized by a bimodal flow pattern consistent with the region’s rainfall seasonality. However, projections to 2060 and 2100 indicate substantial modifications to streamflow dynamics, particularly under the combined influence of increased impervious surfaces and intensified precipitation extremes. The increase in the Q90 and Q95 quantiles under higher forcing scenarios (MPI585) suggests a marked amplification of peak flows, which is indicative of elevated flood risks. This trend aligns with studies in other tropical mountainous basins where deforestation and urbanization have been linked to reductions in infiltration and storage, coupled with accelerated runoff generation (e.g., [49]).
Conversely, the optimistic land cover scenario, emphasizing forest conservation and controlled urban growth, demonstrates the capacity of natural ecosystems to buffer hydrological extremes. In this scenario, both low flows (Q10) and high flows (Q99) remain closer to historical conditions, highlighting the role of vegetation in enhancing infiltration and groundwater recharge. These findings underscore the pivotal role of land management in shaping basin hydrology and emphasize the potential of targeted conservation strategies to mitigate adverse hydrological impacts under climate change.
As a useful index that can be interpreted from this study, the Q90/Q10 ratio represents the relationship between high-flow and low-flow discharge quantiles, commonly used as an indicator of hydrological variability and flow regime stability. Q10 corresponds to the discharge exceeded 10% of the time (high-flow condition), whereas Q90 corresponds to the discharge exceeded 90% of the time (low-flow condition). Thus, a higher Q90/Q10 ratio indicates a more stable hydrological regime with reduced flow variability, whereas a lower ratio reflects stronger contrasts between peak discharges and baseflows, typically associated with deforestation, urban expansion, or increased rainfall intensity.
The temporal analysis reveals that while low flows exhibit relatively minor changes across scenarios, high flows are far more sensitive to both land cover and precipitation forcing. This asymmetry suggests that future hydrological risks will be driven primarily by flood-related processes rather than droughts, although reductions in baseflow under pessimistic land-use pathways could still threaten water security during dry seasons. Such dual challenges of increased flood peaks and declining low flows require integrated management approaches that simultaneously address extremes on both ends of the hydrological spectrum.
The scenarios developed in this study are methodologically aligned with established modeling frameworks applied across tropical regions of South America, where projections based on the Land Change Modeler (LCM) and artificial intelligence have demonstrated predictive robustness through the integration of multilayer artificial neural networks (ANN-MLP) to generate transition-potential surfaces, Markov chains to quantify temporal change demands, and cellular-automata algorithms (CA-Markov) for stochastic spatial allocation. These approaches have produced land-cover change trajectories with spatial validation scores exceeding 0.90 [50,51]. The parameterization of regulatory constraints, however, exhibits significant regional divergences: in the Colombian Amazon, post-conflict modeling frameworks explicitly incorporate spatial masks for protected areas (SINAP) and Indigenous territories as hard constraints in the allocation of transitions, whereas in Andean catchments of Ecuador, land-cover changes respond predominantly to socioeconomic and topographic gradients under fragmented or absent environmental regulatory frameworks, generating degradation trajectories with explanatory power of 21–42% in generalized additive models (GAMs) that integrate elevational variables [52,53]. This convergent ANN + Markov + CA methodological architecture, complemented by transition analyses stratified by altitudinal gradients in páramo and montane forest ecosystems, reinforces the validity of the probabilistic neural network (PNN) approach with competitive allocation implemented in the present study, particularly the innovation of absolute urban-area targets (13–45 km2) as explicit spatial constraints that enhance territorial hydrological coherence and applicability for integrated basin–city planning. This approach surpasses limitations of traditional models that rely exclusively on historical transition probabilities without incorporating regulatory land-use planning objectives [54,55].
6.2. Role of Land Cover Versus Role of Precipitation
The comparative analysis between climate and land cover scenarios highlights that both drivers exert comparable magnitudes of influence on streamflow dynamics. Figure 9 and Figure 10 demonstrate that under certain conditions, land cover changes alone can produce hydrological effects similar to those induced by shifts in climate forcing between MPI245 and MPI585. This finding confirms the hypothesis that local anthropogenic transformations, particularly urban expansion, can significantly modulate basin hydrology independent of global climate signals.
However, the interplay between land cover and precipitation is not simply additive. Under the most extreme scenario—pessimistic land cover combined with MPI585 climate forcing—the variance of high-flow quantiles nearly doubles compared with the optimistic scenario (Figure 12). This suggests a combined effect in which the growth of impervious surfaces enhances the consequences of stronger rainfall events, resulting in a disproportionately higher rise in flood hazards. Comparable patterns have been observed in other Andean catchments, where intensified land-use exacerbates climate-related hydrological variability.
Interestingly, the results suggest that climate change primarily drives temporal variability, altering the timing and intensity of rainfall events, while land cover change governs spatial patterns of runoff generation. Forested areas exhibit delayed and attenuated responses, whereas urbanized zones produce rapid, concentrated flows. This spatial differentiation is crucial for understanding where interventions may yield the greatest benefits. Evidence shows that maintaining forest cover in headwater regions is effective in regulating downstream hydrology, even under high climate forcing scenarios.
In large Andean basins connected to the Amazon, including those in Ecuador, Peru, and Bolivia, the dynamics of atmospheric humidity—encompassing both moisture transport and recycling—play a central role in shaping precipitation and streamflow regimes. Isotopic analyses in Ecuador have shown that rainfall composition is strongly influenced by cross-equatorial moisture transport and the intensity of Amazonian recycling, evidencing the tight coupling between the Andes and the lowland hydrological system [56,57]. Recent climate projections further indicate a reduction in recycled precipitation over northern and southern Amazonian subregions, suggesting that changes in atmospheric moisture transport may intensify drought events and decrease additional recharge to adjacent Andean catchments [37]. Moreover, land-use and land-cover change, particularly deforestation and agricultural expansion, have been consistently associated with reduced baseflow and altered runoff dynamics in tropical Andean basins [5]. Collectively, these findings underscore the need to integrate land-management and climate-projection frameworks to better anticipate hydrological responses and safeguard water security across Andean regions influenced by Amazonian moisture dynamics.
6.3. Methodological Limitations and Uncertainties
While the integrated methodology developed here represents a significant advance, several limitations must be acknowledged. Uncertainties in climate model outputs are inherent to global circulation models, particularly in regions with complex topography such as the Andes. Although the MPI-ESM1-2-HR model was selected for its superior performance in tropical South America, its precipitation simulations required bias correction through Empirical Quantile Mapping. This step reduces systematic errors but cannot fully eliminate structural uncertainties related to climate projections.
Land cover change projections depend on assumptions regarding socioeconomic trajectories and policy interventions. The absolute targets set for urban expansion in 2060 ( optimistic; pessimistic) represent plausible extremes but may not capture all possible futures. Additionally, the classification of historical imagery, while validated with field data, is subject to errors related to cloud cover, sensor differences, and mixed pixels in transitional landscapes.
The hydrological modeling itself introduces uncertainties. While TETIS has demonstrated strong performance in diverse settings, parameter calibration was constrained by the availability and quality of hydrometeorological data from IDEAM. Sparse gauge networks and potential errors in streamflow measurements may influence calibration outcomes. Furthermore, the semi-distributed nature of TETIS, while computationally efficient, involves simplifications of certain processes, such as preferential flow paths and groundwater-surface water interactions.
Another limitation of the proposed methodology is its limited capacity to capture short-term (intra-annual) seasonal variations in land cover. The classification framework was primarily designed to distinguish between hard (impervious) and green (vegetated) surfaces, emphasizing long-term structural transitions rather than transient seasonal dynamics. To ensure consistency and reduce noise, the different vegetation types were aggregated into broader categories representing dominant states across years. Consequently, the model performs well in detecting interannual or long-term land cover changes but may overlook finer seasonal fluctuations. This simplification was adopted to maintain computational feasibility and focus on long-term hydrological implications, yet it should be considered when interpreting the temporal sensitivity of the results.
Potential uncertainties in this study may also arise from data processing, model inputs, and methodological adaptations. The supervised classification conducted in Eastern Antioquia could be affected by spectral confusion between roof materials and bare soils (both of similar color due to the type of material), compounded by topographic effects and illumination variability, which may reduce class separability and increase thematic error. Such misclassifications could propagate to the hydrological parameterization stage, influencing the spatial distribution of surface parameters in TETIS. Additional uncertainty may stem from the MPI-ESM climate projections, whose structural assumptions, emission scenarios, and downscaling procedures may not adequately capture local hydroclimatic gradients or temporal rainfall variability across complex terrain such as the Colombian Andes, where the study region is located.
Uncertainty in the TETIS model may further result from parameter calibration, spatial heterogeneity of input data, and the equifinality problem, where multiple parameter sets yield similar hydrological responses, limiting parameter identifiability. The adaptation of the land-use and land cover (LULC) changes methodology from Clark University to local conditions—through modified analysis periods, change thresholds, and the integration of classification-derived variables—may also introduce methodological subjectivity and potential bias in land-cover transition detection. Collectively, these factors could influence the robustness of model outputs and should be considered when interpreting hydrological and land-cover change projections under future climate scenarios.
Finally, the interaction between land cover and climate drivers presents a challenge for attribution. While this study provides a comparative framework, fully disentangling the relative contributions of each driver requires additional experiments, such as controlled simulations with isolated variables or the incorporation of socio-economic modeling. Future research should also explore the integration of remote sensing-based soil moisture data and advanced data assimilation techniques to further constrain uncertainties.
7. Conclusions
- This study demonstrated that land cover changes have a profound influence on the hydrological dynamics of the Río Negro basin. Urban expansion and deforestation were found to increase surface runoff and flood peaks, while reducing groundwater recharge and baseflows. These results highlight the urgent need to incorporate land cover management into hydrological planning, especially in rapidly urbanizing Andean basins.
- The use of the TETIS distributed hydrological model allowed for a robust simulation of surface and subsurface processes under varying land cover configurations. By calibrating and validating the model with IDEAM’s hydrometeorological records, we achieved a reliable representation of the basin’s hydrological behavior, even under data-scarce conditions.
- Climate change projections, generated through downscaled simulations of the MPI-ESM model for three emission pathways (SSP2-4.5, SSP3-7.0, and SSP5-8.5), revealed that extreme flow events, particularly high-flow quantiles, are expected to intensify significantly by the end of the century. These changes are particularly pronounced under SSP5-8.5, where the frequency and magnitude of floods nearly doubled compared to moderate scenarios.
- The combined analysis of land cover and climate scenarios showed that land cover changes can exert hydrological impacts comparable in magnitude to those of climate forcing. For instance, under a pessimistic land cover scenario, the expansion of impervious surfaces caused similar increases in peak flows as those observed under the most severe climate change scenario, underscoring the dual drivers of hydrological risk.
- The results highlight the crucial role of forested headwater regions in modulating these effects, as maintaining forest cover proved effective in attenuating peak discharges and regulating downstream hydrology even under strong climate forcing. This emphasizes that targeted land management in upper catchments can substantially mitigate climate-induced hydrological extremes.
- Conversely, the optimistic scenario, characterized by increased forest cover and strict control of urban expansion, demonstrated a strong capacity to mitigate adverse hydrological impacts across the basin. This scenario maintained baseflows, reduced peak flows, and stabilized overall water availability, illustrating the potential of conservation-oriented policies to offset climate-driven degradation.
- The findings of this study clearly demonstrate that land management can exert a hydrological influence comparable to that of climate change. Uncontrolled urban expansion and forest loss have immediate and measurable impacts on streamflow regulation, amplifying flood peaks and diminishing groundwater recharge. For policymakers and water managers, the message is unequivocal: preserving and restoring natural vegetation is not merely an ecological goal but a strategic action for water security. Integrating land-use and climate-change scenarios into territorial planning and infrastructure development is essential to anticipate future crises and sustain water availability across Andean catchments.
- Finally, the products generated in this study—including high-resolution land cover maps, downscaled precipitation series, and hydrological projections—constitute essential tools for regional and national decision-makers. These outputs support environmental authorities such as CORNARE, municipal governments, the Governor’s Office of Antioquia, and national entities like the Unidad Nacional de Gestión del Riesgo de Desastres and IDEAM in designing evidence-based policies for sustainable water management, disaster risk reduction, and climate adaptation.
Author Contributions
Conceptualization, J.C.P. and B.A.B.; methodology, J.C.P., B.A.B., J.M.B., and C.A.O.-S.; data curation, J.C.P., B.A.B., J.M.B., and C.A.O.-S.; software, J.C.P., B.A.B., J.M.B., and C.A.O.-S.; validation, J.C.P. and B.A.B.; formal analysis, J.C.P. and B.A.B.; investigation, J.C.P. and B.A.B.; funding management, J.V.-Q.; writing—review and editing, R.D.V.-S., J.V.-Q., C.A.O.-S., S.M., J.P.D.-P., L.D., O.E.C., and A.F.G. All authors have read and agreed to the published version of the manuscript.
Funding
This research was funded by the project entitled “Detection of changes in surface water bodies through the fusion of optical and Synthetic Aperture Radar (SAR) satellite images using artificial intelligence techniques for environmental sustainability and watershed management in the Oriente Antioqueño region.” The project was financed by the Alianza Oriente Sostenible (AOS, for its acronym in Spanish), under the contract 1000-07-019-2020-PS0036-2024, with resources provided by the European Union.
Data Availability Statement
The availability of the data used and generated in this study is subject to the terms of reference established by the Alianza Oriente Sostenible (AOS) and the permissions granted by the funding entity, the European Union. Data sharing is therefore restricted and can only be provided upon explicit authorization from AOS and the European Union, in compliance with the confidentiality and data management agreements associated with the funding program.
Acknowledgments
The authors would like to express their gratitude to the European Union for providing the financial support that made this research possible through the Alianza Oriente Sostenible (AOS). Special thanks are also extended to the Politécnico Colombiano Jaime Isaza Cadavid for its institutional support and commitment to the development of this project.
Conflicts of Interest
The authors declare no conflicts of interest.
Abbreviations
The following abbreviations are used in this manuscript:
| ALOS | Advanced Land Observing Satellite |
| AOS | Alianza Oriente Sostenible |
| CMIP6 | Coupled Model Intercomparison Project Phase 6 |
| COR | CORNARE (Regional Autonomous Corporation of the Negro and |
| Nare River Basins) | |
| DEM | Digital Elevation Model |
| NDVI | Normalized Difference Vegetation Index |
| ENSO | El Niño South Oscillation |
| EQM | Empirical Quantile Mapping |
| GIS | Geographic Information System |
| HR | High Resolution |
| IDEAM | Instituto de Hidrología, Meteorología y Estudios Ambientales |
| LC | Land Cover |
| MPI-ESM1-2-HR | Max Planck Institute Earth System Model, version 1.2, High Resolution |
| PDO | Pacific Decadal Oscillation |
| SAR | Synthetic Aperture Radar |
| SSP | Shared Socioeconomic Pathway |
| TETIS | TÉcnicas para la simulación de la Transformación de la |
| Interacción Suelo-atmósfera | |
| UNGRD | Unidad Nacional para la Gestión del Riesgo de Desastres |
Appendix A. Methodological Details
This appendix compiles additional equations, figures and tables, supporting the quantitative analyses presented in Section 4.
Appendix A.1. Land-Cover Modeling
Equations used for classification and fusion processes:
Appendix A.2. Climate Projections and Downscaling
Empirical Quantile Mapping (EQM) bias correction was applied as follows:
ensuring corrected precipitation preserved observed statistical properties.
This formulation follows the empirical quantile mapping procedures described by [38,39,40,41], where modeled precipitation quantiles are matched to the observed distribution on a daily basis. Such bias-correction approaches have demonstrated reliable performance in tropical and Andean regions, improving the representation of both mean rainfall and extreme events relevant for hydrological applications.
Appendix A.3. Hydrological Modeling with TETIS
The available soil-water content was defined as follows:
where is root depth, and and are field-capacity and wilting-point soil moisture, respectively.
Evapotranspiration at the cell level was scaled by the vegetation factor , which modulates potential to actual evapotranspiration.
Calibration involved nine correction factors (FC1–FC9) optimizing runoff production and transfer. Model skill metrics included NSE, RMSE, and volumetric error.
Table A1.
Correction factors applied in the TETIS model calibration.
Table A1.
Correction factors applied in the TETIS model calibration.
| Factor | Process | Calibrated Value |
|---|---|---|
| FC1 | Static storage (HU control) | 0.70 |
| FC2 | Evapotranspiration | 0.00165 |
| FC3 | Infiltration | 0.76918 |
| FC4 | Direct runoff | 1.18508 |
| FC5 | Percolation | 1.99993 |
| FC6 | Interflow | 17.62543 |
| FC7 | Deep groundwater flow | 5.45 |
| FC8 | Base flow | 43,746.75 |
| FC9 | River velocity | 0.18163 |
Table A2.
Summary of simulation combinations for climate and land-cover scenarios.
Table A2.
Summary of simulation combinations for climate and land-cover scenarios.
| Climate Scenario | Land-Cover Scenario | Vegetation Index Map | Hu Map | Simulation Period |
|---|---|---|---|---|
| SSP2-4.5 | 2023 Current | 2023 | 2023 | 2020–2059 |
| 2060 Optimistic | 2060 Opt. | 2060 Opt. | 2060–2100 | |
| 2060 Trend | 2060 Trend | 2060 Trend | ||
| 2060 Pessimistic | 2060 Pess. | 2060 Pess. | ||
| SSP3-7.0 | 2023 Current | 2023 | 2023 | 2020–2059 |
| 2060 Optimistic | 2060 Opt. | 2060 Opt. | 2060–2100 | |
| 2060 Trend | 2060 Trend | 2060 Trend | ||
| 2060 Pessimistic | 2060 Pess. | 2060 Pess. | ||
| SSP5-8.5 | 2023 Current | 2023 | 2023 | 2020–2059 |
| 2060 Optimistic | 2060 Opt. | 2060 Opt. | 2060–2100 | |
| 2060 Trend | 2060 Trend | 2060 Trend | ||
| 2060 Pessimistic | 2060 Pess. | 2060 Pess. |
Appendix B. Supplementary Results
This appendix compiles additional figures supporting the quantitative analyses presented in Section 5. It provides detailed visual comparisons of simulated discharges under alternative land-cover and climate scenarios, highlighting the combined influence of anthropogenic change and climatic forcing on basin-scale hydrological dynamics.

Figure A1.
Comparisons of low (Q05, Q30) and high (Q90, Q95) annual discharge quantiles during the 2020–2060 period. Q in m3/s.
Comparisons of Discharge for MPI245 and MPI585 Climate Change Scenarios

Figure A2.
Scatter plots comparing Q(MPI245), Q(MPI370), and Q(MPI585) for the period 2023–2059. Q in m3/s.
Table A3.
Statistical summary of mean and variance for MPI245 scenarios.
Table A3.
Statistical summary of mean and variance for MPI245 scenarios.
| Section | Metric Target | Mean | Variance |
|---|---|---|---|
| Flows | MPI245tend | 50.9 | 862.9 |
| Flows | MPI245opt | 50.5 | 856.5 |
| Flows | MPI245pes | 53.1 | 894.9 |
| Q05 | MPI245tend | 20.1 | 38.5 |
| Q05 | MPI245opt | 19.8 | 37.9 |
| Q05 | MPI245pes | 21.5 | 40.8 |
| Q30 | MPI245tend | 35.9 | 37.1 |
| Q30 | MPI245opt | 35.5 | 37.3 |
| Q30 | MPI245pes | 37.7 | 35.8 |
| Q90 | MPI245tend | 86.1 | 112.2 |
| Q90 | MPI245opt | 85.4 | 111.5 |
| Q90 | MPI245pes | 89.2 | 111.8 |
| Q95 | MPI245tend | 106.3 | 201.1 |
| Q95 | MPI245opt | 105.6 | 202.2 |
| Q95 | MPI245pes | 109.7 | 202.4 |
Table A4.
Statistical summary of mean and variance for MPI585 scenarios.
Table A4.
Statistical summary of mean and variance for MPI585 scenarios.
| Section | Metric Target | Mean | Variance |
|---|---|---|---|
| Flows | MPI585tend | 51.6 | 820.2 |
| Flows | MPI585opt | 51.1 | 814.5 |
| Flows | MPI585pes | 53.8 | 850.2 |
| Q05 | MPI585tend | 21.6 | 38.3 |
| Q05 | MPI585opt | 21.4 | 37.7 |
| Q05 | MPI585pes | 23.1 | 40.4 |
| Q30 | MPI585tend | 36.9 | 40.3 |
| Q30 | MPI585opt | 36.6 | 40.5 |
| Q30 | MPI585pes | 38.9 | 40.6 |
| Q90 | MPI585tend | 84.9 | 161.1 |
| Q90 | MPI585opt | 84.3 | 159.6 |
| Q90 | MPI585pes | 88.1 | 163.3 |
| Q95 | MPI585tend | 102.8 | 198.2 |
| Q95 | MPI585opt | 102.1 | 197.1 |
| Q95 | MPI585pes | 106.2 | 206.9 |

Figure A3.
Scatter plots comparing simulated discharges (Q, m3/s) under the MPI245 and MPI585 climate scenarios for the optimistic, trend, and pessimistic land-cover configurations.
Appendix C. Review of Some Regional Hydrological Studies
Understanding rainfall dynamics and streamflow variability in the tropical Andes of Colombia is essential for effective water resource management, hazard mitigation, and climate adaptation. In recent years, attention has increasingly focused on analyzing the region’s complex hydro-climatic patterns, the influence of large-scale climate drivers such as ENSO, and the mechanisms behind extreme hydrometeorological events. These efforts have delivered critical insights into the spatial and temporal variability of precipitation, flood risk, and the interconnected behaviour of hydrological variables across Andean basins. Addressing the estimation of river flows across Colombia’s drainage network, ref. [58] employed long-term water balance analyses coupled with statistical scaling techniques. They developed a comprehensive methodology to estimate average river discharges, as well as peak and low flows of different return periods, across diverse hydrological regimes. Another important work is [59], who analyzed moisture sources during the anomalously wet 2010–2012 season in northern South America, identifying atmospheric-moisture transport mechanisms that contributed to excessive rainfall. Recent studies continue to provide valuable insights into Colombian hydroclimatology and watershed behavior. For instance, ref. [60] examined streamflow variability and trend behaviour in the Meta River basin, finding significant downward trends in upstream stations and increasing trends downstream, which have implications for water resource planning and infrastructure management. Similarly, ref. [61] investigated the influence of large-scale climate phenomena (e.g., ENSO, PDO) on streamflows in the Atrato and Patía River Basins in the Colombian Pacific, using wavelet coherence and correlation analyses to reveal multiscale relationships between climate indices and streamflow anomalies. On a different scale, ref. [62] studied small coastal rivers of the Sierra Nevada de Santa Marta, showing that low-frequency oceanic–atmospheric oscillations significantly contribute to streamflow variability, especially in the 8–12 year band, indicating quasi-decadal controls on hydrology in these rivers. Complementarily, ref. [63] explored the water–energy nexus under ENSO variability in four Colombian basins, assessing how ENSO phases impact hydropower generation, inflows, and operational challenges in reservoir systems, which is particularly relevant for planning under climate variability. In terms of hydrological modeling, ref. [64] presented streamflow simulations in multiple Andean watersheds using the SAC-SMA model, demonstrating how model performance varies with watershed physical characteristics and climate patterns. These findings highlight the need to tailor modeling approaches to specific regional characteristics for improved water resources management. Together, these studies provide strong evidence that understanding and incorporating hydroclimatic variability, large-scale climate drivers, and trend detection are essential for hydrological stability, water security, and effective watershed management in the Andean region of Colombia, where rapid environmental change and limited data pose significant challenges.
Appendix D. A Broader Discussion on the Implications of This Study for Land-Use Planning and Risk Management
The methodology developed in this paper represents a significant advancement over traditional approaches such as the Land Change Modeler (LCM). While LCM relies primarily on Markov transition matrices and static suitability maps derived from historical trends, our approach integrates advanced artificial intelligence techniques, including Random Forest classification, probabilistic neural networks for future projections, and competitive optimization algorithms to ensure compliance with absolute land cover targets. Furthermore, by incorporating multi-sensor data fusion (optical and SAR imagery), our framework addresses challenges such as persistent cloud cover and spatial heterogeneity that commonly limit LCM applications. These enhancements result in more realistic and adaptable land cover projections, allowing for the inclusion of future socio-economic factors and climate change scenarios, thereby providing more reliable inputs for hydrological modeling and regional land-use planning.
The insights gained from this study have direct implications for watershed management and policy development in the Río Negro basin. The stark contrasts among the three land cover scenarios underscore the importance of proactive land-use planning. In the pessimistic scenario, urban areas expand to 34.6% of the basin by 2060, accompanied by a severe reduction of forests to just 3.6% (Table 3). Such unregulated growth would drastically increase the frequency and magnitude of flood events, overwhelming existing infrastructure and posing significant threats to human lives and property.
Conversely, the optimistic scenario illustrates that strategic conservation measures and urban growth controls can stabilize hydrological dynamics, even under moderate climate change. These findings support the implementation of policies that prioritize forest conservation, reforestation of degraded areas, and green infrastructure within urban zones. Incentivizing sustainable agricultural practices in transitional landscapes could further enhance basin resilience by reducing surface runoff and promoting soil moisture retention.
From a risk management perspective, the integration of land cover projections with climate scenarios provides a powerful tool for scenario planning. By simulating future hydrological responses under various combinations of drivers, stakeholders can identify critical thresholds where current practices may become unsustainable. For example, maintaining impervious surfaces below a certain percentage of the basin could be established as a planning target to prevent catastrophic flood regimes. Furthermore, the outputs of this study—such as downscaled precipitation datasets and high-resolution land cover maps—offer valuable inputs for early warning systems, floodplain zoning, and infrastructure design.
Appendix E. Future Depelopments
The findings of this study have highlighted the significant interplay between land cover changes, climate variability, and hydrological responses in the Río Negro basin. While the current modeling framework provides valuable insights, there are several opportunities for enhancing the accuracy, spatial resolution, and predictive capabilities of the approach. Future developments will focus on improving three key components of the modeling chain: land cover change modeling, downscaling of climate data, and hydrological simulation. Each of these elements will be strengthened to reduce uncertainties and better support decision-making at local, regional, and national levels.
Appendix E.1. Enhancements in Land Cover Change Modeling
Future efforts in land cover change modeling will aim to integrate more advanced remote sensing techniques, machine learning algorithms, and socio-economic drivers to better predict spatially explicit land cover transitions. The current approach relies on historical land cover maps and Markov-based projections, which, while effective, are limited in their ability to incorporate dynamic human activities and policy interventions.
Upcoming developments will focus on:
- High-resolution satellite imagery: Incorporating data from platforms such as Sentinel-1 and Sentinel-2, as well as commercial constellations, will allow for finer detection of small-scale land cover changes, particularly in peri-urban and rural areas where fragmentation processes are most active.
- Integration of socio-economic variables: Future models will explicitly include population growth, infrastructure development plans, and economic activities (e.g., agriculture, mining, and industry) to capture the anthropogenic drivers of change. These variables will be incorporated through spatially explicit datasets and linked to policy scenarios.
- Machine learning approaches: The implementation of advanced algorithms such as Random Forest, Gradient Boosting Machines, and deep learning architectures will improve classification accuracy and predictive capacity, reducing reliance on static transition probabilities.
- Dynamic scenario exploration: Instead of fixed optimistic, trend, and pessimistic pathways, future models will allow for continuous adjustment based on real-time monitoring data and adaptive management strategies implemented by environmental authorities like CORNARE.
These improvements will enable the generation of more realistic land cover scenarios for 2060 and beyond, reducing uncertainty in the spatial allocation of future urban expansion, deforestation, and reforestation activities.
Appendix E.2. Advances in Climate Data Downscaling
The downscaling of climate model outputs is a critical step for ensuring that regional hydrological models receive accurate precipitation and temperature inputs. The current study used Empirical Quantile Mapping (EQM) to correct biases and match the spatial scale of the Río Negro basin. While effective, this statistical approach has inherent limitations in capturing local convective processes and non-stationary climate dynamics.
Future work will focus on:
- Hybrid downscaling techniques: Combining statistical methods such as EQM with dynamical downscaling using Regional Climate Models (RCMs). This hybrid approach will leverage the strengths of both methods, improving the physical realism of precipitation patterns while retaining computational efficiency.
- Enhanced representation of extreme events: New techniques will be implemented to better simulate extremes such as intense rainfall, droughts, and dry spells. This includes the use of Generalized Extreme Value (GEV) theory for bias correction of tail distributions.
- Integration of high-resolution observational data: Expanded collaboration with IDEAM will facilitate the assimilation of additional rain gauge and radar data, improving the calibration and validation of downscaling procedures.
- Multi-model ensembles: Future projections will incorporate ensembles from multiple CMIP6 climate models (beyond MPI-ESM1-2-HR) to represent a broader range of climate uncertainties and provide probabilistic hydrological forecasts.
These advancements will produce more accurate, basin-scale precipitation datasets that reflect the complex topography and climatic variability of the Andean region, enhancing the reliability of hydrological simulations under climate change scenarios.
Appendix E.3. Refinement of Hydrological Modeling
The hydrological modeling component, implemented using the TETIS distributed model, successfully captured the surface and subsurface processes of the Río Negro basin. However, there are several areas for improvement to increase the model’s accuracy and decision-making relevance.
Future enhancements will include:
- Improved process representation: The inclusion of modules to explicitly represent groundwater-surface water interactions, sediment transport, and water quality dynamics. This will transform TETIS into a more comprehensive tool for integrated watershed management.
- Multi-site calibration and validation: The current calibration was performed using discharge data at the basin outlet. Future work will incorporate data from additional sub-basin gauges, improving the spatial representation of hydrological processes and ensuring model robustness across diverse land cover and elevation zones.
- Coupling with land cover change models: Direct coupling of TETIS with dynamic land cover simulations will allow real-time adjustment of hydrological parameters based on projected changes in vegetation, impervious surfaces, and soil properties.
- Scenario-based risk analysis: The model will be expanded to simulate socio-economic impacts of extreme events, such as infrastructure damage and agricultural losses, integrating hydrological outputs with risk assessment frameworks used by entities such as the Unidad Nacional de Gestión del Riesgo de Desastres (UNGRD).
- Uncertainty quantification: Bayesian calibration techniques and Monte Carlo simulations will be introduced to quantify uncertainties in model structure, parameterization, and input data, providing confidence intervals for hydrological forecasts.
By incorporating these improvements, TETIS will evolve into a decision-support system capable of informing policy development, disaster risk reduction strategies, and climate adaptation planning.
In summary, future developments in land cover modeling, downscaling techniques, and hydrological simulation will significantly enhance our ability to understand and manage the interactions between climate, land-use, and water resources. These advancements will provide environmental authorities, municipal governments, and national agencies with cutting-edge tools for safeguarding the sustainability of the Río Negro basin and similar Andean watersheds.
References
- Soares-Filho, B.; Cerqueira, G.; Pennachin, C. DINAMICA—A stochastic cellular automata model designed to simulate the landscape dynamics in an Amazonian colonization frontier. Ecol. Model. 2002, 154, 217–235. [Google Scholar] [CrossRef]
- Eastman, J.R.; Toledano, J. A Short Presentation of the Land Change Modeler (LCM). In Lecture Notes in Geoinformation and Cartography; Springer: Berlin/Heidelberg, Germany, 2018; pp. 499–505. [Google Scholar] [CrossRef]
- Eastman, J.R. IDRISI Taiga Guide to GIS and Image Processing; Clark Labs, Clark University: Worcester, MA, USA, 2009; Available online: https://home.agh.edu.pl/~galia/dyda_2021_22/PhD_GIS_DS/TaigaManual.pdf (accessed on 20 October 2025).
- Romero, C.P.; García-Arias, A.; Dondeynaz, C.; Francés, F. Assessing Anthropogenic Dynamics in Megacities from the Characterization of Land Use/Land Cover Changes: The Bogotá Study Case. Sustainability 2020, 12, 3884. [Google Scholar] [CrossRef]
- Ochoa-Tocachi, B.F.; Buytaert, W.; De Bièvre, B.; Célleri, R.; Crespo, P.; Villacís, M.; Llerena, C.A.; Acosta, L.; Villazón, M.; Guallpa, M.; et al. Impacts of land use on the hydrological response of tropical Andean catchments. Hydrol. Processes 2016, 30, 3338–3355. [Google Scholar] [CrossRef]
- Eyring, V.; Bony, S.; Meehl, G.A.; Senior, C.A.; Stevens, B.; Stouffer, R.J.; Taylor, K.E. Overview of the CMIP6 experiment design and organization. Geosci. Model Dev. 2016, 9, 1937–1958. [Google Scholar] [CrossRef]
- Deutsches Klimarechenzentrum (DKRZ). SSP Scenarios (CMIP6)—Summary. 2024. Available online: https://www.dkrz.de/en/communication/climate-simulations/cmip6-en/the-ssp-scenarios (accessed on 10 September 2025).
- O’Neill, B.C.; Tebaldi, C.; van Vuuren, D.P.; Eyring, V.; Friedlingstein, P.; Hurtt, G.; Knutti, R.; Kriegler, E.; Lamarque, J.-F.; Lowe, J.; et al. The Scenario Model Intercomparison Project (ScenarioMIP) for CMIP6. Geosci. Model Dev. 2016, 9, 3461–3482. [Google Scholar] [CrossRef]
- Gutjahr, O.; Putrasahan, D.; Lohmann, K.; Jungclaus, J.H.; von Storch, J.S.; Brüggemann, N.; Haak, H.; Stössel, A. Max Planck Institute Earth System Model (MPI-ESM1.2) for HighResMIP. Geosci. Model Dev. 2019, 12, 3241–3281. [Google Scholar] [CrossRef]
- Mauritsen, T.; Bader, J.; Becker, T.; Behrens, J.; Bittner, M.; Brokopf, R.; Brovkin, V.; Claussen, M.; Crueger, T.; Esch, M.; et al. Developments in the MPI-M Earth System Model version 1.2 (MPI-ESM1.2) and its response to increasing CO2. J. Adv. Model. Earth Syst. 2019, 11, 998–1038. [Google Scholar] [CrossRef]
- Arias, P.A.; Ortega, G.; Villegas, L.D.; Martínez, J.A. La climatología colombiana en modelos CMIP5/CMIP6: Sesgos persistentes y mejoras. Rev. Fac. Ing. Univ. Antioq. 2021, 100, 75–96. [Google Scholar] [CrossRef]
- Martinez, J.A.; Junquas, C.; Bozkurt, D.; Viale, M.; Fita, L.; Trachte, K.; Campozano, L.; Arias, P.A.; Boisier, J.P.; Condom, T.; et al. Recent progress in atmospheric modeling over the Andes—Part I: Review of atmospheric processes. Front. Earth Sci. 2024, 12, 1427783. [Google Scholar] [CrossRef]
- Olonscheck, D.; Suarez-Gutierrez, L.; Milinski, S.; Beobide-Arsuaga, G.; Baehr, J.; Fröb, F.; Ilyina, T.; Kadow, C.; Krieger, D.; Li, H.; et al. The new Max Planck Institute Grand Ensemble with CMIP6 forcing (MPI-GE CMIP6). J. Adv. Model. Earth Syst. 2023, 15, e2023MS003790. [Google Scholar] [CrossRef]
- Poveda, G.; Álvarez, D.M.; Rueda, Ó.A. Hydro-climatic variability over the Andes of Colombia associated with ENSO: A review of climatic processes and their impact on one of the Earth’s most important biodiversity hotspots. Clim. Dyn. 2011, 36, 2233–2249. [Google Scholar] [CrossRef]
- Almazroui, M.; Ashfaq, M.; Islam, M.N.; Rashid, I.U.; Kamil, S.; Saeed, S. Assessment of CMIP6 performance and projected temperature and precipitation changes over South America. Earth Syst. Environ. 2021, 5, 1–24. [Google Scholar] [CrossRef]
- Vélez, J.; Puricelli, M.; López-Unzu, F.; Francés, F. Parameter extrapolation to ungauged basins with a hydrological distributed model in a regional framework. Hydrol. Earth Syst. Sci. 2009, 13, 229–246. [Google Scholar] [CrossRef]
- Francés, F.; Vélez, J.; Vélez, J. Split-parameter structure for the automatic calibration of distributed hydrological models. J. Hydrol. 2007, 332, 226–240. [Google Scholar] [CrossRef]
- Cardona-Mesa, A.A.; Vásquez-Salazar, R.D.; Parra, J.C.; Olmos-Severiche, C.; Travieso-González, C.M.; Gómez, L. A Methodology for the Multitemporal Analysis of Land Cover Changes and Urban Expansion Using Synthetic Aperture Radar (SAR) Imagery: A Case Study of the Aburrá Valley in Colombia. Remote Sens. 2025, 17, 554. [Google Scholar] [CrossRef]
- Vásquez-Salazar, R.D.; Cardona-Mesa, A.A.; Valdés-Quintero, J.; Olmos-Severiche, C.; Gómez, L.; Travieso-González, C.M.; Díaz-Paz, J.P.; Espinosa-Ovideo, J.E.; Diez-Rendón, L.; Garavito-González, A.F. Detection of Coastal Erosion and Progradation in the Colombian ‘Atrato River’ Delta by Using Sentinel-1 Synthetic Aperture Radar Data. Remote Sens. 2024, 16, 552. [Google Scholar] [CrossRef]
- Botero, B.A.; Parra, J.C.; Otálvaro, M. Effect of population dynamics and land use on the contribution of sediments to reservoirs for hydropower generation. WIT Trans. Ecol. Environ. 2019, 239, 35–46. [Google Scholar] [CrossRef]
- Salas, H.D.; Florian, C.; Builes-Jaramillo, A.; Valencia, J.; Mena, D.; Parra, J.C.; Valdés, J.C. Climate change and its effects on the streamflow of an Andean river basin characterized by volcanic activity. J. Water Clim. Change 2023, 14, 4598–4616. [Google Scholar] [CrossRef]
- Hoyos, H.; Botero, B.A. Vulnerability Assessment with Scarce Information for a Quantitative Flood Risk Model: Case Study Montería-Colombia. IOP Conf. Ser. Mater. Sci. Eng. 2019, 471, 1–10. [Google Scholar] [CrossRef]
- Vega, J.; Ortiz-Giraldo, L.; Botero, B.A.; Hidalgo, C.; Parra, J.C. Probabilistic Cascade Modeling for Enhanced Flood and Landslide Hazard Assessment: Integrating Multi-Model Approaches in the La Liboriana River Basin. Water 2024, 16, 2404. [Google Scholar] [CrossRef]
- Cornare. Plan de Ordenación y Manejo de la Cuenca Hidrográfica del Río Negro (POMCA). 2017. Available online: https://www.cornare.gov.co/planes-de-ordenacion-y-manejo-de-cuencas-hidrograficas-pomcas/pomca-rio-negro/ (accessed on 20 October 2025).
- de Antioquia, G. Plan de Desarrollo Departamental 2020–2023: Unidos por la Vida, Technical Report, Gobernación de Antioquia, Medellín, Colombia. 2020. Available online: https://plandesarrollo.antioquia.gov.co/archivo/PlanDesarrolloUNIDOS_VF-comprimido-min.pdf (accessed on 20 October 2025).
- IDEAM. Sistema de Información para la Gestión de Datos Hidrológicos y Meteorológicos. Technical Report, Instituto de Hidrología, Meteorología y Estudios Ambientales (IDEAM), Bogotá, Colombia. 2019. Available online: https://www.ideam.gov.co/dhime (accessed on 20 October 2025).
- IDEAM. Estadísticas Hidrometeorológicas de Colombia 2021. Technical Report, Instituto de Hidrología, Meteorología y Estudios Ambientales (IDEAM), Bogotá, Colombia. 2021. Available online: https://www.ideam.gov.co/transparencia/datos-abiertos/seccion-de-datos-abiertos (accessed on 20 October 2025).
- Aristizábal, E.; Sánchez, O. Spatial and temporal patterns and the socioeconomic impacts of landslides in the tropical and mountainous Colombian Andes. Disasters 2020, 44, 596–618. [Google Scholar] [CrossRef]
- Vega, J.A.; Barco, J.; Hidalgo, C. Space-time analysis of the relationship between landslides occurrence, rainfall variability and ENSO in the Tropical Andean Mountain region in Colombia. Landslides 2024, 21, 1293–1314. [Google Scholar] [CrossRef]
- Aristizábal, E.; Garcia, E.F.; Marin, R.J.; Gómez, F.; Guzmán-Martínez, J. Rainfall-intensity effect on landslide hazard assessment due to climate change in north-western Colombian Andes. Rev. Fac. Ing. (UdeA) 2022, 103, 51–66. [Google Scholar] [CrossRef]
- González-Calle, J.L. Metropolitan expansion and rural change in the peri-urban edge Medellín—Rionegro (Colombia). J. Urban Manag. 2024, 13, 285–298. [Google Scholar] [CrossRef]
- DANE. Patrones y Tendencias de Transición Urbana en Colombia. Technical Report, Departamento Administrativo Nacional de Estadística (DANE). 2021. Available online: https://www.dane.gov.co/files/investigaciones/poblacion/informes-estadisticas-sociodemograficas/2021-10-28-patrones-tendencias-de-transicion-urbana-en-colombia.pdf (accessed on 20 October 2025).
- Castrillón, S.A.; Gallón, L. Limits of urban growth in the municipality of Rionegro—Antioquia: An analysis of the ecological footprint. Cuad. Geogr. Rev. Colomb. Geogr. 2025, 34, 40–61. [Google Scholar] [CrossRef]
- CORNARE. Informe de Seguimiento Anual 2020 al PORH y a los Objetivos de Calidad Establecidos Mediante la Resolución N°112-5304 del 26 de Octubre de 2016. Technical Report, Corporación Autónoma Regional de las Cuencas de los Ríos Negro y Nare (CORNARE), Rionegro, Antioquia, Colombia. 2022. Available online: https://www.cornare.gov.co/PORH/Informe_Final_Implementacion_PORH_2020final_anexos.pdf (accessed on 20 October 2025).
- CORNARE; de Antioquia, G. Informe de Evaluación y Zonificación de Riesgos por Avenida Torrencial, Inundación y Movimiento en Masa y Dimensionamiento de Procesos Erosivos en el Municipio de Ríonegro. Technical Report, CORNARE and Gobernación de Antioquia, Rionegro, Antioquia, Colombia. 2011. Available online: https://www.cornare.gov.co/GestionRiesgo/RIONEGRO/Informe-Rionegro.pdf (accessed on 20 October 2025).
- CORNARE. Plan de Crecimiento Verde y Desarrollo Compatible con el Clima para el Oriente Antioqueño. Estudios Técnicos en Riesgos y Resiliencia Climática-Anexo 2. Technical Report, CORNARE, Rionegro, Antioquia, Colombia. 2016. Available online: https://www.cornare.gov.co/Plan-crecimiento-verde/Anexo2.Estudios-Tecnicos-Riesgos-Resiliencia-climatica-oriente-antioqueno.pdf (accessed on 20 October 2025).
- Arias, P.A.; Rendón, M.L.; Martínez, J.A.; Allan, R.P. Changes in atmospheric moisture transport over tropical South America: An analysis under a climate change scenario. Clim. Dyn. 2023, 61, 4949–4969. [Google Scholar] [CrossRef]
- Gudmundsson, L.; Bremnes, J.B.; Haugen, J.E.; Engen-Skaugen, T. Technical Note: Downscaling RCM precipitation to the station scale using statistical transformations—A comparison of methods. Hydrol. Earth Syst. Sci. 2012, 16, 3383–3390. [Google Scholar] [CrossRef]
- Kumar, K.N.; Thota, M.S.; Ashrit, R.; Mitra, A.K.; Rajeevan, M.N. Quantile mapping bias correction methods to IMDAA reanalysis for calibrating NCMRWF unified model operational forecasts. Hydrol. Sci. J. 2022, 67, 870–885. [Google Scholar] [CrossRef]
- Themeßl, M.J.; Gobiet, A.; Heinrich, G. Empirical-statistical downscaling and error correction of regional climate models and its impact on the climate change signal. Clim. Change 2012, 112, 449–468. [Google Scholar] [CrossRef]
- Yuan, Q.; Thorarinsdottir, T.L.; Beldring, S.; Wong, W.K.; Xu, C.Y. Bridging the scale gap: Obtaining high-resolution stochastic simulations of gridded daily precipitation in a future climate. Hydrol. Earth Syst. Sci. 2021, 25, 5259–5275. [Google Scholar] [CrossRef]
- Escamilla, V.; Puertes, C.; Francés, F. Capacidades del Modelo Hidrológico TETIS Versión 9. 2019. Available online: https://geama.org/jia2017/wp-content/uploads/ponencias/tema_B/b21.pdf (accessed on 20 October 2025).
- Valencia, S.; Villegas, J.C.; Hoyos, N.; Duque-Villegas, M.; Salazar, J.F. Streamflow response to land use/land cover change in the tropical Andes using multiple SWAT model variants. J. Hydrol. Reg. Stud. 2024, 55, 102085. [Google Scholar] [CrossRef]
- López-López, P.; Immerzeel, W.W.; Rodríguez, E.; Sterk, G. Spatial downscaling of satellite-based precipitation and its impact on discharge simulations in the Magdalena River basin (Colombia). Front. Earth Sci. 2018, 6, 68. [Google Scholar] [CrossRef]
- Uribe, N. Aplicaciones del modelo SWAT en cuencas colombianas. In Proceedings of the SWAT Conference, Brussels, Belgium, 19–21 September 2018. [Google Scholar]
- Moriasi, D.N.; Arnold, J.G.; Van Liew, M.W.; Binger, R.L.; Harman, W.G.; Veith, T.L. Model evaluation guidelines for systematic quantification of accuracy in watershed simulations. Trans. ASABE 2007, 50, 885–900. [Google Scholar] [CrossRef]
- IIAMA-UPV. TETIS Distributed Hydrological Model. 2023. Available online: https://iiama.webs.upv.es/en/technology-transfer/software/tetis/ (accessed on 20 October 2025).
- Sánchez-Murillo, R.; Madrigal-Solís, H.; Quesada-Román, A.; Arriola, J. Manual Calibration of the TETIS Model in the Mar Menor Lagoon Subcatchment. ResearchGate Preprint. 2022. Available online: https://www.researchgate.net/publication/361557361_Manual_calibration_of_TETIS_model_in_the_Mar_Menor_lagoon_subcatchment (accessed on 20 October 2025).
- Buytaert, W.; Celleri, R.; De Bièvre, B.; Cisneros, F.; Wyseure, G.; Deckers, J. Human impact on the hydrology of the Andean páramos. Earth-Sci. Rev. 2006, 79, 53–72. [Google Scholar] [CrossRef]
- Agudelo-Hz, W.J.; Castillo-Barrera, N.C.; Murcia-García, U. Scenarios of land use and land cover change in the Colombian Amazon to evaluate alternative post-conflict pathways. Sci. Rep. 2023, 13, 1926. [Google Scholar] [CrossRef] [PubMed]
- Moreira, R.M.; Lana, M.; Sieber, S.; Soares-Filho, B. A landscape ecology approach: Modeling forest fragmentation with artificial neural networks and cellular-automata Markov-chain for improved environmental policy in the southwestern Brazilian Amazon. Land Degrad. Dev. 2023, 34, 5649–5665. [Google Scholar] [CrossRef]
- Arias-Muñoz, P.; Saz, M.Á.; Escolano, S. Tendencias de cambio de usos y coberturas de suelo en la cuenca hidrográfica media-alta del río Mira en Ecuador. Investig. Geogr. 2024, 81, 155–179. [Google Scholar] [CrossRef]
- Guarderas, P.; Smith, F.; Dufrene, M. Land use and land cover change in a tropical mountain landscape of northern Ecuador: Altitudinal patterns and driving forces. PLoS ONE 2022, 17, e0260191. [Google Scholar] [CrossRef]
- Piontekowski, V.J.; Ribeiro, F.P.; Matricardi, E.A.T.; Lustosa Junior, I.M.; Bussinguer, A.P.; Gatto, A. Modeling deforestation in the state of Rondônia. Floresta Ambiente 2019, 26, e20180441. [Google Scholar] [CrossRef]
- Ulloa-Espíndola, R.; Martín-Fernández, S. Simulation and Analysis of Land Use Changes Applying Cellular Automata in the South of Quito and the Machachi Valley, Province of Pichincha, Ecuador. Sustainability 2021, 13, 9525. [Google Scholar] [CrossRef]
- Vargas, D.; Chimborazo, O.; László, E.; Temovski, M.; Palcsu, L. Rainwater isotopic composition in the Ecuadorian Andes and Amazon reflects cross-equatorial flow seasonality. Water 2022, 14, 2121. [Google Scholar] [CrossRef]
- Cerna-Arrue, A.; Aponte, H. El origen de los humedales peruanos y su relación con los procesos geológico-ambientales de Sudamérica—The origin of Peruvian wetlands and their relationship with the geological-environmental processes of South America: Una revisión. Caldasia 2024, 46, 314–325. [Google Scholar] [CrossRef]
- Poveda, G.; Vélez, J.I.; Mesa, O.J.; Cuartas, L.A. Linking Long-Term Water Balances to Estimate River Flows along the Drainage Network of Colombia. J. Hydrol. Eng. 2007, 12, 4–13. [Google Scholar] [CrossRef]
- Arias, P.A.; Martínez, J.A.; Vieira, S.C. Moisture sources to the anomalous wet season of 2010–2012 in northern South America. Clim. Dyn. 2015, 45, 2861–2884. [Google Scholar] [CrossRef]
- Arrieta-Castro, M.; Donado-Rodríguez, A.; Acuña, G.J.; Canales, F.A.; Teegavarapu, R.S.V.; Kaźmierczak, B. Analysis of Streamflow Variability and Trends in the Meta River, Colombia. Water 2020, 12, 1451. [Google Scholar] [CrossRef]
- Canchala, T.; Loaiza Cerón, W.; Francés, F.; Carvajal-Escobar, Y.; Andreoli, R.V.; Kayano, M.T.; Alfonso-Morales, W.; Caicedo-Bravo, E.; Ferreira de Souza, R.A. Streamflow Variability in Colombian Pacific Basins and their Relationships with Oceanic–Atmospheric Phenomena. Water 2020, 12, 526. [Google Scholar] [CrossRef]
- Restrepo, J.C.; Higgins, A.; Escobar, J.; Ospino, S.; Hoyos, N. Contribution of low-frequency climatic–oceanic oscillations to streamflow variability in small, coastal rivers of the Sierra Nevada de Santa Marta (Colombia). Hydrol. Earth Syst. Sci. 2019, 23, 2379–2400. [Google Scholar] [CrossRef]
- Jiménez-Saenz, C.; Pulgarin-Morales, L.; Krueger, T. The water-energy nexus under ENSO variability in four case studies including Colombian basins. Renew. Energy 2024, 1–12. [Google Scholar] [CrossRef]
- Alvarez, M.; Barco, J. Streamflow modeling in the Colombian Andes: Insights from watersheds with diverse physical properties and climate patterns. J. Appl. Water Eng. Res. 2025, 13, 128–141. [Google Scholar] [CrossRef]
Disclaimer/Publisher’s Note: The statements, opinions and data contained in all publications are solely those of the individual author(s) and contributor(s) and not of MDPI and/or the editor(s). MDPI and/or the editor(s) disclaim responsibility for any injury to people or property resulting from any ideas, methods, instructions or products referred to in the content. |
© 2025 by the authors. Licensee MDPI, Basel, Switzerland. This article is an open access article distributed under the terms and conditions of the Creative Commons Attribution (CC BY) license (https://creativecommons.org/licenses/by/4.0/).