
Hydrodynamic Modeling and Comprehensive Assessment of Pier Scour Depth and Rate Induced by Wood Debris Accumulation


Abstract
1. Introduction
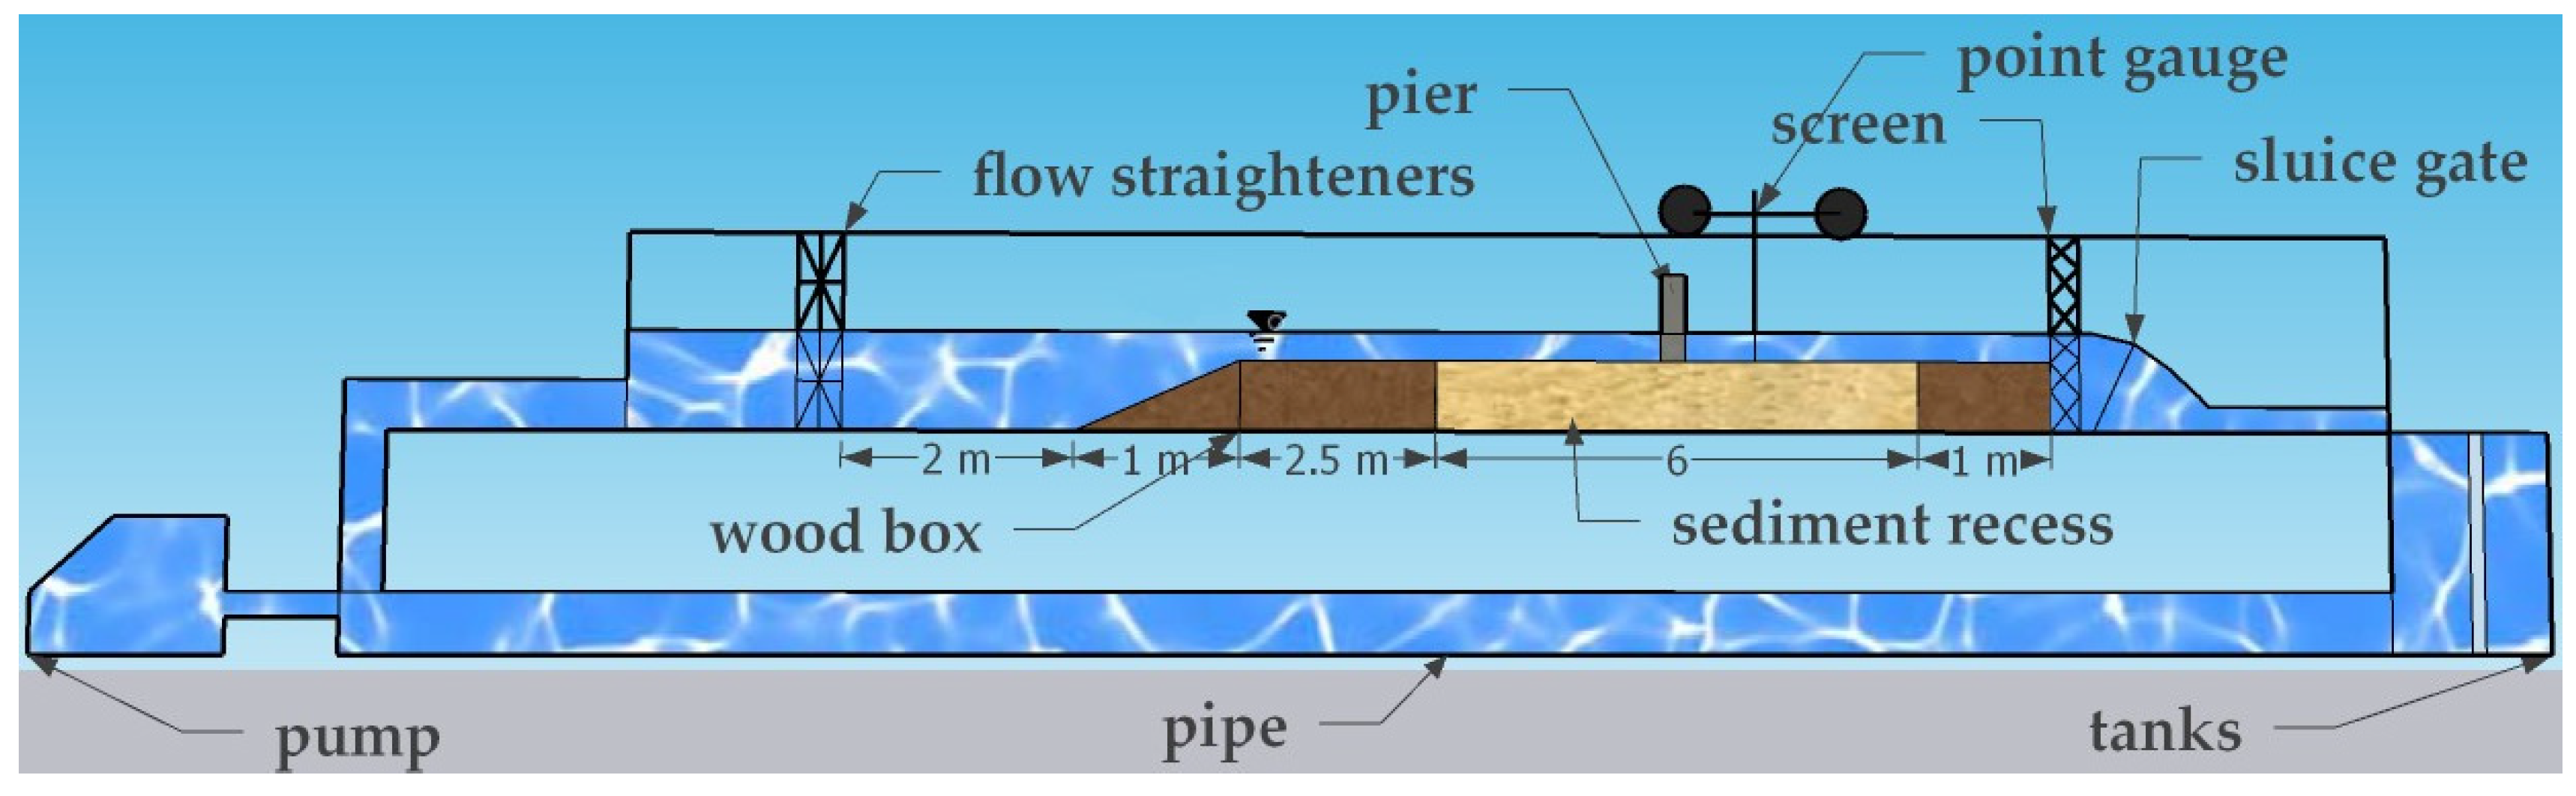
2. Experimental Characteristics and Sand Properties
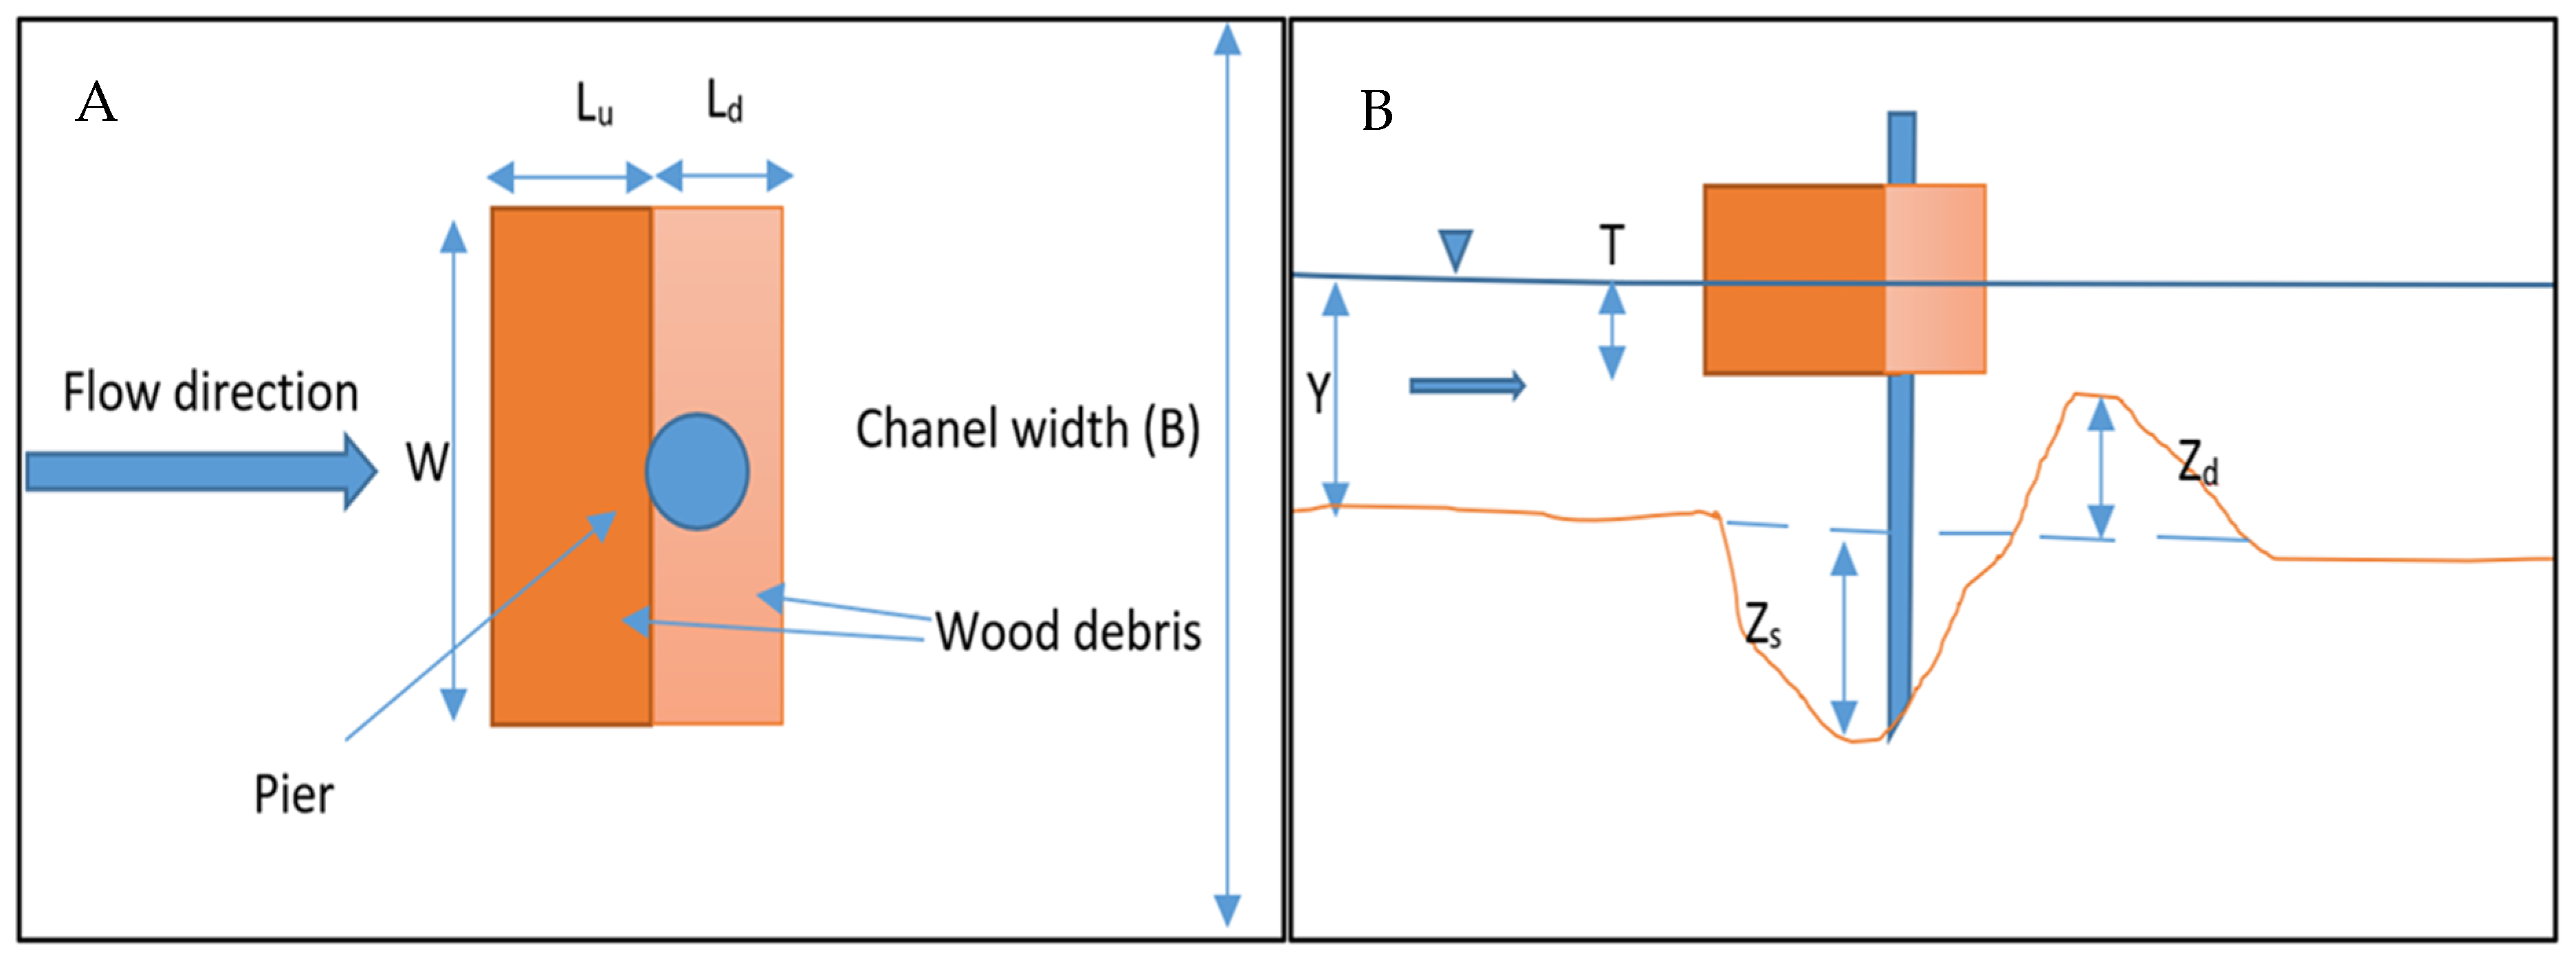
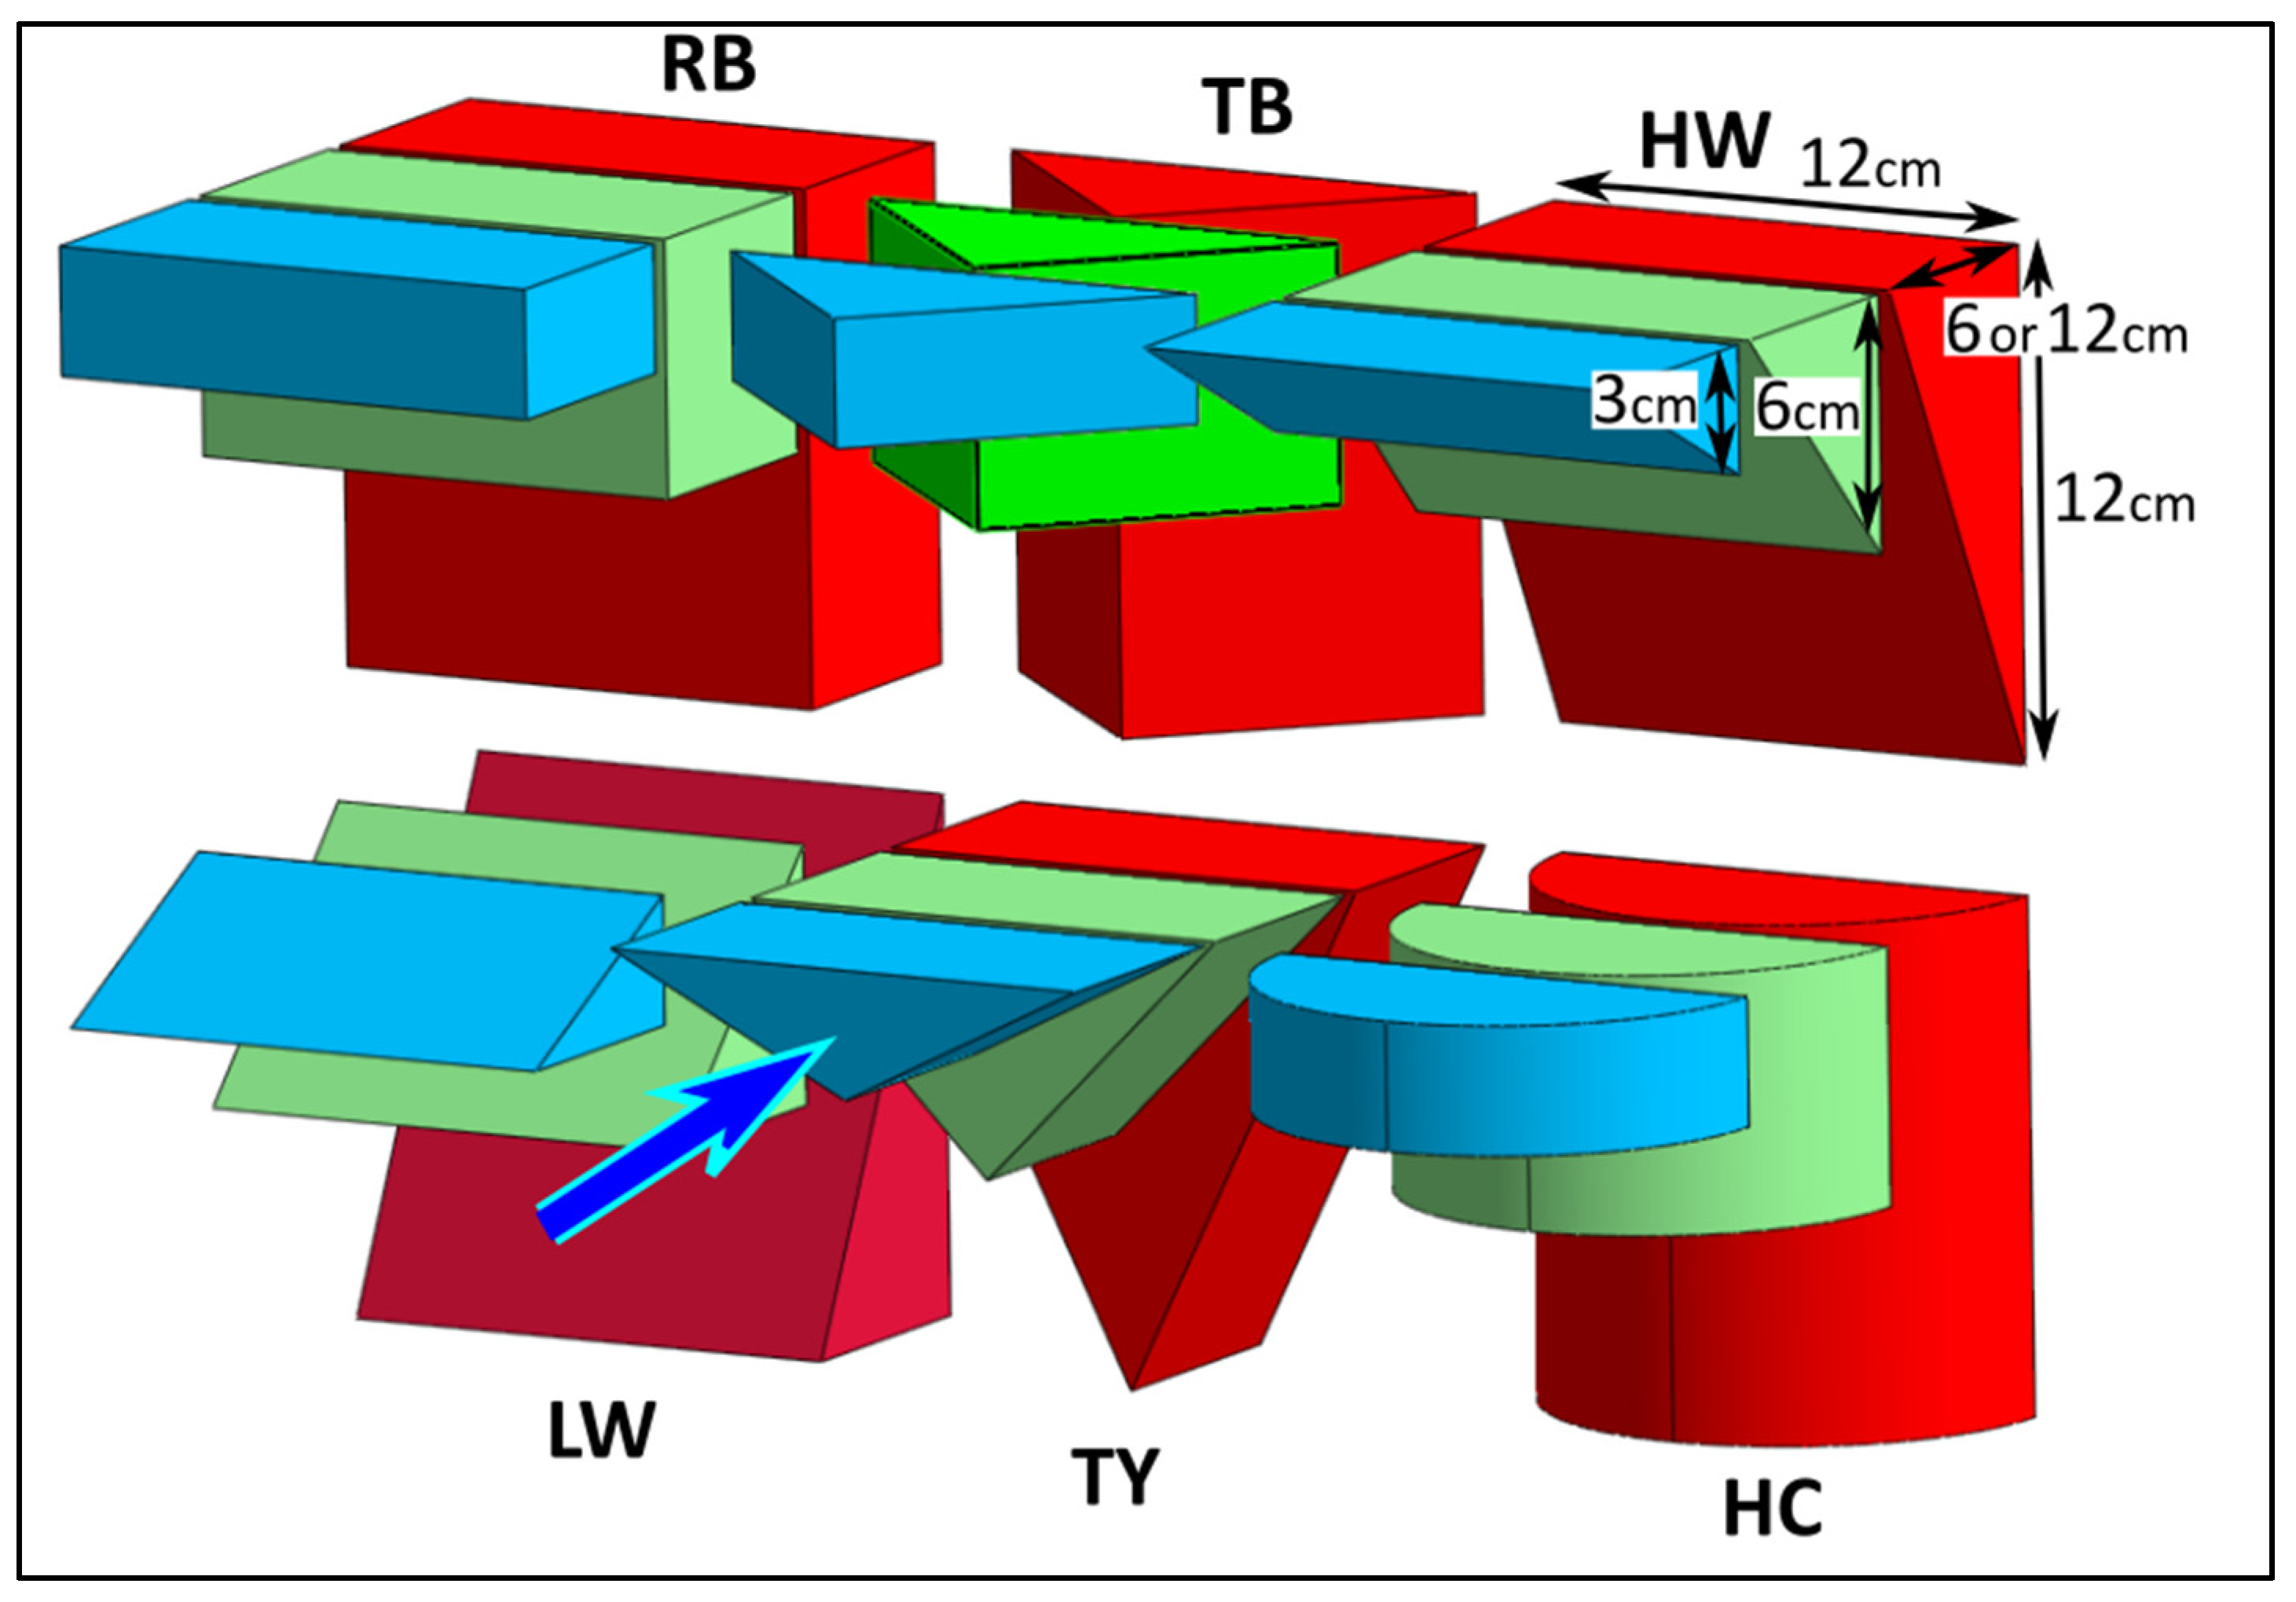
3. Large Wood Floating Debris
- The debris clumps were fixed in position. Stationary debris allowed for a consistent geometry when comparing scour holes caused by varying other parameters.
- The flow direction angle remained at 0° concerning the debris’ upstream face. Maintaining a normal direction eliminated the effects of the attack angle.
- The debris shapes could be submerged to different depths.
- The debris shapes could be positioned so that they extended upstream and downstream of the pier.
- Rectangular block (): A block-shaped configuration.
- Triangle bow (): Resembling the bow of a ship, oriented to face upstream.
- High wedge (): Featuring a large mass at the high end, with the upstream face directing the flow downward.
- Low wedge (): Characterized by a large mass at the low end, with the upstream face directing the flow upward.
- Triangle yield sign (): Wide at the top with an apex at the bottom, featuring a flat upstream face.
- Half-cylinder (): Presenting a rounded side facing upstream.
4. Testing Procedures
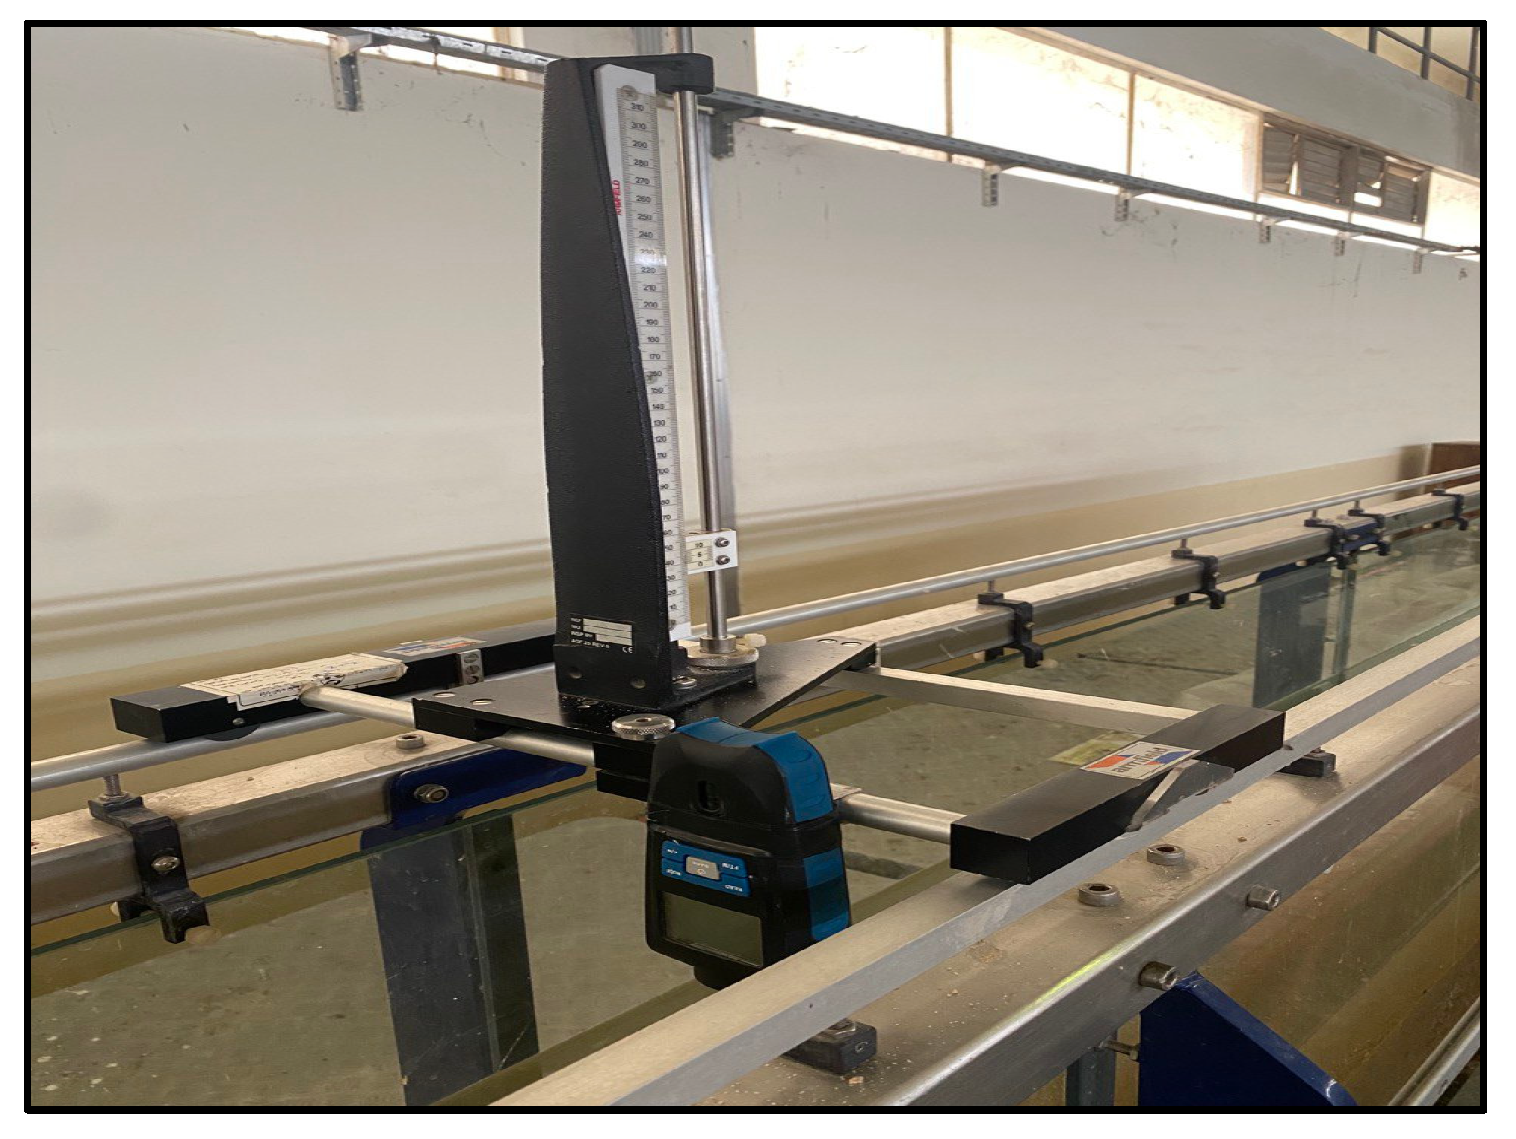
4.1. Preparations, Measurements, and Timing
4.2. Testing Parameters Examined
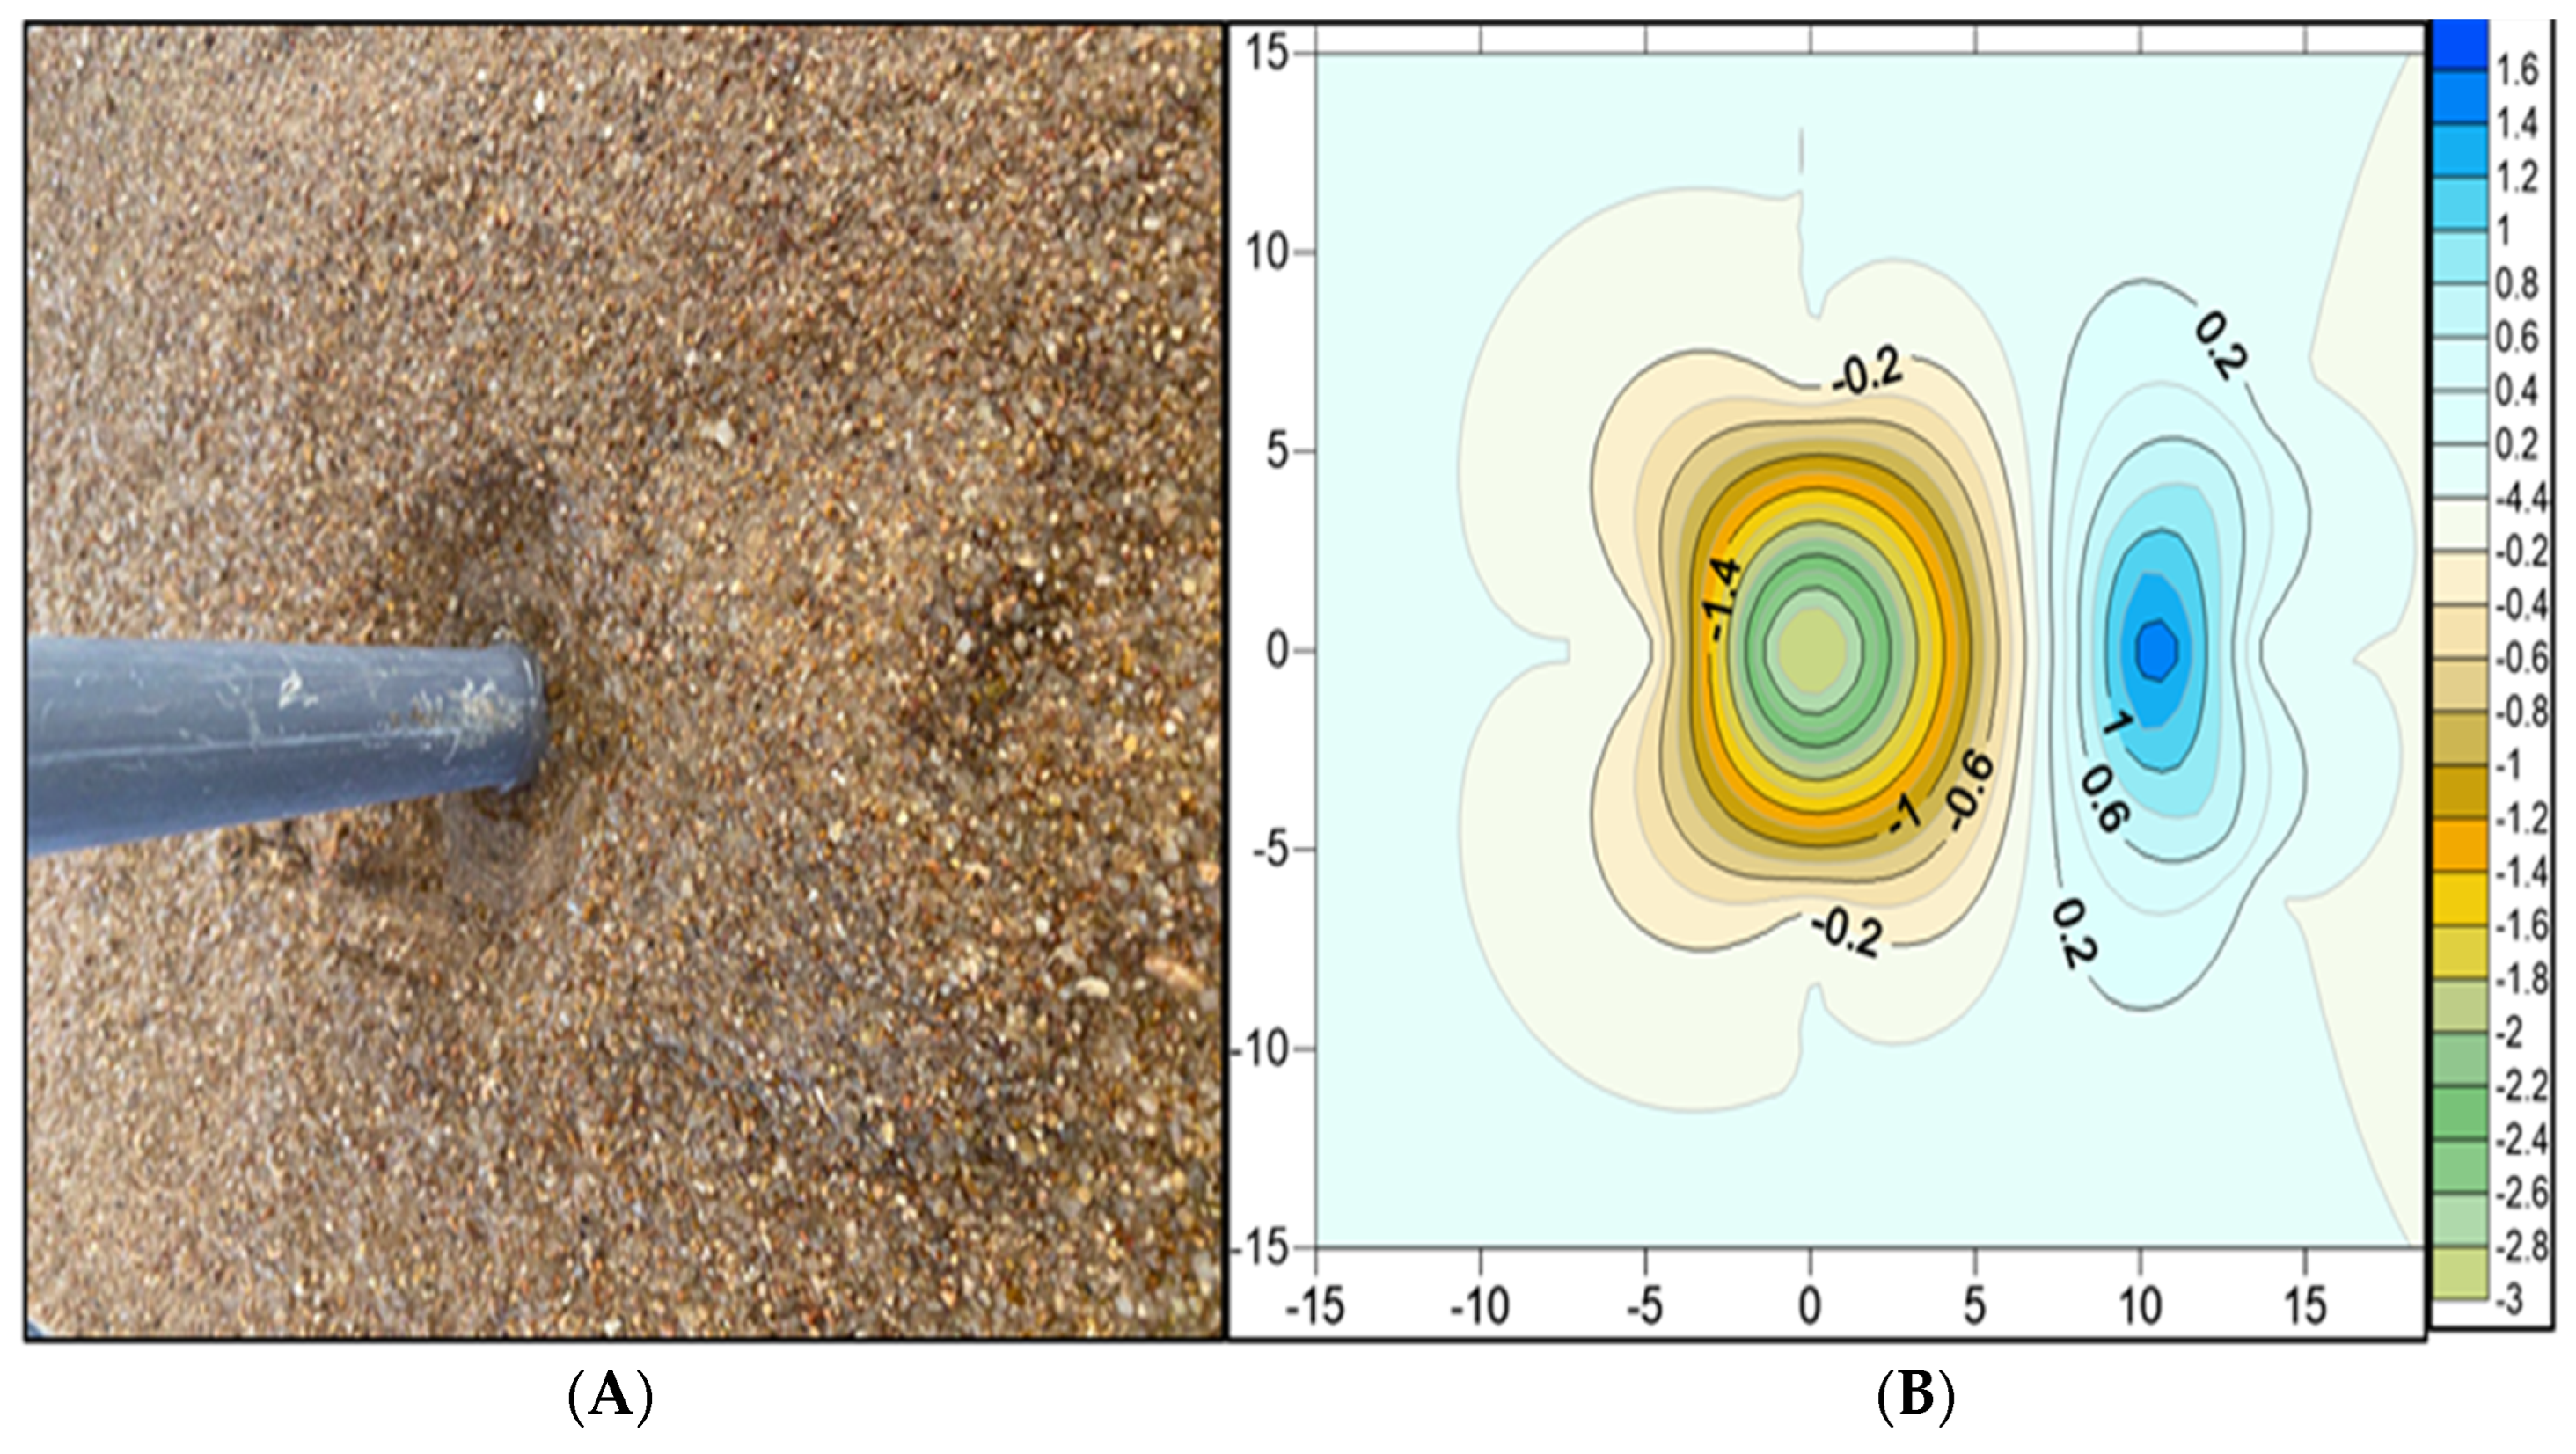
4.3. Scour Evolution during the Tests
5. Test Results and Discussion
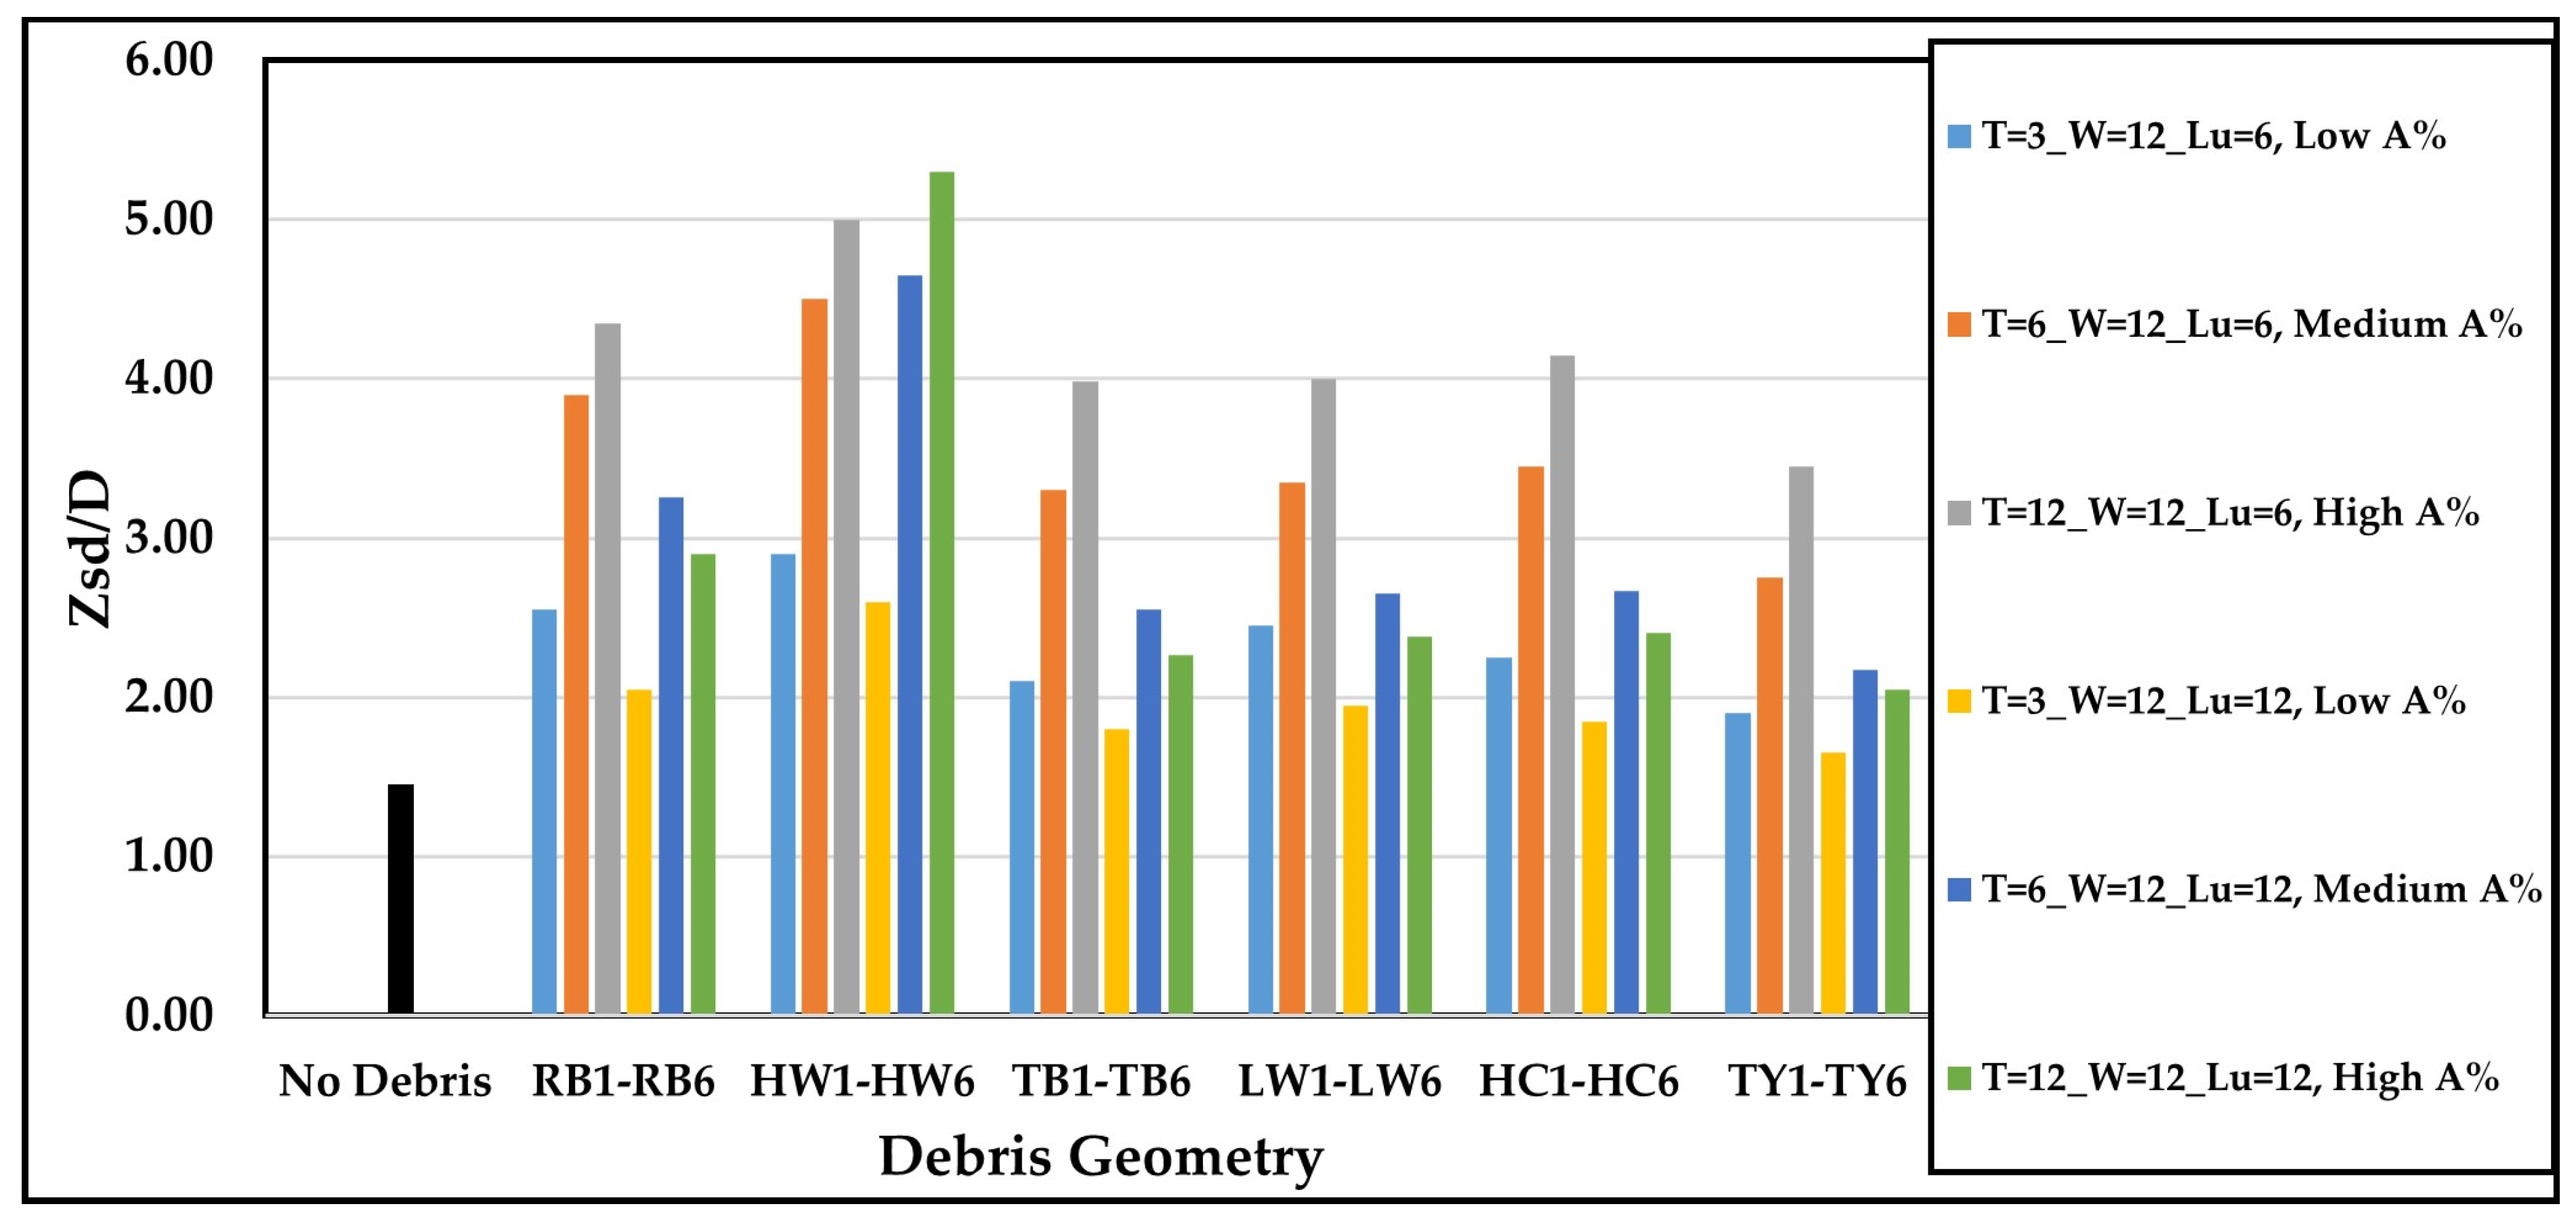
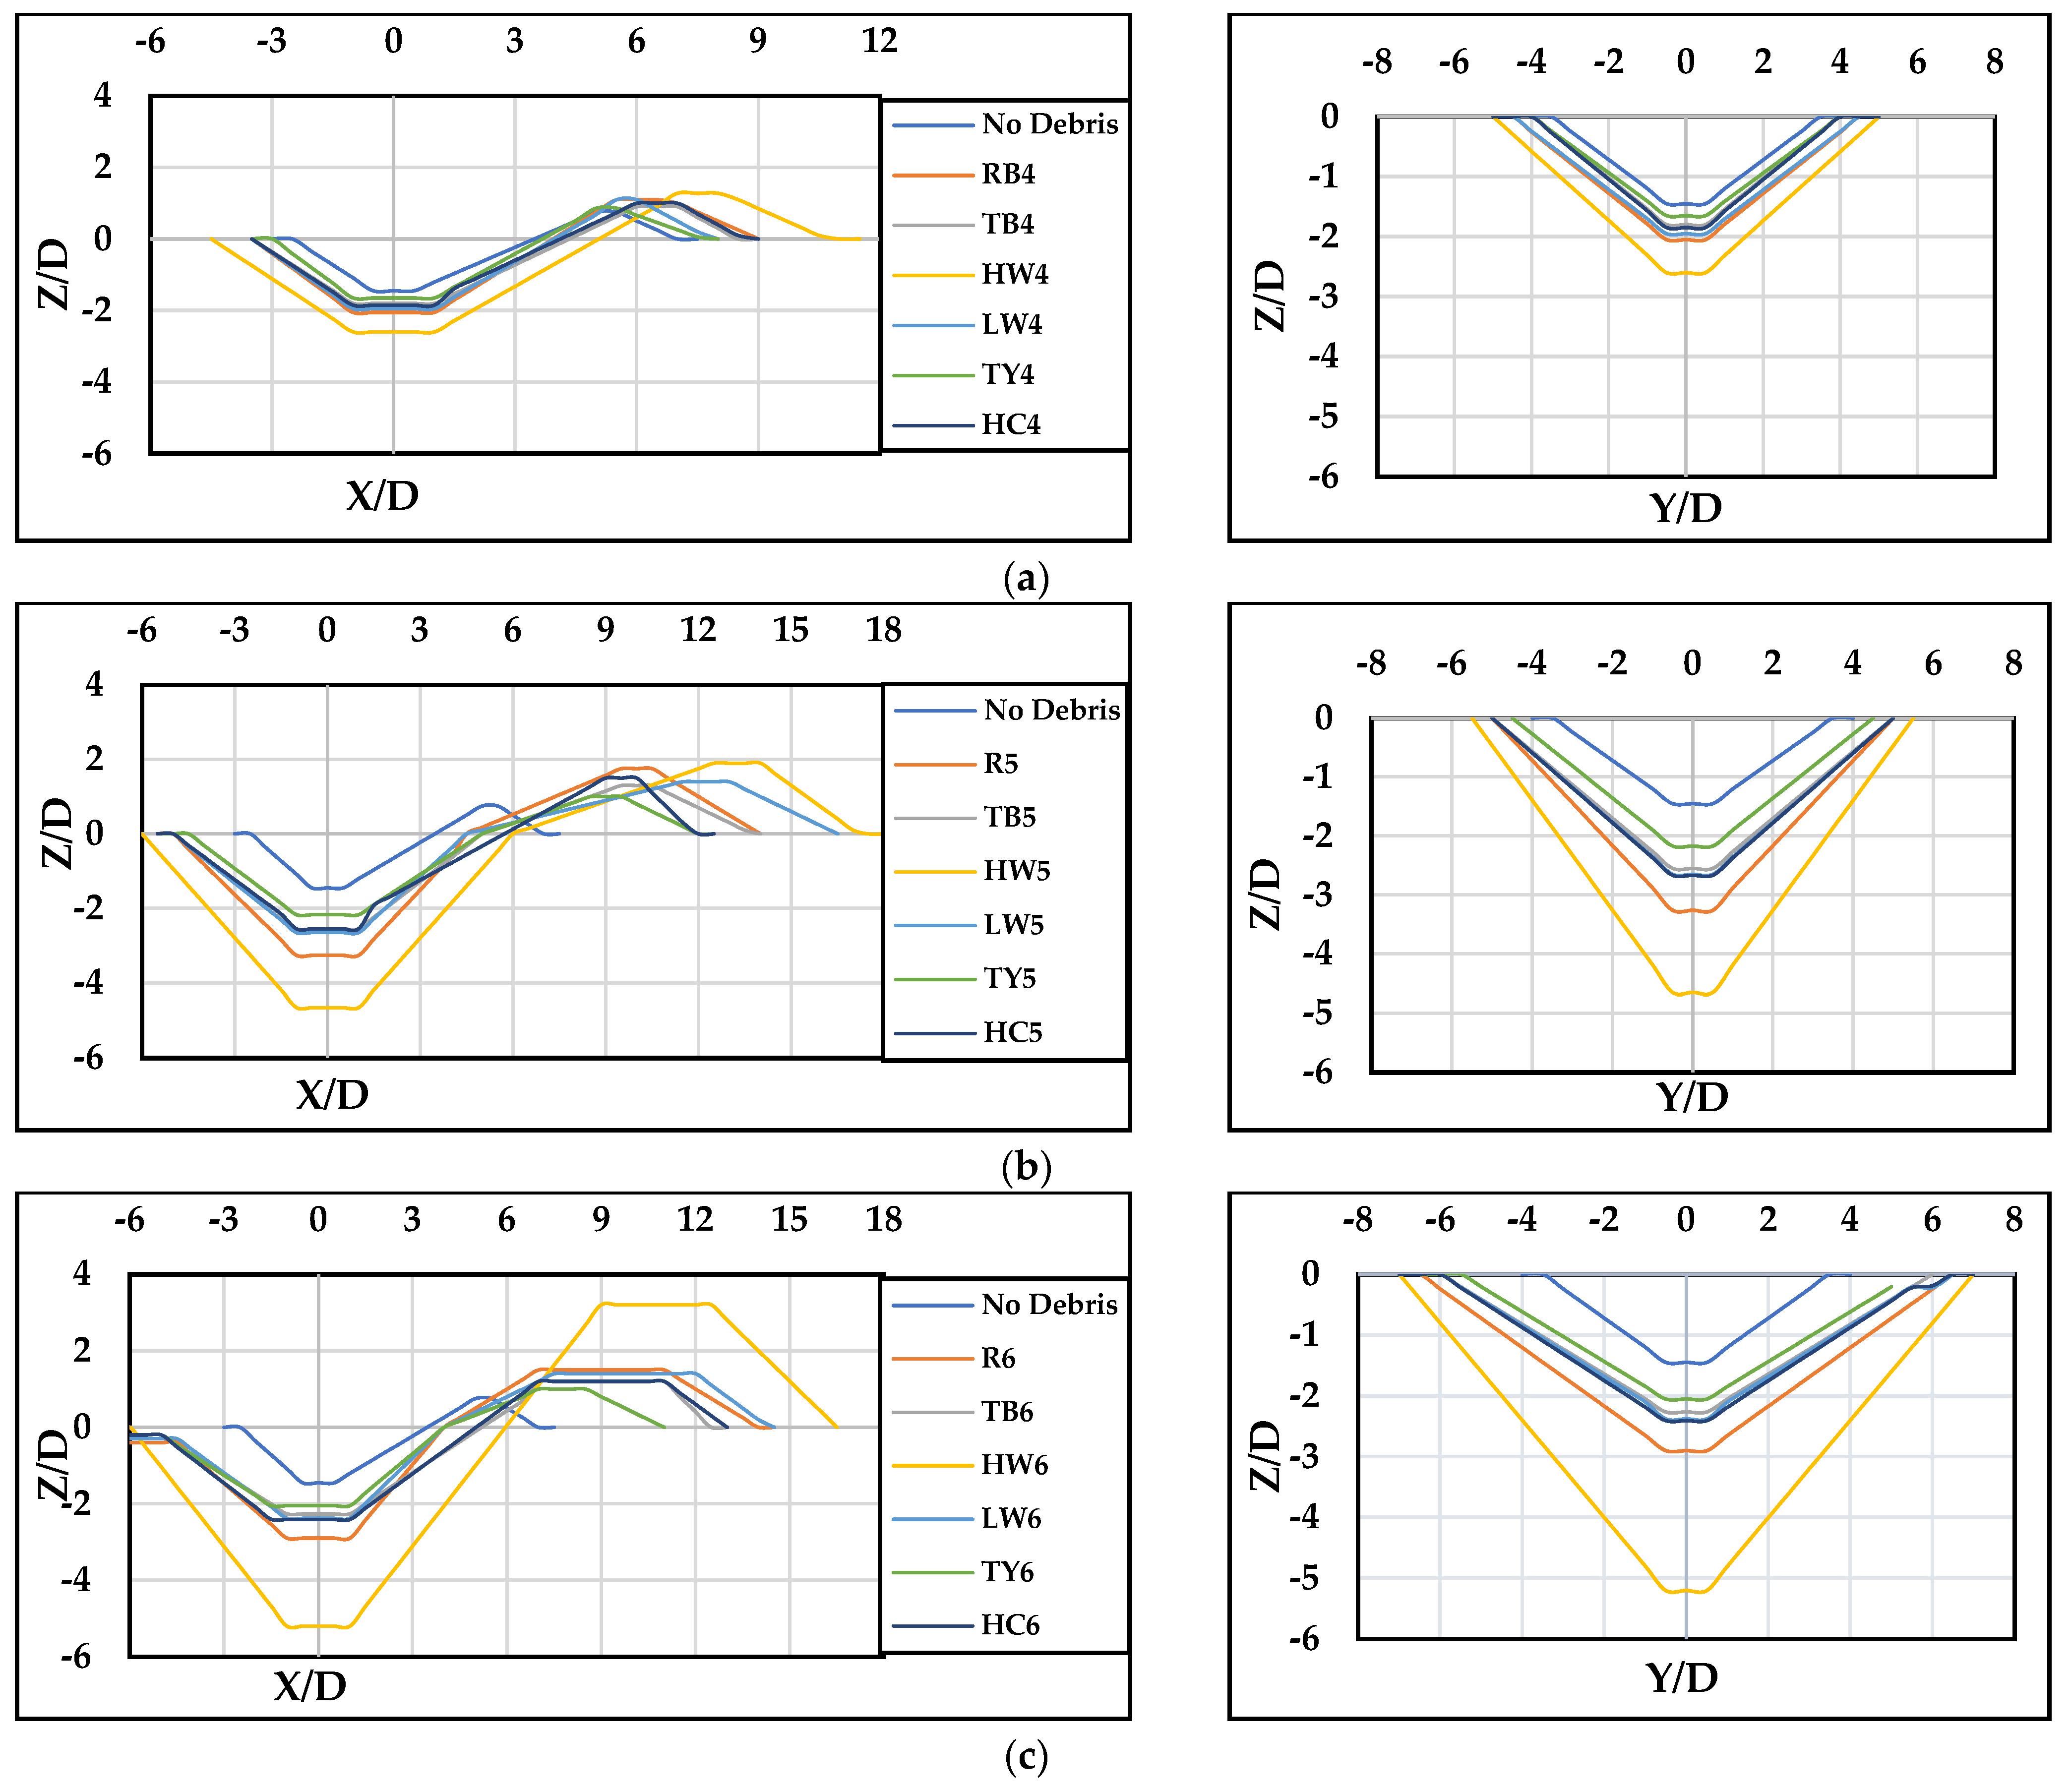
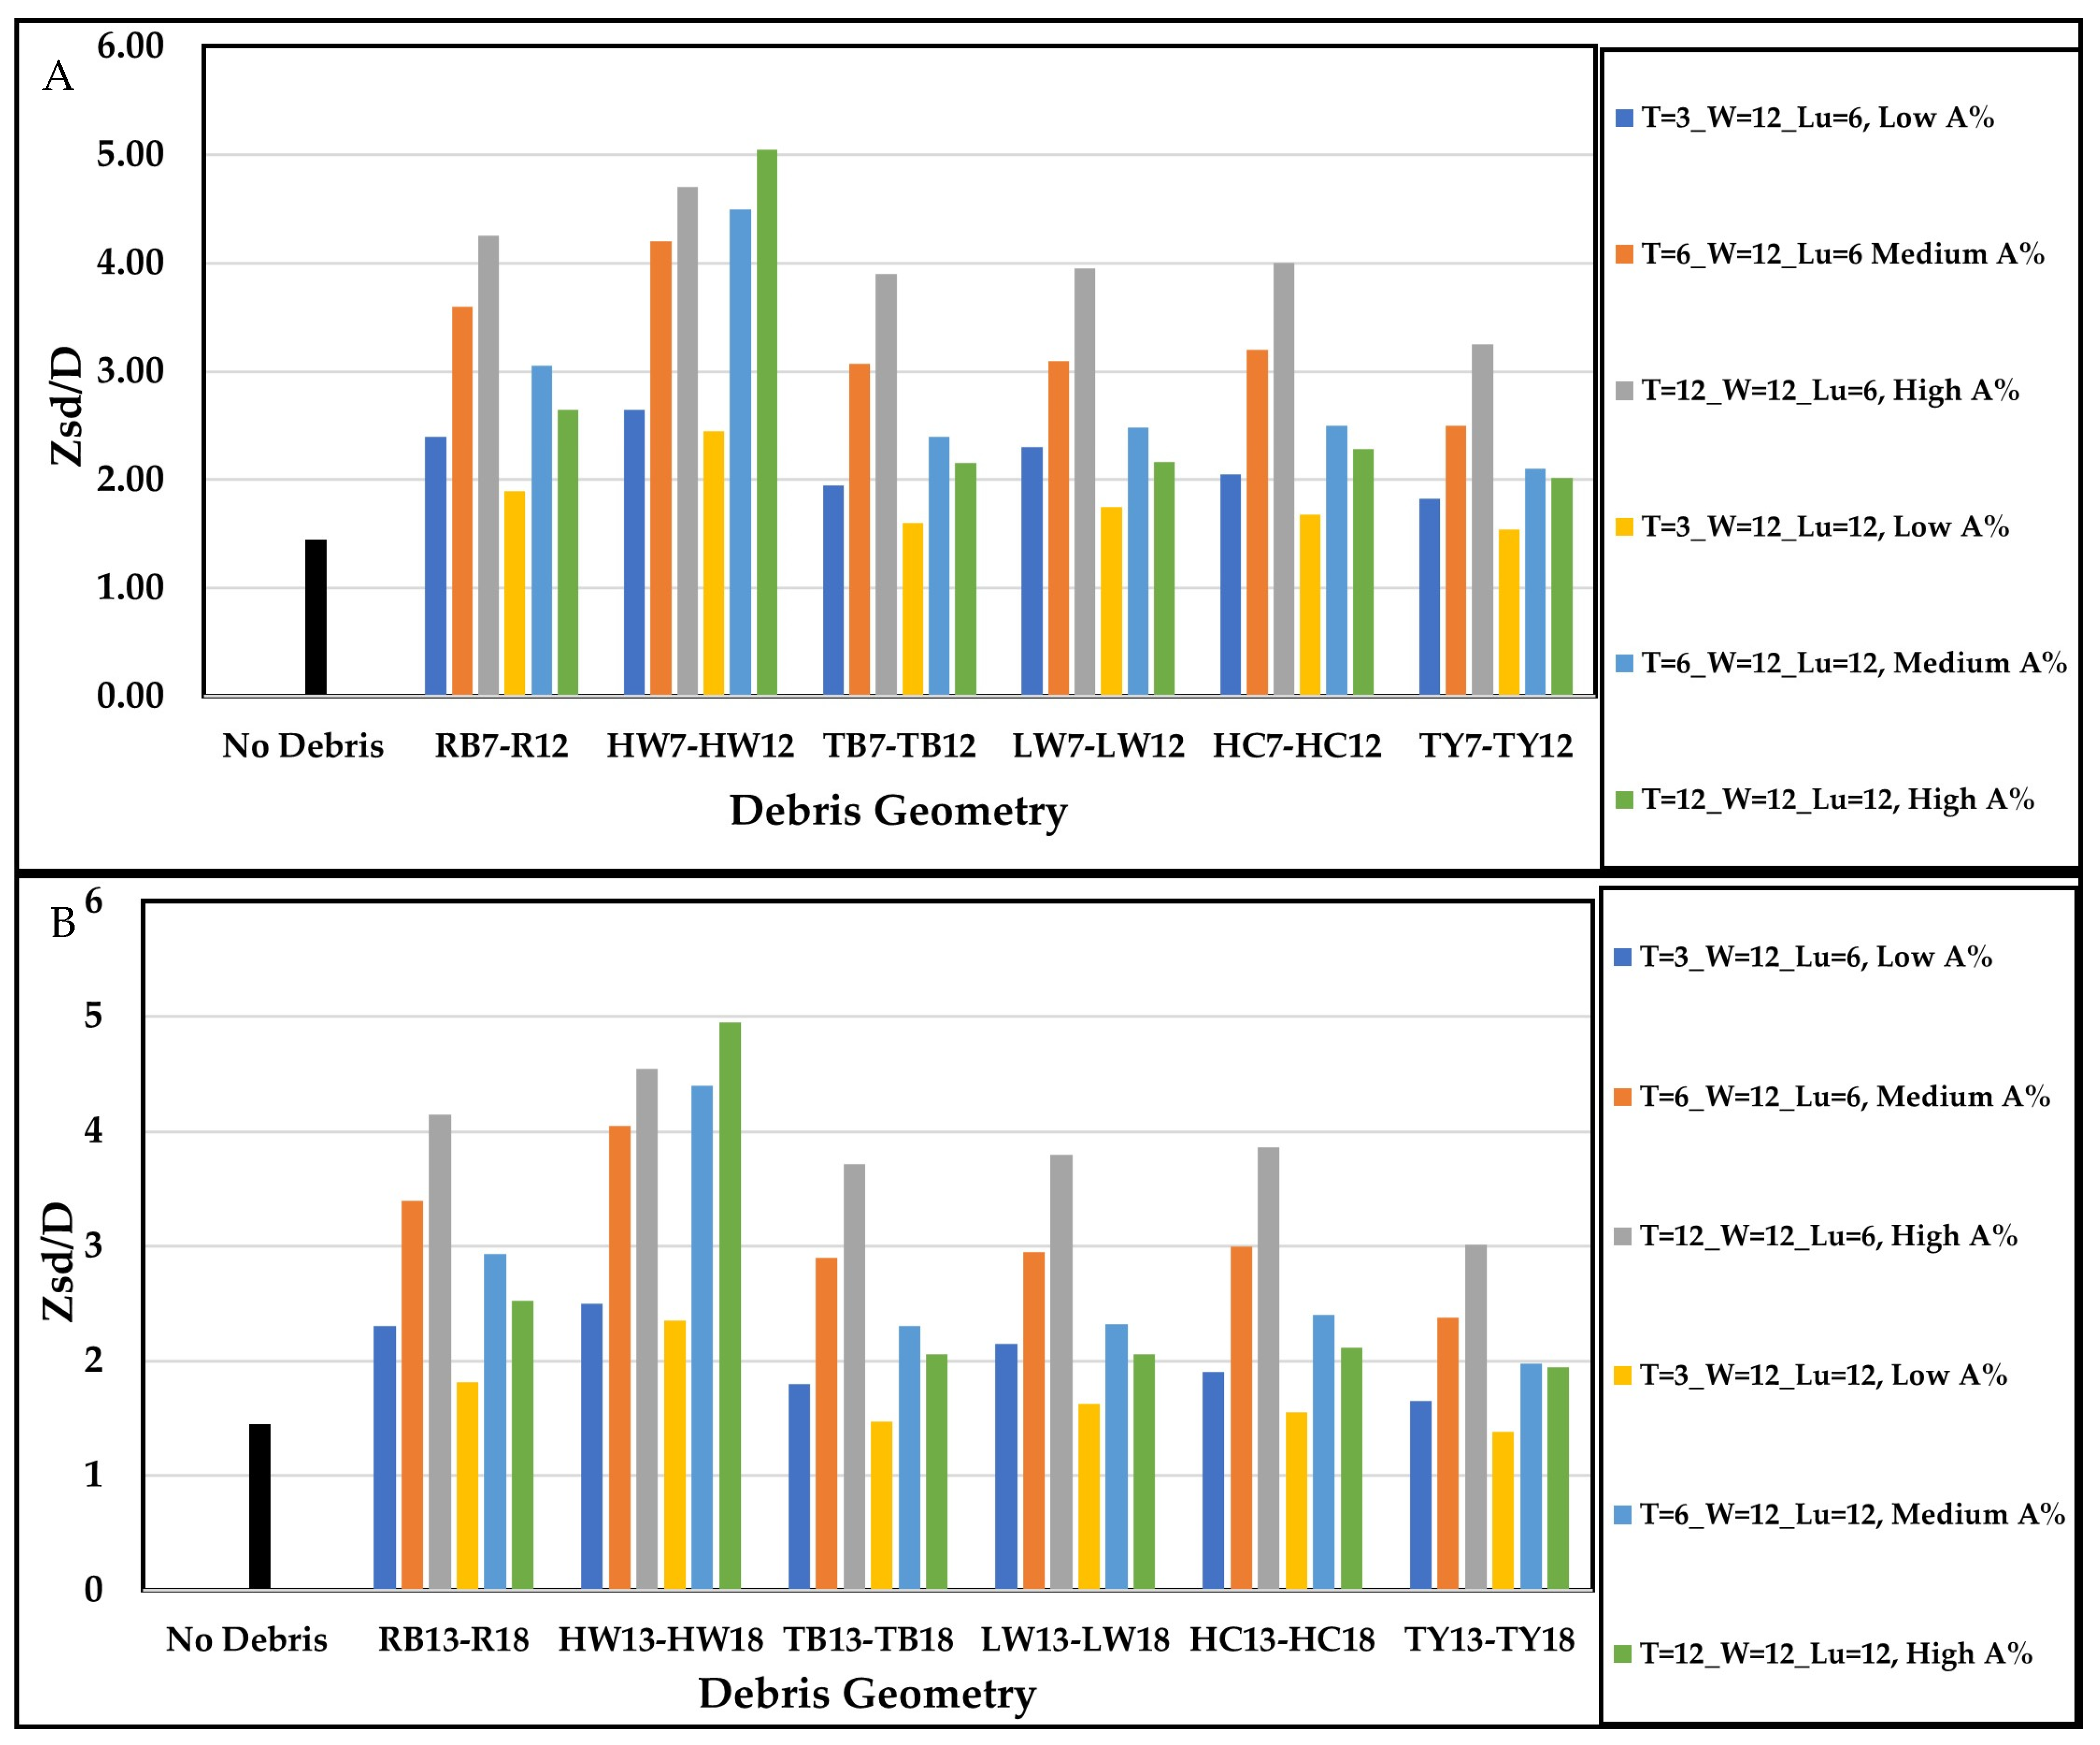
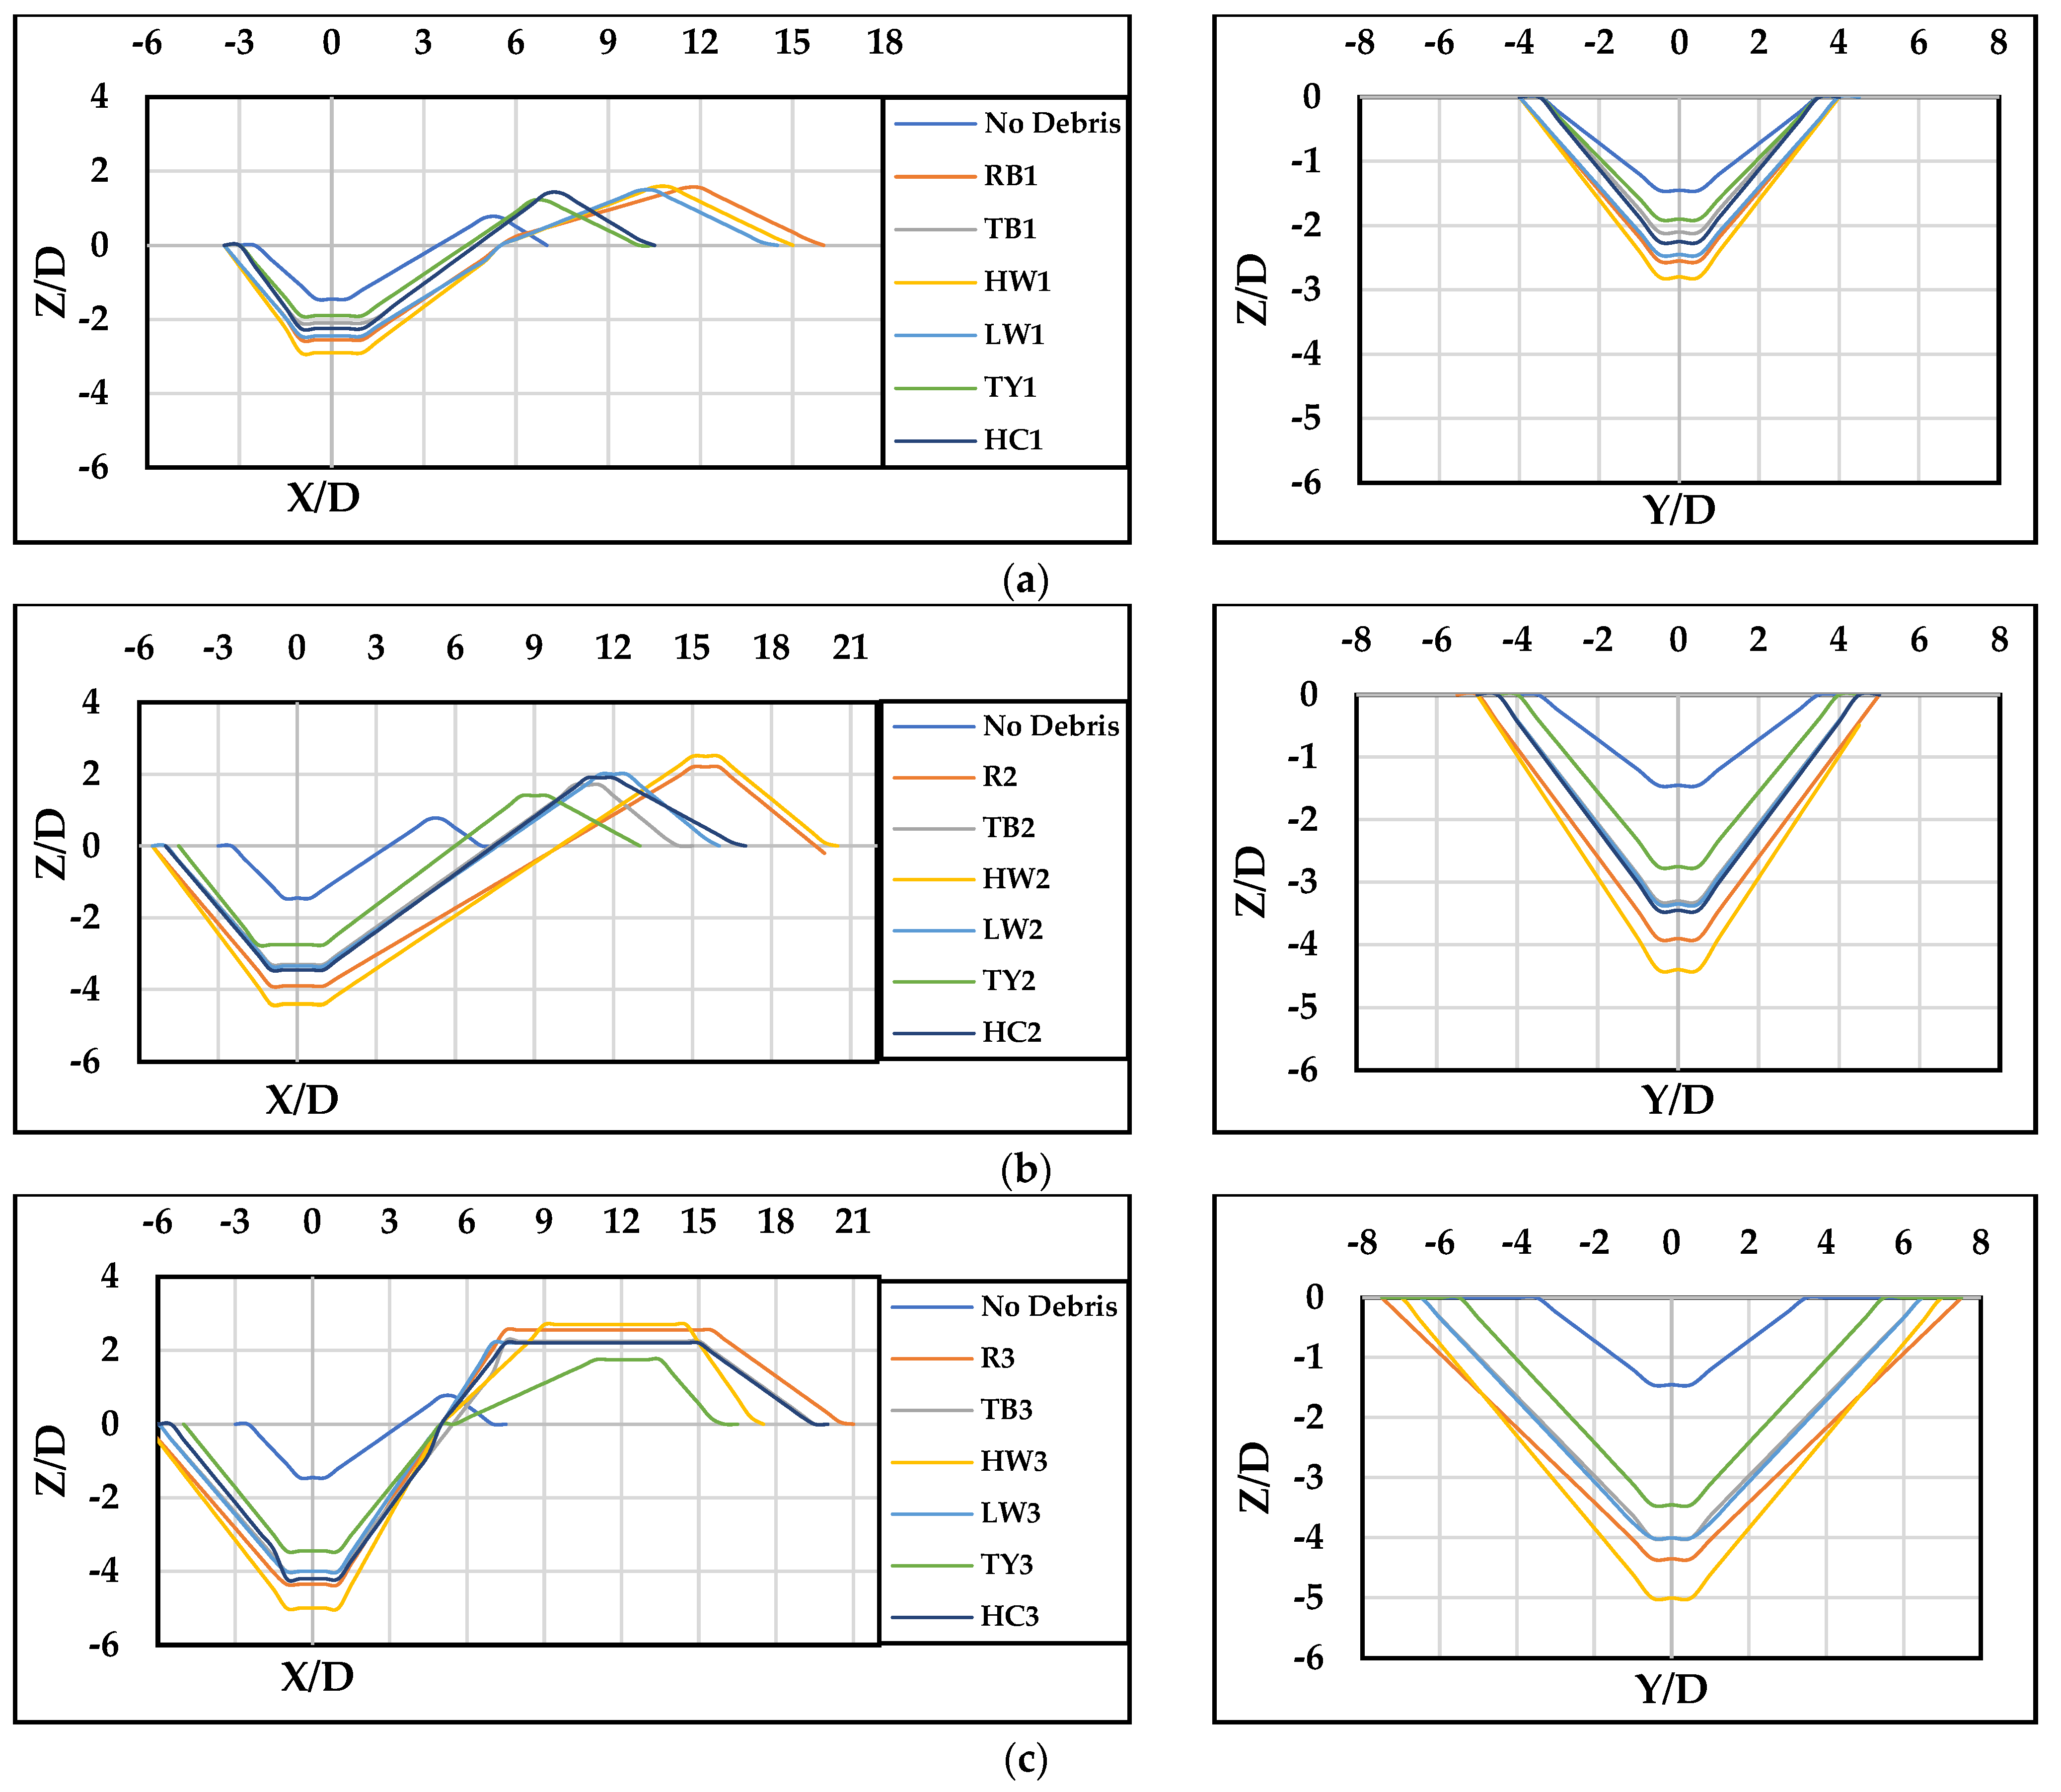
5.1. Maximum Scour Depth and Deposition Height for Different Debris Shapes
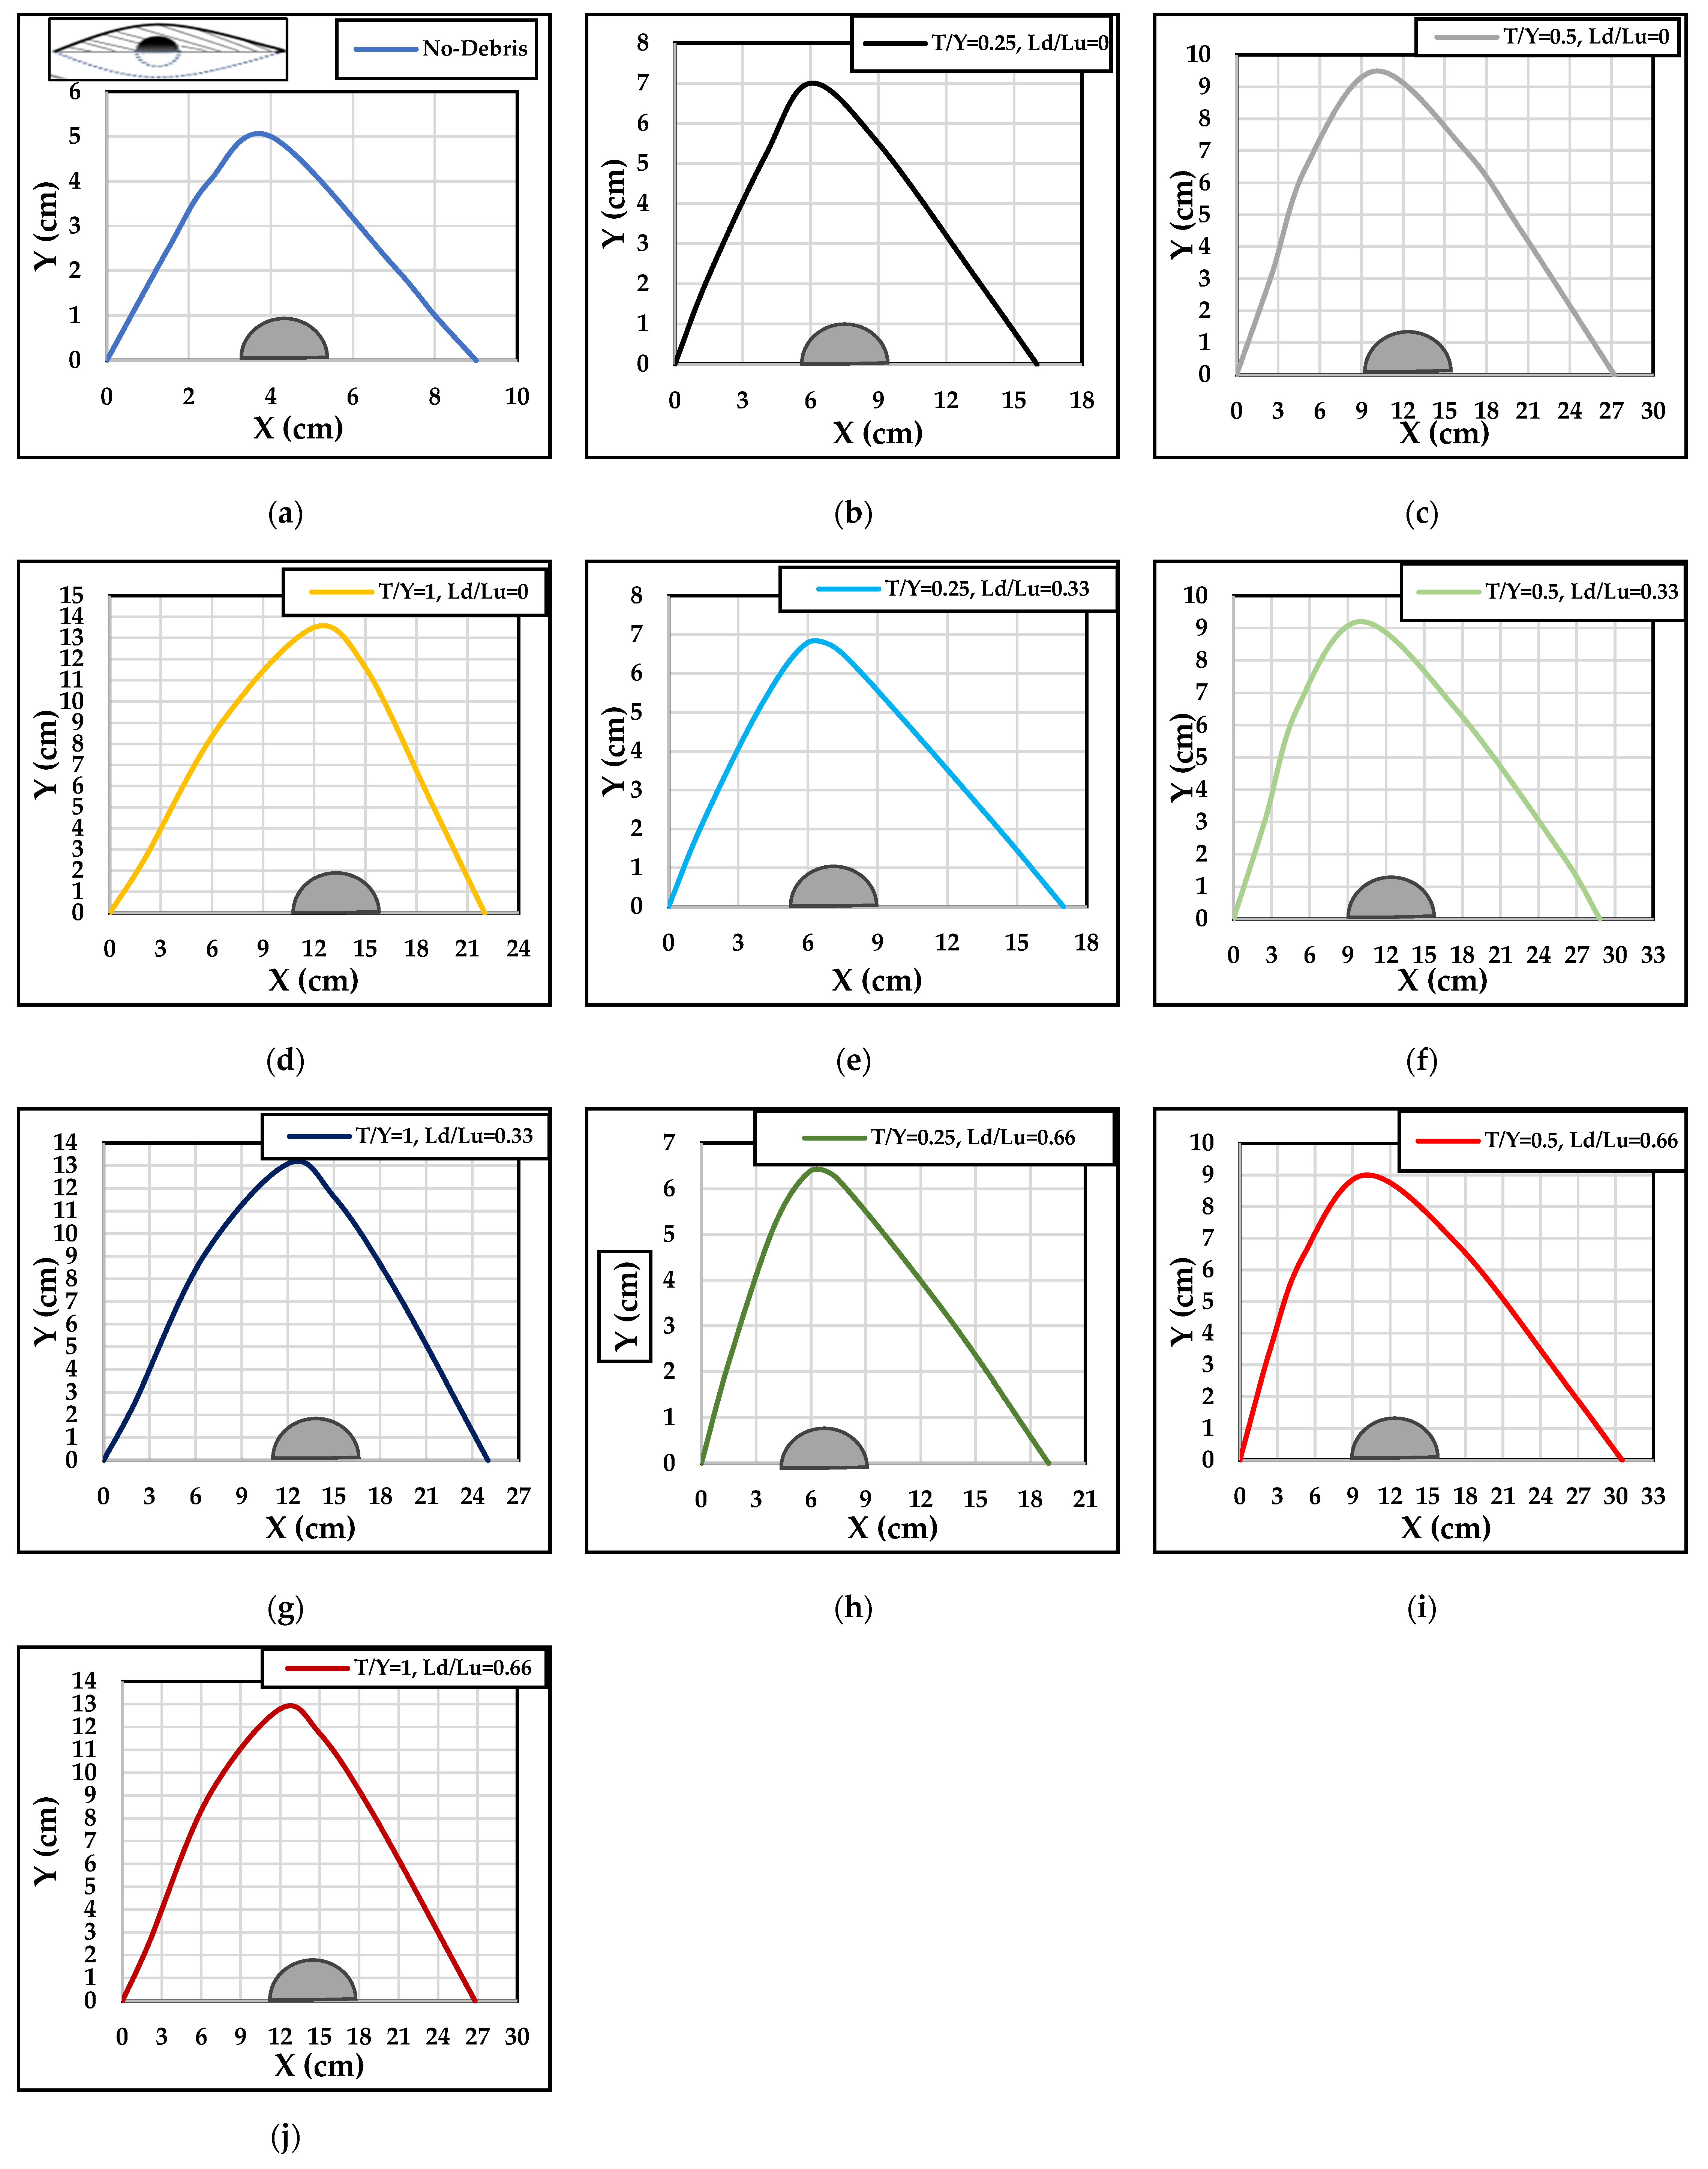
- All debris with shallow immersion depths ( = 3 cm, blue and yellow lines) produced less scour than with deeper immersion: = 6 and 12 cm.
- Pier scouring increased significantly when the obstruction percentage ( was high.
- Debris shapes positioned further upstream ( = 12 cm, second group—yellow, blue, and green) generally caused less scour compared to those when = 6 cm (first group), regardless of the increase in the () value. However, the high wedge () showed an increased scour depth with a longer upstream debris length at = 12 cm.
- Regardless of shape, the deepest scours occurred when the debris was at full depth ( = 12 cm higher obstruction ratio ( and near the pier ( = 6 cm), shown by gray lines.
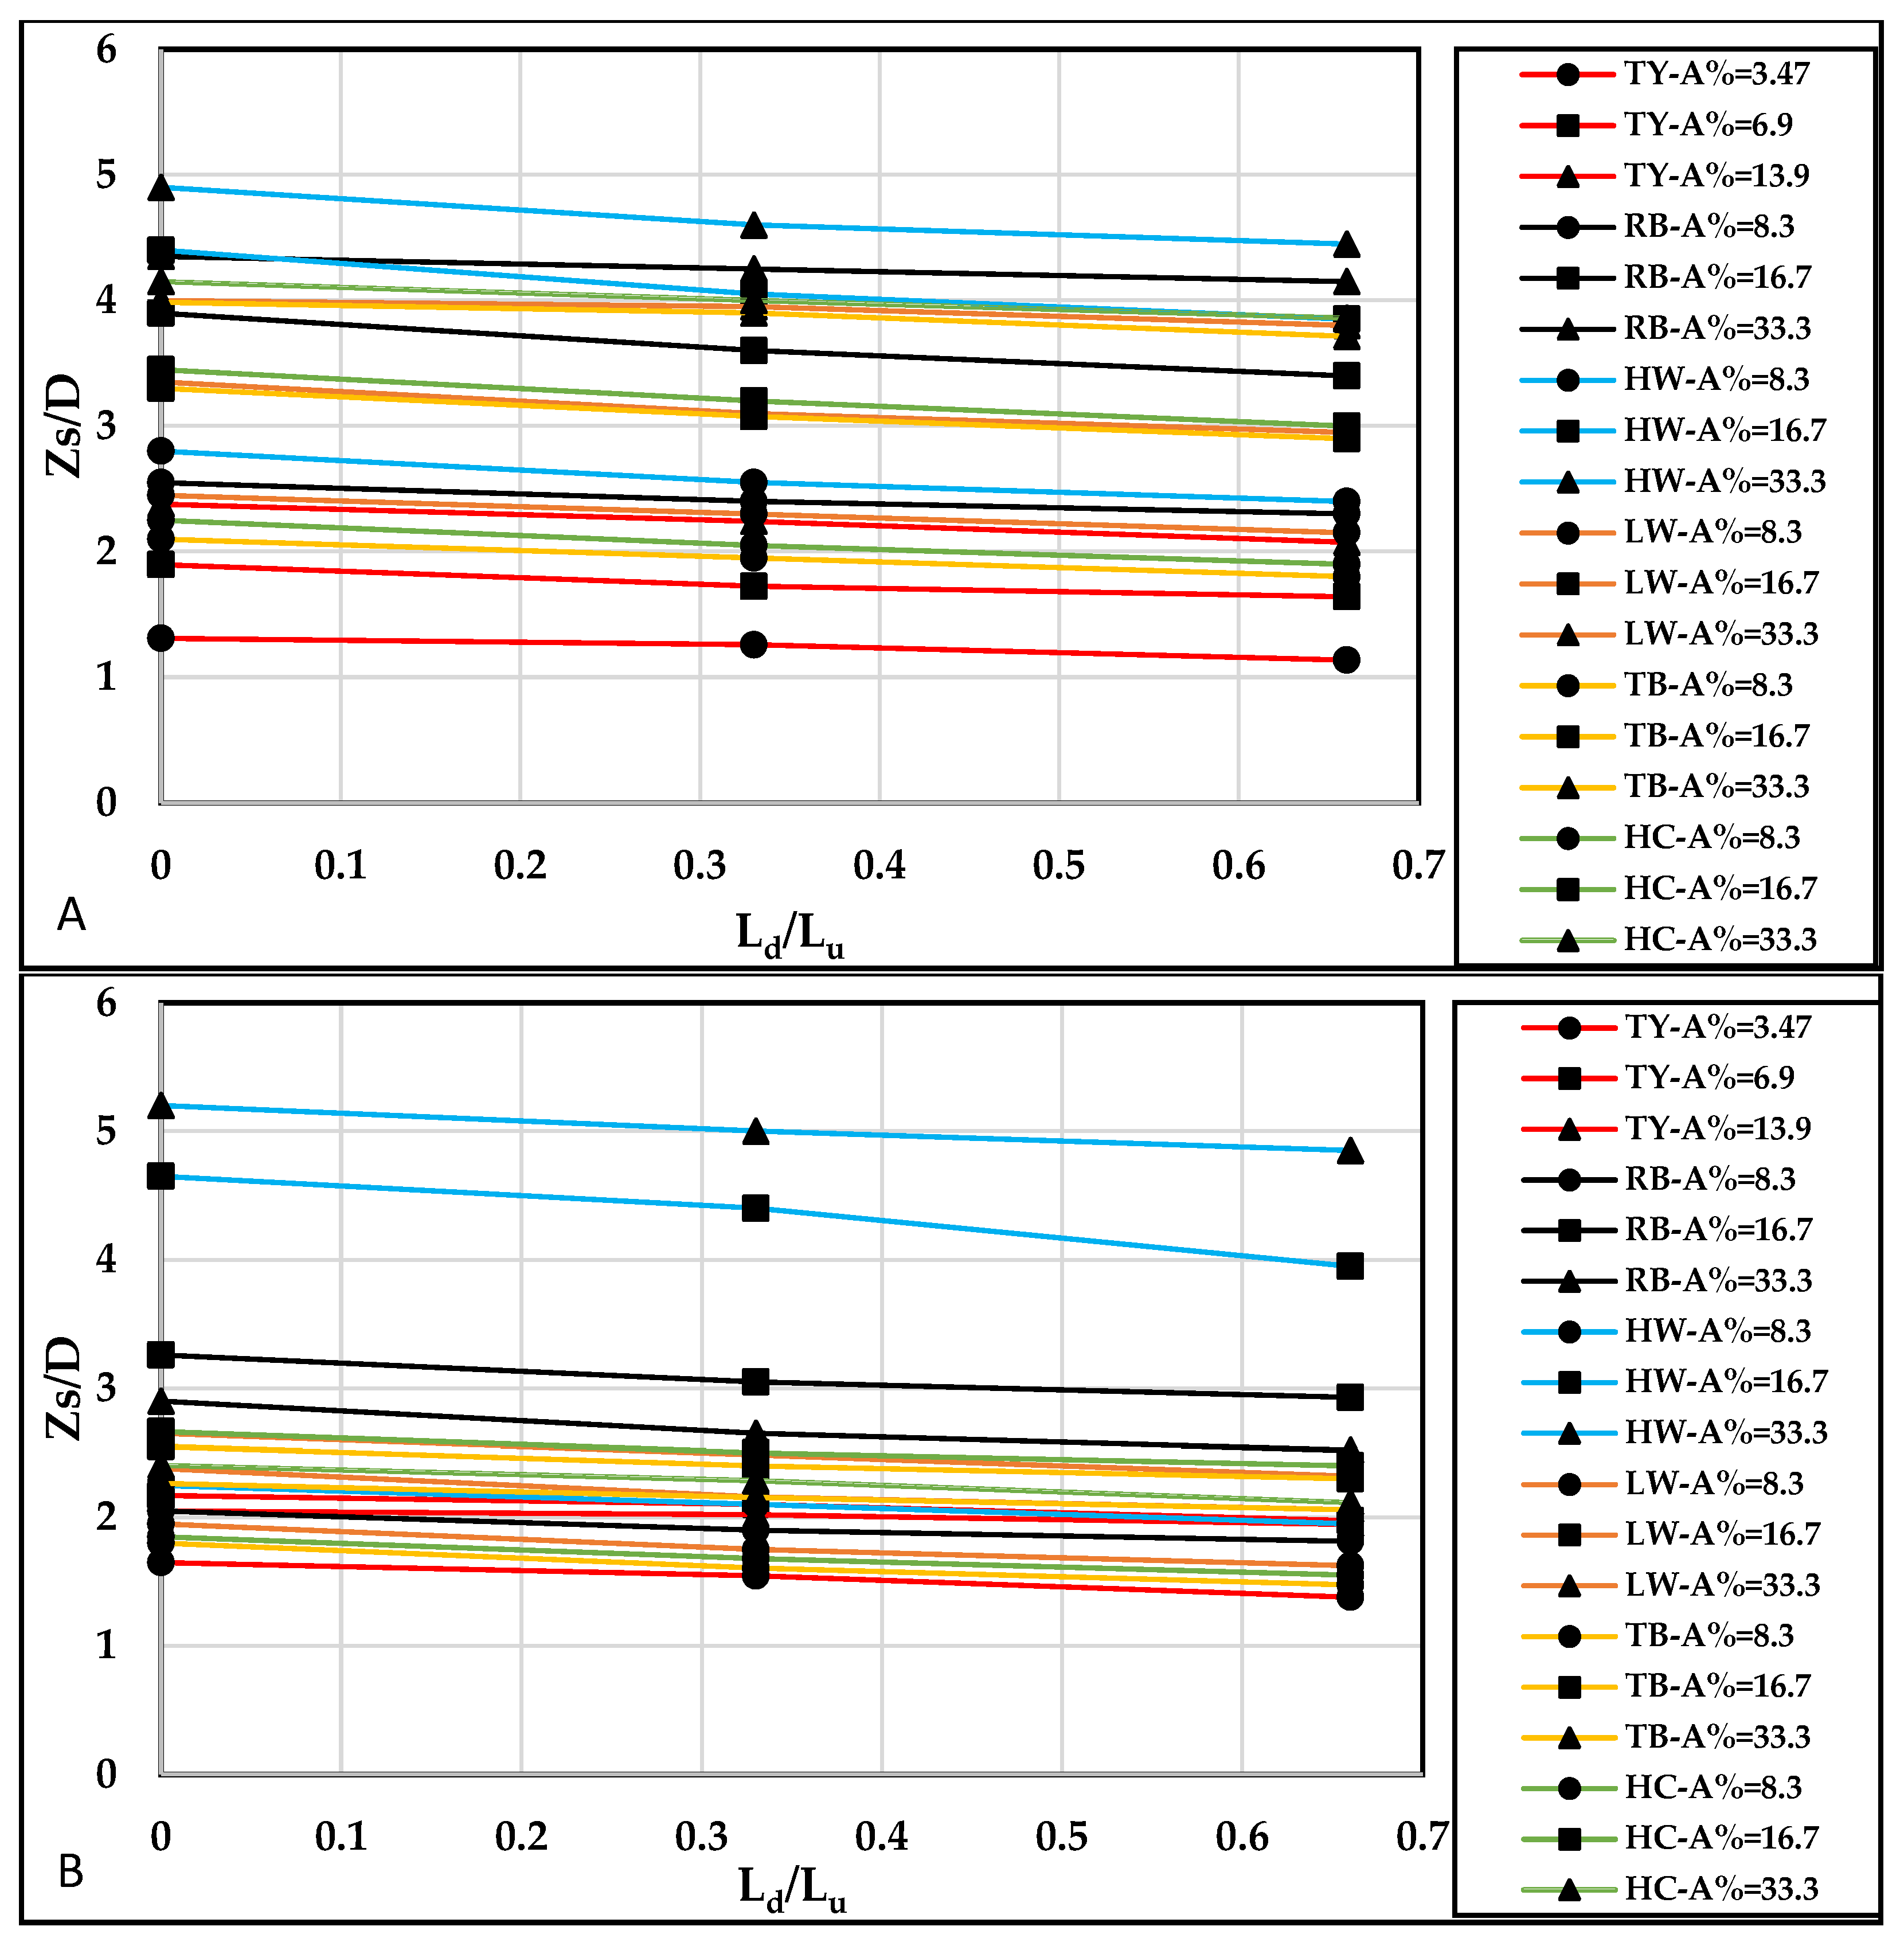
5.2. Debris Downstream Extension (/)
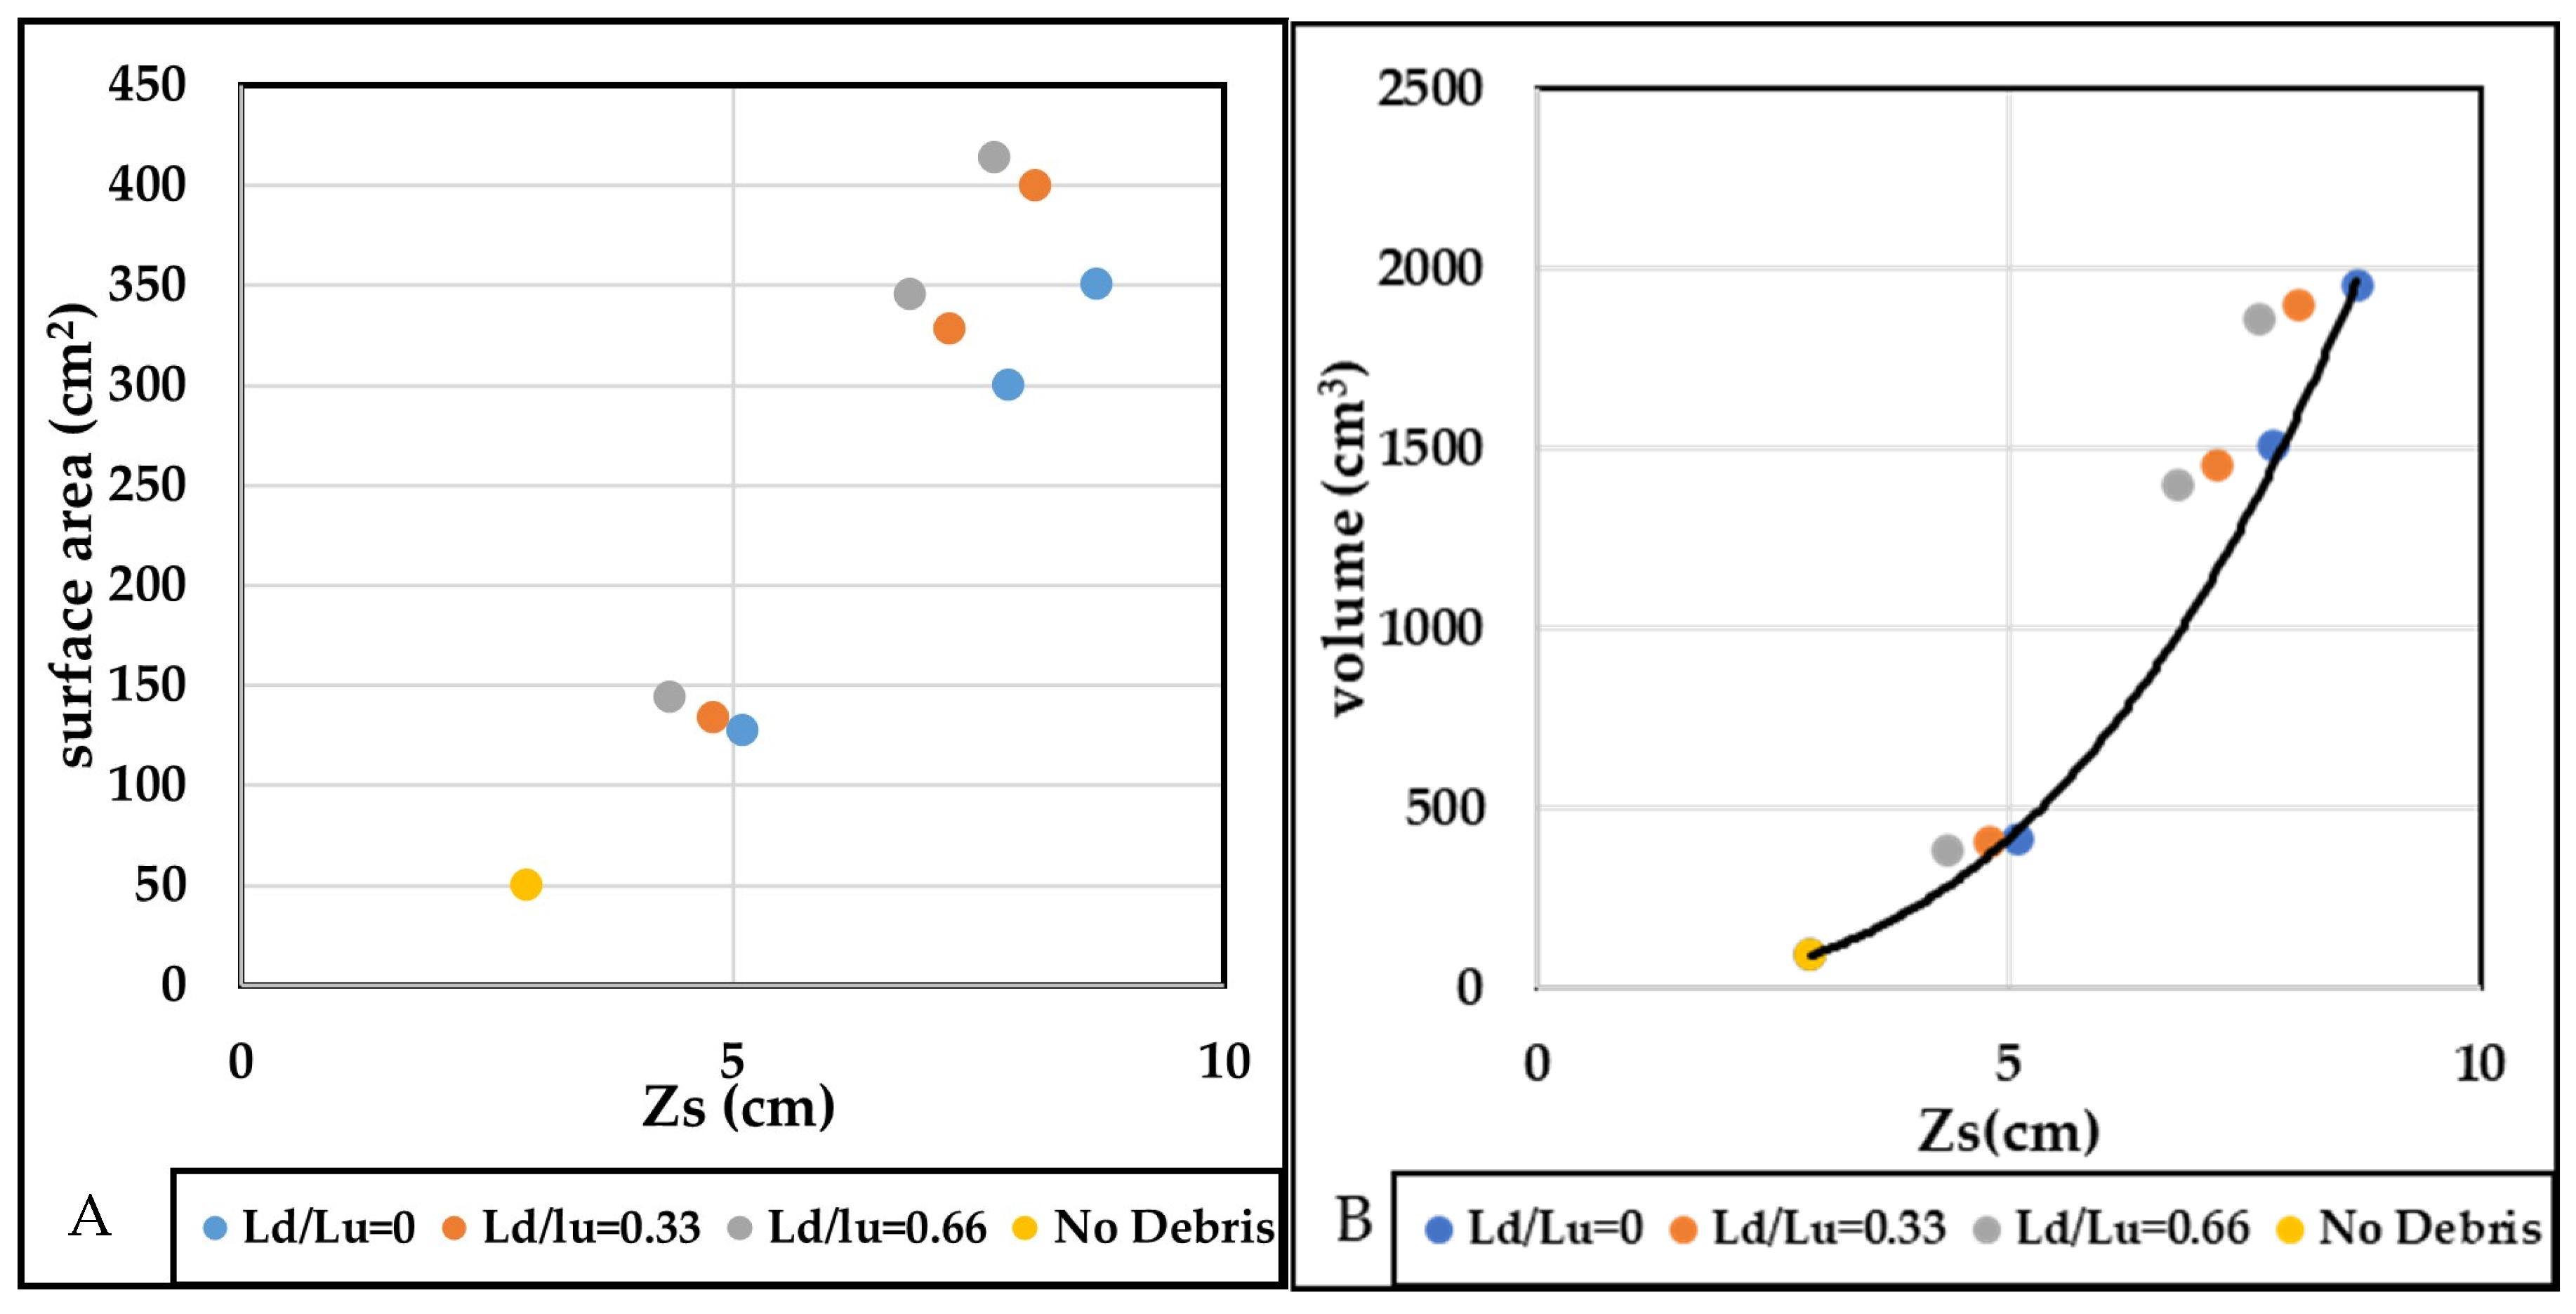
6. The Volume and Area of the Scouring Hole
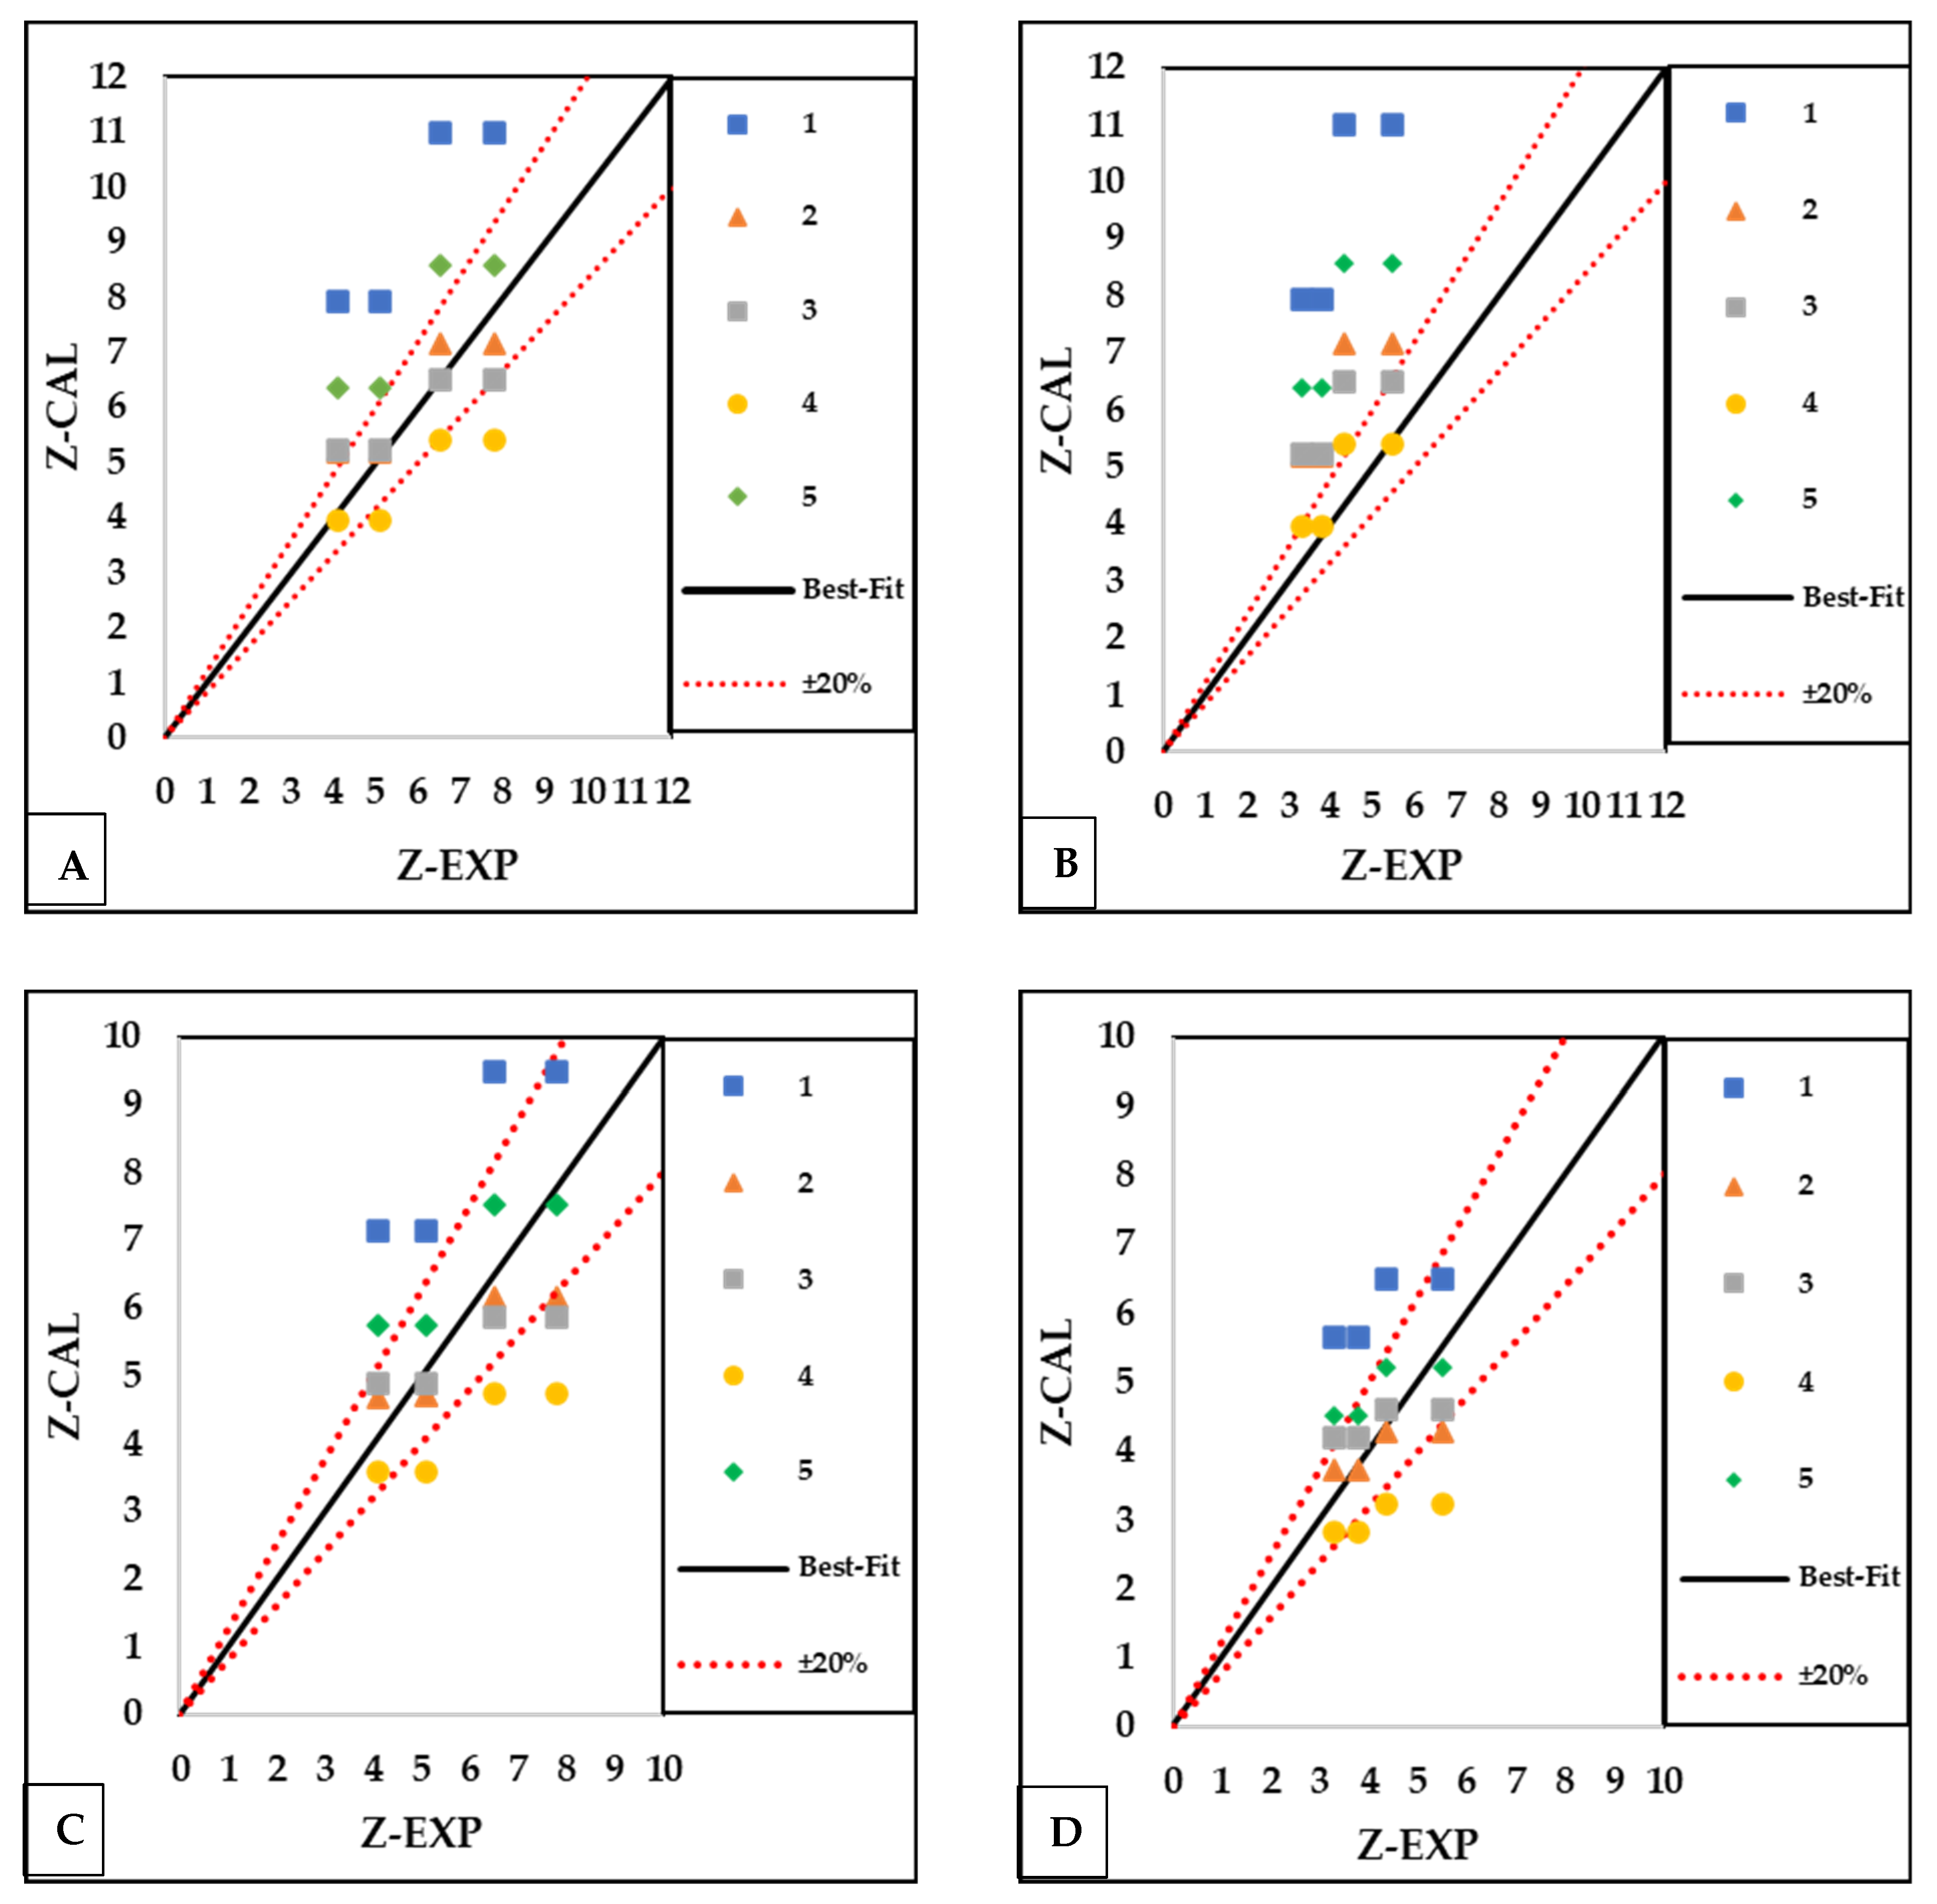
7. Predicting Debris Scour Depth with Empirical Equations
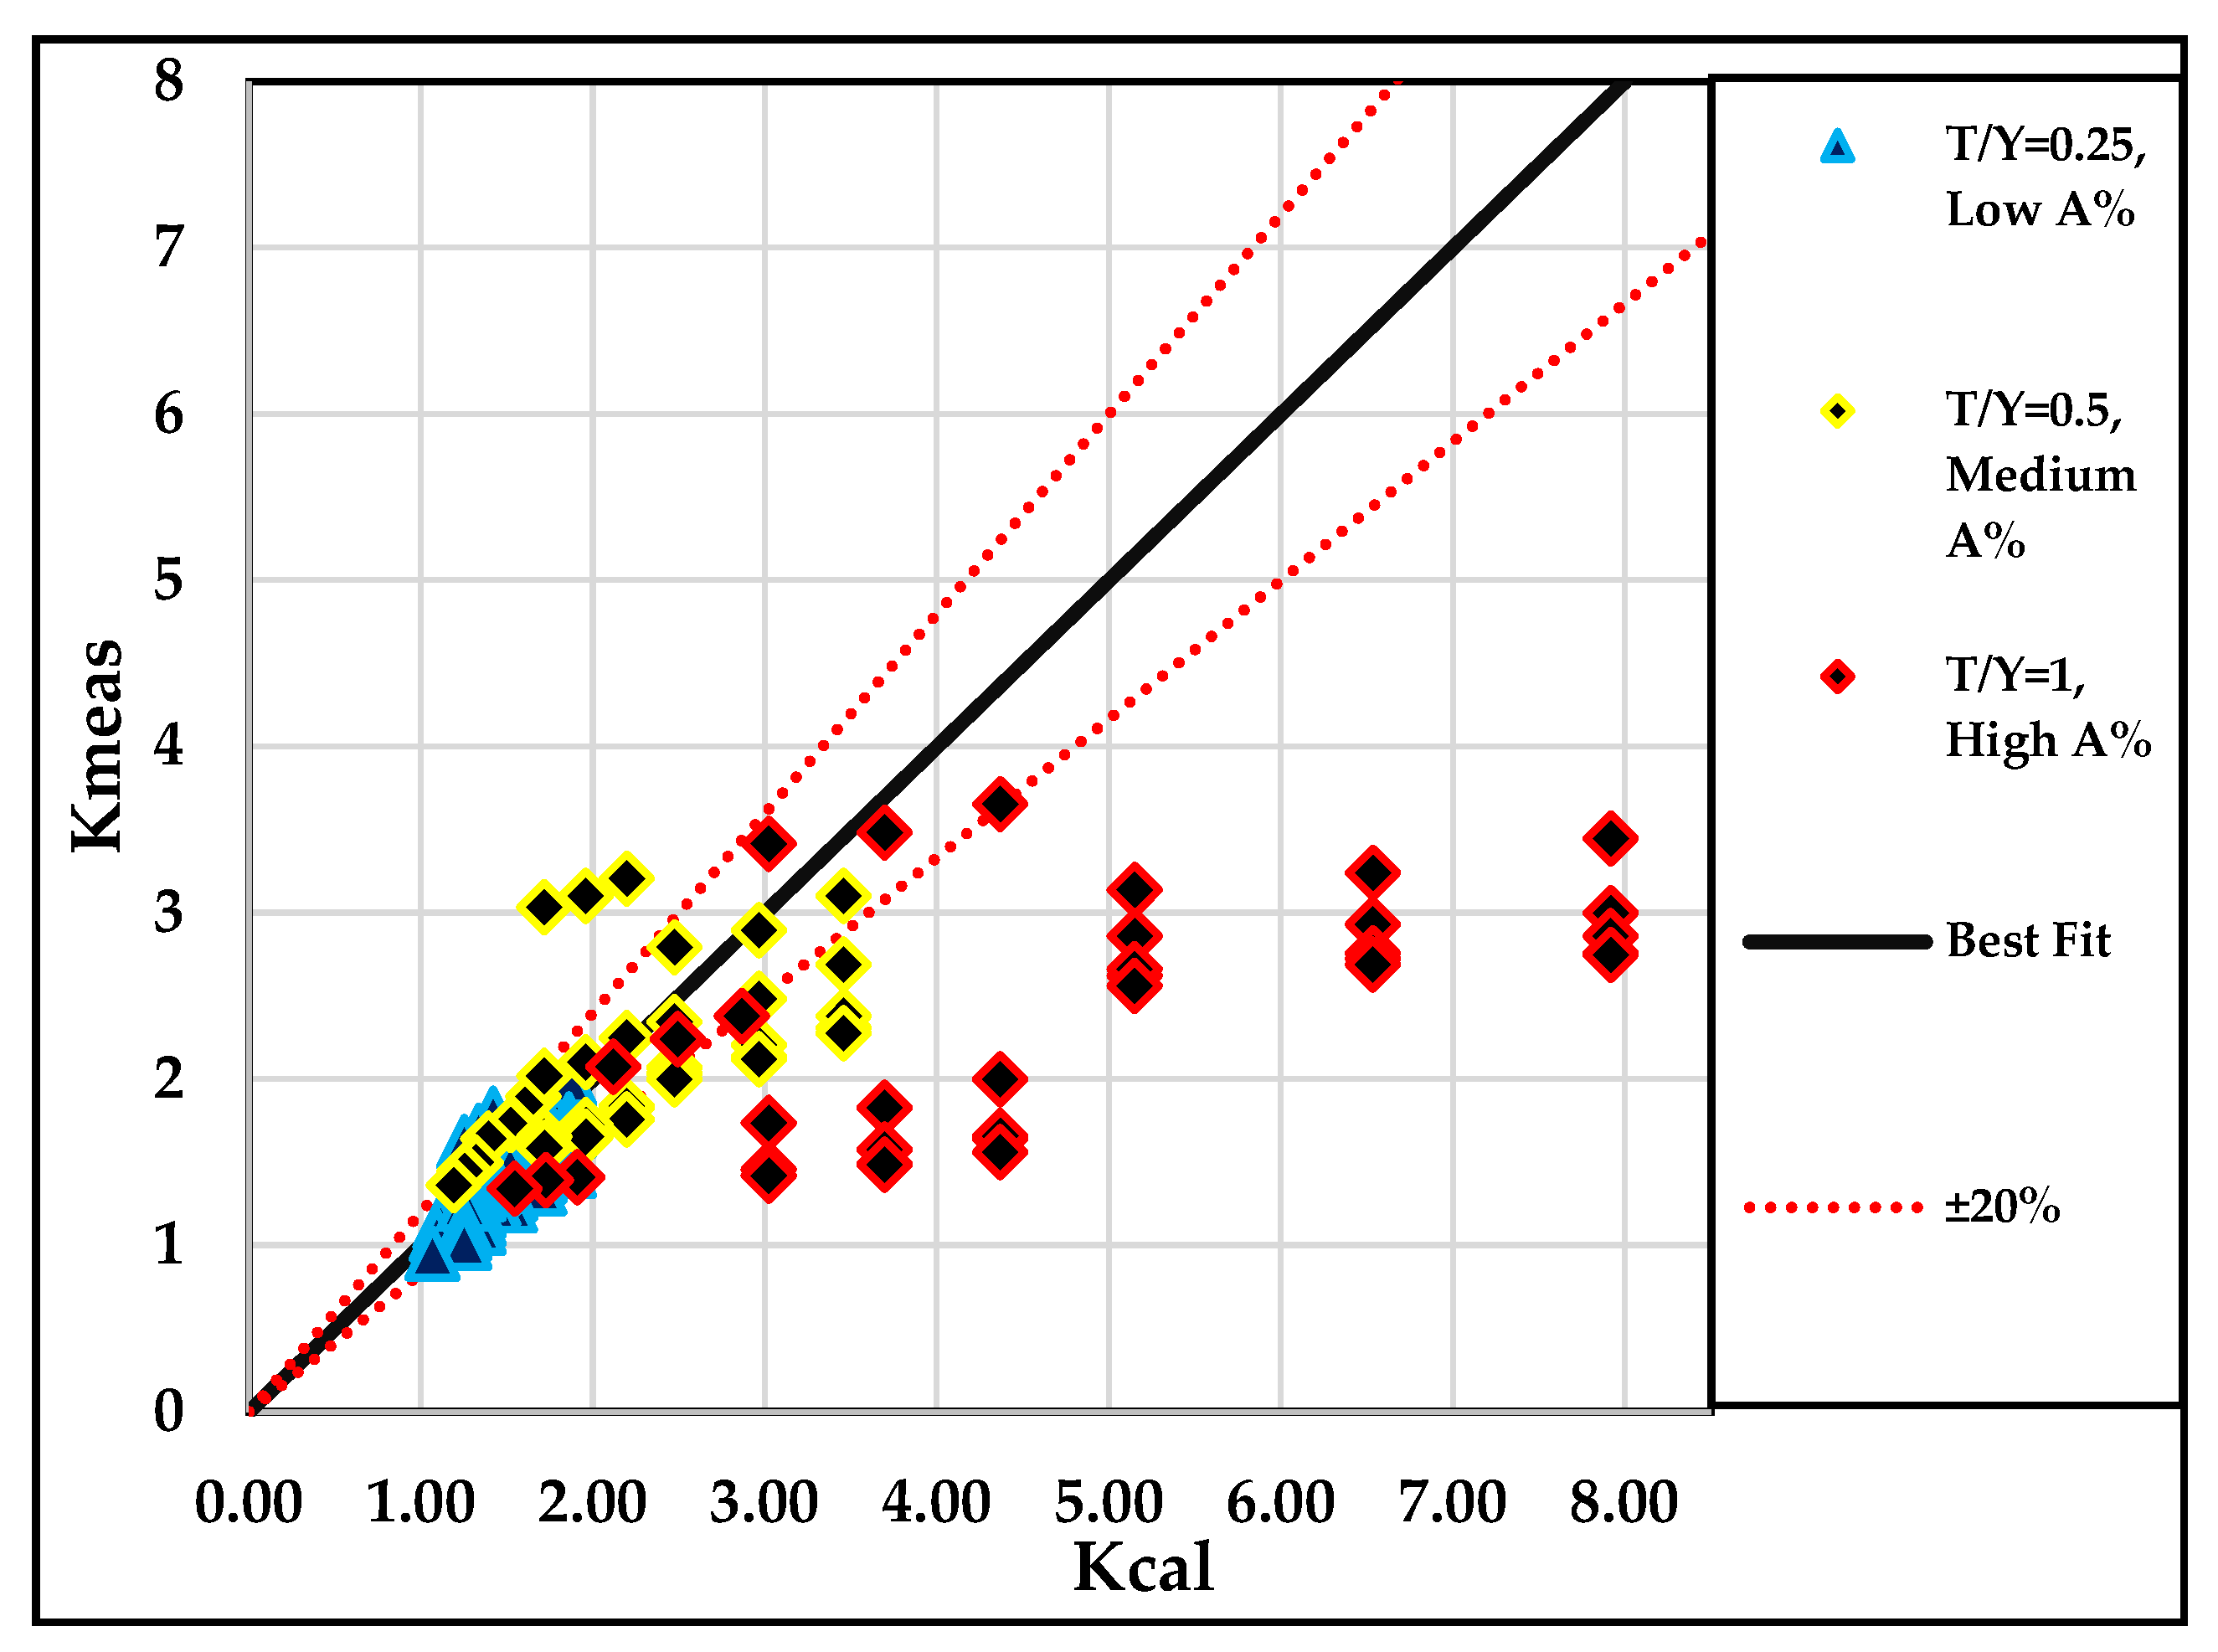
8. Derivation and Application of Debris Correction Factor Model
9. Conclusions
- The shape of the debris mass influenced the scour depth more than its size. High wedge () debris near the pier produced the deepest scour, while triangle yield () debris resulted in a minimal scour depth. Understanding these dynamics is crucial for effective mitigation strategies around bridge piers.
- Deeper scour holes and higher deposition heights were observed when debris rested entirely on the streambed (highest blockage percentage, ).
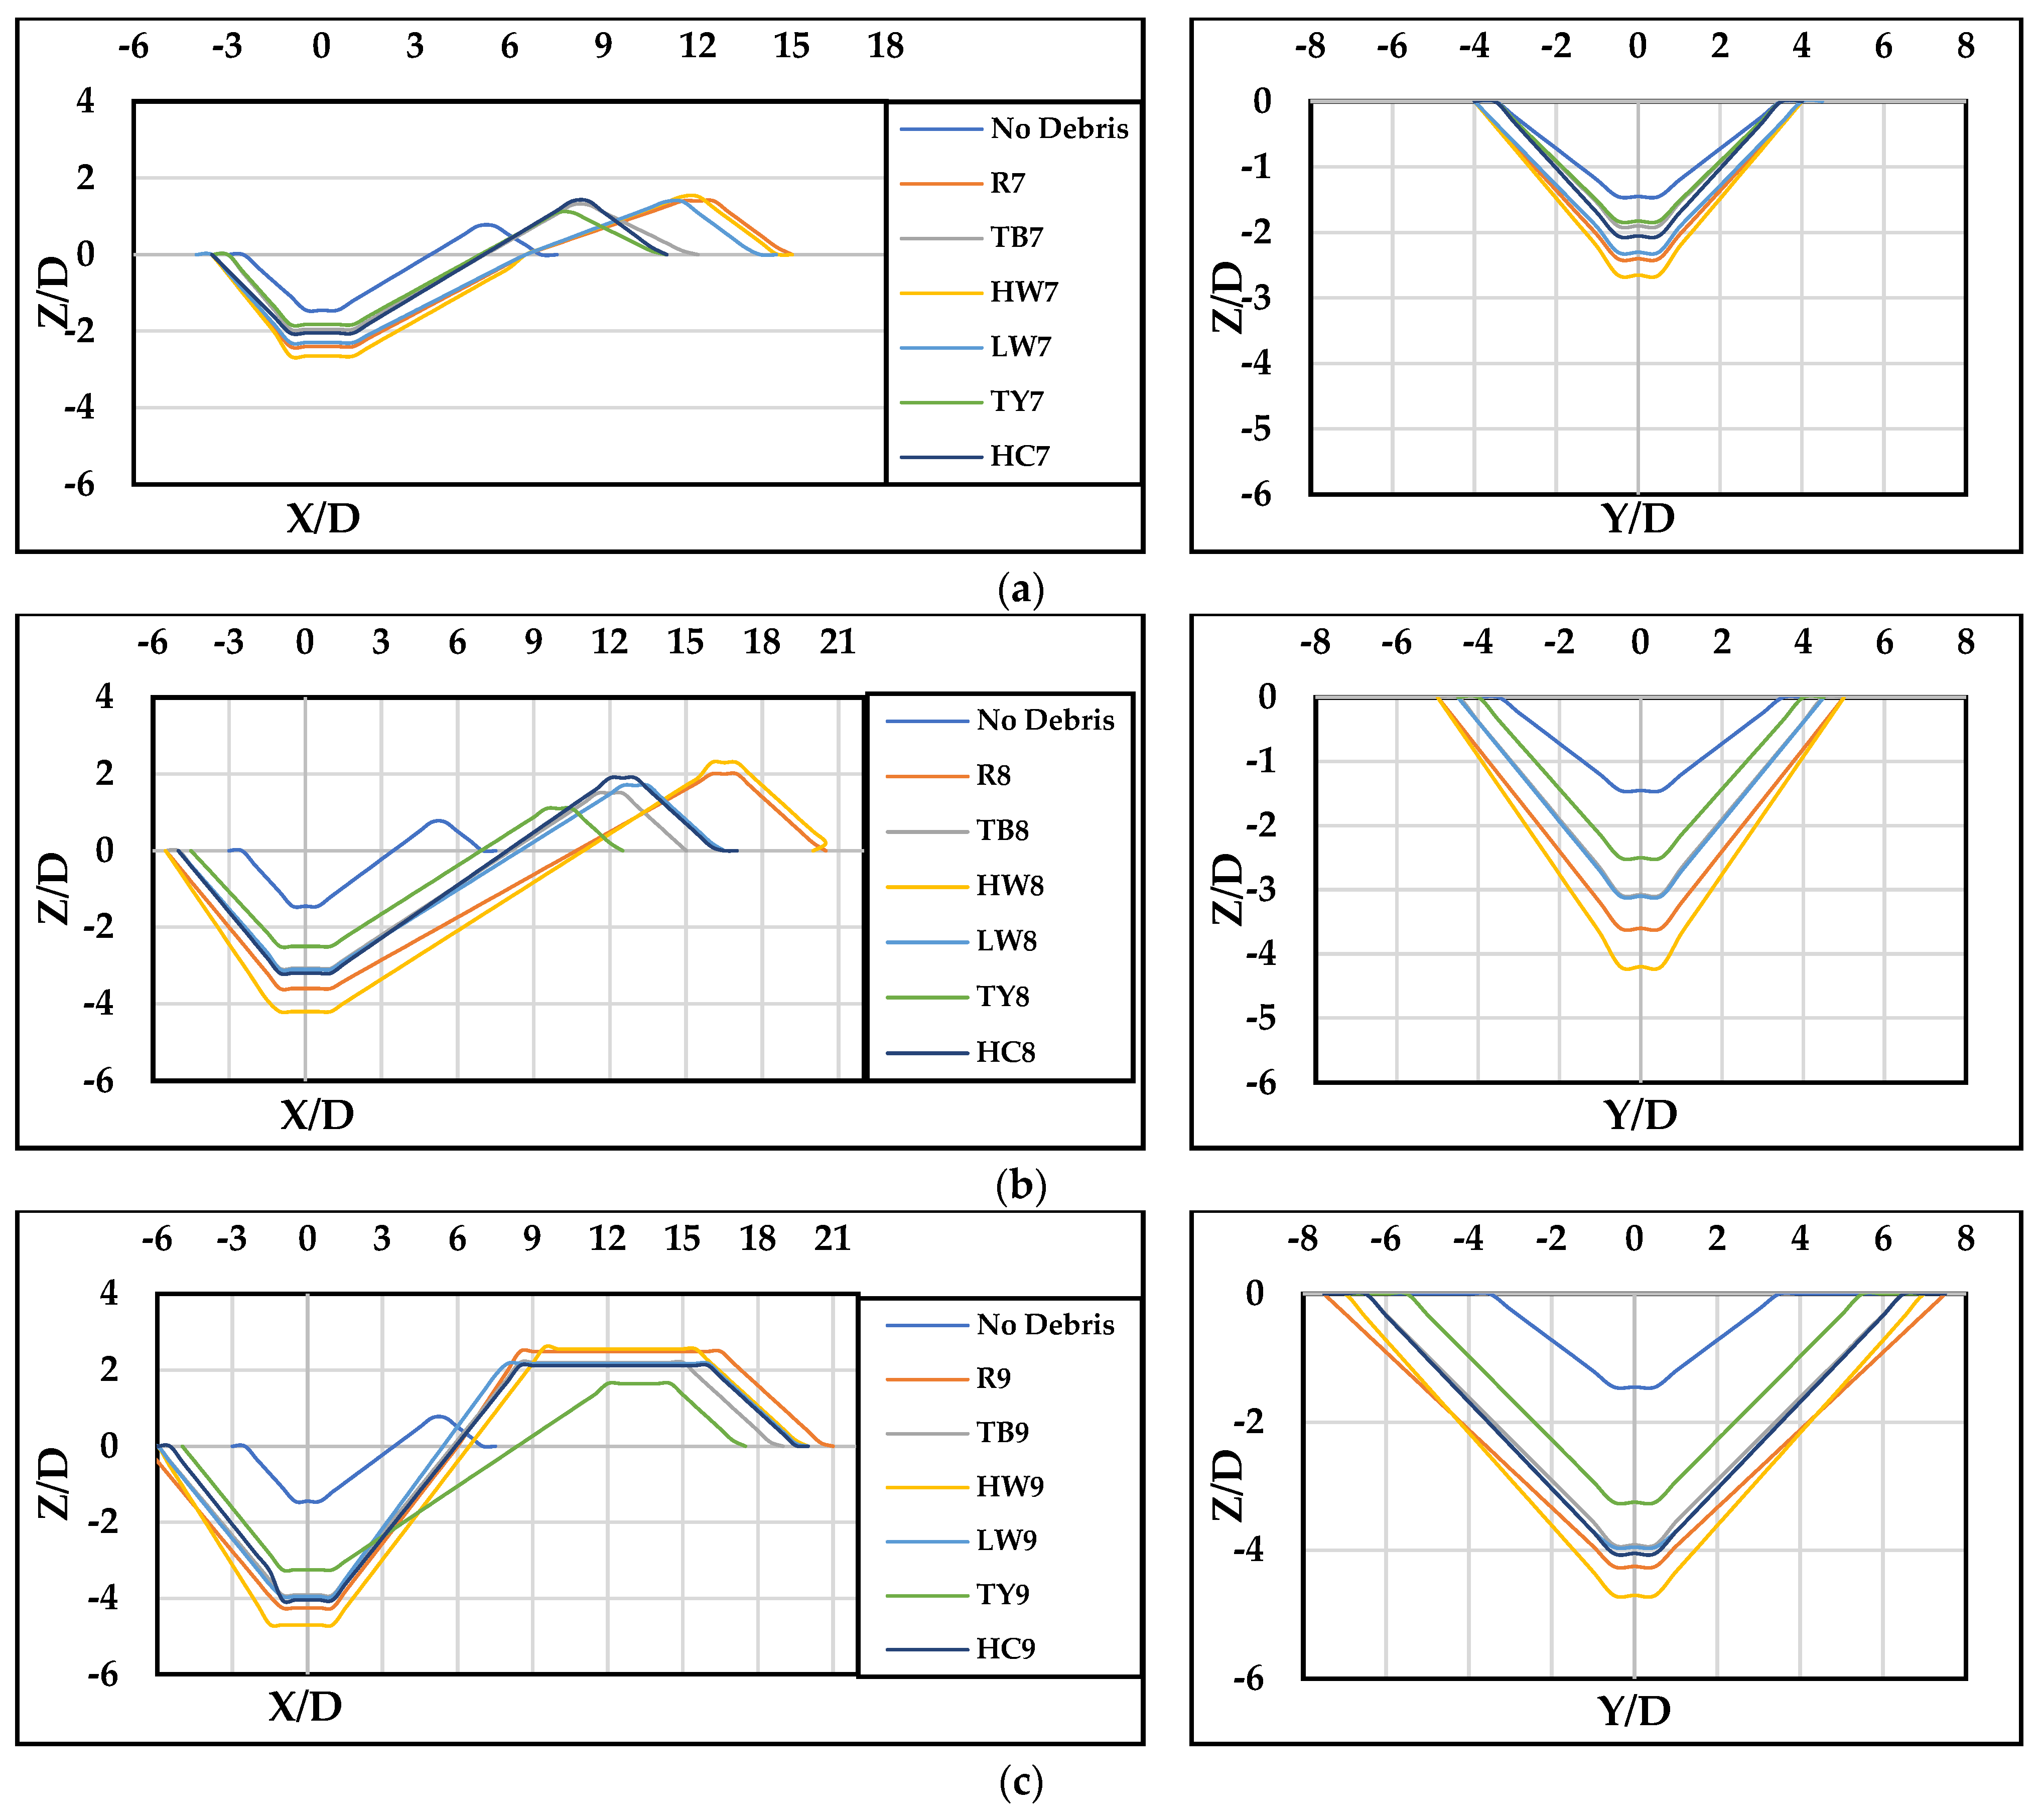
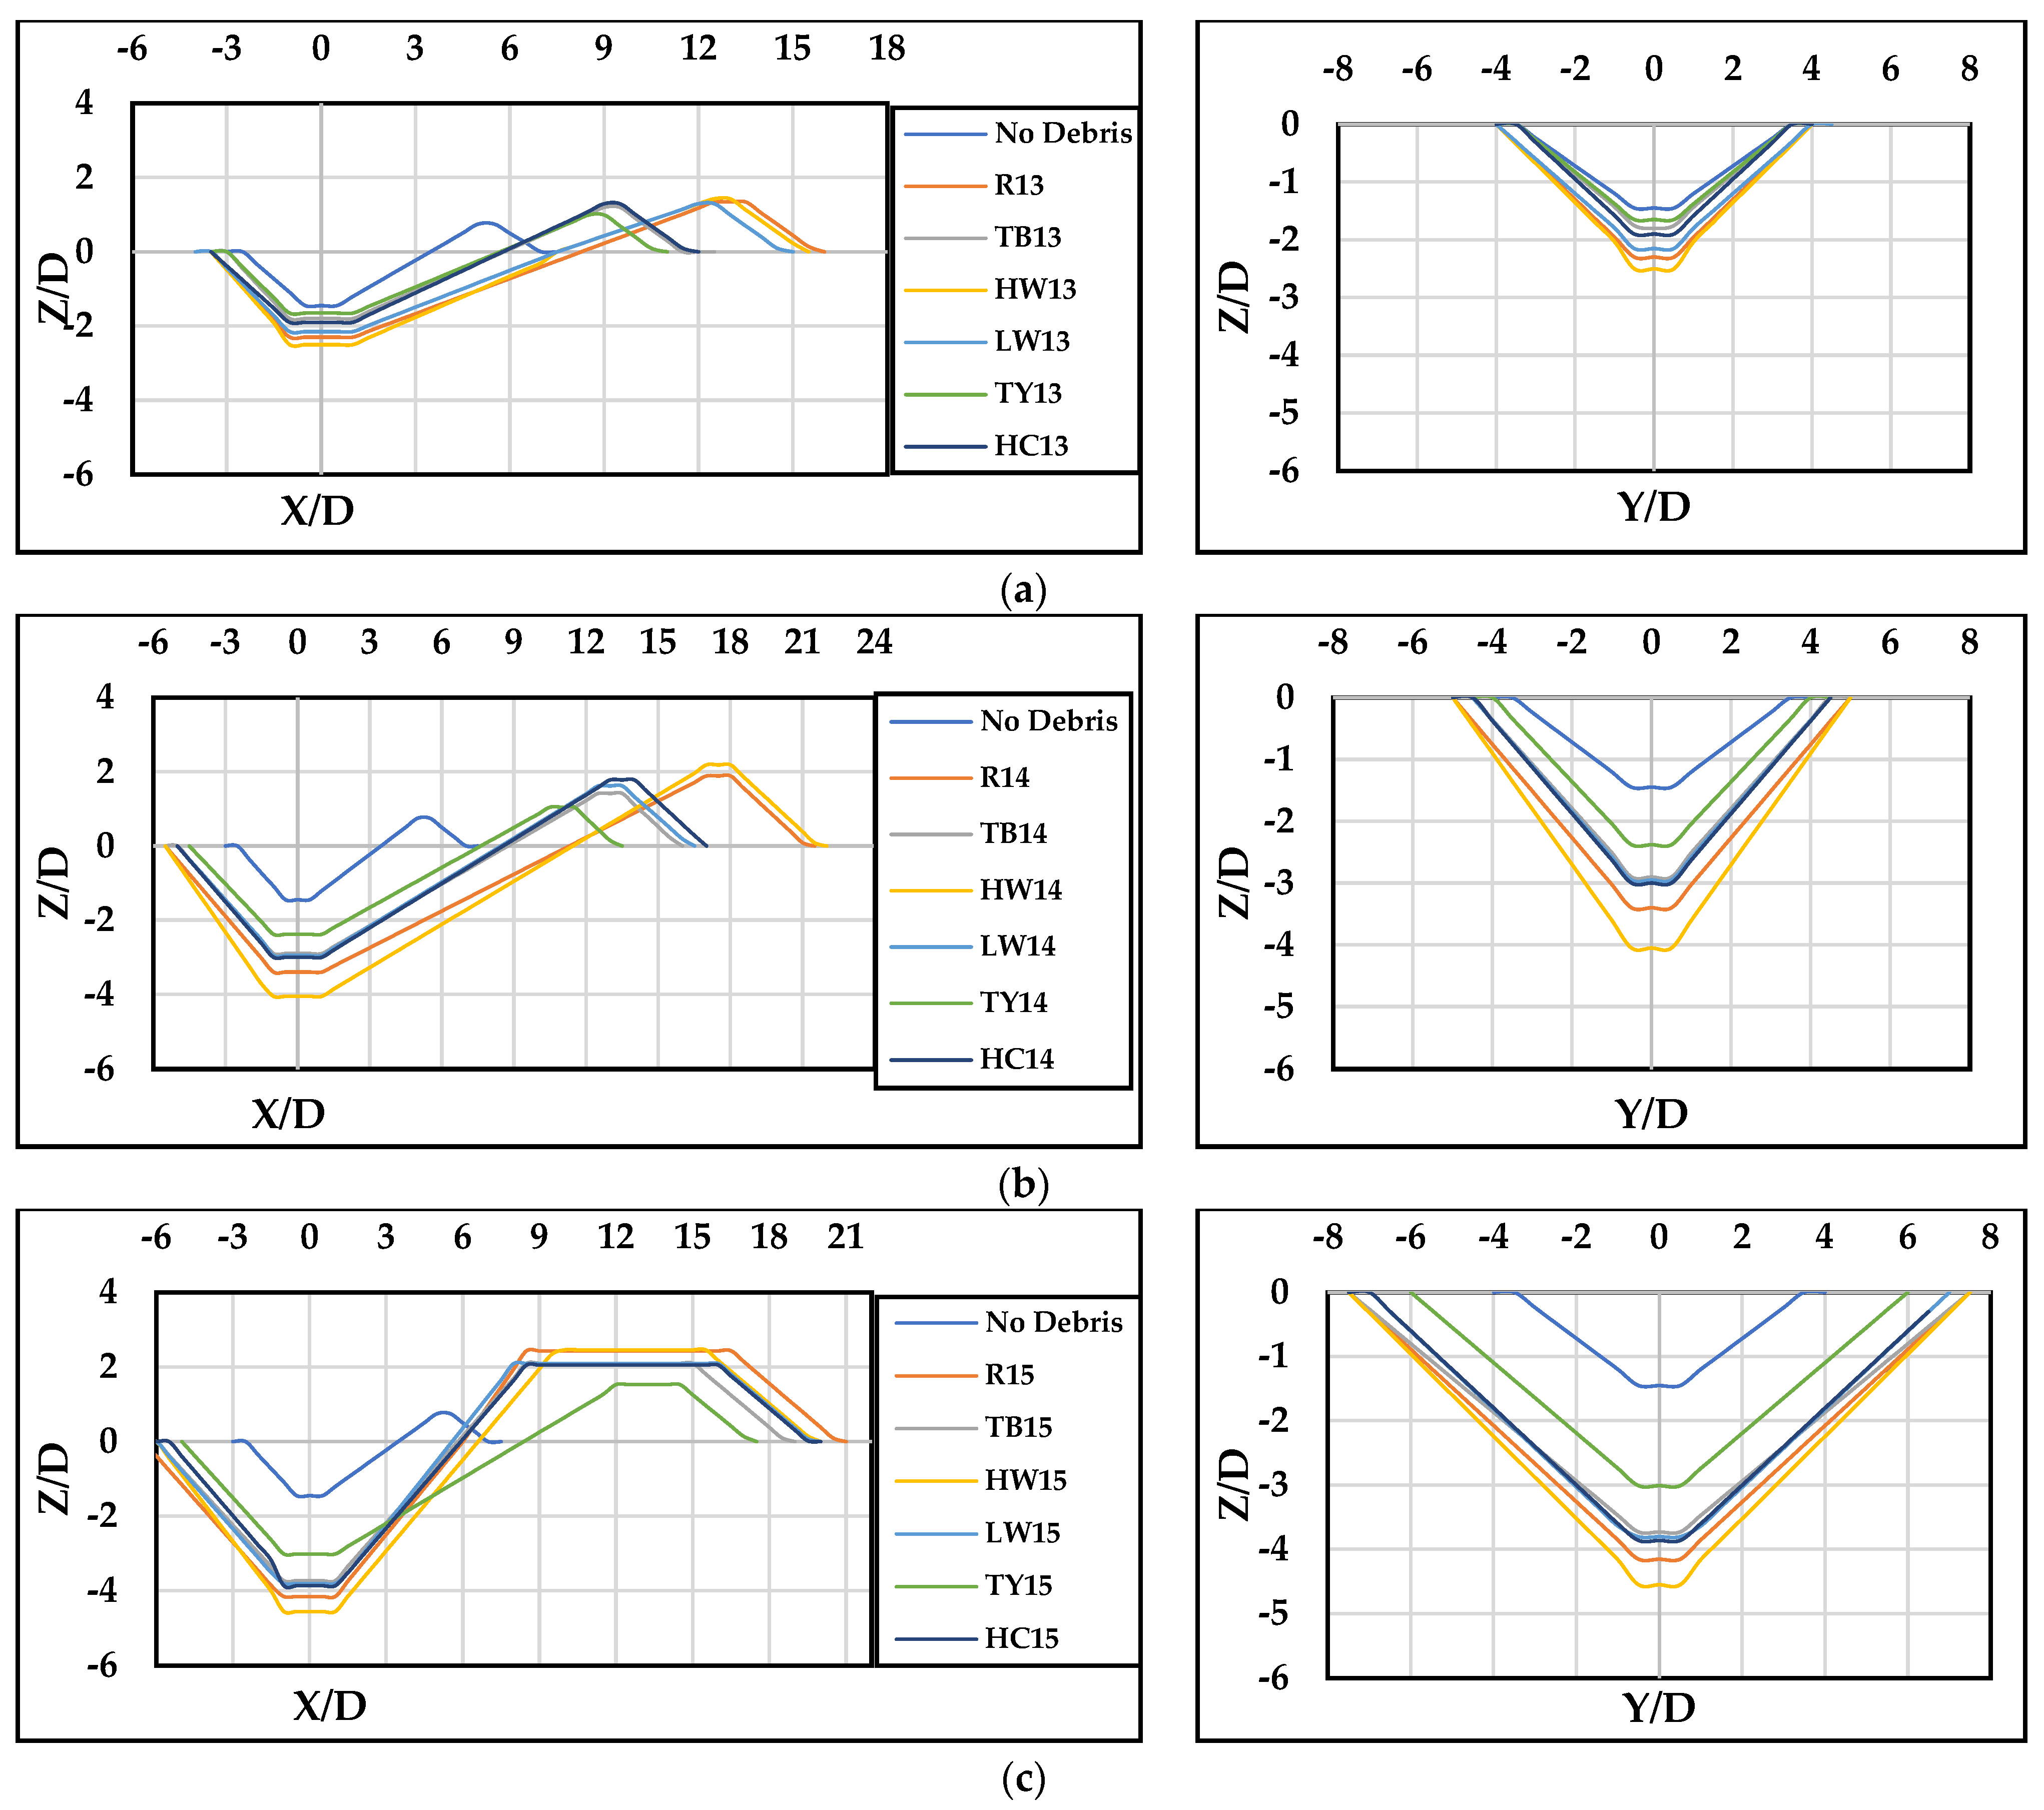
- The ratio of the length to its width () significantly influenced the shape of scour holes in both longitudinal and transverse profiles, especially when the = 0.5.
- Downstream extension of debris () can reduce the scour depth directly below the pier, possibly due to flow deflection. However, it can also lead to a larger overall scour hole area.
- The study proposed a novel debris correction factor model (Equation (10)) that considered the debris shape (), obstruction ratio (), and other geometric parameters. This model demonstrated good agreement with experimental data and can be used to improve scour depth predictions in scenarios with debris accumulation.
- Debris presence significantly altered the dimensions of the scour hole, with rectangular debris causing a substantial increase in area and volume. The extension of debris downstream primarily increased the scour area rather than affecting the scour depth across different debris shapes.
10. Limitations and Further Research
- The study’s reliance on a narrow flume width may limit its representation of larger piers and debris behavior, potentially leading to inaccuracies in assessing scouring effects during severe floods.
- Although assigning a uniform debris width aimed at optimizing lateral scour, the study acknowledges potential impacts on scour hole dimensions, particularly when the effective width exceeds 10% of the flume ().
- When more than one−third of the flow breadth is restricted, local flow velocity effects may differ, potentially influencing scouring trends around the pier.
- Due to the formidable challenge of developing a suitable debris model with appropriate density, the study did not fully explore the dynamic interaction between debris and flow.
- Maintaining a constant width () for the debris triangle yield () shape ensures consistency but may lead to variations in wall inclination, potentially affecting flow dynamics.
- The study established an empirical equation developed from limited experimental datasets. Therefore, it may not adequately capture the complexity of real−world scenarios, necessitating careful analysis of the findings.
Author Contributions
Funding
Data Availability Statement
Conflicts of Interest
References
- Wardhana, K.; Hadipriono, F.C. Analysis of recent bridge failures in the United States. J. Perform. Constr. Facil. 2003, 17, 144–150. [Google Scholar] [CrossRef]
- Melville, B.W. Local Scour at Bridge Sites. Ph.D. Dissertation, Researchspace, Auckland, New Zealand, 1975. [Google Scholar]
- Breusers, H.N.C.; Nicollet, G.; Shen, H.W. Local scour around cylindrical piers. J. Hydraul. Res. 1977, 15, 211–252. [Google Scholar] [CrossRef]
- Breusers, H.N.C.; Raudkivi, A.J.; International Association for Hydraulic Research. Scouring; Breusers, H.N.C., Raudkivi, A.J., Eds.; Balkema: Rotterdam, The Netherlands, 1991. [Google Scholar]
- Chiew, Y.-M.; Melville, B.W. Local scour around bridge piers. J. Hydraul. Res. 1987, 25, 15–26. [Google Scholar] [CrossRef]
- Muzzammil, M.; Gangadhariah, T. The mean characteristics of horseshoe vortex at a cylindrical pier. J. Hydraul. Res. 2003, 41, 285–297. [Google Scholar] [CrossRef]
- Dey, S.; Raikar, R.V. Characteristics of horseshoe vortex in developing scour holes at piers. J. Hydraul. Eng. 2007, 133, 399–413. [Google Scholar] [CrossRef]
- Das, S.; Das, R.; Mazumdar, A. Vorticity and circulation of horseshoe vortex in equilibrium scour holes at different piers. J. Inst. Eng. Ser. A 2014, 95, 109–115. [Google Scholar] [CrossRef]
- Kirkil, G.; Constantinescu, S.G.; Ettema, R. Coherent structures in the flow field around a circular cylinder with scour hole. J. Hydraul. Eng. 2008, 134, 572–587. [Google Scholar] [CrossRef]
- Misuriya, G.; Eldho, T.I.; Mazumder, B.S. Estimation of the local scour around the cylindrical pier over the gravel bed for a low coarseness ratio. Int. J. River Basin Manag. 2023, 1–11. [Google Scholar] [CrossRef]
- Melville, B.W.; Coleman, S.E. Bridge Scour; Water Resources Publications, LLC: Littleton, CO, USA, 2000; 550p. [Google Scholar]
- Escauriaza, C.; Sotiropoulos, F. Initial stages of erosion and bedform development in a turbulent flow around a cylindrical pier. J. Geophys. Res. Earth Surf. 2011, 116, F03007. [Google Scholar] [CrossRef]
- Sheppard, D.M.; Odeh, M.; Glasser, T. Large-scale clear-water local pier scour experiments. J. Hydraul. Eng. 2004, 130, 957–963. [Google Scholar] [CrossRef]
- Link, O.; González, C.; Maldonado, M.; Escauriaza, C. Coherent structure dynamics and sediment particle motion around a cylindrical pier in developing scour holes. Acta Geophys. 2012, 60, 1689–1719. [Google Scholar] [CrossRef]
- Apsilidis, N.; Diplas, P.; Dancey, C.L.; Bouratsis, P. Time-resolved flow dynamics and Reynolds number effects at a wall–cylinder junction. J. Fluid Mech. 2015, 776, 475–511. [Google Scholar] [CrossRef]
- Bouratsis, P.; Diplas, P.; Dancey, C.L.; Apsilidis, N. Quantitative spatiotemporal characterization of scour at the base of a cylinder. Water 2017, 9, 227. [Google Scholar] [CrossRef]
- Palermo, M.; Pagliara, S.; Roy, D. Effect of debris accumulation on scour evolution at bridge pier in bank proximity. J. Hydrol. Hydromech. 2021, 69, 108–118. [Google Scholar] [CrossRef]
- Diehl, T.H. Potential Drift Accumulation at Bridges; Report FHWA-RD-97-028; U.S. Department of Transportation, Federal Highway Administration: Washington, DC, USA, 1997.
- Lagasse, P.F. Effects of Debris on Bridge Pier Scour; Transportation Research Board: Washington, DC, USA, 2010; Volume 653. [Google Scholar]
- Hamill, L. Bridge Hydraulics, 1st ed.; CRC Press: London, UK, 1999; 384p. [Google Scholar] [CrossRef]
- Pagliara, S.; Carnacina, I. Influence of wood debris accumulation on bridge pier scour. J. Hydraul. Eng. 2011, 137, 254–261. [Google Scholar] [CrossRef]
- Pagliara, S.; Carnacina, I. Influence of large woody debris on sediment scour at bridge piers. Int. J. Sediment Res. 2011, 26, 121–136. [Google Scholar] [CrossRef]
- Melville, B.W.; Dongol, D.M. Bridge pier scour with debris accumulation. J. Hydraul. Eng. 1992, 118, 1306–1310. [Google Scholar] [CrossRef]
- Oliveto, G.; Hager, W.H. Further results to time-dependent local scour at bridge elements. J. Hydraul. Eng. 2005, 131, 97–105. [Google Scholar] [CrossRef]
- Raudkivi, A.J.; Ettema, R. Clear-water scour at cylindrical piers. J. Hydraul. Eng. 1983, 109, 338–350. [Google Scholar] [CrossRef]
- Raudkivi, A.J.; Ettema, R. Scour at cylindrical bridge piers in armored beds. J. Hydraul. Eng. 1985, 111, 713–731. [Google Scholar] [CrossRef]
- Melville, B.W.; Sutherland, A.J. Design method for local scour at bridge piers. J. Hydraul. Eng. 1988, 114, 1210–1226. [Google Scholar] [CrossRef]
- Mia, M.F.; Nago, H. Closure to ‘Design Method of Time-Dependent Local Scour at Circular Bridge Pier’ by Md. Faruque Mia and Hiroshi Nago. J. Hydraul. Eng. 2004, 130, 1213. [Google Scholar] [CrossRef]
- Chiew, Y.M.; Ettema, R. Similitude in laboratory pier scour studies. In Proceedings of the XXX IAHR Congress, Thessaloniki, Greece, 24–29 August 2003; pp. 269–276. [Google Scholar]
- Yang, S.-Q.; Lim, S.-Y. Mechanism of energy transportation and turbulent flow in a 3D channel. J. Hydraul. Eng. 1997, 123, 684–692. [Google Scholar] [CrossRef]
- Raikar, R.V.; Dey, S. Maximum scour depth at piers in armor-beds. KSCE J. Civ. Eng. 2009, 13, 137–142. [Google Scholar] [CrossRef]
- Shields, A. Anwendung der Aehnlichkeitsmechanik und der Turbulenzforschung auf die Geschiebebewegung. Ph.D. Thesis, Technical University of Berlin, Berlin, Germany, 1936. [Google Scholar]
- Sheppard, D.M.; Melville, B.; Demir, H. Evaluation of existing equations for local scour at bridge piers. J. Hydraul. Eng. 2014, 140, 14–23. [Google Scholar] [CrossRef]
- Oliveto, G.; Hager, W.H. Temporal evolution of clear-water pier and abutment scour. J. Hydraul. Eng. 2002, 128, 811–820. [Google Scholar] [CrossRef]
- Roulund, A.; Sumer, B.M.; Fredsøe, J.; Michelsen, J. Numerical and experimental investigation of flow and scour around a circular pile. J. Fluid Mech. 2005, 534, 351–401. [Google Scholar] [CrossRef]
- Ebrahimi, M.; Kripakaran, P.; Prodanović, D.M.; Kahraman, R.; Riella, M.; Tabor, G.; Arthur, S.; Djordjević, S. Experimental study on scour at a sharp-nose bridge pier with debris blockage. J. Hydraul. Eng. 2018, 144, 4018071. [Google Scholar] [CrossRef]
- Pagliara, S.; Carnacina, I. Temporal scour evolution at bridge piers: Effect of wood debris roughness and porosity. J. Hydraul. Res. 2010, 48, 3–13. [Google Scholar] [CrossRef]
- Panici, D.; de Almeida, G.A.M. Influence of pier geometry and debris characteristics on wood debris accumulations at bridge piers. J. Hydraul. Eng. 2020, 146, 4020041. [Google Scholar] [CrossRef]
- Dongol, D.M.S. Effect of Debris Rafting on Local Scour at Bridge Piers; Report No. 473; School of Engineering, The University of Auckland: Auckland, New Zealand, 1989; 98p. [Google Scholar]
- Zevenbergen, L.W.; Lagasse, P.F.; Clopper, P.E. Effects of debris on bridge pier scour. In Proceedings of the World Environmental and Water Resources Congress 2007: Restoring Our Natural Habitat, Tampa, FL, USA, 15–19 May 2007; pp. 1–10. [Google Scholar]
- Hamidifar, H.; Nezhadian, D.M.A.; Carnacina, I. Experimental study of debris-induced scour around a slotted bridge pier. Acta Geophys. 2022, 70, 2325–2339. [Google Scholar] [CrossRef]
- Zhao, M.; Cheng, L.; Zang, Z. Experimental and numerical investigation of local scour around a submerged vertical circular cylinder in steady currents. Coast. Eng. 2010, 57, 709–721. [Google Scholar] [CrossRef]
- Melville, B.W.; Chiew, Y.-M. Time scale for local scour at bridge piers. J. Hydraul. Eng. 1999, 125, 59–65. [Google Scholar] [CrossRef]
- Schalko, I.; Lageder, C.; Schmocker, L.; Weitbrecht, V.; Boes, R.M. Laboratory flume experiments on the formation of spanwise large wood accumulations: Part II—Effect on local scour. Water Resour. Res. 2019, 55, 4871–4885. [Google Scholar] [CrossRef]
- Aly, A.M.; Dougherty, E. Bridge pier geometry effects on local scour potential: A comparative study. Ocean Eng. 2021, 234, 109326. [Google Scholar] [CrossRef]
- Richardson, E.V.; Davies, S.R. Evaluating Scour at Bridge Pier, 4th ed.; Federal Highway Administration Report: Springfield, VA, USA, 2001.
- May, R.W.P.; Ackers, J.C.; Kirby, A.M. Manual on Scour at Bridges and Other Hydraulic Structures; Ciria: London, UK, 2002; Volume 551. [Google Scholar]


| Cases | (min) | |||||||
|---|---|---|---|---|---|---|---|---|
| [2] | 9.0 | - | 220 | - | - | - | - | - |
| [5] | 9.8–14 | - | 100 | - | - | - | - | - |
| [13] | 6.7 | - | 2460–34,800 | - | - | - | - | - |
| [19,40] | 24 | 1.96 | 480–4320 | 6–24 | 3–24 | 0.5–1.5 | 0.3–1 | - |
| [21,22] | 8.3–20 | 1–7.7 | 360–5760 | 1.6–10 | 3 | 0.18–1.9 | 0.07–0.53 | 0–0.5 |
| [23] | 26 | 3.8–8.4 | 9000 | 3–7 | 3–7 | 1 | 0.09–1.95 | 1 |
| [35] | 6–7.5 | - | 120–180 | - | - | - | - | - |
| [36] | 12 | 2 | 300 | 0.015 | 0.32–3 | 0.05–0.5 | 0.2–0.4 | - |
| [41] | 10 | 2 | 360 | 5 | 0.3–2.5 | 0.06–0.50 | 0.07–0.18 | 0 |
| Current study | 15 | 2.5 | 360–1440 | 6 | 3–6 | 0.5–1 | 0.25–1 | 0–0.66 |
| Symbol | (cm) | (cm) | (cm) | (cm2) | (cm2) | |
|---|---|---|---|---|---|---|
| 3 | 0 | 0.25 | 8.3 | 30 | 54 | |
| 6.0 | 3.0 | (3.47) * | (15) | (36.5) | ||
| 3 | 0 | 0.5 | 16.7 | 60 | 84 | |
| 6.0 | 6.0 | (6.94) | (30) | (49) | ||
| 3 | 0 | 1.0 | 33.3 | 120 | 144 | |
| 6.0 | 12.0 | (13.88) | 60) | (74) | ||
| 6 | 0 | 0.25 | 8.3 | 30 | 54 | |
| 12.0 | 3.0 | (3.47) * | (15) | (36.5) | ||
| 6 | 0 | 0.5 | 16.7 | 60 | 84 | |
| 12.0 | 6.0 | (6.94) | (30) | (49) | ||
| 6 | 0 | 1.0 | 33.3 | 120 | 144 | |
| 12.0 | 12.0 | (13.88) | 60) | (74) | ||
| 3 | 0.33 | 0.25 | 8.3 | 30 | 54 | |
| 6.0 | 2.0 | 3.0 | (3.47) * | (15) | (36.5) | |
| 3 | 0.33 | 0.5 | 16.7 | 60 | 84 | |
| 6.0 | 2.0 | 6.0 | (6.94) | (30) | (49) | |
| 3 | 0.33 | 1.0 | 33.3 | 120 | 144 | |
| 6.0 | 2.0 | 12.0 | (13.88) | 60) | (74) | |
| 6 | 0.33 | 0.25 | 8.3 | 30 | 54 | |
| 12.0 | 4.0 | 3.0 | (3.47) * | (15) | (36.5) | |
| 6 | 0.33 | 0.5 | 16.7 | 60 | 84 | |
| 12.0 | 4.0 | 6.0 | (6.94) | (30) | (49) | |
| 6 | 0.33 | 1.0 | 33.3 | 120 | 144 | |
| 12.0 | 4.0 | 12.0 | (13.88) | 60) | (74) | |
| 3 | 0.66 | 0.25 | 8.3 | 30 | 54 | |
| 6.0 | 4 | 3.0 | (3.47) * | (15) | (36.5) | |
| 3 | 0.66 | 0.5 | 16.7 | 60 | 84 | |
| 6.0 | 4 | 6.0 | (6.94) | (30) | (49) | |
| 3 | 0.66 | 1.0 | 33.3 | 120 | 144 | |
| 6.0 | 4 | 12.0 | (13.88) | 60) | (74) | |
| 6 | 0.66 | 0.25 | 8.3 | 30 | 54 | |
| 12.0 | 8.0 | 3.0 | (3.47) * | (15) | (36.5) | |
| 6 | 0.66 | 0.5 | 16.7 | 60 | 84 | |
| 12.0 | 8.0 | 6.0 | (6.94) | (30) | (49) | |
| 6 | 0.66 | 1.0 | 33.3 | 120 | 144 | |
| 12.0 | 8.0 | 12.0 | (13.88) | 60) | (74) |
| Cases () cm | (cm) | (cm), Equation (1) | (cm) [27] | (cm) [43] | (cm) [46] | (cm) [47] | (cm) [33] |
|---|---|---|---|---|---|---|---|
| 5.1 | 3.30 | 7.92 | 5.2 | 5.22 | 3.96 | 6.36 | |
| 7.8 | 4.60 | 11 | 7.1 | 6.5 | 5.4 | 8.58 | |
| 4.1 | 3.30 | 7.92 | 5.2 | 5.22 | 3.96 | 6.36 | |
| 6.52 | 4.60 | 11 | 7.1 | 6.5 | 5.4 | 8.58 | |
| 3.8 | 3.30 | 7.92 | 5.2 | 5.22 | 3.96 | 6.36 | |
| 5.5 | 4.60 | 11 | 7.1 | 6.5 | 5.4 | 8.58 | |
| 3.3 | 3.30 | 7.92 | 5.2 | 5.22 | 3.96 | 6.36 | |
| 4.34 | 4.60 | 11 | 7.1 | 6.5 | 5.4 | 8.58 |
| Cases () cm | (cm) | (cm), Equation (2) | (cm) [27] | (cm) [43] | (cm) [46] | (cm) [47] | (cm) [33] |
|---|---|---|---|---|---|---|---|
| 5.1 | 2.98 | 7.14 | 4.68 | 4.88 | 3.57 | 5.76 | |
| 7.8 | 3.95 | 9.48 | 6.16 | 5.87 | 4.74 | 7.52 | |
| 4.1 | 2.98 | 7.14 | 4.68 | 4.88 | 3.57 | 5.76 | |
| 6.52 | 3.95 | 9.48 | 6.16 | 5.87 | 4.74 | 7.52 | |
| 3.8 | 2.53 | 5.64 | 3.72 | 4.19 | 2.82 | 4.50 | |
| 5.5 | 3.05 | 6.48 | 4.26 | 4.58 | 3.24 | 5.22 | |
| 3.3 | 2.53 | 5.64 | 3.72 | 4.19 | 2.82 | 4.50 | |
| 4.34 | 3.05 | 6.48 | 4.26 | 4.58 | 3.24 | 5.22 |
| The Empirical Equations | and Equations | Performance |
|---|---|---|
| Reference [27] | Equation (3) | Overestimate scour depth for both and debris, with varying degrees of accuracy ( = 3.6 and 5.3, respectively) |
| Equation (4) | The trend of overestimation for debris (= 2.4), slightly improves debris ( = 1.9). | |
| Reference [43] | Equation (3) | Alignment with actual values is evident for debris ( = 0.85), while there is a notable overestimation for debris ( = 1.9). |
| Equation (4) | debris shows close alignment with actual values ( = 0.7), while debris displays better estimation precision ( = 0.65). | |
| Reference [46] | Equation (3) | debris tends to slightly overestimate ( = 0.87), while debris shows more significant overestimation ( = 1.6). |
| Equation (4) | debris mildly underestimates ( = 1), whereas debris demonstrates improved precision ( = 0.67). | |
| Reference [47] | Equation (3) | There is a tendency toward underestimation for debris ( = 1.4). Conversely, debris shows a more accurate estimation ( = 0.63) |
| Equation (4) | Tends to underestimate: = 1.9 for debris and = 1.37 for debris. | |
| Reference [33] | Equation (3) | Tends to overestimate: = 1.7 for debris and = 3.2 for debris. |
| Equation (4) | Tends to mildly overestimate: = 1 for debris, and aligns slight overestimation with actual values: = 0.83 for debris. |
Disclaimer/Publisher’s Note: The statements, opinions and data contained in all publications are solely those of the individual author(s) and contributor(s) and not of MDPI and/or the editor(s). MDPI and/or the editor(s) disclaim responsibility for any injury to people or property resulting from any ideas, methods, instructions or products referred to in the content. |
© 2024 by the authors. Licensee MDPI, Basel, Switzerland. This article is an open access article distributed under the terms and conditions of the Creative Commons Attribution (CC BY) license (https://creativecommons.org/licenses/by/4.0/).
Share and Cite
Al-Jubouri, M.; Ray, R.P. Hydrodynamic Modeling and Comprehensive Assessment of Pier Scour Depth and Rate Induced by Wood Debris Accumulation. Hydrology 2024, 11, 52. https://doi.org/10.3390/hydrology11040052
Al-Jubouri M, Ray RP. Hydrodynamic Modeling and Comprehensive Assessment of Pier Scour Depth and Rate Induced by Wood Debris Accumulation. Hydrology. 2024; 11(4):52. https://doi.org/10.3390/hydrology11040052
Chicago/Turabian StyleAl-Jubouri, Muhanad, and Richard P. Ray. 2024. "Hydrodynamic Modeling and Comprehensive Assessment of Pier Scour Depth and Rate Induced by Wood Debris Accumulation" Hydrology 11, no. 4: 52. https://doi.org/10.3390/hydrology11040052
APA StyleAl-Jubouri, M., & Ray, R. P. (2024). Hydrodynamic Modeling and Comprehensive Assessment of Pier Scour Depth and Rate Induced by Wood Debris Accumulation. Hydrology, 11(4), 52. https://doi.org/10.3390/hydrology11040052