Abstract
White-light-emitting diodes (wLEDs) are central to next-generation lighting technologies, yet their reliance on critical raw materials (CRMs), such as rare-earth elements, raises concerns regarding sustainability and supply security. In this work, we present a simple, low-cost method to produce photoluminescent carbon-based nanostructures—known as oxidative debris (OD)—via alkaline treatment of graphene oxide (GO) using KOH solutions ranging from 0.04 M to 1.78 M. The resulting OD, isolated from the supernatant after acid precipitation, exhibits strong and tunable photoluminescence (PL) across the visible spectrum. Emission peaks shift from blue (~440 nm) to green (~500 nm) and yellow (~565 nm) as a function of treatment conditions, with excitation wavelengths between 300 and 390 nm. Optical, morphological. and compositional analyses were performed using UV-Vis, AFM, FTIR, and Raman spectroscopy, confirming the presence of highly oxidized aromatic domains. The blue-emitting (S2) and green/yellow-emitting (R2) fractions were successfully separated and characterized, demonstrating potential color tuning by adjusting KOH concentration and treatment time. This study highlights the feasibility of reusing GO-derived byproducts as sustainable phosphor alternatives in wLEDs, reducing reliance on CRMs and aligning with green chemistry principles.
1. Introduction
The European Union has identified the secure supply of CRMs as essential for its economic resilience and technological leadership, especially in the context of the green and digital transitions. Materials like europium, terbium, and yttrium are integral to phosphors in white LEDs but are classified as critical due to limited availability and concentrated production regions. This dependency underscores the urgency of exploring alternative materials that are abundant, cost-effective, and environmentally benign [,]
Carbon-based nanomaterials have emerged as promising candidates in this quest. Their tunable photoluminescent properties, coupled with low toxicity and compatibility with sustainable production processes, make them attractive for optoelectronic applications. One of the most significant benefits of carbon quantum dots (CQDs) is their exceptional tunability: their emission colour can be easily adjusted by modifying particle size or surface functional groups. This enables the generation of a broad range of visible colours, facilitating the development of RGB and white-light LEDs with tailored optical properties. Synthesis conditions—such as precursor type, solvents, dopants, and processing methods—affect CQD emission across the RGB spectrum. Solvent choice strongly impacts emission colour: water-based syntheses favour blue emission, while organic solvents (e.g., ethanol, DMF) lead to green or red emission. Surface functional groups and particle size also influence emission behaviour. Doping with nitrogen, sulphur, or phosphorus often enhances quantum yield (QY). Some syntheses achieve very high QY (>80%), making CQDs competitive with conventional phosphors. However, red-emitting CQDs remain more challenging to optimize. Moreover, CQDs are significantly more cost-effective. Their synthesis is relatively straightforward, scalable, and can utilize inexpensive and abundant precursors, including biomass or organic waste. This contrasts with the complex and resource-intensive processes often required for the fabrication of traditional inorganic phosphors. Moreover, unlike traditional quantum dots containing toxic heavy metals like Cd, Pb, or As, CQDs can be synthesized from natural, low-cost, and even waste materials. Green synthesis strategies using bio-waste and low-energy techniques (e.g., ultrasonication) align with sustainable development goals. However, these often yield lower QY compared to energy-intensive methods. From an environmental perspective, CQDs also present a clear advantage. Being carbon-based, they are generally non-toxic and environmentally benign, unlike many conventional phosphors that rely on hazardous elements such as cadmium or lead. These attributes make CQDs not only a viable alternative but also a strategic choice for next-generation LED technologies aligned with principles of green chemistry and sustainable development. Although CQDs offer numerous advantages, several challenges remain. Their quantum yield is generally lower than that of conventional QDs, and it is more challenging to achieve accurate control over emission wavelengths. Overall, K. Bucka et al. (2024) [] identify CQDs as strong candidates for next-generation LEDs but highlight the need for improved QY and red emission control, emission stability, and eco-efficient production.
Various types of carbon dots have been reported, including graphene quantum dots (GQDs), carbon nanodots, carbonized polymer dots, and even nanodiamonds [,]. These materials differ in terms of hybridization states, core structure, and surface chemistry. The photoluminescence (PL) of carbon dots is often attributed not only to quantum confinement, but also to surface-localized states and functional groups [,]. These surface sites act as localized energy states that are largely independent of the sp2 domains within the carbon dot structure. When photoluminescence (PL) originates from these surface states, its behavior is primarily determined by their chemical nature rather than the size of the GQDs, resulting in excitation-independent emission []. Conversely, excitation-dependent PL has also been reported and attributed to variations in GQD size []. Despite these findings, the precise structural origin of PL in carbon dots remains under debate, as many of these nanomaterials display a hybrid architecture comprising a sp2 carbon core embedded within a sp3-rich matrix [,,]. Alongside CQDs, another carbon-based material class—oxidative debris (OD)—has recently drawn attention. OD consists of highly oxidized, water-soluble aromatic fragments generated during the alkaline treatment of graphene oxide (GO). While often considered impurities or waste, these species exhibit intrinsic photoluminescence and can be recovered in significant quantities through simple base-washing protocols. Alkaline treatment is employed to obtain reduced graphene oxide (r-GO), partially restoring the properties of pristine graphene.
During the alkaline treatment of GO, two distinct components are separated. The first component consists of lightly oxidized, graphene-like sheets known as base-washed GO (bwGO). Due to its lower concentration of covalently bound oxygen functionalities, bwGO exhibits reduced hydrophilicity and precipitates from the solution, producing a sedimented residue (R1). Notably, its oxygen content is comparable to that of rGO reduced under mild conditions. The second component, found in the native supernatant (S1), consists of the less abundant but significantly more oxidized fraction, known as OD. This OD consists of highly oxidized polyaromatic carbonaceous fragments of various sizes. The formation mechanism of OD derived from GO remains a debated topic in literature. For example, Rourke et al. (2011) [] introduced a two-component model in which GO consists of two distinct, non-covalently complexed components that can be easily separated through a reflux base-washing procedure. In contrast, other researchers, such as Dimiev et al. (2015) [] and Tararan et al. (2014) [], argue that base-washing more likely induces fragmentation of GO flakes, resulting in OD with varying dimensions. A decade of research has recently been consolidated in a comprehensive review [] in which the authors emphasize the need for further investigations to achieve a deeper understanding of the nature of OD. Nevertheless, the formation of OD through the alkaline treatment of GO can be considered a chemical top-down approach to the synthesis of carbon nanostructures, resulting from the fragmentation of the original GO architecture.
Previous work by our group has demonstrated that the treatment of GO with mild KOH conditions enables the precipitation of the bwGO fraction R1 and therefore its separation from the supernatant S1 containing OD. Within S1, two photoluminescent subfractions can be identified: a lighter, blue-emitting component (S2) that remains in solution, and a heavier, green/yellow-emitting fraction (R2), which precipitates upon acidification []. These findings indicate that OD exhibits tuneable photoluminescence and that its optical properties can be modulated by varying the treatment parameters. A detailed analysis of GO precursors and bwGO has also been reported in [,], where structural and compositional differences were linked to degree of oxidation.
Building on this background, the present study explores the optical properties of OD obtained from GO treated with KOH solutions at varying concentrations (0.04 M to 1.78 M). We focus on the tuneable photoluminescence of different OD fractions and their potential use as phosphors in white-light-emitting devices. The novelty of our approach lies in repurposing a typically discarded byproduct—oxidative debris—as a functional optical material. The main contribution of this work is to demonstrate that OD can serve as a CRM-free, low-cost phosphor, with emission tunability across the visible spectrum. The scope of the study is limited to optical characterization and application relevance, while a more in-depth morphological, structural, and chemical analysis will be the subject of future work.
2. Materials and Methods
2.1. Synthesis of the Graphene Oxide and OD
Graphene oxide was obtained following a modified Hummers’ protocol, reported in detail in Ref. [] and Supplementary Materials Figure S1 and it is briefly summarized here. Commercial graphite was initially treated with concentrated sulfuric acid (H2SO4) as an intercalating agent to activate its layered structure by increasing the interlayer spacing. In detail, 1 g of commercial graphite (Aldrich, CAS 7782-42-5) was dispersed in 23 mL of concentrated sulfuric acid (96% aqueous) under continuous stirring at room temperature for 10 min. Subsequently, the flask was placed in an ice bath, and potassium permanganate (3 g) was gradually added in small aliquots every 5 min over a period of 1 h to avoid an overly vigorous reaction. Then, the oxidized graphite powder was washed three times in acid solutions employing HCl. Successively, an aliquot taken from the GO powder was washed using KOH. A total of 10 mL of KOH solution (0.1 M) was added to 15 mL of water, and this solution (0.04 M) was employed to wash 100 mg of GO. Then, the GO powder samples (the one treated by KOH and the one untreated by KOH) were dispersed in water and sonicated for 30 min. The sample washed in HCl and sonicated for 30 min in water was labelled simply as GO, while the corresponding sample washed in KOH (0.04 M) and sonicated for 30 min was labelled as GO_0.04_KOH. Other KOH treatments were applied in the same conditions with respect to the previous alkaline washing but with increasing KOH concentrations (see Table 1 and Figure 1) equal to 0.1 M (labelled as GO_0.1_KOH) and 0.2 M (labelled as GO_0.2_KOH). A third treatment was conducted in hot conditions (1 h at boiling point under reflux) by using a solution of KOH 1.78 M (labelled as GO_1.5_KOH). (Despite the label GO_1.5_KOH, the KOH solution used for the treatment had a concentration of 1.78 M. The sample name was assigned during the early stages of the study and retained throughout for consistency in figures and data presentation).

Table 1.
Samples obtained at each step of the production process.
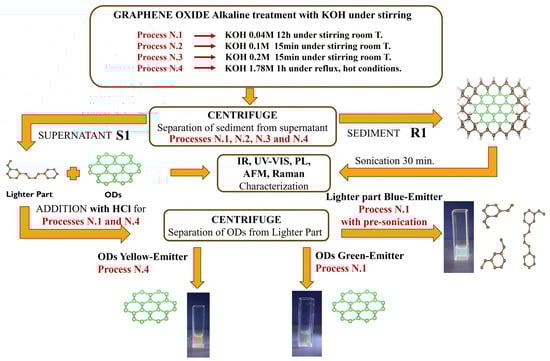
Figure 1.
Flow chart of the GO treatment steps, illustrating the sequential methodology adopted in this study.
The alkaline washing solutions (supernatants) produced the native fractions, S1, and they were named GO_0.04_KOH_SURN, GO_0.1_KOH_SURN, GO_0.2_KOH_SURN, and GO_1.5_KOH_SURN, respectively (see Table 1).
The S1 solutions prepared by using KOH 0.04M and 1.78M underwent a further separation, which yielded two distinct fractions named S2 and R2. This process was performed by adding an aliquot of HCl until a pH of 2–3 was reached (generally, we stopped the acidification at a pH of around 2.4). In fact, at higher KOH concentrations, it is most likely that around pH 7 a precipitation of excess KCl occurs; hence, in that case, it is necessary to remove the salt from the solution, for example through centrifugation. At pH 2–3 a brownish precipitate, named R2, was formed, which contains a rich fraction of OD. This precipitated fraction can be removed by centrifugation at 4000 rpm for 15 min. The acid solution remaining after removal of R2, named S2, contains a lighter fraction of material (mixed with KCl), which has strong emission in the blue region when it is excited by a UV lamp, and it is transparent in natural light. Any residual R2 particles in the S2 fraction can be removed by further filtering S2 through a PTFE membrane with a pore size of 200 nm. After separation, the R2 fraction was washed twice with a 1% HCl solution to remove any residual traces of the S2 component. In this step it is recommended to make use of acidulous solutions to wash R2 in order to avoid the activation of reactions which could generate further light material with blue emission. Then, R2 can be dispersed in distilled water to record the photoluminescent maps. Finally, a pre-sonication of GO in water for 30 min in an ice bath before adding KOH enhances the precipitation of R2, hence obtaining an S2 solution with very narrow PL emission around 440 nm.
2.2. Materials Characterization
Photoluminescence and optical absorption spectra of the GO solutions were recorded using a FluoroMax 4 spectrofluorometer (Horiba Jobin Yvon, Edison, NJ, USA) and a Cary 5000 UV-Vis-NIR spectrophotometer (Agilent) with quartz cuvettes. Vibrational analysis was performed with a Nicolet™ iS™ 50 FTIR spectrometer (Thermo Fisher Scientific, Waltham, MA, USA) equipped with an ATR accessory featuring a diamond crystal as the internal reflection element (IRE). Spectra were collected in absorbance mode within the range of 4000 to 400 cm−1, with a resolution of 4 cm−1. For infrared measurements on GO films, aliquots of the GO solutions were deposited onto the ATR diamond crystal to form a thin film, which was subsequently air-dried. Raman spectra of dried GO samples deposited on silicon substrates were acquired using a LabRam HR Evolution Raman spectrometer (Horiba) with a continuous-wave laser source at 633 nm. The laser beam, focused on the sample through a 100× objective, had a spot size of approximately 2 μm and a maximum power of 17 mW. For each sample, approximately ten spectra were collected at different locations. AFM analyses were performed using the OmegaScope AFM by Horiba. The employed AFM probes, produced by MikroMasch (Sofia, Bulgaria), belong to the HQ:NSC19 series, which combine a relatively high resonance frequency with a low force constant, making them suitable for imaging soft and fragile surfaces at relatively high speeds in soft tapping mode. The probes are fabricated from silicon and feature an aluminum-coated backside. The tip has a height of 15 µm, a radius of 8 nm, and a full cone angle of 40°. The cantilever exhibits a force constant of 0.5 N/m and a resonance frequency of 65 kHz. AFM imaging was performed in AC (semi-contact/non-contact) mode, with a free amplitude of 20 nm and a setpoint value of 87%.
3. Results
3.1. FTIR Analysis
The FTIR spectra of GO and the corresponding sample treated with KOH and sonicated for 30 min (GO_0.04_KOH) are shown in Figure 2.
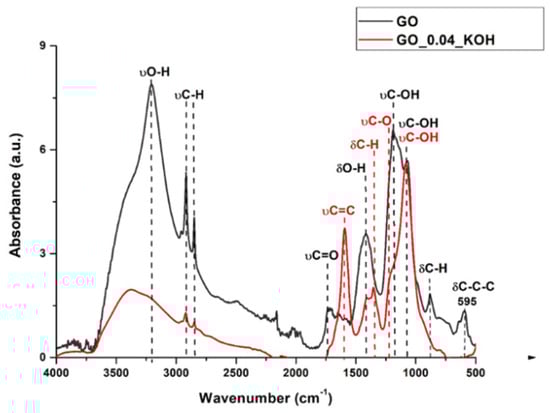
Figure 2.
FTIR spectrum of sample GO in comparison with GO_0.04_KOH.
The attribution of absorption bands to specific functional groups, as listed in Table 2, was carried out in accordance with Refs. [,,]. Analysis of the peak at 1593 cm−1 indicates that KOH treatment enhances the aromatic C=C band relative to oxygen-containing functionalities. The peak near 835 cm−1, present in GO, disappears after KOH treatment in GO_0.04_KOH. Furthermore, the band around 595 cm−1, which is assigned to the in-plane bending of the C–C ring in GO, is no longer observed in the KOH-treated sample. These peaks below 1000 cm−1 are typical of multi-substituted aromatic structures like benzene or condensed benzenoid PAHs [,,,,] and correspond to C-H and C-C-C bending. The disappearance of these peaks in the KOH-treated sample most likely indicates the loss of aromatic domains responsible for these vibrations. The supernatants (S1) from the alkaline washing solutions at different KOH concentrations were deposited onto the diamond IRE crystal for FTIR characterization in ATR mode. The resulting spectra are shown as black lines in Figure 3, while the spectra of the corresponding bwGO precipitated powders (R1), also measured in ATR mode, are displayed as red lines. Supplementary Materials Figure S2 provides the values of the spectral positions for the FTIR absorption spectra reported in Figure 3. As shown in Figure 3a, it is noteworthy that the peaks below 1000 cm−1, corresponding to out-of-plane C–H bending (885, 835, 760, and 690 cm−1) as well as in-plane bending of the C–C ring (610 cm−1), are clearly visible in the supernatant GO_0.04_KOH_SURN sample.
Table 2.
Vibrational absorptions of chemical groups which are localized on GO plane.
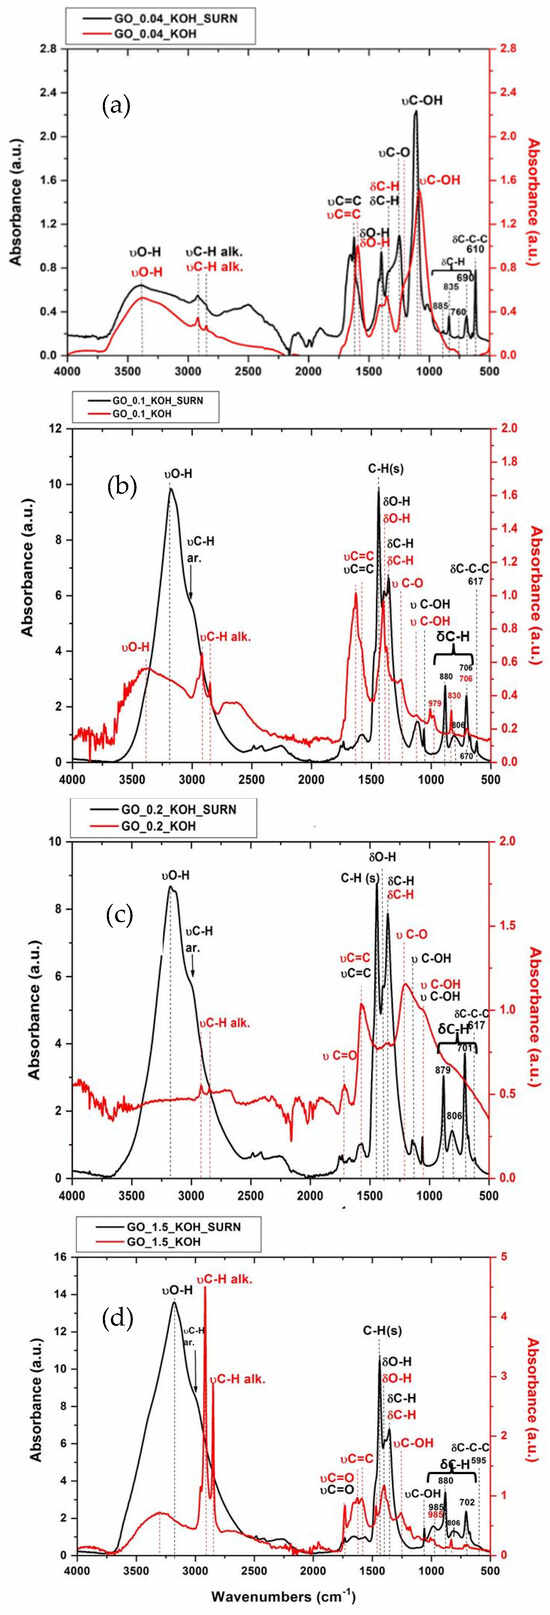
Figure 3.
FTIR absorbance for GO washed with alkaline solution at different concentrations of KOH (red lines): GO_0.04_KOH (a), GO_0.1_KOH (b), GO_0.2_KOH (c), GO_1.5_KOH (d), and relative supernatant samples (black lines). Numerical values reported in plot are expressed in cm−1.
Moreover, GO_0.04_KOH_SURN presents a higher ratio between the peak related to C-O stretch and the C=C peak compared to the corresponding base-washed sonicated sample, GO_0.04_KOH. This means that the more oxygenated part (containing mainly hydroxyls and epoxides) is stripped to GO powder during the KOH washing. The C=C peak for the supernatant is a convolution of the aliphatic and the aromatic peaks, with the first one dominating over the second due to higher oxidation. The aryl (or alkyl) ethers are revealed around 1250 cm−1 and 1216 cm−1 in GO_0.04_KOH_SURN and GO_0.04_KOH, respectively. It is worth noting that the signal due to carbonyl groups, expected around 1730 cm−1, is not visible for the supernatant since it is not intense enough to emerge above the water band peaking at 1640 cm−1. Furthermore, the C–OH stretching vibration at 1188 cm−1, attributed to tertiary alcohols and phenols, is especially pronounced in the supernatant. Almost the same results have been obtained for GO samples obtained at increasing values of KOH concentration (see Figure 3b–d). However, the C=C peak intensity for the supernatants strongly decreases (with respect to the other oxygen functionalities) as the KOH concentration of the treatment increases. This evidence indicates that the oxidization degree of the particles in the supernatants increases with the higher pH value of the alkaline treatment. Hence, on the basis of FTIR, it is possible to hypothesize that the material that goes in the supernatant is formed by molecular fragments made by aromatic domains substituted in certain atomic positions by groups containing hydrogen and oxygen atoms. These groups become much more numerous as the KOH concentration of the alkaline treatment increases, as evidenced by Figure 3.
3.2. Optical Absorption Analysis
Figure 4 presents the absorption spectra of GO suspensions in water, measured in quartz cuvettes with a 10 mm path length, covering the range from 200 to 800 nm. The spectra include the GO sample, KOH-treated samples, and their corresponding supernatants at varying KOH concentrations. Typically, the optical absorption spectrum of graphene oxide features a primary peak around 230 nm, attributed to the π→π* transition of C=C bonds. This peak undergoes a red shift to approximately 263 nm as the aromatic sp2 electronic conjugation increases. Many studies report the absorption peak of reduced graphene oxide near 267 nm [,,,]. In the present work, the GO sample exhibits a peak at 262 nm in the absorption spectrum (green line in Figure 4a). The absorption of the native GO found at 262 nm means a lower oxidative degree of the GO, in good agreement with the C/O ratio of 1.97 obtained through XPS measurement and reported in []. Differently, sample GO_0.04_KOH presents a blue-shifted peak at 240 nm (black line in Figure 4a), evidence of a higher degree of oxidation. It is worth noting that both for GO and GO_0.04_KOH, the absorption peak related to the π→π* transition appears broad, since it is most likely formed by the two components at 260 nm and 230 nm convoluted together. In the case of GO, the component that peaked at 260 nm prevailed over the one that peaked at 230 nm, while for GO_0.04_KOH the two components had almost the same intensity. Therefore, it is reasonable to conclude that both highly conjugated sp2 bonds, responsible for the peak at 262 nm, and less conjugated sp2 bonds, corresponding to the peak at 235 nm, coexist in the GO and GO_0.04_KOH samples. However, the component with lower conjugation appears to increase in the alkaline-treated sample.
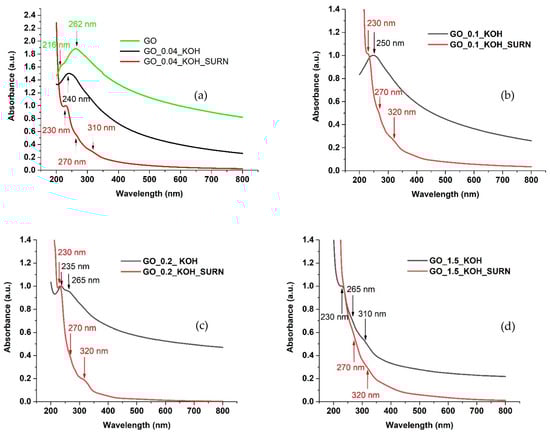
Figure 4.
UV-Vis absorption spectra of water solutions obtained from GO powders (a) and GO powders treated at different concentrations of KOH with their relative supernatants: GO_0.04_KOH (a), GO_0.1_KOH (b), GO_0.2_KOH (c), and GO_1.5_KOH (d) dispersed in water and sonicated for 30 min, respectively.
The low-conjugated sp2 bonds further increase for the supernatant, presenting a peak of absorption at 230 nm over an absorption background, exponentially increasing for wavelengths decreasing down to 200 nm.
The absorption at wavelengths around 200 nm is due to σ→σ* transitions and is indicative of sp3-hybridized carbon domains (see Table 1 in Protopapa et al. (2022) []). This feature typically arises from the disruption of the π-conjugated system caused by extensive oxidation. In our spectra, the absorption peak at 216 nm, clearly visible in the GO sample, disappears for GO_0.04_KOH and GO_0.1_KOH, reflecting reduced sp3 content and increased sp2 conjugation. This trend is further supported by the presence of the π→π* transition band around 260 nm in these samples, which appears convoluted with the band at 230 nm.
However, as the KOH concentration increases (samples GO_0.2_KOH and GO_1.5_KOH), the sp3 content appears to rise, as evidenced by the increased intensity of the feature around 230 nm relative to that at 260 nm, suggesting the formation of new oxygenated functional groups. Additionally, the UV absorption toward 200 nm increases, consistent with a higher degree of oxidation and, consequently, greater sp3 conjugation.
The UV-Vis absorption analysis performed on the supernatant GO_0.04_KOH_SURN reveals a weak shoulder at 270 nm, due to π→π* transitions, and another one, more evident, around 310 nm, due to C=O bonds (n→π*). The shoulder at 310 nm, the absorption peak at 232 nm, and the steep increase in absorption toward 200 nm (due to σ→σ* transitions) are three clear fingerprints of the presence of the most oxidized carbon structures, generally known as OD, in the supernatants.
In summary, as observed in Figure 4a–c, the intensity of the absorption peak at 230 nm increases relative to the peak at 260 nm as the KOH concentration increases, indicating a higher degree of oxidation in the KOH-treated GO samples. The supernatants exhibit an even greater degree of oxidation, as evidenced by the more pronounced peaks at 230 nm and 310 nm, which emerge more clearly from the absorption background with increasing KOH concentration. Notably, in the GO_1.5_KOH_SURN sample, the peaks at 230, 260, and 310 nm appear strongly convoluted, resulting in a steep increase in absorption starting from 350 nm and extending down to 200 nm. This spectral behavior suggests a transition toward predominant sp3 conjugation at higher KOH concentrations. Furthermore, the disappearance of the shoulder at 230 nm in GO_1.5_KOH_SURN indicates a significant reduction in sp2-conjugated domains.
All these observations can be interpreted as the result of a “cleaning effect” induced by the KOH treatment, which progressively removes the more oxygenated fragments from GO as the KOH concentration increases. This oxygenated debris (OD) is partially eliminated and accumulates in the supernatant. However, a fraction of these oxidized moieties, which becomes more and more abundant as KOH increases, remains in the KOH-treated GO. Therefore, this retention becomes more pronounced at higher KOH concentrations. Consequently, the sp3 hybridization degree is higher in GO_0.2_KOH and GO_1.5_KOH compared to GO_0.04_KOH and GO_0.1_KOH.
Supplementary Materials Figure S2 presents a Raman analysis of the structural changes induced on GO by KOH treatment at different concentrations. The spectra show an evolution reflecting an increase in structural disorder and defect density with higher KOH concentrations. In contrast, Raman analysis of the supernatant is not feasible due to the strong photoluminescence signal, which overwhelms and masks the characteristic Raman features.
3.3. AFM Analysis of Carbon Structures in the Supernatants
To investigate the presence of OD in the KOH washing solution (0.04 M), a small amount of GO_0.04_KOH_SURN was transferred to the surface of silicon and characterized by atomic force microscopy (AFM). AFM analysis (Figure 5) revealed that GO_0.04_KOH_SURN consists of aggregates with heterogeneous lateral dimensions, ranging from several tens to a few hundred nanometers. Other AFM images relative to sample GO_0.04_KOH_SURN are given in Supplementary Materials Figure S2 while images relative to samples GO_0.1_KOH_SURN, GO_0.2_KOH_SURN, and GO_1.5_KOH_SURN are given in Supplementary Materials Figure S3. Similar structures can be found for aggregates of OD revealed by AFM in Refs. [,].
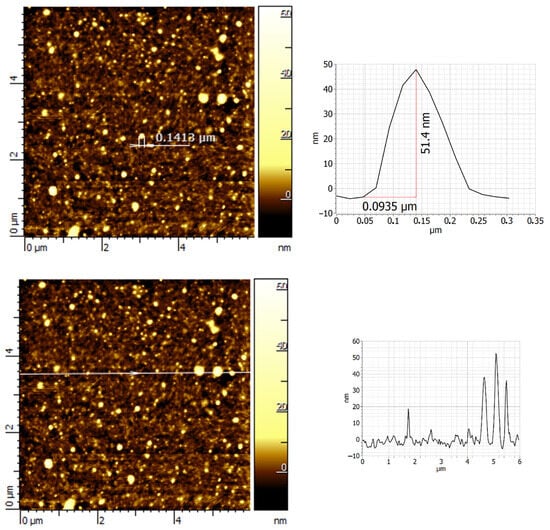
Figure 5.
AFM image and z-profile for carbon-based structures obtained from sample GO_0.04_KOH by dropping samples onto a silicon substrate.
3.4. Photoluminescence Analysis
Figure 6 shows fluorescence excitation–emission maps for the GO and GO_0.04_KOH samples (upper panels), as well as for the water solvent used (bottom panel). The emission from the GO suspension spans the 300–550 nm range (indicated by the red/orange regions at the bottom of the map). This emission is notably broad, suggesting it results from a convolution of multiple radiative transitions, as detailed in Table 1 of Ref. [] and illustrated schematically in Figure 7b. Excitation with photons in the 200–230 nm range, which promote σ→σ* transitions, leads to luminescence primarily assigned to π*→n and π*→π electronic transitions, indicating the presence of non-radiative relaxation processes (mechanism I in Figure 7b). In the GO_0.04_KOH sample (top right panel of Figure 6), a second emission band appears when excited at approximately 300–350 nm (with emission around 450 nm), attributed to n→π* excitation and subsequent decay (mechanism III in Figure 7b), consistent with the assignments reported in Table 1 of Ref. []. While alkaline washing does not significantly alter the photoluminescence features upon excitation at 200 nm, it enhances the transitions associated with excitation near 300–350 nm.
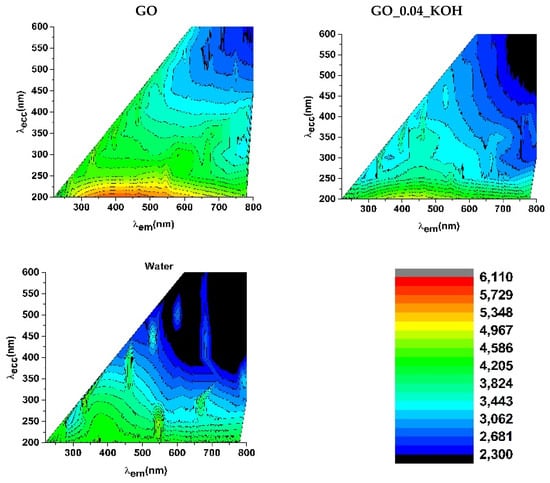
Figure 6.
Photoluminescence excitation–emission maps of the solutions GO and GO_004_KOH. The photoluminescence map of pure water used as the solvent is shown in the bottom panel.
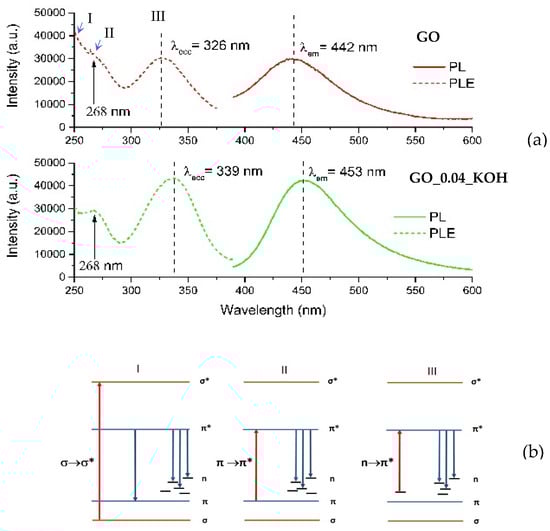
Figure 7.
(a) PL emission (solid lines) and relative PLE spectra (dashed lines) for GO (upper frame) and GO_0.04_KOH (lower frame). (b) Photoluminescence mechanisms for GO. Red and blue arrows represent excitation and emission transitions, respectively. The three excitation mechanisms (I, II, and III), schematically illustrated in panel (b), are labeled in panel (a).
PLE and PL curves extracted from the maps are reported in Figure 7a. For both the GO and GO_0.04_KOH samples, the PLE spectra exhibit a shoulder around 268 nm, which can be attributed to the π→π* transition, and a distinct band in the 325–340 nm range, corresponding to the n→π* transition. The emission and absorption data indicate that the visible emission (in the 442–453 nm range) can be activated in both samples through three possible excitation pathways, as schematically illustrated in Figure 7b. The first mechanism (I), at higher energies (λexc ≈ 200 nm), can be attributed to σ→σ* transitions. The second mechanism (II), at λexc ≈ 268 nm, corresponds to π→π transitions, while the third mechanism (III), in the range λexc ≈ 326–339 nm, is associated with n→π* transitions. It is worth noting that KOH washing enhances the intensity of the n→π* excitation, indicating an increased abundance of n-states. In summary, mechanism I (σ→σ*) dominates over mechanisms II (π→π*) and III (n→π*) in the GO sample. The KOH treatment enhances mechanism III, which prevails over mechanism II and I. The transition related to mechanism III (n→π* excitation) is evident in the map of supernatant GO_0.04_KOH_SURN (Figure 8a). Also, in the PLE spectrum of the supernatant in Figure 8b, the n→π* excitation is dominant, indicating a high abundance of n states related to oxygenated functionalities. This result, supported by FTIR analyses reported in Figure 2 and optical absorption features in Figure 4a, is a confirmation of the presence of oxygenated structures in the supernatant. Moreover, in the PL map relative to sample GO_0.04_KOH_SURN, an intense emission at λexc higher than 400 nm is appreciable, which can be attributed to the addition of further n-levels related to functional groups inside the π-π* gap, with respect to sample GO_0.04_KOH. However, it should be noted that, while the absorption spectrum for the supernatant GO_0.04_KOH_SURN in Figure 4a suggests that many photons are absorbed at about 200 nm, the PLE spectrum in Figure 8b allows us to infer that many of these photons do not contribute to PL emission but their energy is dissipated through nonradiative processes. We demonstrated in Ref. [] that increasing the treatment time (keeping the KOH concentration fixed at 0.04 M) should increase the fragmentation of the GO, hence the concentration of the OD, raising the contribution of the green emitter with respect to the fraction with blue emission. In Figure 8a, the emission map of the supernatant GO_0.04_KOH_SURN is shown after a 15-min KOH treatment. In contrast, Figure 9a presents the emission map of the same supernatant—here referred to as S1 GO_0.04_KOH_SURN—following a prolonged KOH treatment of 12 h. Notably, the emission peak for the 15-min treatment is located at λecc ≈ 317 nm and λem ≈ 443 nm (Figure 8a), whereas extending the treatment time leads to a red shift of the emission peak to λecc ≈ 470 nm and λem ≈ 540 nm (Figure 9a). This shift suggests that the emission wavelength of the supernatant S1 can be modulated by adjusting the duration of the KOH treatment. Moreover, the green-emitting fraction can be isolated from the S1 solution by acidifying the sample to a pH of approximately 2–3 (see experimental details in Section 2.1). This fraction, referred to as R2, corresponds to the heavier component that precipitates upon acid addition. At a low KOH concentration (0.04 M), R2 exhibits photoluminescence in the green region of the visible spectrum (Figure 9b). By increasing the KOH concentration to 1.78 M (Figure 9c), a progressive red shift of R2′s photoluminescence is observed, likely due to the increasing density of n-type energy levels within the π→π* gap, ultimately resulting in a maximum emission around 565 nm (yellow). The lighter moieties remain in solution as a supernatant, referred to as S2. For both KOH concentrations tested (0.04 M and 1.78 M), this fraction predominantly exhibits blue emission. Figure 9d specifically displays the photoluminescence of S2 GO_0.04_KOH_SURN, obtained via acidification of the S1 GO_0.04_KOH_SURN sample. To enhance the blue-emitting contribution of the lighter fraction, a pre-sonication step of GO in water for 30 min in an ice bath was carried out prior to the KOH treatment. Figure 9 presents the photoluminescence (PL) emission spectra as a function of excitation wavelength, ranging from 300 to 390 nm. Within this UV excitation range, the PL emission of the R2 fractions is shown to shift from approximately 500 nm (Figure 10b) to 565 nm (Figure 10c) as the KOH concentration increases from 0.04 M to 1.78 M. In contrast, S2 (Figure 10a) exhibits blue emission, and it has been verified that its emission appears largely unaffected by variations in KOH concentration or temperature. This behavior suggests that S2 consists of lighter structures, likely organic or polymeric in nature, formed during the initial stages of the alkaline treatment. Figure 11 shows, in the central image, the tuning of the photoluminescence (PL) of the OD fractions S2 and R2 upon excitation at 365 nm using a UV lamp. Cuvettes (a), (b), and (c) contain samples S2 GO_0.04_KOH_SURN, R2 GO_1.5_KOH_SURN, and R2 GO_0.04_KOH_SURN, respectively. Corresponding PL spectra recorded under excitation at 360 nm and 370 nm are also provided, further highlighting the emission differences among the samples and the possibility of PL tunability acting on KOH concentration.
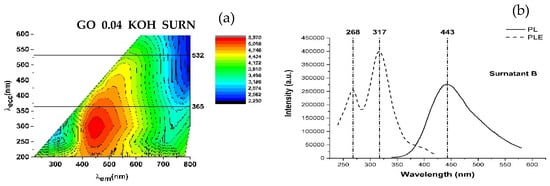
Figure 8.
PL map (a), PLE (dashed line), and PL (solid line) (b) of sample GO_0.04_KOH_SURN.
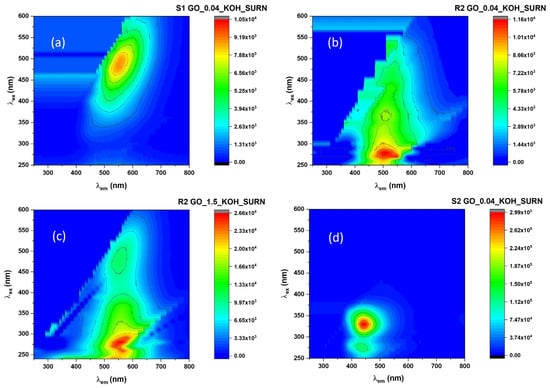
Figure 9.
PL maps for (a) S1, (b) R2 (green emitting), and (d) S2 (emitting in blue range) fractions coming from supernatants of GO treatment with KOH 0.04M for 12 h and (c) R2 fractions (yellow emitting) recovered from supernatant obtained by treating GO with KOH 1.78 M.
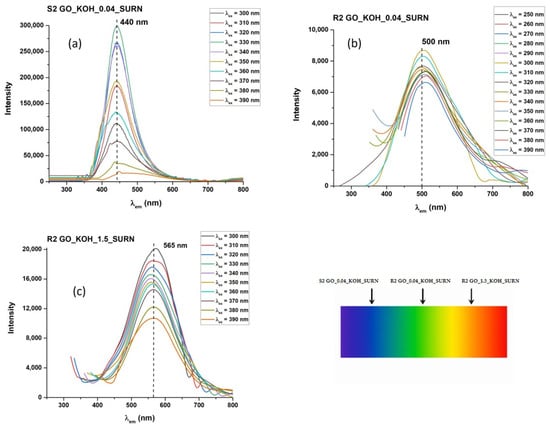
Figure 10.
PL emissions of samples S2 GO_KOH_0.04_SURN (a), R2 GO_KOH_0.04_SURN (b) and R2 GO_KOH_1.5_SURN (c) as a function of excitation wavelengths ranging from 300 to 390 nm. The emission is in the blue range for sample S2 GO_0.04_KOH_SURN, the green range for sample R2 GO_0.04_KOH_SURN, and the orange range for sample R2 GO_1.5_KOH_SURN for excitation at 365 nm.
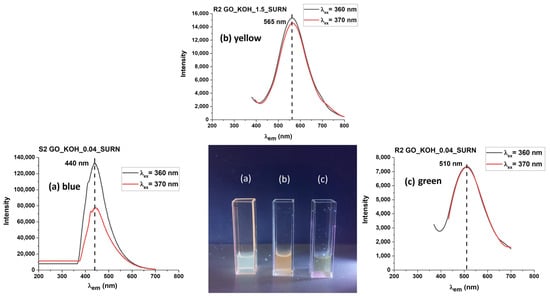
Figure 11.
The tuning of the OD photoemission, exciting the PL at 365 nm with a UV lamp, is shown in the central picture. The cuvettes (a–c) contain samples S2 GO_KOH_0.04_SURN, R2 GO_KOH_1.5_SURN, and R2 GO_KOH_0.04_SURN, respectively. PL spectra recorded with excitation at 360 and 370 nm are also provided.
4. Discussion
In summary, π→π* and n→π* transitions, with the latter much stronger than the former, can be observed in the PLE spectra of supernatant S1 GO_0.04_KOH_SURN (Figure 8), with emissions due to π*→n decay covering the whole visible range as a result of the addition of n groups in the π-π* gap. Therefore, PL (Figure 8) and optical absorption (Figure 4) analysis support the FTIR results (Figure 2), according to which the supernatants S1 are most likely formed by aromatic structures rich in oxygen functional groups at the edges. From AFM analysis (Figure 5 and Supplementary Materials Figure S2) we can suppose that these species are aggregated as carbon-based nanomaterials, most likely as CQDs whose luminescence properties depend strongly on the arrangement of the atoms on their surface. Two distinct fractions present in samples S1 were separated by acidification: a lighter fraction, S2, which remains in the supernatant and emits in the blue spectral region with emission features that are not tunable; and a heavier fraction, R2, which precipitates and whose photoluminescence can be modulated by varying the KOH concentration (Figure 9, Figure 10 and Figure 11). The tunability of R2′s PL emission highlights the pH-induced chemical modifications occurring at the outer shell of these carbon-based nanomaterials.
5. Conclusions
This work provides a comprehensive analysis of the chemical and optical modifications induced on graphene oxide (GO) through alkaline treatment using KOH at varying concentrations, with a focus on the formation and photoluminescent properties of oxidative debris (OD).
Graphene oxide was synthesized using a modified Hummers’ method and subjected to KOH treatment at concentrations ranging from 0.04 M to 1.78 M. The process led to the separation of two components: (i) a base-washed GO (bwGO) precipitate, and (ii) a supernatant (S1) rich in highly oxidized carbonaceous nanostructures, namely OD.
FTIR analysis revealed a decrease in aromatic domains and an enrichment in oxygenated functionalities (e.g., hydroxyl, epoxide, carboxyl) in the supernatants, especially at higher KOH concentrations. Peaks below 1000 cm−1, associated with out-of-plane C–H and in-plane C–C–C bending, confirmed the presence of highly oxidized, substituted aromatic structures. Raman spectroscopy showed an increase in structural disorder and amorphization (D3 band), particularly for the bwGO fraction at higher KOH concentrations. AFM imaging confirmed the presence of nanostructured aggregates in the S1 supernatants, with lateral dimensions from tens to hundreds of nanometers. This supports the hypothesis that OD consists of carbonaceous nanoparticles like carbon quantum dots (CQDs). UV-Vis absorption spectra of KOH-treated GO samples exhibited a strong absorption band around 230 nm (π→π* transitions) and a rising background toward 200 nm (σ→σ* transitions), both of which evolved with KOH concentration. At a low KOH concentration (0.04 M), the GO samples retained some sp2 features; however, with increasing alkalinity, the spectra showed a clear increase in sp3-related absorption and oxidation. The supernatants revealed absorption features typical of sp3-hybridized structures.
Photoluminescence (PL) and PLE maps provided evidence of three excitation–emission mechanisms, with the most significant in OD (S1) being the n→π* transitions, dominant at higher oxidation levels. The supernatant S1 can be further separated into S2 (blue-emitting, soluble fraction) and R2 (green/yellow-emitting precipitate) by acidification.
Blue-shifted emissions were associated with S2 (lighter) fractions, while R2 (heavier) fractions showed green-to-yellow emissions, tunable by both KOH concentration and treatment time. In particular, the PL of R2 shifted from ~500 nm to 565 nm as KOH concentration increased from 0.04 M to 1.78 M, revealing the ability to chemically tune emission wavelengths through alkaline processing.
These fractions demonstrate strong and tunable PL in the visible region under UV excitation (300–390 nm), with clear potential for phosphor-free white light applications.
Importantly, the emission from R2 is pH- and treatment-dependent, enabling control over optical properties via a simple chemical process.
This study demonstrates that:
- Alkaline treatment of GO not only alters its structural order but also promotes the formation of nanostructured carbon-based OD with strong luminescent properties.
- The OD obtained exhibits tunable PL emissions across the visible spectrum, which can be adjusted by KOH concentration and post-treatment acidification.
- The emission features of the separated fractions—particularly R2—suggest that these materials could serve as low-cost, eco-friendly alternatives to rare-earth-based phosphors in white LEDs (wLEDs).
These findings pave the way for further exploration of GO-derived nanostructures as sustainable materials for solid-state lighting and optoelectronic applications, while contributing to the ongoing effort to reduce reliance on critical raw materials.
In conclusion, we developed a sustainable and cost-effective approach to obtain carbon-based materials with tunable photoluminescence, potentially suitable for applications in optical and optoelectronic devices. The method relies on a simple alkaline washing of graphene oxide (GO), synthesized via Hummers’ method from commercial graphite. This process enables the separation of lighter carbon moieties (S2), which exhibit untunable blue emission, from heavier carbon nanostructures (R2), whose photoluminescence properties can be modulated in the green–yellow range by adjusting the KOH concentration during alkaline treatment.
Supplementary Materials
The following supporting information can be downloaded at https://www.mdpi.com/article/10.3390/chemengineering9040073/s1. Figure S1: Raman spectra of KOH-treated GO at increasing concentrations of KOH; Table S1: Spectral positions of the FTIR peaks recorded for sample base-washed using different KOH concentrations: 0.04 M (GO_0.04_KOH), 0.1 M (GO_0.1_KOH), 0.2 M (GO_0.2_KOH), 1.78 M (GO_1.5_KOH) and their corresponding supernatants.; Figure S2: AFM image and z-profile for sample GO_0.04_KOH_SURN dropped onto a silicon substrate; Figure S3: AFM images for sample GO_0.1_KOH_SURN dropped onto a silicon substrate; Figure S4: AFM images for sample GO_0.2_KOH_SURN dropped onto a silicon substrate. Figure S5: AFM image and z-profile for sample GO_1.5_KOH_SURN dropped onto a silicon substrate.
Author Contributions
Writing—review and editing, M.L.P. and E.B.; Writing—original draft, M.L.P. and E.B., Supervision, M.L.P. and E.B.; Methodology, M.L.P. and E.B.; Investigation, M.L.P., E.B., M.P. and E.P.; Funding acquisition, M.L.P.; Formal analysis, M.L.P. and E.B., Data curation, M.L.P. and E.B.; Conceptualization, M.L.P.; Visualization, M.P. and E.P. All authors have read and agreed to the published version of the manuscript.
Funding
This research received no external funding.
Data Availability Statement
All data are already included in this manuscript. Original data are available on request.
Conflicts of Interest
The authors declare no conflicts of interest. The funders had no role in the design of the study; in the collection, analyses, or interpretation of data; in the writing of the manuscript; or in the decision to publish the results.
Abbreviations
The following abbreviations are used in this manuscript:
| CQDs | Carbon Quantum Dots |
| wLEDs | White-Light-Emitting Diodes |
| CRMs | Critical Raw Materials |
| REEs | Rare-Earth Elements |
| OD | Oxidative Debris |
| PL | Photoluminescence |
| PLE | Photoluminescence Excitation |
References
- European Commission: Directorate-General for Internal Market, Industry, Entrepreneurship and SMEs; Grohol, M.; Veeh, C. Study on the Critical Raw Materials for the EU 2023: Final Report; Publications Office of the European Union: Luxembourg, 2023; Available online: https://data.europa.eu/doi/10.2873/725585 (accessed on 2 July 2025).
- Pavel, C.C.; Marmier, A.; Tzimas, E.; Schleicher, T.; Schüler, D.; Buchert, M.; Blagoeva, D. Critical raw materials in lighting applications: Substitution opportunities and implication on their demand. Phys. Status Solidi A 2016, 213, 2937–2946. [Google Scholar] [CrossRef]
- Bucka, K.; Socha, R.P.; Wojnicki, M. Carbon Quantum Dots as Phosphors in LEDs: Perspectives and Limitations—A Critical Review of the Literature. Electronics 2024, 13, 4481. [Google Scholar] [CrossRef]
- Ding, H.; Li, X.-H.; Chen, X.-B.; Wei, J.-S.; Li, X.-B.; Xiong, H.-M. Surface states of carbon dots and their influences on Luminescence. J. Appl. Phys. 2020, 127, 231101. [Google Scholar] [CrossRef]
- Tepliakov, N.V.; Kundelev, E.V.; Khavlyuk, P.D.; Xiong, Y.; Leonov, M.Y.; Zhu, W.; Baranov, A.V.; Fedorov, A.V.; Rogach, A.L. sp2–sp3-Hybridized Atomic Domains Determine Optical Features of Carbon Dots. ACS Nano 2019, 13, 10737–10744. [Google Scholar] [CrossRef] [PubMed]
- Fu, M.; Ehrat, F.; Wang, Y.; Milowska, K.Z.; Reckmeier, C.; Rogach, A.L.; Stolarczyk, J.K.; Urban, A.S.; Feldmann, J. Carbon Dots: A Unique Fluorescent Cocktail of Polycyclic Aromatic Hydrocarbons. Nano Lett. 2015, 15, 6030–6035. [Google Scholar] [CrossRef]
- Reckmeier, C.J.; Wang, Y.; Zboril, R.; Rogach, A.L. Influence of Doping and Temperature on Solvatochromic Shifts in Optical Spectra of Carbon Dots. J. Phys. Chem. C 2016, 120, 10591–10604. [Google Scholar] [CrossRef]
- Mehata, M.S.; Biswas, S. Synthesis of fluorescent graphene quantum dots from graphene oxide and their application in fabrication of GQDs@AgNPs nanohybrids and sensing of H2O2. Ceram. Int. 2021, 47, 19063–19072. [Google Scholar] [CrossRef]
- Zhuo, S.J.; Shao, M.W.; Lee, S.T. Upconversion and downconversion fluorescent graphene quantum dots: Ultrasonic preparation and photocatalysis. ACS Nano 2012, 6, 1059–1064. [Google Scholar] [CrossRef]
- Wang, W.; Wang, B.; Embrechts, H.; Damm, C.; Cadranel, A.; Strauss, V.; Distaso, M.; Hinterberger, V.; Guldi, D.M.; Peukert, W. Shedding light on the effective fluorophore structure of high fluorescence quantum yield carbon nanodots. RSC Adv. 2017, 7, 24771–24780. [Google Scholar] [CrossRef]
- Sun, X.; Liu, Z.; Welsher, K.; Robinson, J.T.; Goodwin, A.S. Zaric & H. Dai Nano-graphene oxide for cellular imaging and drug delivery. Nano Res. Vol. 2008, 1, 203–212. [Google Scholar] [CrossRef]
- Stepanidenko, E.A.; Arefina, I.A.; Khavlyuk, P.D.; Dubavik, A.; Bogdanov, K.V.; Bondarenko, D.P.; Cherevkov, S.A.; Kundelev, E.V.; Fedorov, A.V.; Baranov, A.V.; et al. Influence of the solvent environment on luminescent centers within carbon dots. Nanoscale 2020, 12, 602. [Google Scholar] [CrossRef] [PubMed]
- Rourke, J.P.; Pandey, P.A.; Moore, J.J.; Bates, M.; Kinloch, I.A.; Young, R.J.; Wilson, N.R. The real graphene oxide revealed: Stripping the oxidative debris from the graphene-like sheets. Angew. Chem. Int. Ed. 2011, 50, 3173–3177. [Google Scholar] [CrossRef] [PubMed]
- Dimiev, M.; Polson, T.A. Contesting the two-component structural model of graphene oxide and reexamining the chemistry of graphene oxide in basic media. Carbon 2015, 93, 544–554. [Google Scholar] [CrossRef]
- Tararan, A.; Zobelli, A.; Benito, A.; Maser, W.; Stephan, O. A New Structural Model for Graphene Oxide and Reduced Graphene Oxide as Revealed by Core EELS and DFT. Microsc. Microanal. 2014, 20, 1774–1775. [Google Scholar] [CrossRef][Green Version]
- De Lima, H.; Scarpa, I.; Azevedo, N.C.L.; Lelis, G.C.; Strauss, M.; Martinez, D.S.T.; De Oliveira, R.F.; Chem, J.M. Oxidative debris in graphene oxide: A decade of research. J. Mater. Chem. C 2023, 11, 12429–12452. [Google Scholar] [CrossRef]
- Burresi, E.; Protopapa, M.L. Optical investigation of degradation of graphene oxide in alkaline environment: Evidence of two distinct photon-emitting phases in visible region. Carbon Trends 2024, 17, 100412. [Google Scholar] [CrossRef]
- Burresi, E.; Taurisano, N.; Protopapa, M.L.; Latterini, L.; Palmisano, M.; Mirenghi, L.; Schioppa, M.; Morandi, V.; Mazzaro, R.; Penza, M. Influence of the synthesis conditions on the microstructural, compositional and morphological properties of graphene oxide sheets. Ceram. Int. 2020, 46, 22067. [Google Scholar] [CrossRef]
- Protopapa, M.L.; Burresi, E.; Palmisano, M.; Pesce, E.; Latterini, L.; Taurisano, N.; Quaglia, G.; Mazzaro, R.; Morandi, V. Changing the Microstructural and Chemical Properties of Graphene Oxide Through a Chemical Route. Appl. Spectrosc. 2022, 76, 1452–1464. [Google Scholar] [CrossRef]
- Galande, C.; Mohite, A.D.; Naumov, A.V.; Gao, W.; Ci, L.; Ajayan, A.; Gao, H.; Srivastava, A.; Weisman, R.B.; Ajayan, P.M. Quasi-molecular fluorescence from graphene oxide. Sci. Rep. 2011, 1, 85. [Google Scholar] [CrossRef]
- Ojhaa; Tharejab, P. Electrolyte Induced Rheological Modulation of Graphene Oxide Suspensions and its Applications in Adsorption. Appl. Surf. Sci. 2017, 435, 786–798. [Google Scholar] [CrossRef]
- Hasan, M.T.; Senger, B.J.; Ryan, C.; Culp, M.; Gonzalez-Rodriguez, R.; Coffer, J.L.; Naumov, A.V. Optical Band Gap Alteration of Graphene Oxide via Ozone Treatment. Sci. Rep. 2017, 7, 6411. [Google Scholar] [CrossRef] [PubMed]
- Sandford, S.A.; Bernstein, M.P.; Materese, C.K. The infrared spectra of polycyclic aromatic hydrocarbons with excess peripheral h atoms (hn-pahs) and their relation to the 3.4 and 6.9 μm pah emission features. Astrophys. J. Suppl. 2013, 205, 8. [Google Scholar] [CrossRef] [PubMed]
- Ricca, A.; Bauschlicher, C.W., Jr.; Allamandola, L.J. The infrared spectroscopy of polycyclic aromatic hydrocarbons with five- and seven-membered fused ring defects. Astr. J. 2011, 729, 94. [Google Scholar] [CrossRef]
- Guennoun, Z.; Aupetit, C.; Mascetti, J. Photochemistry of coronene with water at 10 K: First tentative identification by infrared spectroscopy of oxygen containing coronene products. Phys. Chem. Chem. Phys. 2011, 13, 7340–7347. [Google Scholar] [CrossRef]
- De Barros, L.F.; Mattioda, A.L.; Ricca, A.; Cruz-Diaz, G.A.; Allamandola, L.J. Photochemistry of Coronene in Cosmic Water Ice Analogs at Different Concentrations. Astr. J. 2017, 848, 112. [Google Scholar] [CrossRef]
- Galué, H.A.; Rice, C.A.; Steill, J.D.; Oomens, J. Infrared spectroscopy of ionized corannulene in the gas phase. J. Chem. Phys. 2011, 134, 054310. [Google Scholar] [CrossRef]
- Cancado, L.G.; Takai, K.; Enoki, T. General equation for the determination of the crystallite size La of nanographite by Raman spectroscopy. Appl. Phys. Lett. 2006, 88, 163106. [Google Scholar] [CrossRef]
- Bokobza, L.; Bruneel, J.L.; Couzi, M. Raman Spectra of Carbon-Based Materials (from Graphite to Carbon Black) and of Some Silicone Composites. J. Carbon Res. 2015, 1, 77–94. [Google Scholar] [CrossRef]
- Jawhar, T.; Roid, A.; Casado, J. Carbon, Raman spectroscopic characterization of some commercially available carbon black materials. Carbon 1995, 33, 1561–1565. [Google Scholar] [CrossRef]
- Liang, H.F.; Smith, C.T.G.; Mills, C.A.; Silva, S.R.P. The Band Structure of Graphene Oxide Examined Using Photoluminescence Spectroscopy. J. Mater. Chem. C 2015, 3, 12484–12491. [Google Scholar] [CrossRef]
- Chen, X.; Chen, B. Direct Observation, Molecular Structure, and Location of Oxidation Debris on Graphene Oxide Nanosheets. Environ. Sci. Technol. 2016, 50, 8568–8577. [Google Scholar] [CrossRef]
Disclaimer/Publisher’s Note: The statements, opinions and data contained in all publications are solely those of the individual author(s) and contributor(s) and not of MDPI and/or the editor(s). MDPI and/or the editor(s) disclaim responsibility for any injury to people or property resulting from any ideas, methods, instructions or products referred to in the content. |
© 2025 by the authors. Licensee MDPI, Basel, Switzerland. This article is an open access article distributed under the terms and conditions of the Creative Commons Attribution (CC BY) license (https://creativecommons.org/licenses/by/4.0/).