1. Introduction
Ensuring high-quality standards in chemical manufacturing is one of the most important steps in control, industrial efficiency, product reliability, and regulatory compliance. Traditional quality management approaches, such as Statistical Process Control (SPC) and Six Sigma methodologies, have played a decisive role in the optimization of industrial processes during the last decades [
1,
2]. However, these methods are based on linear assumptions and often fail to capture the nonlinear and uncertain nature of modern chemical processes. As noted by Macias-Aguayo et al. (2022), the integration of Lean Six Sigma (LSS) with Industry 4.0 still presents significant implementation barriers, such as technology incompatibility, lack of data interpretability, and the limited ability of traditional methods to respond to the dynamic and nonlinear nature of current industrial processes [
3].
In recent years, the application of AI-based machine learning (ML) has revolutionized industrial quality control by enabling data-driven defect prediction and anomaly detection [
4]. These models, rooted in advanced statistical methods, have gained relevance thanks to modern computing capabilities, which allow real-time processing of large datasets with a high level of reliability. However, despite their high predictive accuracy, most ML models lack interpretability, making it difficult for industrial experts to understand why a batch is classified as defective [
5]. This concern extends to other sectors such as healthcare, finance, and pharmaceuticals, where explainability is essential for trust, compliance, and traceability. To address this challenge, researchers have explored the combination of Fuzzy Logic, machine learning, and Explainable Artificial Intelligence (XAI) as a hybrid approach for real-time, transparent quality control.
The application of Fuzzy Logic in industrial systems dates to the pioneering work of Lotfi Zadeh in 1973 [
6], who introduced Fuzzy Set Theory as a mathematical framework to model uncertainty in decision-making. The first industrial implementations of fuzzy control systems appeared in the 1980s in Japan, particularly in automated manufacturing and chemical processes [
7]. By the early 2000s, machine learning algorithms such as Support Vector Machines (SVM) and Random Forest (RF) were integrated into quality assessment pipelines [
8]. However, these techniques were largely black-box models, limiting their adoption in high-stakes industries like pharmaceuticals and chemical manufacturing. In response to these limitations, a new wave of post hoc explainability tools began to emerge, leading to the development of frameworks such as SHAP (SHapley Additive exPlanations) and LIME (Local Interpretable Model-Agnostic Explanations) in the mid-2010s. Their adoption in sectors like healthcare and finance marked a turning point in the practical application of interpretable AI. Consequently, Explainable AI (XAI) techniques have opened new possibilities for interpretable quality control models [
9].
This study builds on these historical advancements by integrating fuzzy C-means clustering (FCM), machine learning (ML), and Fuzzy Inference Systems (FISs) into a hybrid AI framework for industrial quality control. The primary objective of this study is to develop a hybrid XAI-driven quality control model that combines FCM for unsupervised segmentation of production batches, identifying patterns in process variability [
10], XGBoost for defect prediction, and quality analysis based on historical production data, improving accuracy [
11], FISs for explainable quality assessment, refining predictions through rule-based reasoning [
12], and Explainable AI (XAI) with SHAP and LIME to enhance transparency in decision-making, allowing industrial experts to interpret AI predictions [
9].
This study addresses the following research questions. Can the integration of FCM, ML, and FISs improve defect classification accuracy in chemical processes? Does the inclusion of XAI techniques enhance interpretability and user trust in quality control systems? How does the proposed hybrid model compare with traditional quality assessment methods in terms of accuracy, explainability, and scalability?
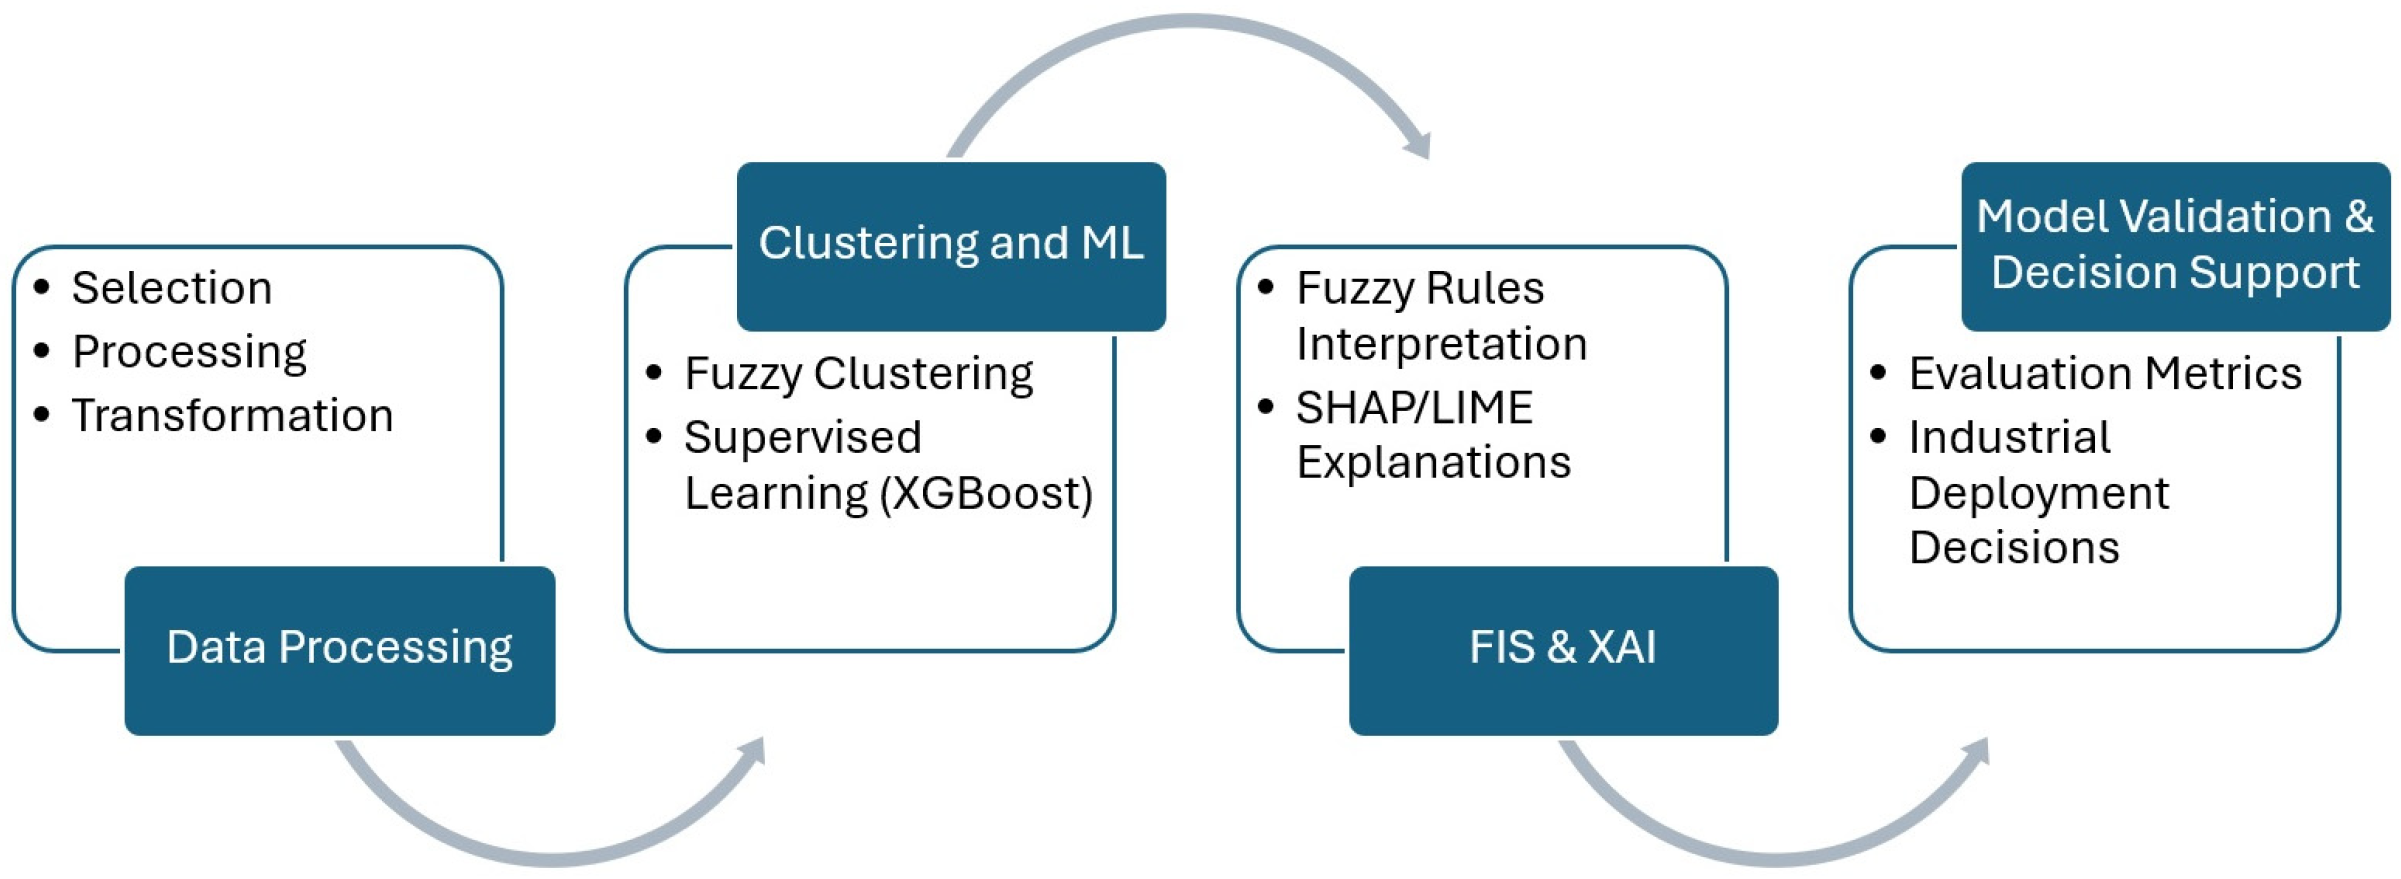
To address these objectives, this study adopts a structured methodology comprising six phases: data collection and preprocessing, where historical production data are gathered, normalized, and prepared for clustering and prediction. Fuzzy C-means clustering, where unsupervised clustering is applied to segment product batches into quality groups. machine learning for defect prediction, in which an XGBoost model is trained on labeled data to predict defective batches. Fuzzy Inference System (FIS) implementation, where expert-defined fuzzy rules refine the final quality score. Explainability Analysis using XAI, where SHAP and LIME are applied to interpret model predictions. Performance Evaluation and Industrial Validation, where the model is tested on real and simulated datasets, comparing its effectiveness against traditional methods.
The remainder of this paper is structured as follows.
Section 2 reviews recent research in fuzzy clustering, machine learning, and XAI for industrial quality control.
Section 3 describes the hybrid FCM-ML-FIS framework and its implementation details.
Section 4 presents the experimental findings, including classification accuracy and interpretability analysis.
Section 5 summarizes the findings, future work, and research opportunities.
Section 6 summarizes the synthesis of key findings and contributions of this study.
This research contributes to the advancement of intelligent quality control systems by providing a scalable, real-time AI framework for industrial quality assessment. It proposes a hybrid model that unifies unsupervised clustering, predictive analytics, fuzzy reasoning, and an interpretable AI layer using SHAP and LIME, thus enhancing transparency, trust, and decision-making in AI-based quality control. By integrating Fuzzy C-Means, machine learning, and Explainable AI techniques, this study presents a solution focused on accuracy and explainability in quality prediction within chemical manufacturing, fully aligned with the principles of Industry 4.0 and smart manufacturing.
2. Related Work
This section provides a focused review of recent developments related to the main components of the proposed hybrid framework. Rather than presenting a general state of the art, it aims to highlight how FCM, ML, and XAI have been individually applied in industrial quality control, along with their current limitations. The review also identifies gaps and integration challenges that justify the need for a unified, interpretable, and scalable solution such as the one proposed in this study.
An overview of FCM applications in manufacturing defect detection and their methodological and practical limitations.
An evaluation of ML models (XGBoost, Random Forest, SVM) in defect classification, with a focus on the trade-off between predictive accuracy and interpretability.
A review of XAI techniques (SHAP, LIME, Rule-based Explainability) applied in industrial environments and their increasing importance.
The identification of unexplored areas in the hybridization of FCM, ML and XAI for real-time industrial quality control systems.
2.1. Fuzzy Clustering in Industrial Quality Control
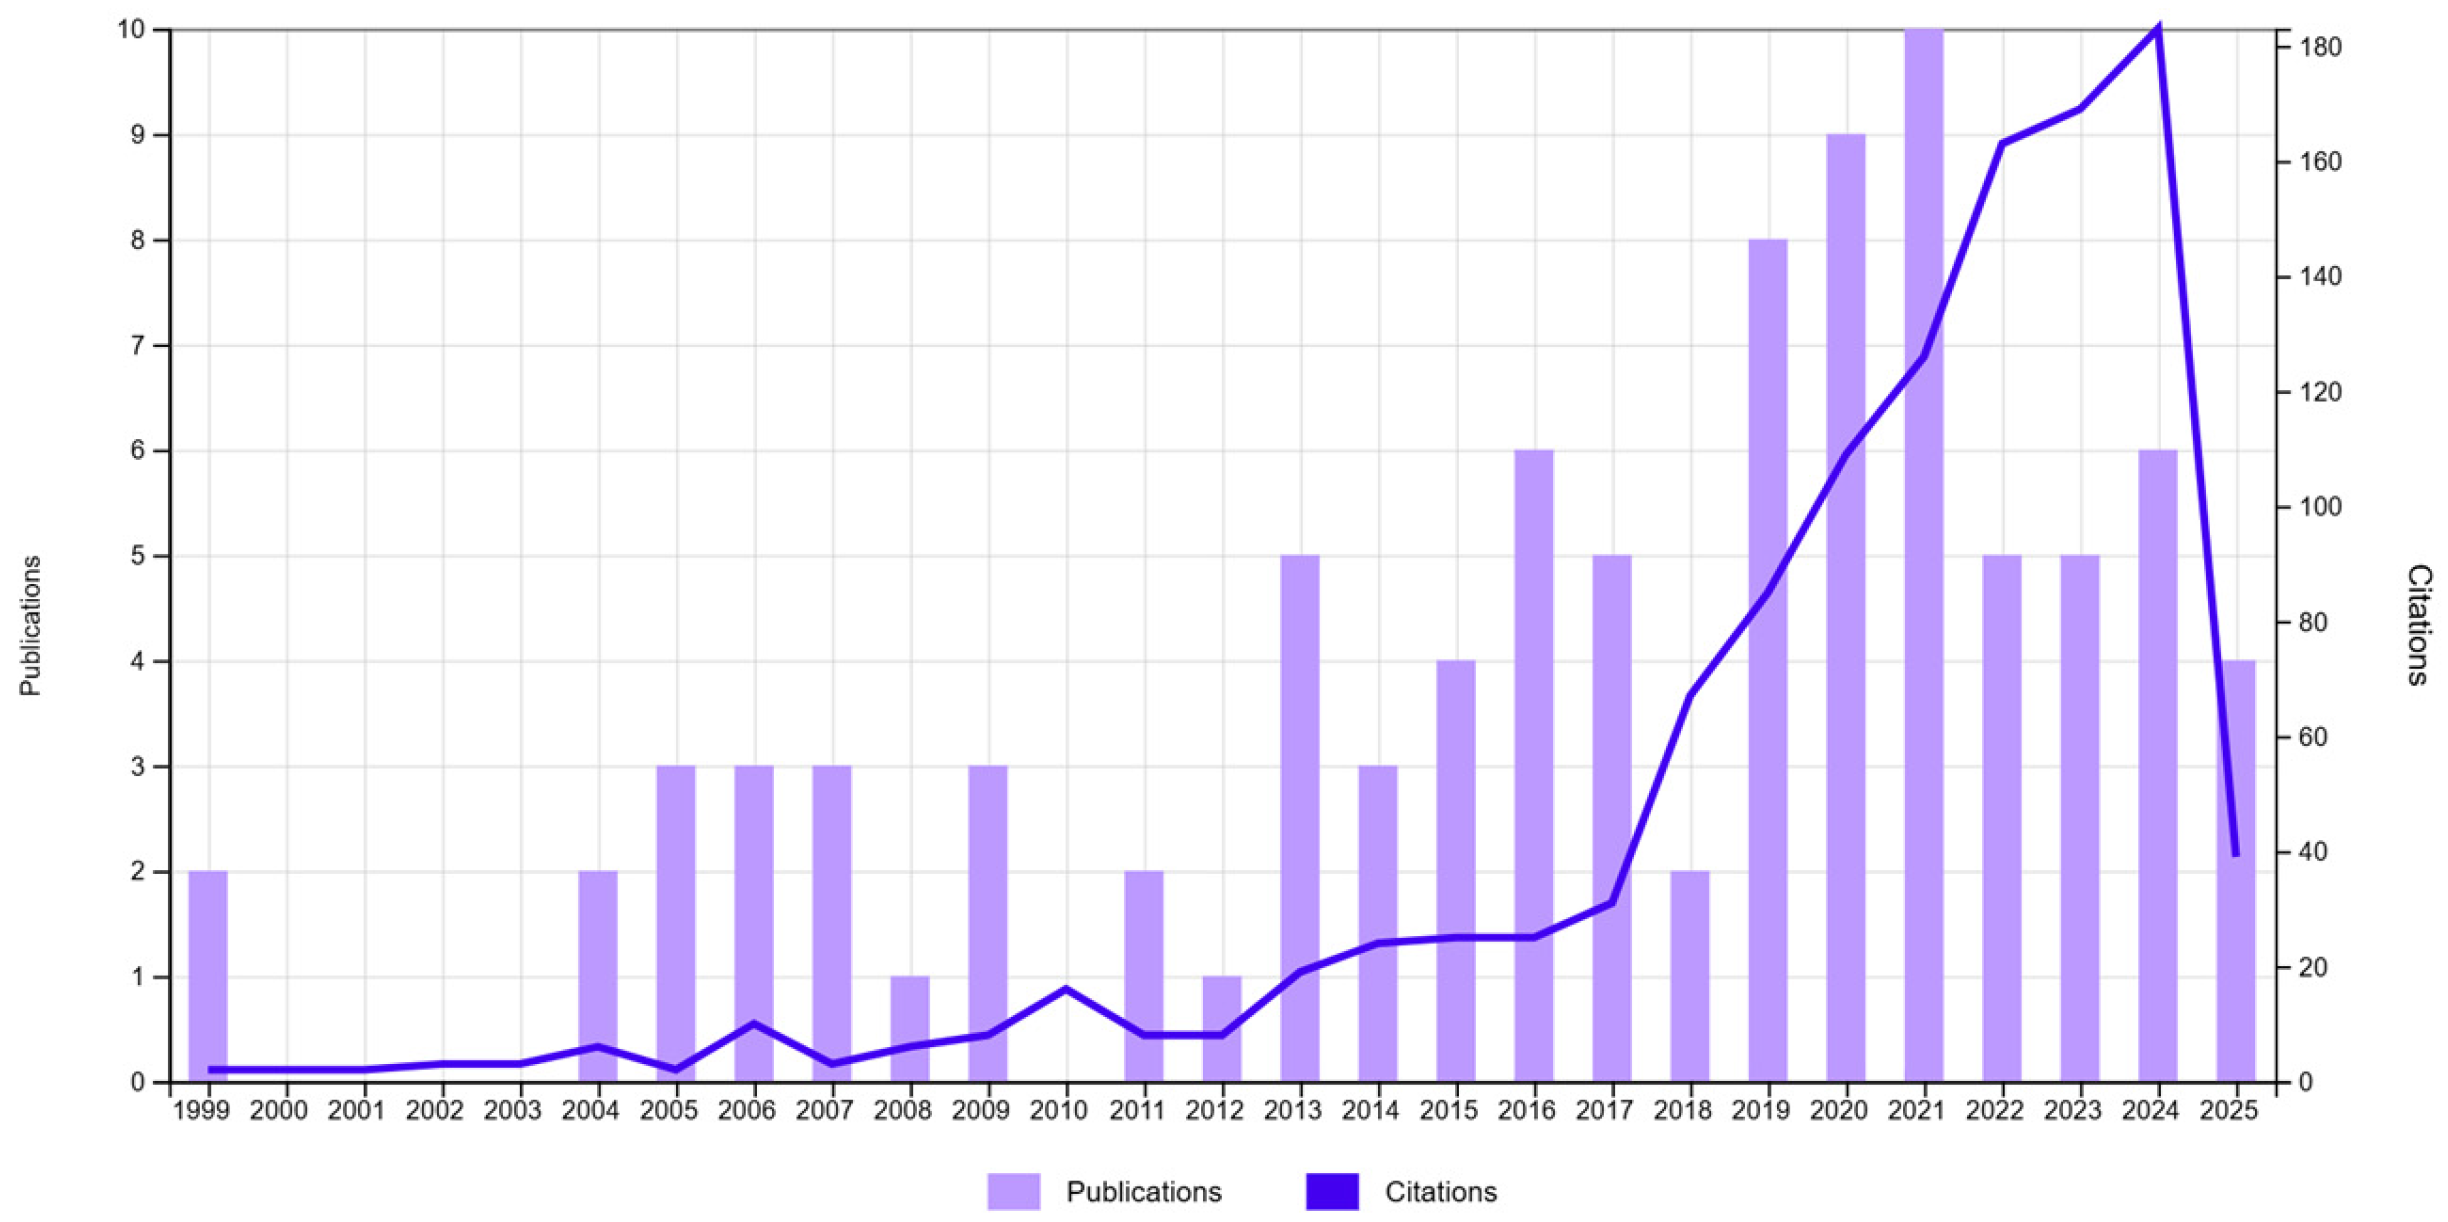
The integration of FCM in industrial quality control remains a relatively underexplored research area, as indicated by the low number of publications over time; see
Figure 1.
An analysis of publications related to the application of FCM in industrial quality control reveals a relatively low number of studies in this domain. An examination of the research categories associated with these publications shows that most studies are concentrated in the field of Artificial Intelligence (22 articles), rather than in traditional industrial or manufacturing disciplines. Other relevant areas include Instrumentation (14 articles), Computer Information Systems (13 articles), and Manufacturing Engineering (7 articles). This distribution suggests that, although FCM is widely used in AI-driven research, its direct application to quality control and defect detection in industrial environments remain limited.
A focused review of the recent literature confirms this observation: the use of fuzzy clustering methods, particularly FCM, in industrial quality control, is still uncommon [
13]. Most of the identified studies apply FCM in image-based defect detection workflows, typically for segmentation or preprocessing purposes [
14,
15], rather than for process-level quality assessment or real-time control.
Given these gaps, further exploration is needed to improve the applicability of FCM-based clustering models in industrial settings. The integration of ML, XAI, and fuzzy clustering techniques could provide a more interpretable and effective approach to quality control and defect prediction. The next section analyzes the contribution of machine learning to defect classification, evaluating whether current models deliver sufficient accuracy and transparency for industrial use.
2.2. Machine Learning for Defect Prediction
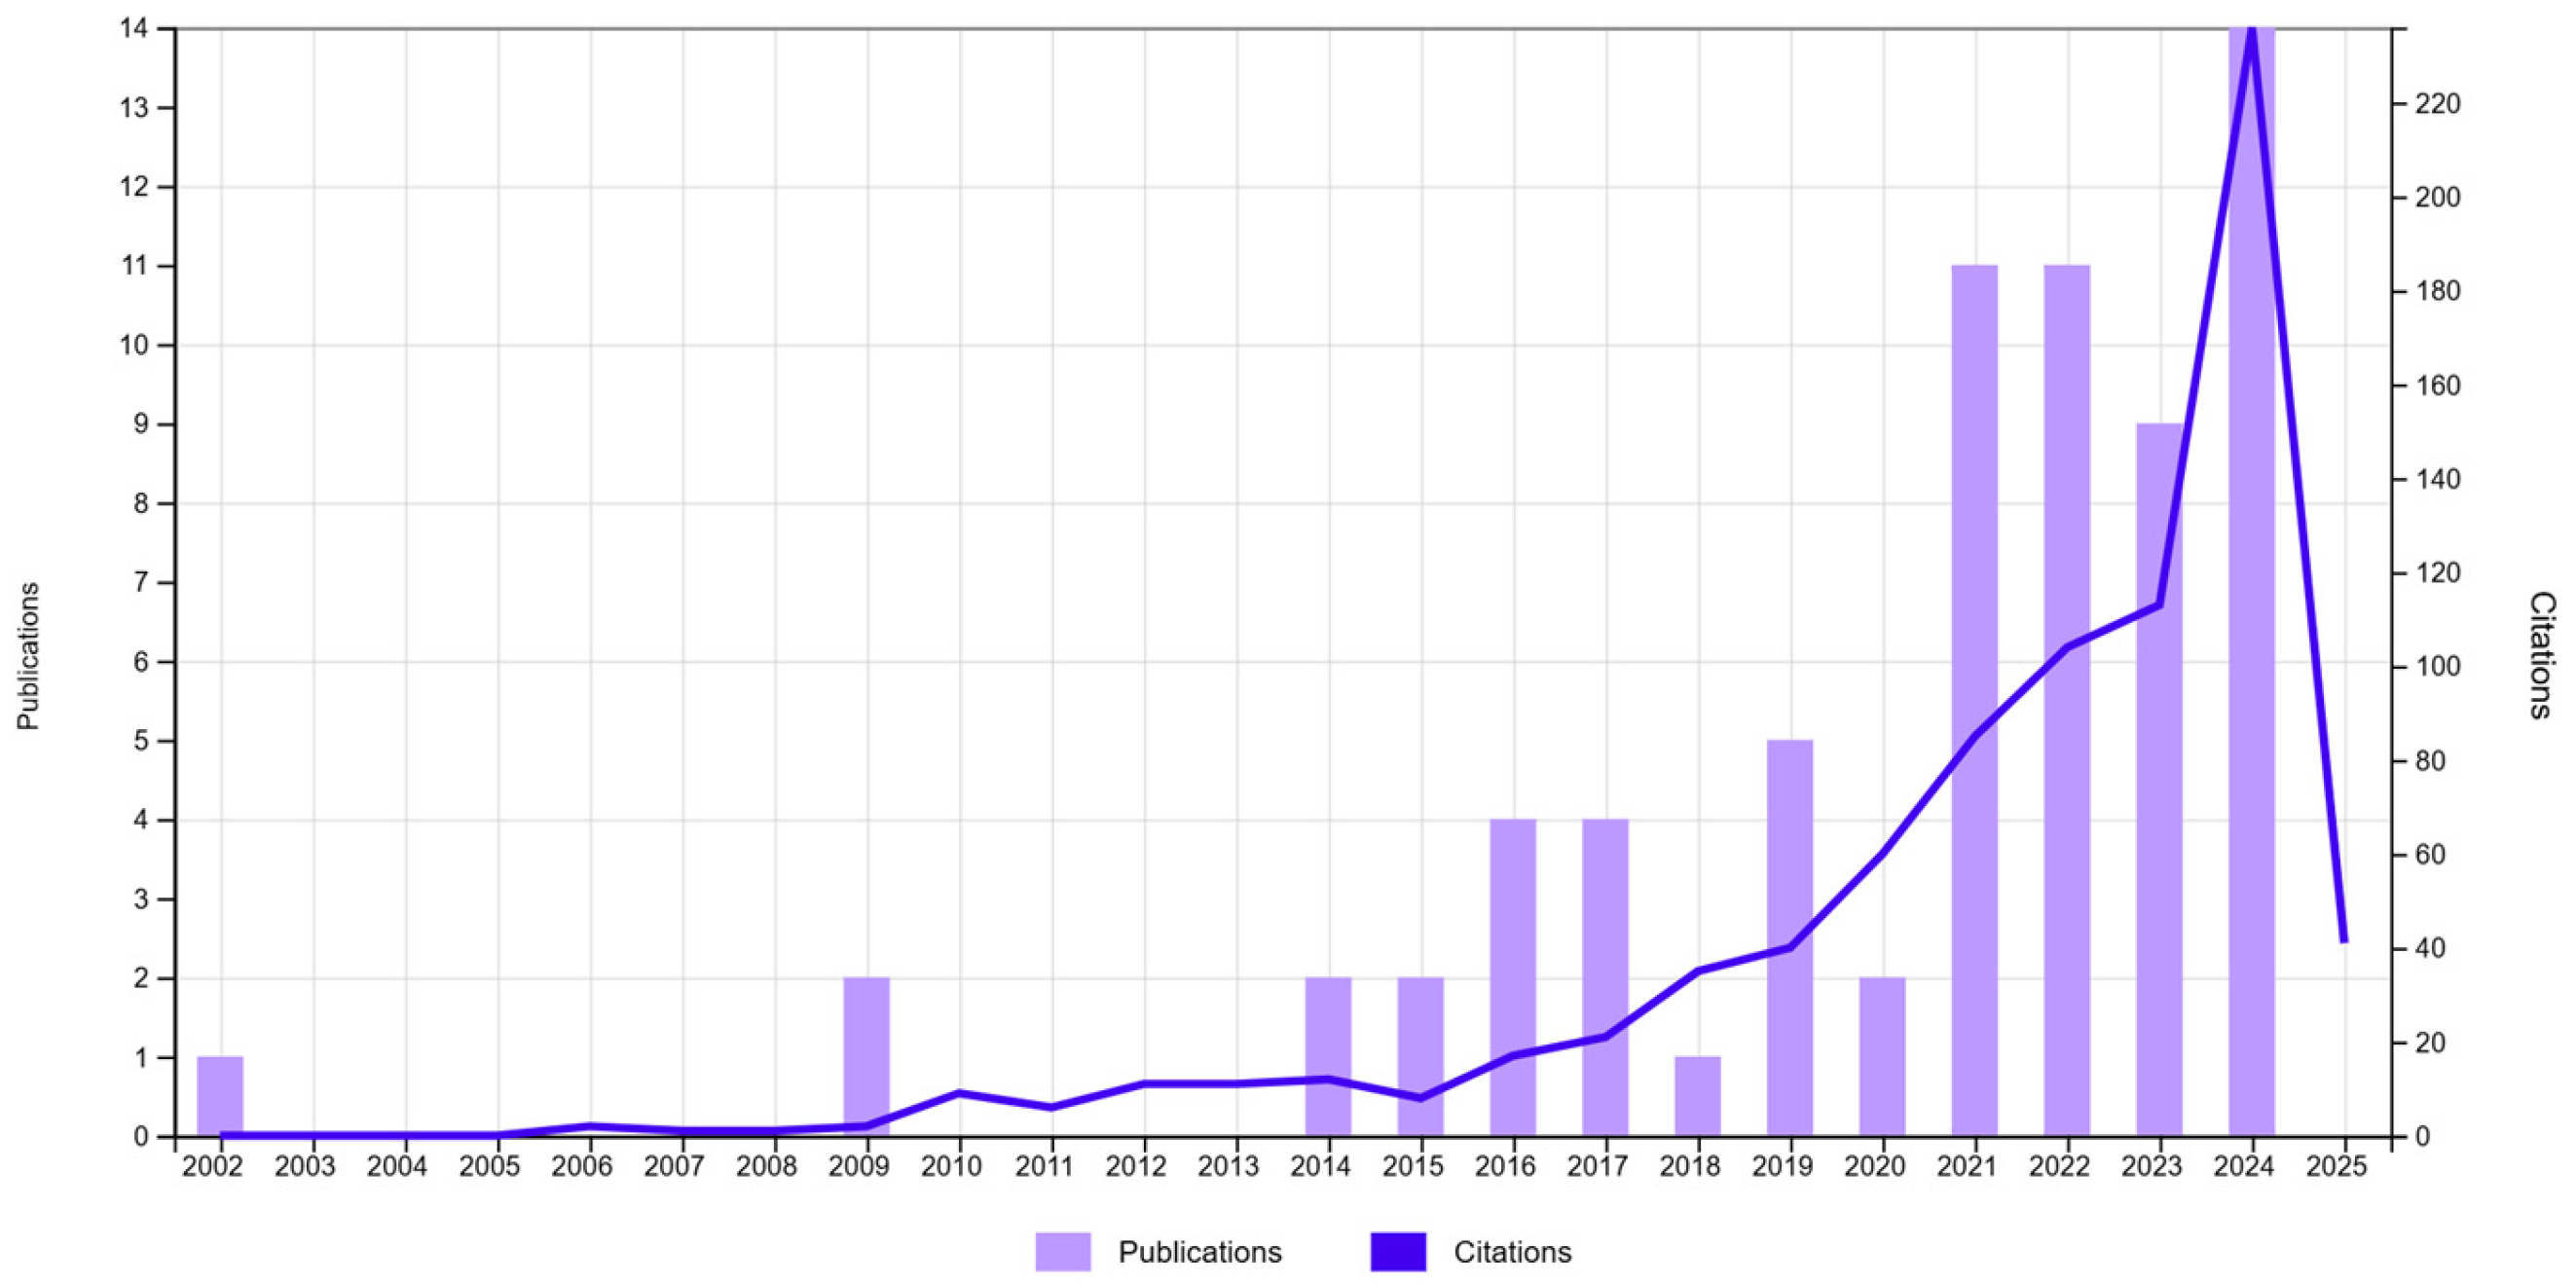
The search focused on the application of ML models, particularly XGBoost, Random Forest (RF), and Support Vector Machines (SVM), in defect classification and quality assessment; see
Figure 2. The results indicate a strong increase in research output since 2016, with exponential growth in publications and citations peaking in 2024.
The rapid rise in ML applications highlights their growing importance in quality management and predictive maintenance. Among the models, XGBoost is used as a preferred algorithm due to its ability to handle high-dimensional data, perform automatic feature selection, and provide robust predictive accuracy even with imbalanced datasets [
11,
16].
However, despite the high performance of these models, a significant limitation remains: the lack of interpretability. Most ML algorithms, especially ensemble models like RF and boosting methods, behave as black boxes, making it difficult for domain experts to understand how decisions are made [
5].
The next section will explore how Explainable Artificial Intelligence (XAI) techniques have been developed to address this challenge, enabling industrial stakeholders to interpret model behavior and trace prediction logic.
2.3. Explainable AI (XAI) in Quality Control
The search focused on the application of XAI techniques, including SHAP, LIME, and interpretable machine learning models, in quality control systems across industrial and chemical production environments.
The results reveal a relatively low but growing number of publications, with a notable increase in research output since 2019. The publications indicate that XAI is still an emerging area in industrial quality control; see
Figure 3.
Recent research has increasingly focused on integrating XAI with machine learning in industrial quality control systems. A convolutional neural network (CNN)-based framework with U-Net and Feature Pyramid Network architectures was proposed to detect defects in steel sheets under real industrial conditions [
17], enhanced with SHAP and LIME, to detect defects in steel sheets under real industrial conditions. Similarly, a smart decision support system for stainless steel manufacturing by combining gradient boosting models with XAI tools to predict surface roughness and identify root causes of quality deterioration [
18]. Other works emphasize the growing importance of interpretability and human-centric AI in manufacturing analytics [
19,
20].
Overall, the analysis confirms that XAI techniques are gaining traction in industrial settings, but there is still a lack of research bridging explainability with predictive modeling and defect detection in chemical and manufacturing processes. Further exploration is needed to fully integrate XAI with clustering and ML models, thus enhancing trust and transparency in AI-driven quality control systems.
2.4. Hybrid Approaches: FCM + ML + XAI in Quality Control
The review of studies combining FCM, ML, and XAI in industrial quality control and defect classification returned no results in the Web of Science (WOS) database. Given this absence, the proposed methodology represents a novel contribution, offering a new direction for AI-based quality control in industrial and chemical processes. This finding reinforces the need to investigate hybrid models that balance predictive accuracy, clustering flexibility, and explainability in real manufacturing environments.
Although there is growing interest in applying supervised models and explainability tools to industrial datasets, no prior work has proposed an integrated framework that unifies fuzzy clustering, supervised classification, FIS, and XAI for decision support in quality control. This gap underscores the originality of the present research, which seeks to provide robust classification performance, transparent, and interpretable reasoning that aligns with the operational demands of industrial environments.
3. Methodology
The proposed methodology follows a structured approach integrating FCM clustering, ML, and FIS for defect detection and quality assessment in industrial processes; see
Figure 4. The first step involves data collection and preprocessing, where real-world dataset are used to ensure the model’s applicability. Data normalization and feature selection are performed to enhance model accuracy and stability.
Following preprocessing, FCM clustering is applied to segment production batches into quality groups, allowing for an initial categorization of defects. The optimal number of clusters is determined using validity indices such as Xie–Beni and Silhouette scores, ensuring effective partitioning of the dataset.
Once clustering is complete, a supervised ML model (XGBoost) is trained to classify defective and non-defective batches based on historical production data. Hyperparameter tuning is performed to maximize model performance, and evaluation metrics such as accuracy, precision, recall, and F1-score are used to assess the effectiveness of the classification model.
To enhance decision-making, an FIS is implemented to refine quality assessment. This system integrates expert-defined rules with ML predictions to provide an explainable quality score. The FIS employs membership functions and fuzzy logic operators to model uncertainty and improve interpretability in quality evaluation.
To ensure transparency in defect classification, XAI techniques, including SHAP and LIME, are applied to interpret model predictions. These techniques identify key features influencing defect classification, providing insights into the decision-making process, and increasing trust in AI-driven quality control.
The methodology is tested using real dataset to validate its robustness and generalizability.
The data used in this study originate from the Wine Quality Dataset [
21], which is publicly available through the UCI Machine Learning Repository and OpenML (Dataset ID: 40498). This dataset, based on physicochemical analyses of white wines, serves as a standard benchmark in quality prediction tasks. Following dataset selection, the methodology was applied in a structured sequence to assess model performance and interpretability.
3.1. Data Collection and Preprocessing
The first phase of the proposed methodology focuses on the acquisition, preprocessing, and standardization of the data, ensuring that the dataset used is adequately prepared for the development of the learning models and consequently the quality assessment process. This step aims to eliminate inconsistencies to improve the performance of the models and ensure that the results are reproducible. The methodology follows a structured approach to dealing with data, regardless of where they come from. Data acquisition involves the selection of datasets containing characteristics relevant to quality assessment in industrial processes, including physicochemical attributes, sensor measurements, and expert assessments.
Once the data are collected, feature selection is performed to retain only the relevant variables that contribute significantly to the classification of quality levels. To improve computational efficiency, features with high redundancy, many missing values, or low variance are removed. If necessary, dimensionality reduction techniques, such as principal component analysis (PCA) [
22], can be applied to further refine the dataset while retaining essential information. Since industrial datasets contain variables measured at different scales, data normalization is performed using the Min-Max Scaling method [
16]. This approach ensures that all features contribute equally to the clustering and classification processes by rescaling the data to a fixed range [0, 1]. Min-Max normalization is particularly suitable for FCM, which is sensitive to variable magnitude due to its distance-based nature. It also preserves the original data distribution, which is beneficial for interpretability in XAI techniques. This transformation follows the following equation:
where
represents the normalized value,
is the original value, and
and
denote the minimum and maximum values of the feature, respectively. Standardizing feature values prevents models from being biased toward attributes with larger numerical ranges and improves the stability of clustering algorithms.
The treatment of missing data is a necessary step in data pre-processing, and incomplete records can compromise the integrity of the model. Missing values are treated using techniques such as imputation to the mean, median, or K-Nearest Neighbors (KNN) [
23]. If a dataset contains a considerable proportion of missing values, data augmentation techniques can be applied to preserve statistical balance and avoid loss of information.
In classification tasks, class imbalance is a common problem that can lead to biased predictions. Many real-world datasets have unequal distributions of quality levels, and some classes are underrepresented. To mitigate this problem, techniques such as oversampling, including the Synthetic Minority Oversampling Technique (SMOTE), and undersampling are applied to balance the dataset before training ML models [
24]. These methods ensure that the model does not favor the majority class, which improves classification performance, accuracy, and recall.
Once the data pre-processing phase is completed, the dataset is fully prepared for FCM clustering, which will classify observations into meaningful quality groups based on intrinsic similarities. The next phase of the methodology focuses on the application of FCM for quality segmentation, the determination of the optimal number of clusters, and the assessment of their relevance for defect detection and quality control.
3.2. FCM Clustering for Quality Segmentation
The second phase of the methodology involves the application of FCM, a technique that allows classifying each sample into multiple clusters with different degrees of membership [
25]. This method is well suited for quality assessment in industrial processes, as it allows for a more flexible classification of products by considering the uncertainties inherent in quality assessment. Unlike traditional clustering methods, where each instance is assigned to a single cluster, FCM assigns membership values to each data point, indicating the degree of association with different clusters, which is relatively important when trying to adjust and observe gradual variations in product quality.
The clustering process begins with the mathematical formulation of FCM, which is based on the minimization of the following objective function:
where
represents the total number of data points in the dataset, while
denotes the number of clusters to which data points are assigned. Each data point is represented as
, where
refers to the index of the sample in the dataset, and each cluster has a centroid
, which defines the central position of the cluster in the feature space. The membership degree
indicates the degree to which data point
belongs to cluster
, ensuring that the sum of membership values across all clusters equals one, as expressed by
The fuzziness exponent , with , controls the level of fuzziness in the clustering process, where higher values result in a more gradual membership distribution, allowing data points to belong to multiple clusters with significant membership values, while lower values make the clustering behavior more rigid and closer to hard clustering approaches.
The algorithm initializes cluster centroids randomly, iteratively updates membership values based on the distances between data points and centroids, and refines cluster centers until convergence is achieved. The termination condition is met when the change in cluster centers falls below a predefined threshold, ensuring stability in the clustering process.
An important aspect of the FCM methodology is the selection of the optimal number of clusters
, as an inappropriate choice may lead to over-segmentation or poor differentiation of quality levels. To determine the best value for
, cluster validity indices such as the Xie–Beni index and Silhouette Score are applied [
26]. The Xie–Beni index evaluates compactness and separation between clusters using the following:
where
is the
-th data point,
is the centroid of cluster
,
is the membership degree of
in cluster
,
and
is the total number of clusters. A lower
XB value indicates a better clustering structure with compact and well-separated clusters.
Similarly, the Silhouette Score measures how well each data point fits within its assigned cluster, with higher values suggesting well-separated clusters. It is defined for each sample as follows:
where
is the average distance between sample
and all other points in the same cluster, and
is the minimum average distance between sample
and all points in the nearest different cluster. The resulting score
ranges from −1 to 1, where values close to 1 indicate that the data point is well matched to its own cluster and poorly matched to neighboring clusters. The final Silhouette Score is obtained by averaging
over all samples. Higher values indicate better-separated and more compact clusters, making this metric useful to complement the Xie–Beni index in selecting the optimal number of clusters.
These metrics guide the selection of an optimal , ensuring that clusters represent distinct quality categories without excessive fragmentation.
Once the clustering is complete, an interpretation of the distributions obtained in each cluster is necessary. Each cluster represents a quality category, and the centroids of the clusters define representative physicochemical profiles. By analyzing the membership values, it is possible to determine the degree to which a sample belongs to a specific quality group, allowing a more nuanced assessment of product quality, and thus advancing to the next phase of defect detection based on machine learning. This leads into the next phase, which focuses on defect prediction using machine learning.
3.3. Machine Learning Model for Defect Prediction
The third phase of the methodology focuses on the application of XGBoost (Extreme Gradient Boosting) for defect classification, taking advantage of its high performance in structured data classification tasks [
11]. XGBoost is a gradient boosting ensemble algorithm based on gradient boosting, known for its efficiency, scalability, and ability to handle unbalanced datasets. This step helps to build a predictive model capable of accurately distinguishing between different quality levels, using the clusters identified in the previous phase as an additional feature for classification.
The model is trained using a set of physicochemical attributes, together with the quality labels defined in the dataset. The objective is to assign these input features to corresponding quality levels, allowing automated defect prediction. The XGBoost algorithm builds a series of decision trees sequentially, where each tree corrects the errors of the previous one. The optimization process is based on minimizing a loss function
, which in the case of classification tasks, is usually the logarithmic loss function:
where
represents the true class label,
is the predicted probability of the instance belonging to the target class, and
is the total number of training samples. The algorithm iteratively updates the model parameters to minimize
, improving classification accuracy while preventing overfitting through regularization techniques.
The next step is the application of hyperparameter tuning, which helps enhance model generalization and predictive performance [
27]. Hyperparameter tuning is performed using Bayesian Optimization or Grid Search with Cross-Validation, ensuring an optimal balance between bias and variance. In Cross-validation, the dataset is partitioned into multiple training and validation subsets, and model performance is evaluated on unseen data to select the best combination of hyperparameters.
After training and optimizing the model, performance evaluation is conducted using standard classification metrics to assess model reliability. The main evaluation metrics include accuracy, which assesses overall classification correctness, precision, which minimizes false positives, and recall (sensitivity), which measures the model’s ability to detect positive cases. The F1-Score balances precision and recall, particularly useful for imbalanced datasets, while the ROC Curve and AUC quantify the model’s ability to distinguish between classes, with higher AUC values indicating better classification performance.
Once this phase is completed, we can determine the relevant features for predicting the quality of the samples, and they serve as input for the FIS in the next stage, where expert knowledge is integrated to refine the quality assessments.
3.4. Fuzzy Inference System (FIS) for Quality Assessment
The fourth phase of the methodology focuses on the implementation of an FIS for quality assessment, integrating expert knowledge with machine learning predictions to enhance interpretability and decision-making [
28]. Traditional classification models often provide deterministic outputs, categorizing a product into discrete quality classes without accounting for gradual variations in quality. By incorporating fuzzy logic, the model allows for a more flexible and human-interpretable evaluation of product quality, making it particularly useful in industrial applications where quality is not strictly binary but instead exists on a spectrum.
The first step in the implementation of FISs is the definition of fuzzy rules for quality scoring, which are derived from domain expertise, historical data, and machine learning predictions. These rules define how different physicochemical properties and the predicted quality classification interact to determine the final quality score. A typical rule-based structure in the fuzzy system is represented through a triangular model in three fuzzy variables (low, medium, high); see
Figure 5:
These fuzzy rules capture the gradual transitions between different quality levels, enabling a more interpretable and adaptable quality assessment system.
Once the rules are established, the next step involves selecting and implementing membership functions, which define how input variables (e.g., acidity, alcohol, and sulphates) are mapped into fuzzy sets. Triangular, trapezoidal, Gaussian, and sigmoid functions are commonly used, with the selection depending on the data distribution and expert recommendations. A membership function
represents the degree to which a variable belongs to a fuzzy set and is defined as follows:
where
represents the set of values that the variable can take, and
assigns a value between 0 (no membership) and 1 (full membership) to each input
in the fuzzy set
. A common form of triangular membership function is defined by the following:
For this study, triangular membership functions were selected due to their computational efficiency and suitability for representing gradual transitions. These functions are defined by three parameters: (lower limit), (peak), and (upper limit), forming a triangular shape.
The final step is the integration of FISs with ML predictions, ensuring that machine learning outputs contribute to the fuzzy decision-making process. The predicted quality class from the XGBoost model serves as an input to the FIS, refining the final quality assessment based on domain-specific fuzzy rules. This integration follows a hybrid approach, where the ML model provides initial predictions, and the fuzzy system adjusts the decision based on additional interpretability criteria. The defuzzification step converts the fuzzy quality scores into a final numerical output or a categorical decision, which can be used for real-time quality monitoring and industrial automation.
Upon completing this phase, the methodology provides an explainable and adaptive quality assessment framework, preparing the system for the next stage: interpretability analysis using XAI to further enhance transparency in decision-making.
3.5. Explainability and Model Interpretation (XAI)
The fifth phase of the methodology focuses on improving the interpretability and transparency of the machine learning model using XAI techniques. Traditional black-box models, such as XGBoost, provide high predictive accuracy but lack interpretability, which can lead to a lack of confidence in decision-making by quality specialists. To address this problem, this study integrates SHAP (Shapley Additive Explanations) and LIME (Local Interpretable Model-Agnostic Explanations) techniques to analyze the contributions of features and decision reasoning to defect prediction.
3.5.1. Application of SHAP for Global and Local Interpretability
SHAP values are derived from game theory and provide a method to help understand how each feature contributes to a model’s predictions [
29]. The SHAP methodology assigns an important value to each input feature, quantifying its contribution to the predicted quality rating. The SHAP value of a given feature
is calculated as follows:
where
quantifies the contribution of feature
to the model’s prediction for a specified instance,
is the set of all input features,
is a subset of features excluding feature
, and
is the model prediction using only the features in subset
. The summation considers all possible feature subsets that exclude
, weighting their contribution according to their size.
SHAP values are used in global interpretability to rank features by their overall impact on predictions, and in local interpretability to provide a breakdown of individual predictions. In an industrial quality control environment, this allows experts to identify which physicochemical attributes most influence defect classifications and take corrective action accordingly.
3.5.2. Application of LIME for Local Interpretability
LIME (Local Interpretable Model-Agnostic Explanations) is used to approximate the behavior of a complex model with a simpler interpretable model in the vicinity of a specific prediction [
29]. It generates perturbed samples around a given data point and measures how the model responds by fitting a linear surrogate model:
where
is the local surrogate model,
are the feature weights, and
the feature values used in the explanation.
By fitting this simplified model, LIME provides human-readable explanations of the features contributing most to a given prediction, supporting quality specialists in understanding why a sample has been classified as defective or high-quality.
3.5.3. Evaluation of Interpretability in Industrial Settings
The interpretability of the model is assessed using quantitative and qualitative methods to ensure that it conforms to industrial requirements. The assessment includes, from the study of the importance of the features in the prediction model, SHAP assists in this task. On the other hand, LIME helps to compare local predictions and detect possible inconsistencies.
Second, validation by domain experts assesses whether the explanations provided by the models conform to real industrial criteria, enhancing trust and supporting deployment in production environments.
This phase ensures that the explanations provided by XAI techniques lead to improved quality systems in production environments, facilitating real-time decision making.
3.6. Performance Metrics and Validation Strategy
The final phase of the methodology focuses on evaluating the overall performance of the FCM-ML-FIS-XAI hybrid framework, ensuring its reliability, accuracy, and interpretability in industrial quality control. The validation strategy is designed to assess both predictive performance and interpretability, ensuring that the proposed system provides practical information in real manufacturing environments.
The performance of the XGBoost quality measurement model is evaluated using standard classification metrics such as accuracy, precision, recall, F1-score, and ROC-AUC score. To prevent overfitting and validate generalizability, k-fold cross-validation is used, where the dataset is divided into subsets, which are used iteratively for training and testing, with the final performance score averaged over all iterations. This ensures that the model remains stable across different batches of production data.
Beyond predictive accuracy, the FIS is evaluated to ensure reliable and interpretable quality assessments. This involves an analysis of the consistency of the rules, verifying whether they conform to the knowledge of the experts, optimizing the membership function of each cluster, and thus improving the accuracy of the clustering process. The Mean Absolute Error (MAE) is used, which compares the defuzzied quality scores with the real-world quality labels, where a lower MAE indicates a closer alignment between the fuzzy system results and the assessments defined by the experts. Furthermore, to validate the interpretability of the model, SHAP and LIME explanations are assessed by feature importance alignment, which ensures that SHAP feature rankings correspond to experts’ expectations, and consistency between predictions, which verifies that explanations remain stable for similar quality samples. The local consistency score (LCS) is calculated to quantify the stability of LIME explanations by measuring variations in feature weight assignments across multiple similar predictions, where a lower LCS indicates higher reliability in model explanations.
Additionally, considerations for scalability and industrial deployment are analyzed, ensuring that the system is computationally efficient and capable of handling large-scale production environments. The framework is tested for its ability to process large volumes of data in real time, ensuring its feasibility for integration with existing industrial quality control systems. The final deployment feasibility is evaluated by measuring the processing time per sample, ensuring that defect predictions and quality assessments can be executed within standard industrial production cycles. Upon completing this phase, the hybrid framework is validated, demonstrating its effectiveness in predicting defects, refining quality assessments, and providing interpretable insights for decision-making in industrial settings.
4. Results
This section is structured according to the phases outlined in the methodological framework, covering data preprocessing, FCM for fuzzy clustering, machine learning for XGBoost for quality measurement, FISs for quality assessment, and XAI for model interpretability. Each phase is accompanied by a detailed analysis of the results, leveraging the evaluation metrics established in
Section 3.6 to assess the performance, accuracy, and interpretability of the proposed hybrid approach.
4.1. Wine Quality Data Collection and Preprocessing
The first phase of this study focuses on the collection and preprocessing of data to facilitate subsequent clustering and predictive modeling. The dataset used is the Wine Quality Dataset [
21], sourced from the UCI Machine Learning Repository and OpenML [Dataset ID: 40498], which contains physicochemical measurements of white and red wines. This dataset provides a structured basis for analyzing wine quality by examining key chemical properties and their influence on the final product.
4.1.1. Dataset Characteristics
The dataset consists of two separate subsets, one for white wine and another for red wine, allowing an independent analysis of each wine type. The target variable, quality, is a discrete score ranging from 0 to 10, though most samples fall within the 3–9 range. The dataset includes 11 physicochemical attributes, which can be categorized into the following groups:
Acidic Components: Fixed acidity, volatile acidity, and citric acid, influencing taste, stability, and fermentation.
Sugars and Chlorides: Residual sugar and chlorides, affecting sweetness, microbial stability, and preservative effects.
Chemical Composition: Free sulfur dioxide, total sulfur dioxide, density, and pH, impacting oxidation resistance and microbial growth.
Alcohol and Sulphates: Alcohol content and sulphates, contributing to body, texture, and aromatic properties.
Each variable is continuous and numerical, measured on a real-valued scale. Since physicochemical properties can vary significantly between red and white wines, this study focuses exclusively on the analysis of white wine.
4.1.2. Exploratory Data Analysis (EDA)
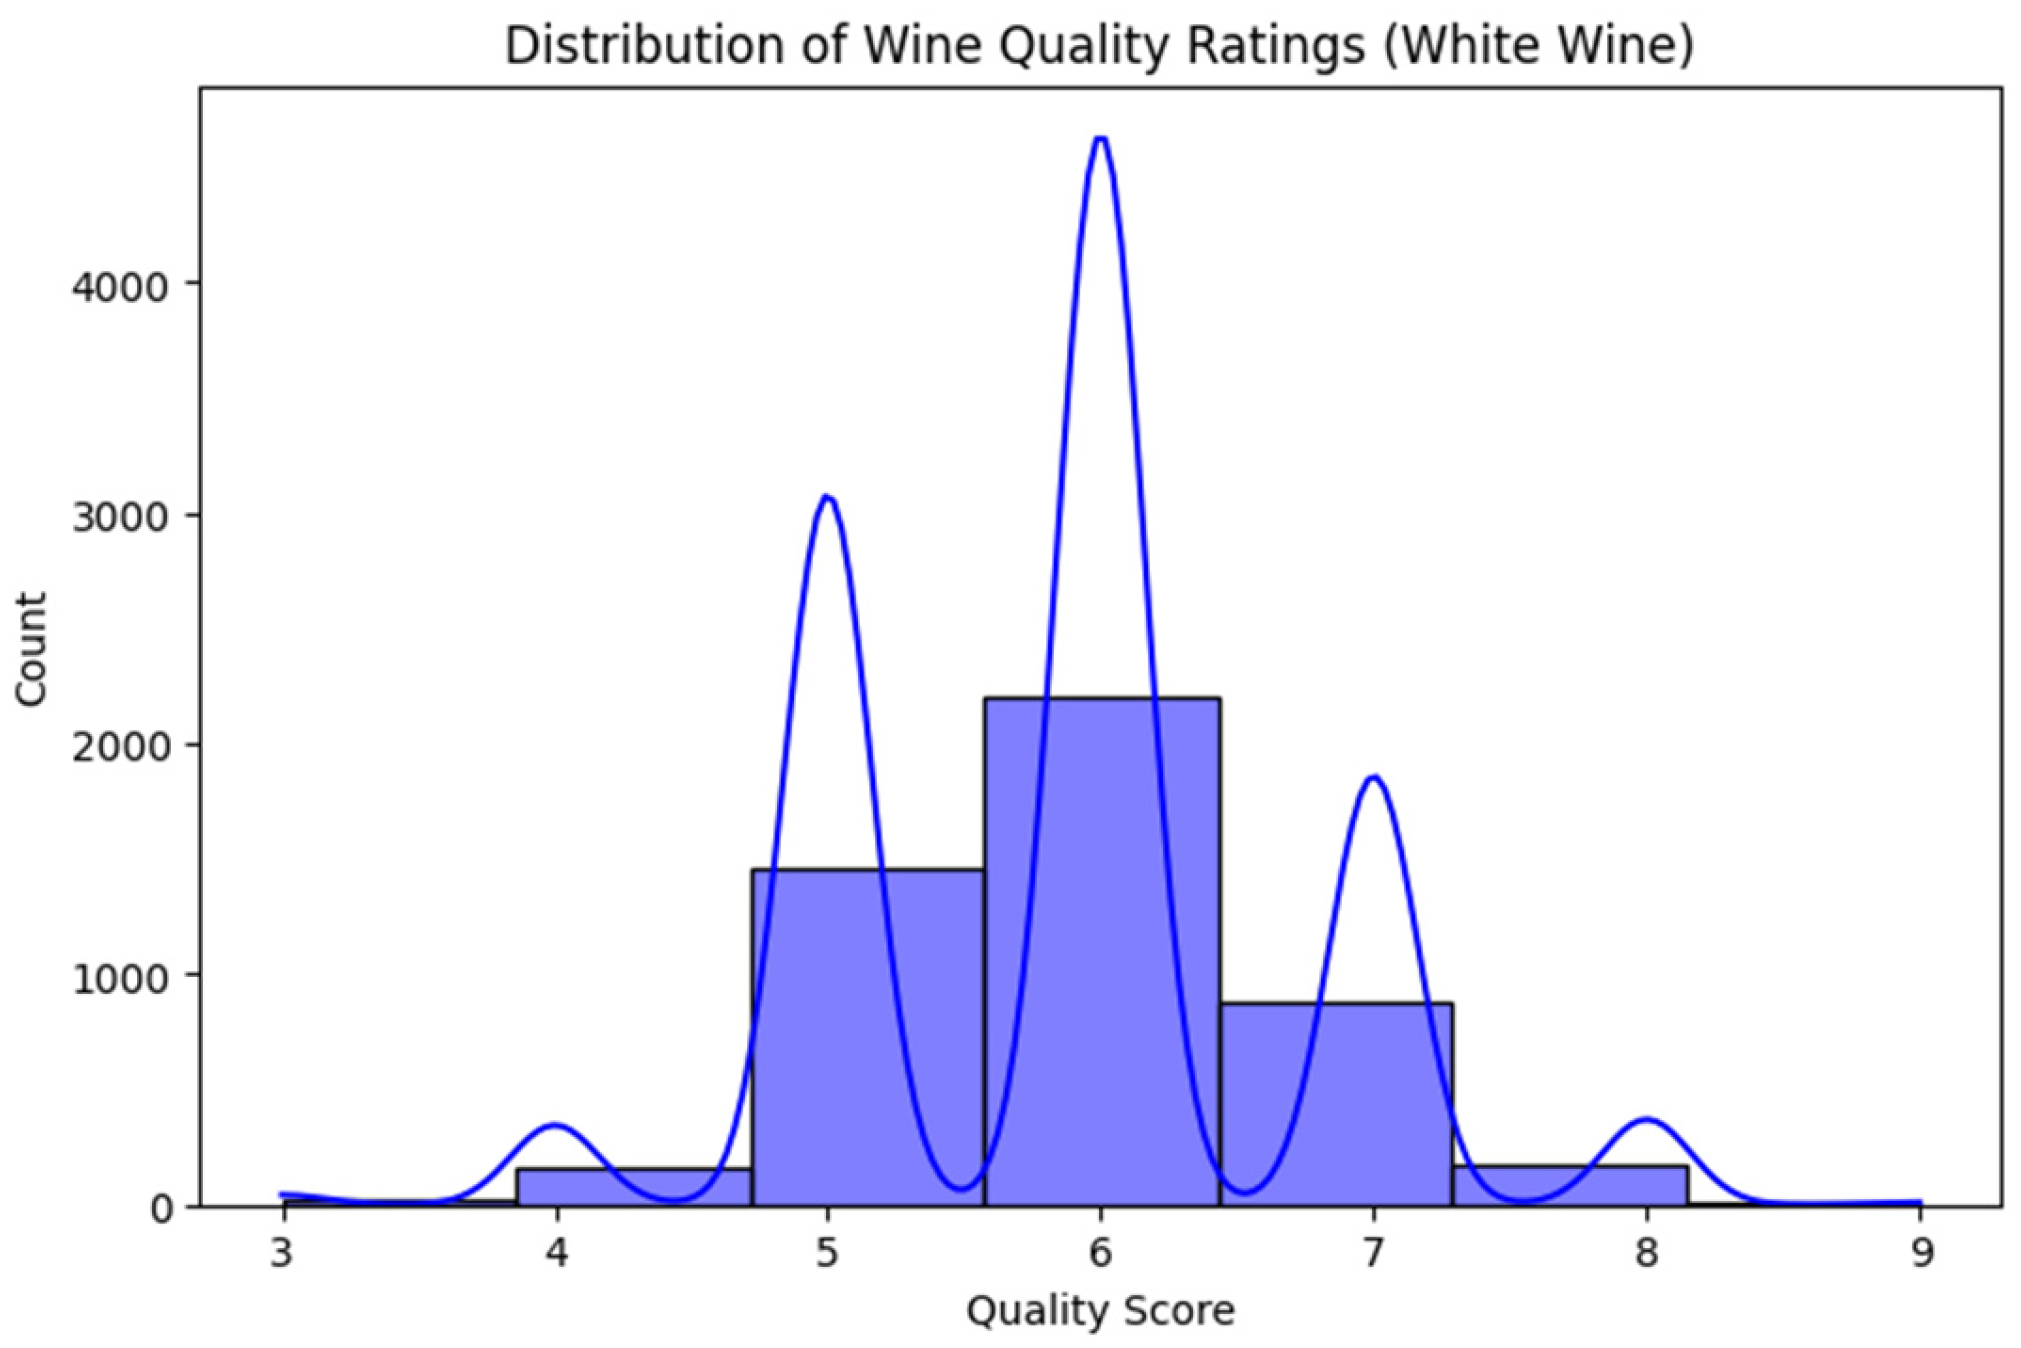
Before implementing clustering and machine learning models, an exploratory data analysis (EDA) was conducted to assess the distribution of quality ratings, check for missing values, examine feature correlations, and identify potential outliers.
The exploration data analysis included multiple steps to ensure a comprehensive understanding of the dataset before applying clustering and predictive modeling techniques. First, a histogram of quality scores was generated to analyze the frequency distribution of different wine quality levels, providing insight into the imbalance of quality ratings; see
Figure 6.
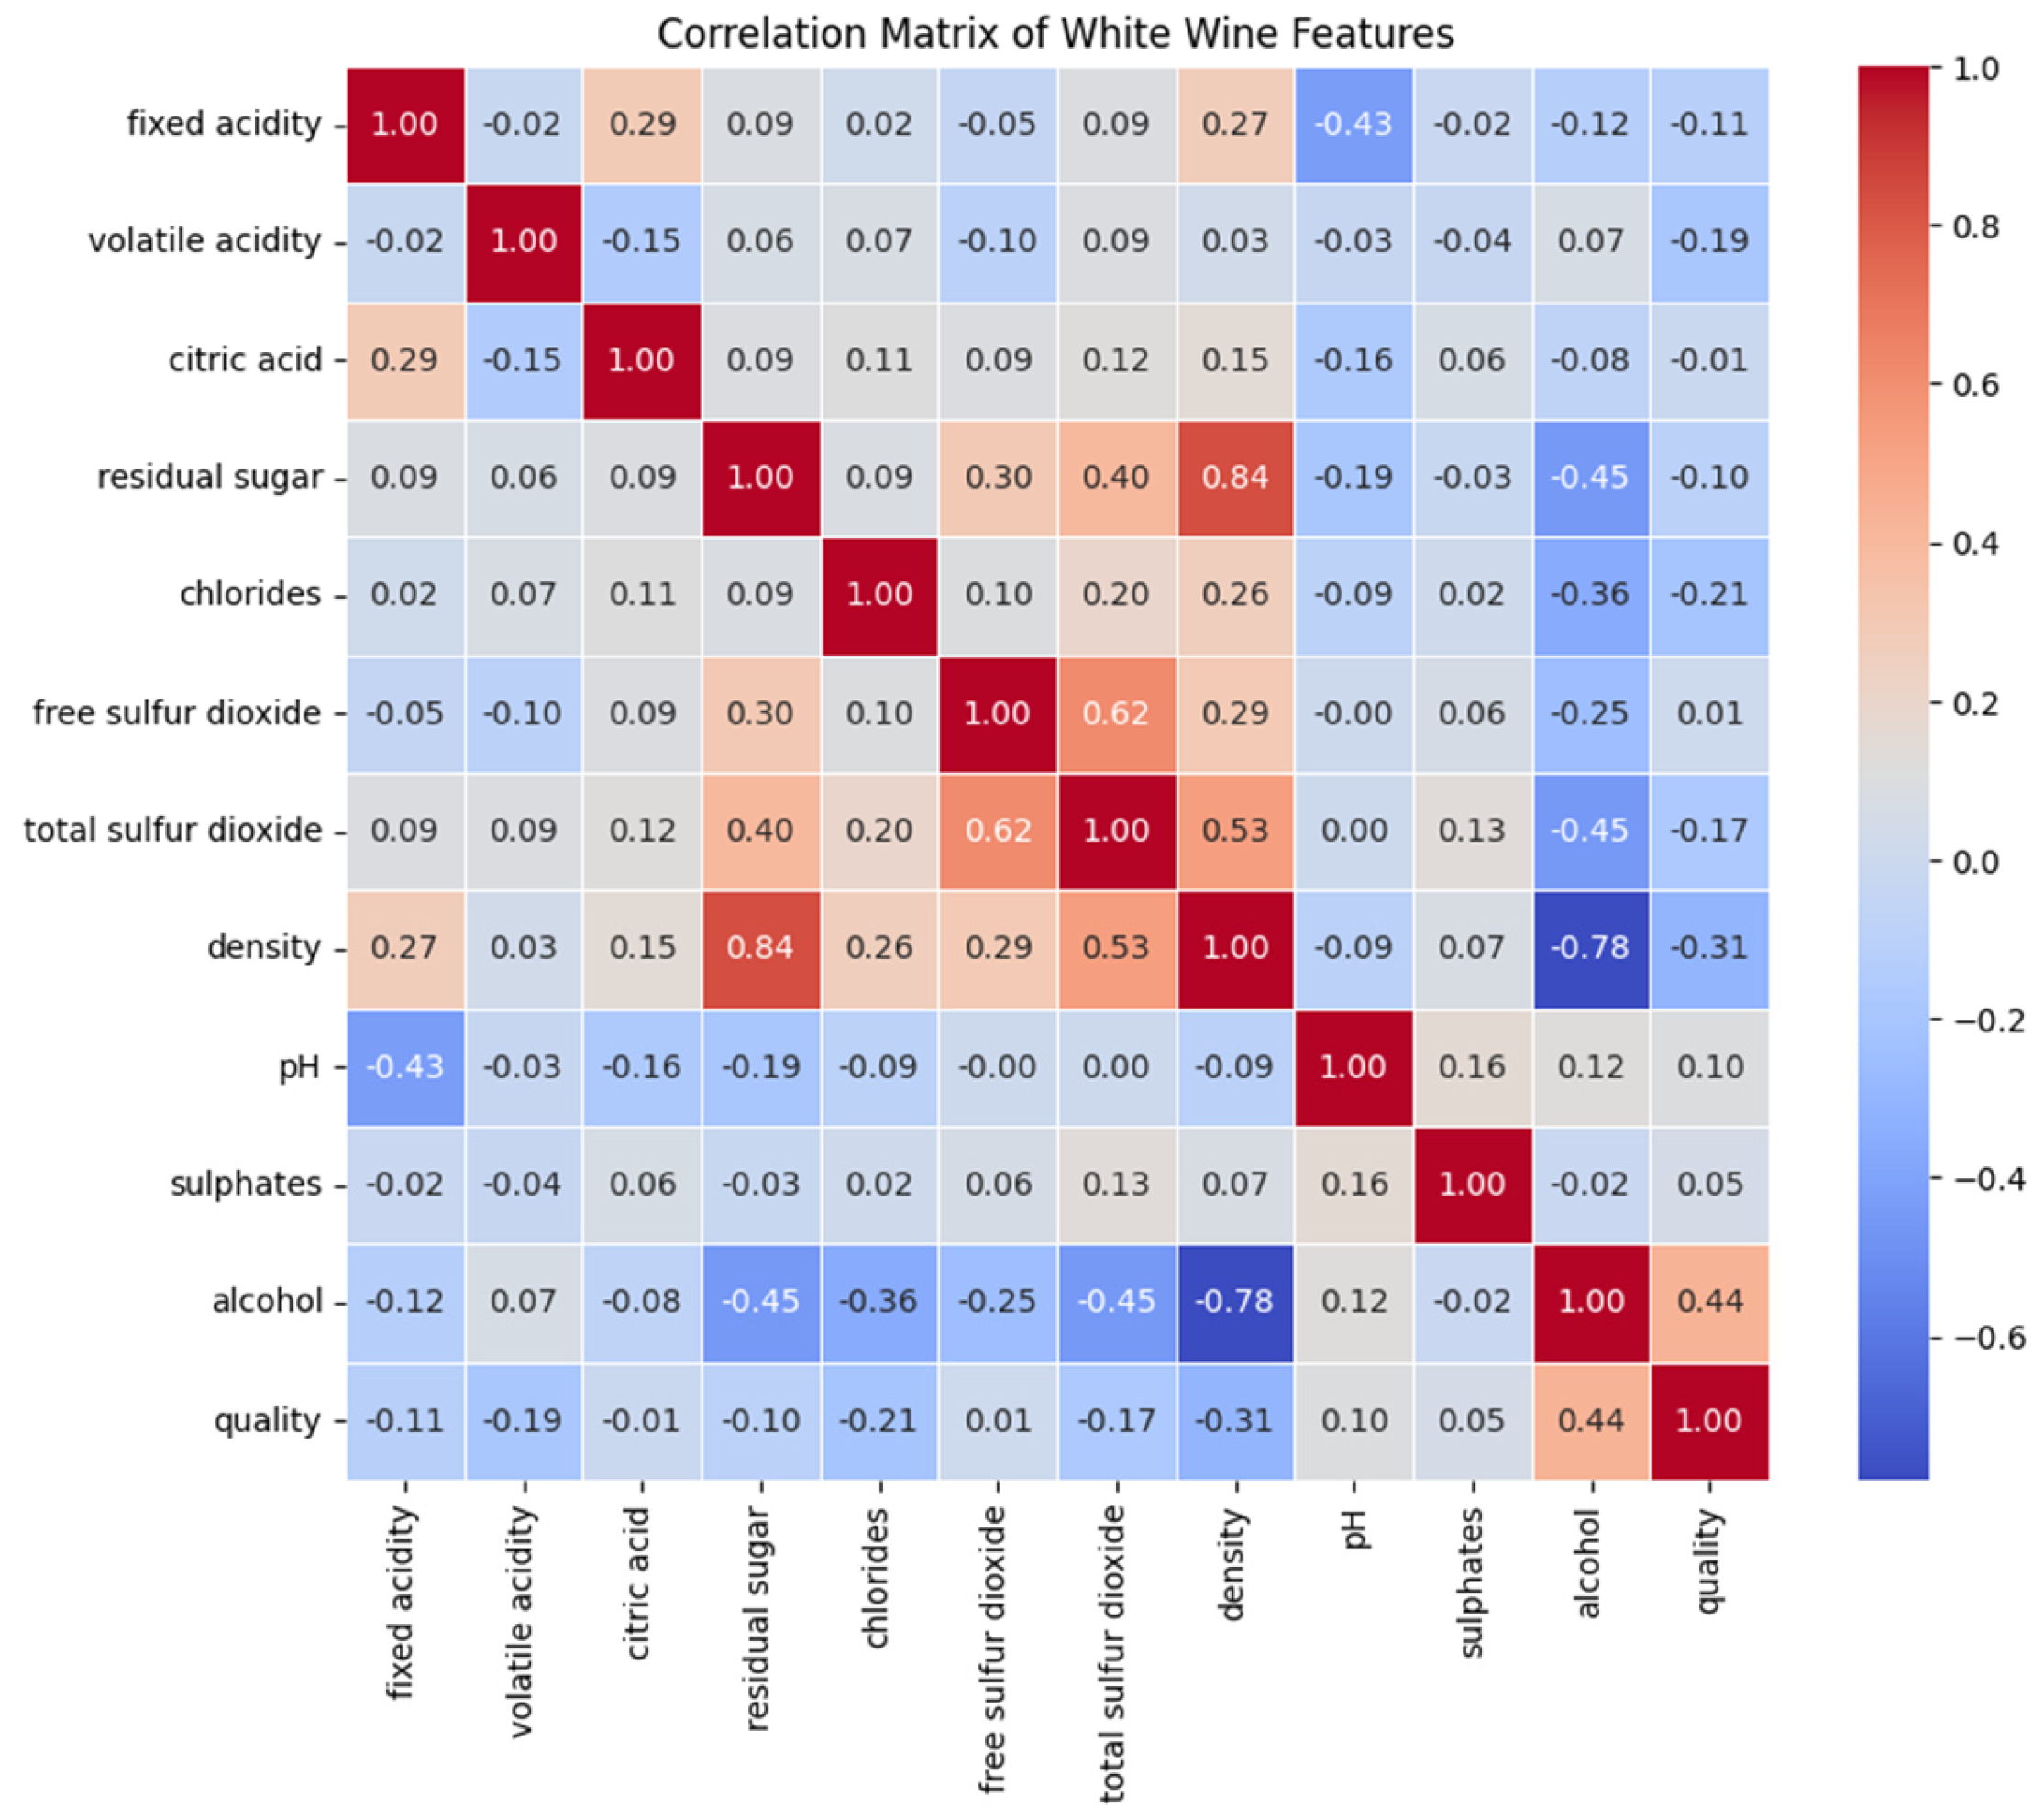
Next, a correlation matrix was computed to examine relationships between physicochemical properties and wine quality, allowing the identification of the most influential attributes affecting the final classification; see
Figure 7.
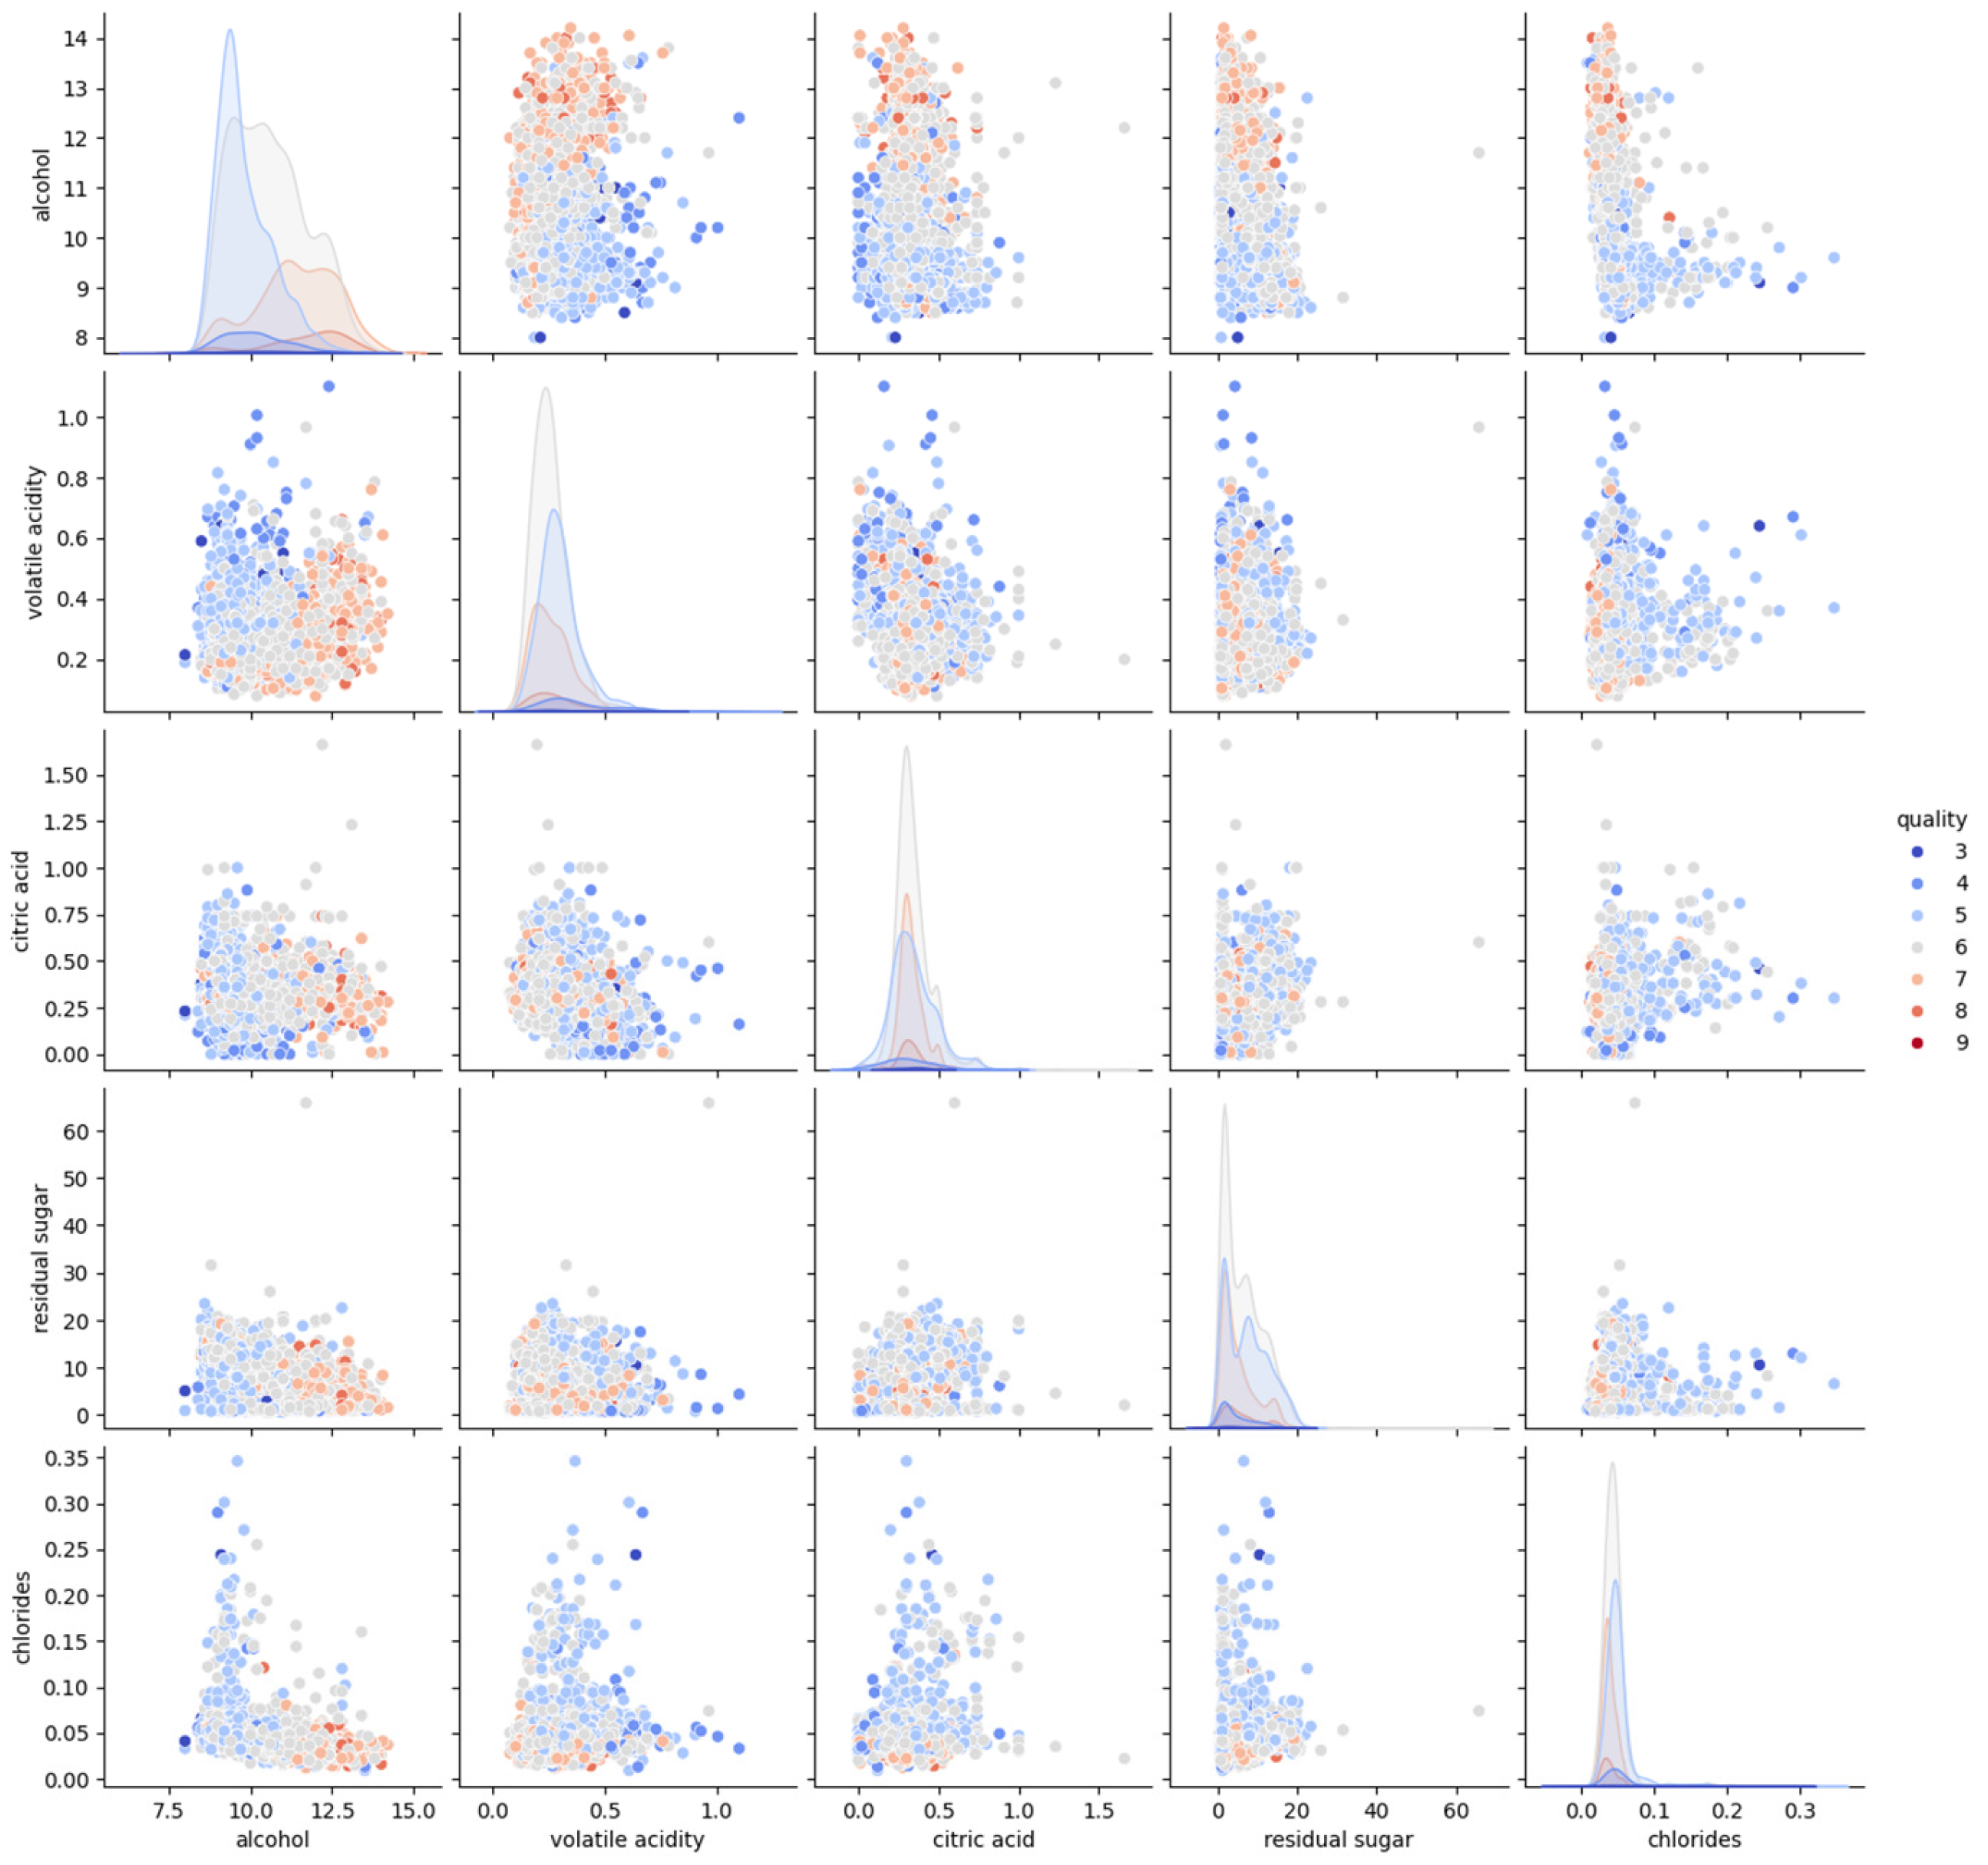
Additionally, bivariate analysis was conducted on key features such as alcohol, volatile acidity, citric acid, residual sugar, and chlorides, evaluating their individual relationships with quality scores to uncover potential trends and patterns; see
Figure 8. To ensure data completeness, a missing data inspection was performed, confirming the absence of missing values before implementing normalization techniques.
Finally, due to variations in scales among physicochemical properties, Min-Max scaling was selected as the normalization technique, standardizing feature values between 0 and 1, which facilitates compatibility with both clustering and predictive models.
The analysis reveals distinct distribution patterns in wine quality scores. Most samples fall in the quality interval 5–7, while extreme values (3–4 and 8–9) are less frequent, indicating an imbalance that may affect predictive modeling. Among the physicochemical attributes, alcohol content shows the strongest positive correlation (0.44) with quality, suggesting that higher alcohol levels are associated with better-rated wines. In contrast, volatile acidity shows a negative correlation (−0.19), indicating that excessive acidity tends to decrease perceived quality.
Bivariate analysis further confirms that wines with higher volatile acidity and lower alcohol content tend to receive lower quality scores. Although characteristics such as residual sugar and chlorides show weaker correlations with quality, their role in ranking could be relevant when combined with other attributes. In addition, the dataset does not contain missing values, therefore, preprocessing efforts are focused on feature normalization and scaling rather than data imputation.
The next phase of the methodology focuses on implementing fuzzy classification models based on the normalized dataset.
4.2. Quality Segmentation
The next phase of this study consists of segmenting the white wine samples according to their physicochemical properties using the FCM clustering method. This unsupervised learning method is suitable in the quality assessment process as it allows samples to belong to several clusters with varying degrees of membership, reflecting the gradual nature of wine quality classification rather than rigid categorical labels.
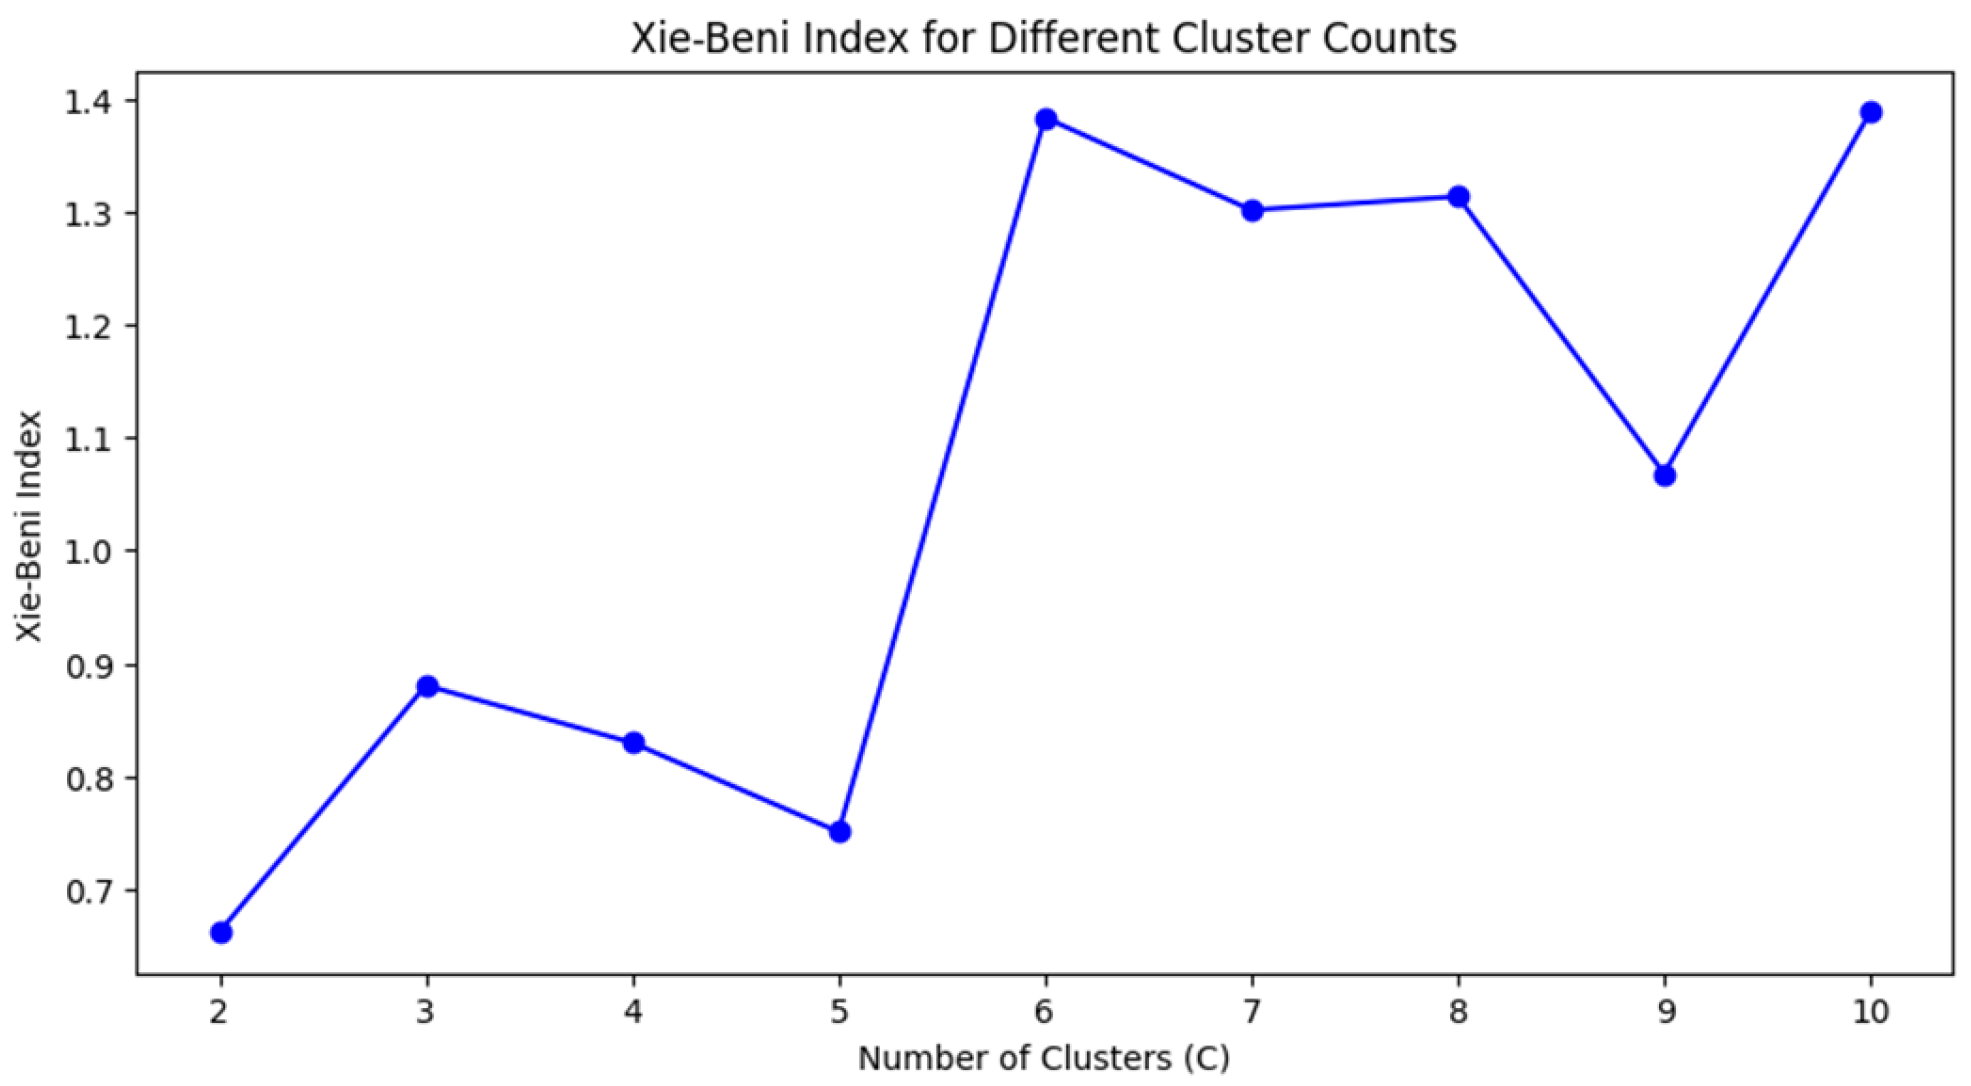
Determining the optimal number of clusters is the initial step in the FCM methodology, influencing the accuracy of the segmentation. For this purpose, two assessment indices are used: the Xie–Beni index (XBI), which quantifies the compactness and separation of clusters, Equation (4), with lower values indicating better clustering (
Figure 9), and the Silhouette score, Equation (5) (
Figure 10), which measures the fit of the sample in its assigned cluster compared to neighboring clusters, where values close to 1 suggest well-defined clusters.
Although the Xie–Beni index reaches its minimum at C = 2 and the Silhouette Score is highest at that point, the segmentation obtained with only two clusters was overly simplistic and failed to reflect the real variability observed in wine quality scores, which span from 3 to 9. After analyzing the centroids and distributions of different cluster configurations, three clusters (C = 3) offered a better compromise between compactness, separation, and interpretability.
To regulate the degree of overlap between clusters, the fuzziness exponent is set to the value m = 2, Equations (2) and (4). The FCM algorithm iteratively updated membership degrees
and refined cluster centers
until convergence was achieved, following the standard optimization loop described in
Section 3.2.
The distribution of wines across clusters is presented in
Table 1, where Clusters 1, 2, and 3 contain a relatively balanced number of samples.
Figure 11 provides a more detailed insight into the relationship between wine clusters and quality. These figures illustrate how wine quality scores are distributed across clusters, highlighting that while some differences exist, they are not entirely sufficient to distinctly separate high-quality and low-quality wines. The clustering process, based purely on physicochemical characteristics, does not fully capture the perceptual aspects of quality assessment, which typically involve sensory evaluations by specialists or consumers.
In
Table 2, the centroids cluster suggests that wines in Cluster 3 tend to have a higher alcohol content and lower density, characteristics that have been previously correlated with better quality. However, wines of different quality levels are found across all clusters, indicating that the physicochemical variables alone may not provide a complete classification of wine quality. The fuzzy membership values also reflect a significant overlap between clusters, meaning that the wines are not strictly confined to distinct groups but rather exist in a continuous quality space.
The centroids show the mean values of the characteristics of each group, which allows a better understanding of the distinctive characteristics of the defined clusters.
- 1.
Cluster 1: balanced profile
Alcohol and Residual Sugar: positioned between the other clusters, showing moderate levels of both alcohol (10.366) and residual sugar (5.979), indicating a balanced wine profile.
Sulfur Dioxide (Total and Free SO2): moderate levels of total (137.653) and free sulfur dioxide (34.465), suggesting wines with an average level of preservation.
Acidity and pH: slightly higher fixed acidity compared to Cluster 3, indicating wines with a moderate acidic profile.
Density: mid-range density (0.994), which corresponds to its intermediate sugar content.
Chlorides and Sulphates: sulfates (0.497) and chlorides (0.047) are moderately present, suggesting a standard composition without extreme preservative treatments.
- 2.
Cluster 2: sweeter, low-alcohol wines with high sulfur dioxide
Alcohol and Residual Sugar: this cluster has the lowest alcohol content (9.649) and the highest residual sugar content (9.039), likely to group sweeter wines with lower alcohol concentration.
Sulfur Dioxide (total and free SO2): the highest levels of total (159.844) and free (41.011) sulfur dioxide indicate that these wines undergo more significant preservation treatment.
Acidity and pH: higher fixed acidity, like Cluster 1, which suggests a more acidic profile.
Density: the highest density (0.996), likely due to the increased sugar content.
Chlorides and Sulphates: the highest chloride content (0.051), which may contribute to a more pronounced salty perception.
- 3.
Cluster 3: dry, high-alcohol wines with minimal intervention
Alcohol and Residual Sugar: this cluster has the highest alcohol content (11.642) and the lowest residual sugar content (4.159), suggesting drier wines with a stronger alcoholic profile.
Sulfur Dioxide (total and free SO2): the lowest sulfur dioxide values (total: 117.430, free: 30.656), indicating wines with minimal chemical intervention.
Acidity and pH: the lowest fixed acidity, which might result in a smoother taste profile.
Density: the lowest density (0.992), aligning with the reduced sugar content.
Chlorides and Sulphates: the lowest levels of sulfites and chlorides, suggesting wines with fewer added preservatives.
This analysis suggests that Cluster 1 represents a balanced wine profile, Cluster 2 groups sweeter, lower-alcohol wines with higher preservation treatment, and Cluster 3 includes drier, higher-alcohol wines with minimal intervention. However, the relationship between clusters and wine quality remains unclear. This reinforces the need for further analysis using classification models such as XGBoost, detailed in Equation (6),
Section 3.3, to better understand the patterns influencing wine quality assessment.
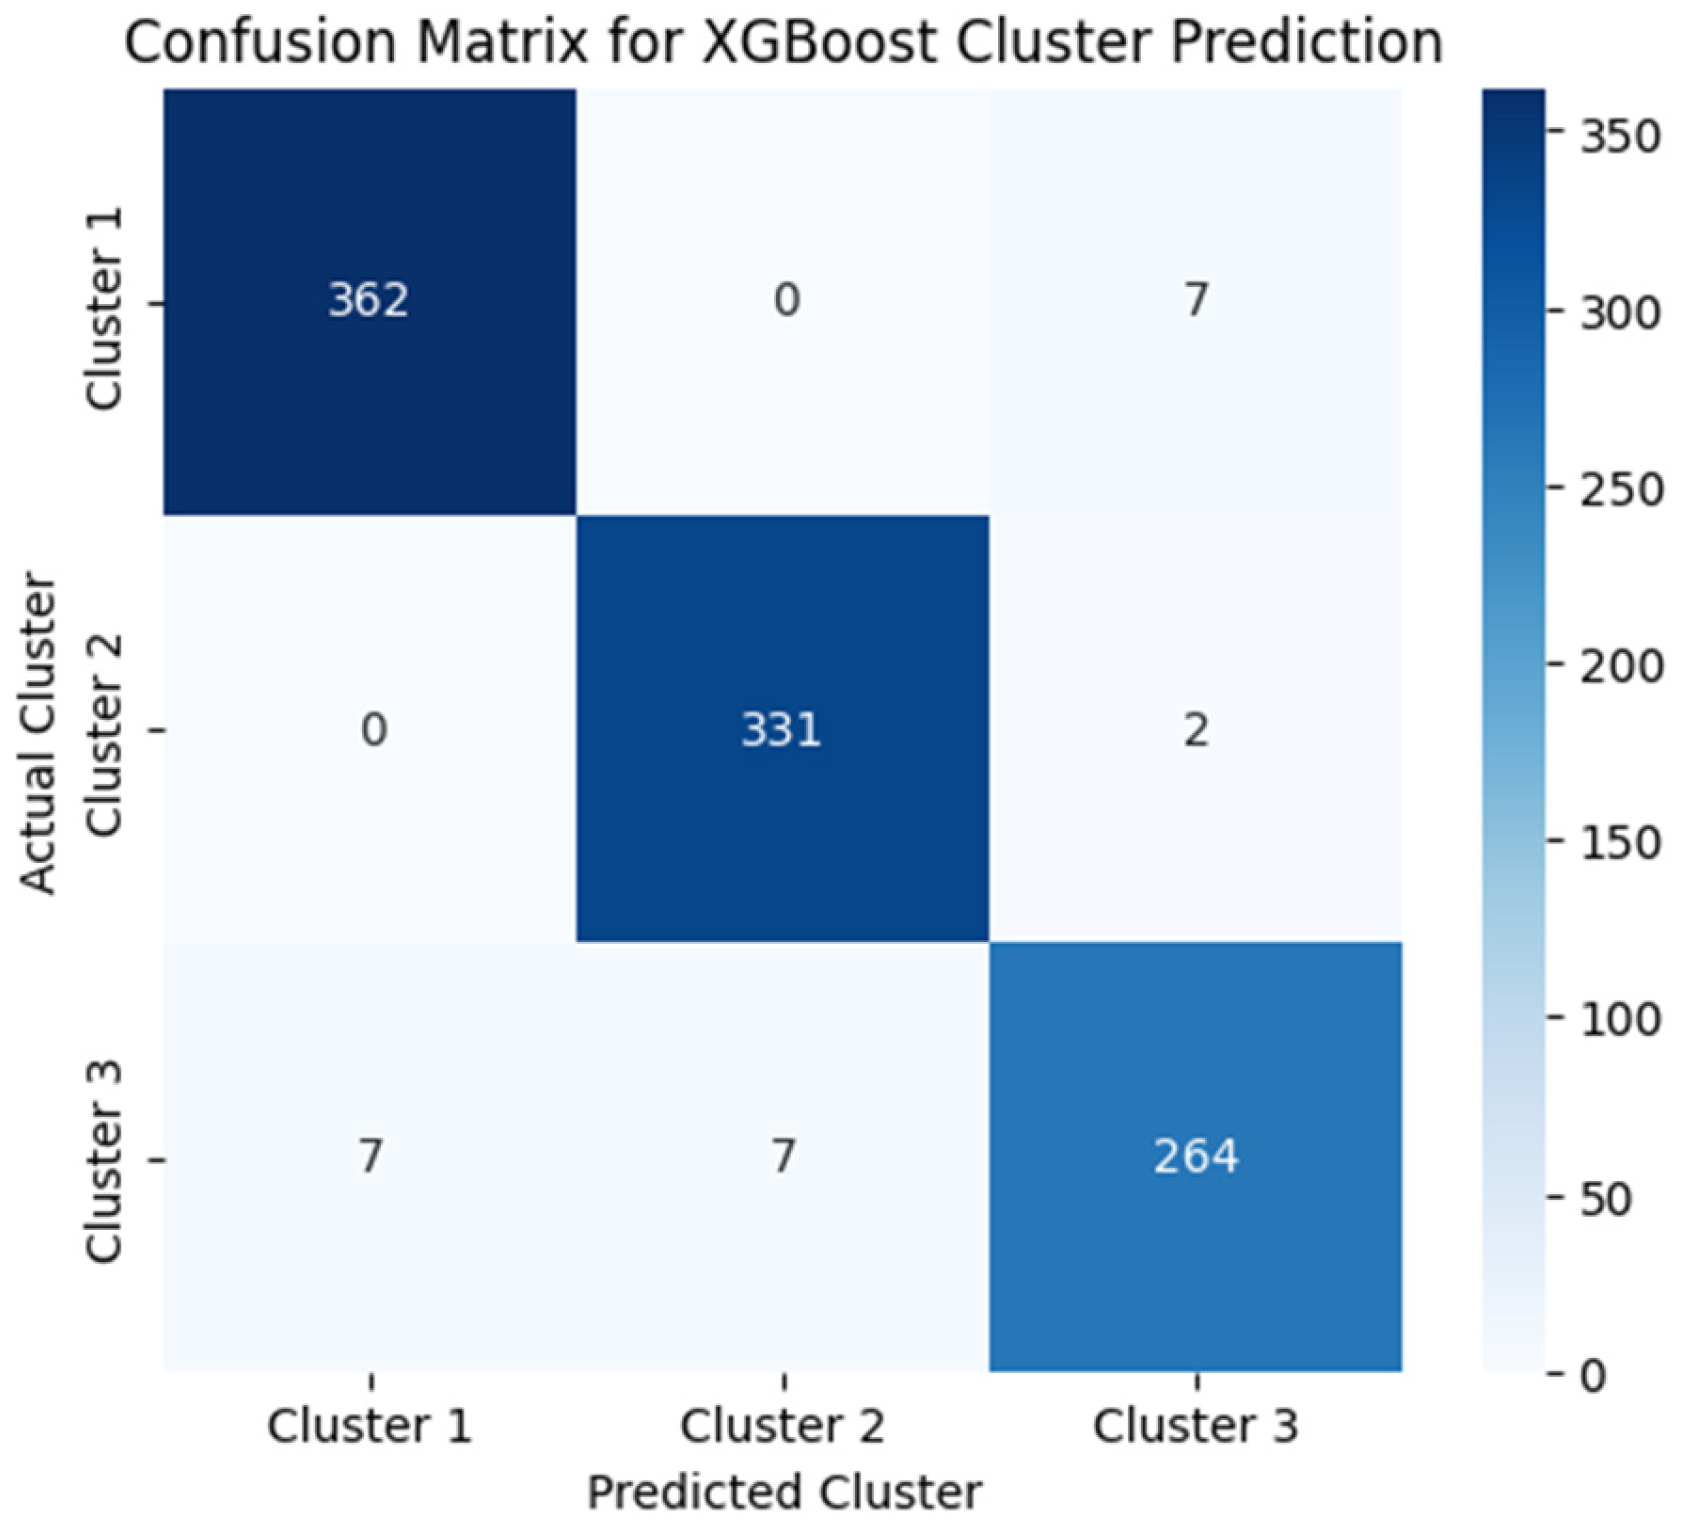
To validate the effectiveness of the clustering model obtained through FCM, we applied XGBoost to predict cluster membership based on the physicochemical properties of the wine samples; see
Figure 12. The objective of this approach is to assess how well the assigned clusters align with a predictive classification model and whether the segmentation produced by FCM is consistent with measurable feature patterns.
The confusion matrix obtained from the XGBoost model implies a high degree of accuracy in predicting the assigned clusters. Most of the samples were correctly classified into their respective clusters, with minimal misclassification errors. Clusters 1 and 2 show almost perfect classification, 0.98 and 0.99, respectively, on the recall metric, while Cluster 3 shows a slight overlap with the other two groupings, with a 0.95 success rate. The results indicate that FCM clustering successfully identifies meaningful patterns in the data, allowing reliable segmentation of wine quality characteristics.
4.3. Prediction Model (XBBoost)
After segmenting wines using the previously discussed FCM clustering, the next step involves developing a predictive model to classify wine quality and detect potential defects. For this purpose, the XGBoost algorithm has been selected due to its ability to handle high-dimensional datasets, manage imbalanced classes, and provide explainability through feature importance, as introduced in
Section 3.3.
XGBoost (Extreme Gradient Boosting) is an ensemble learning method that constructs multiple decision trees sequentially, optimizing performance by minimizing error at each iteration, detailed in Equation (6) of
Section 3.3. This approach enhances classification accuracy while preventing overfitting. The training process consists of the following steps:
- 1.
Data Preparation: Using the dataset containing physicochemical properties of wines and their corresponding quality labels, the data were divided into training and testing sets using a stratified 80/20 split. This ensured that all quality categories (ranging from 3 to 9) were proportionally represented in both subsets, preserving the original class distribution. To address the issue of varying feature scales, Min-Max normalization was applied, bringing all variables into the [0,1] range. Additionally, class imbalance—especially underrepresentation of extreme quality scores—was mitigated through Synthetic Minority Oversampling Technique (SMOTE), which generated synthetic examples in the minority classes to balance the training set and improve classifier generalization.
- 2.
Adjustment to the wine quality classification: low , medium and high . It helps to ensure clearer differentiation between quality levels, allowing the model to better capture underlying physicochemical variations and improve classification accuracy.
- 3.
Model Training: The XGBoost model is trained on the training set, learning relationships between features (such as acidity, residual sugar, sulfur dioxide content, alcohol level, and density) and the target variable quality.
- 4.
Model Testing: The trained model is evaluated on the testing set to assess its predictive performance.
To measure model performance, a confusion matrix is generated, providing a breakdown of correct and incorrect classifications; see
Figure 13. Additional evaluation metrics such as accuracy, precision, recall, F1-score, and ROC-AUC are used to analyze model reliability. Furthermore, SHAP and LIME will be applied in later sections to interpret model decisions and assess the impact of individual features on predictions.
After fine-tuning the model and balancing the dataset, we achieved an overall accuracy of 0.92 in classifying wine quality into low, medium, and high categories.
- 1.
Precision and Recall:
The low-quality class achieved the highest precision (0.97) and recall (0.98), meaning the model accurately identifies low-quality wines while minimizing false positives.
The medium-quality class showed (0.90) precision but slightly lower recall (0.86), indicating some misclassification towards the high-quality category.
The high-quality class had precision (0.89) and recall (0.91), demonstrating a balanced classification.
- 2.
Confusion Matrix Interpretation:
The low category is well distinguished, with only 13 misclassifications (11 as medium, 2 as high).
The medium category has 105 misclassifications (21 as low, 84 as high), indicating some overlap with adjacent quality levels.
The high category is also well classified, with only 63 misclassifications (59 as medium, 4 as low).
The model performs well in distinguishing wine quality levels, with strong precision and recall across all categories.
Although some misclassifications are observed, they predominantly occur between adjacent quality levels, which is consistent with the subjective nature and inherent overlap in sensory-based wine evaluations. The strong precision and recall across categories confirm the model’s robustness and its ability to capture relevant patterns in the data, validating the effectiveness of the proposed classification approach.
4.4. Decision-Making Fuzzy Inference System (FIS)
To complement the classification model developed with XGBoost, an FIS is introduced to enhance interpretability and decision-making in wine quality assessment. XGBoost provides accurate predictions, but it lacks transparency in the reasoning behind its classifications. The FIS addresses this by incorporating expert knowledge, allowing for a more flexible and interpretable evaluation framework. This process follows the structure described in
Section 3.4, where the fuzzy logic framework is detailed, including the use of membership functions and rule-based reasoning.
The implementation of an FIS follows these steps:
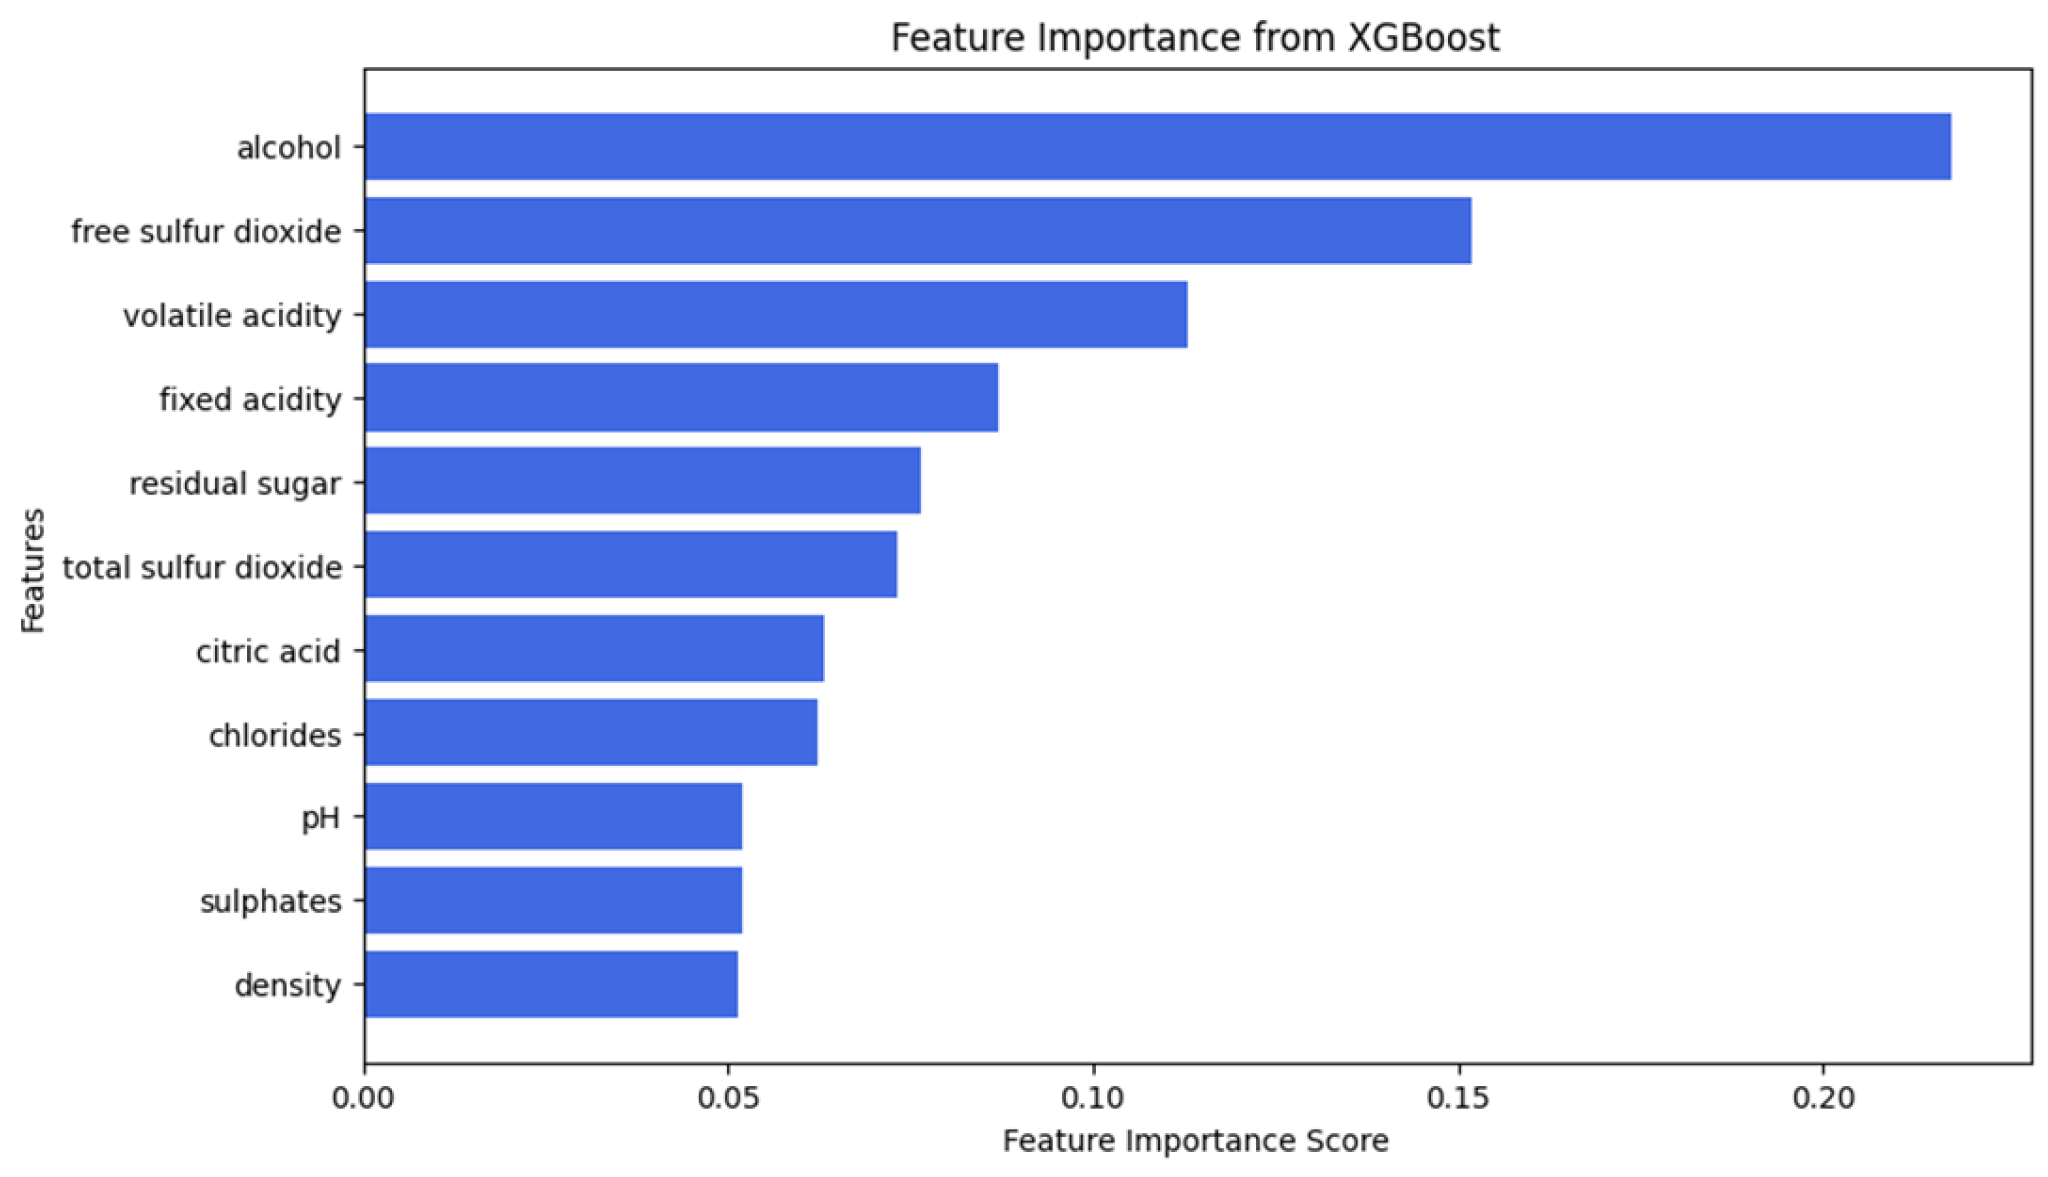
- 1.
Selection of Key Features,
Based on XGBoost feature importance analysis, five physicochemical properties are selected: alcohol, free sulfur dioxide, volatile acidity, fixed acidity, and residual sugar; see
Figure 14.
- 2.
Definition of Fuzzy Membership Functions,
Each feature is categorized into low, medium, and high using triangular membership functions, allowing smooth transitions between levels.
- 3.
Fuzzy Rule-Based Decision System,
Expert-defined if-then rules describe how feature combinations influence wine quality,
Table 3.
- 4.
Fuzzy Inference and Defuzzification.
A Mamdani inference system, as introduced in Equation (7), evaluates the inputs and produces a continuous quality score, refining the assessment beyond discrete classification [
30], consistent with the methodology explained in
Section 3.4.
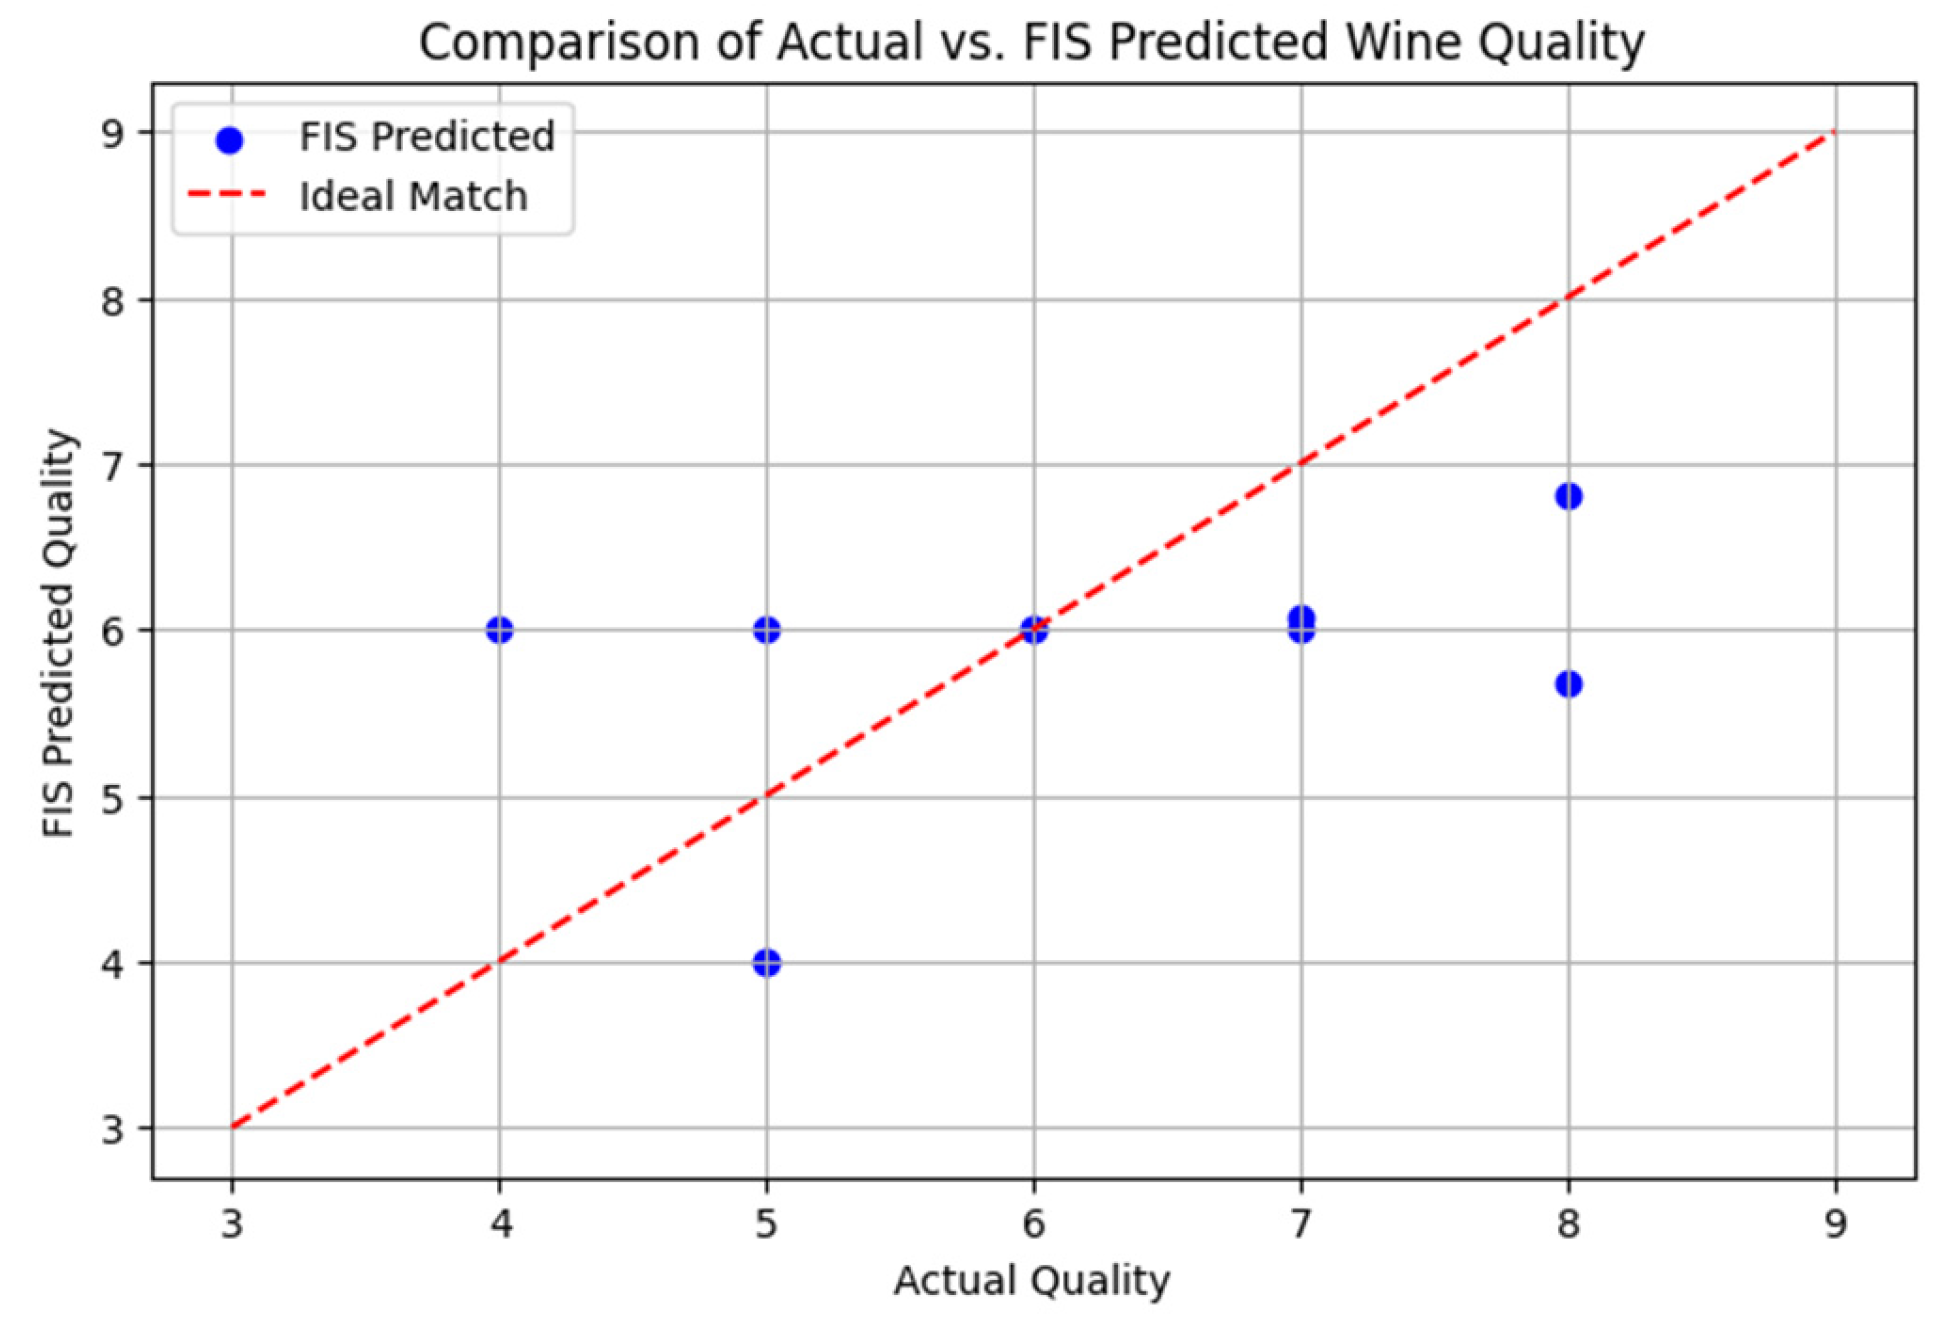
The FIS model was tested on a random sample of 10 white wines, comparing actual quality labels with FIS-predicted scores. The scatter plot (
Figure 15) illustrates the comparison, where the red dashed line represents an ideal 1:1 match between actual and predicted quality.
The FIS model generally aligns with actual quality scores, particularly for mid-range values (5–7).
There are cases where the FIS overestimates quality (e.g., sample with actual quality 4 is predicted as 6).
The system provides smooth, interpretable quality predictions but may require further refinement, such as incorporating Analytic Hierarchy Process (AHP), based feature weighting for improved accuracy [
31].
This approach combines machine learning with expert reasoning, thus providing a flexible and explainable quality assessment environment suitable for industrial testing applications.
4.5. Model Explainability Using SHAP and LIME
While traditional machine learning models, such as XGBoost, provide high accuracy in classification tasks, they often behave like black-box models, making it difficult to understand how individual predictions are made. To enhance model interpretability, previously analyzed the feature importance from XGBoost, which provided a global perspective on how different physicochemical properties contribute to wine quality classification, already described in
Section 3.5.
However, feature importance alone does not provide explainability at the instance level, meaning we still lack insight into why a specific wine sample was classified into a particular quality category. To address this, we employ SHAP (SHapley Additive Explanations) and LIME (Local Interpretable Model-Agnostic Explanations), two widely used explainability techniques.
4.5.1. SHAP
As explained in
Section 3.5.1, SHAP presents an interpretability framework based on Shapley’s values of cooperative game theory. It provides an explanation of feature importance, explaining the extent to which each feature contributes to the prediction of a model; see Equation (9).
SHAP offers two levels of interpretability: global and local. The global analysis helps identify which features have the highest overall impact on wine quality predictions across the entire dataset, allowing winemakers to optimize production processes by focusing on the most influential factors. On the other hand, local analysis explains individual predictions, answering why a specific wine sample was classified into a particular quality category. This is particularly useful in industrial applications, where understanding deviations in quality for a single batch of wine can lead to process improvements and quality control enhancements.
The SHAP analysis for wine quality classification provides insight into how different physicochemical properties influence the predictions for low-, medium-, and high-quality wines. Comparison between the three classes highlights significant differences in feature importance across quality levels, revealing key trends that can inform winemaking decisions and quality control processes.
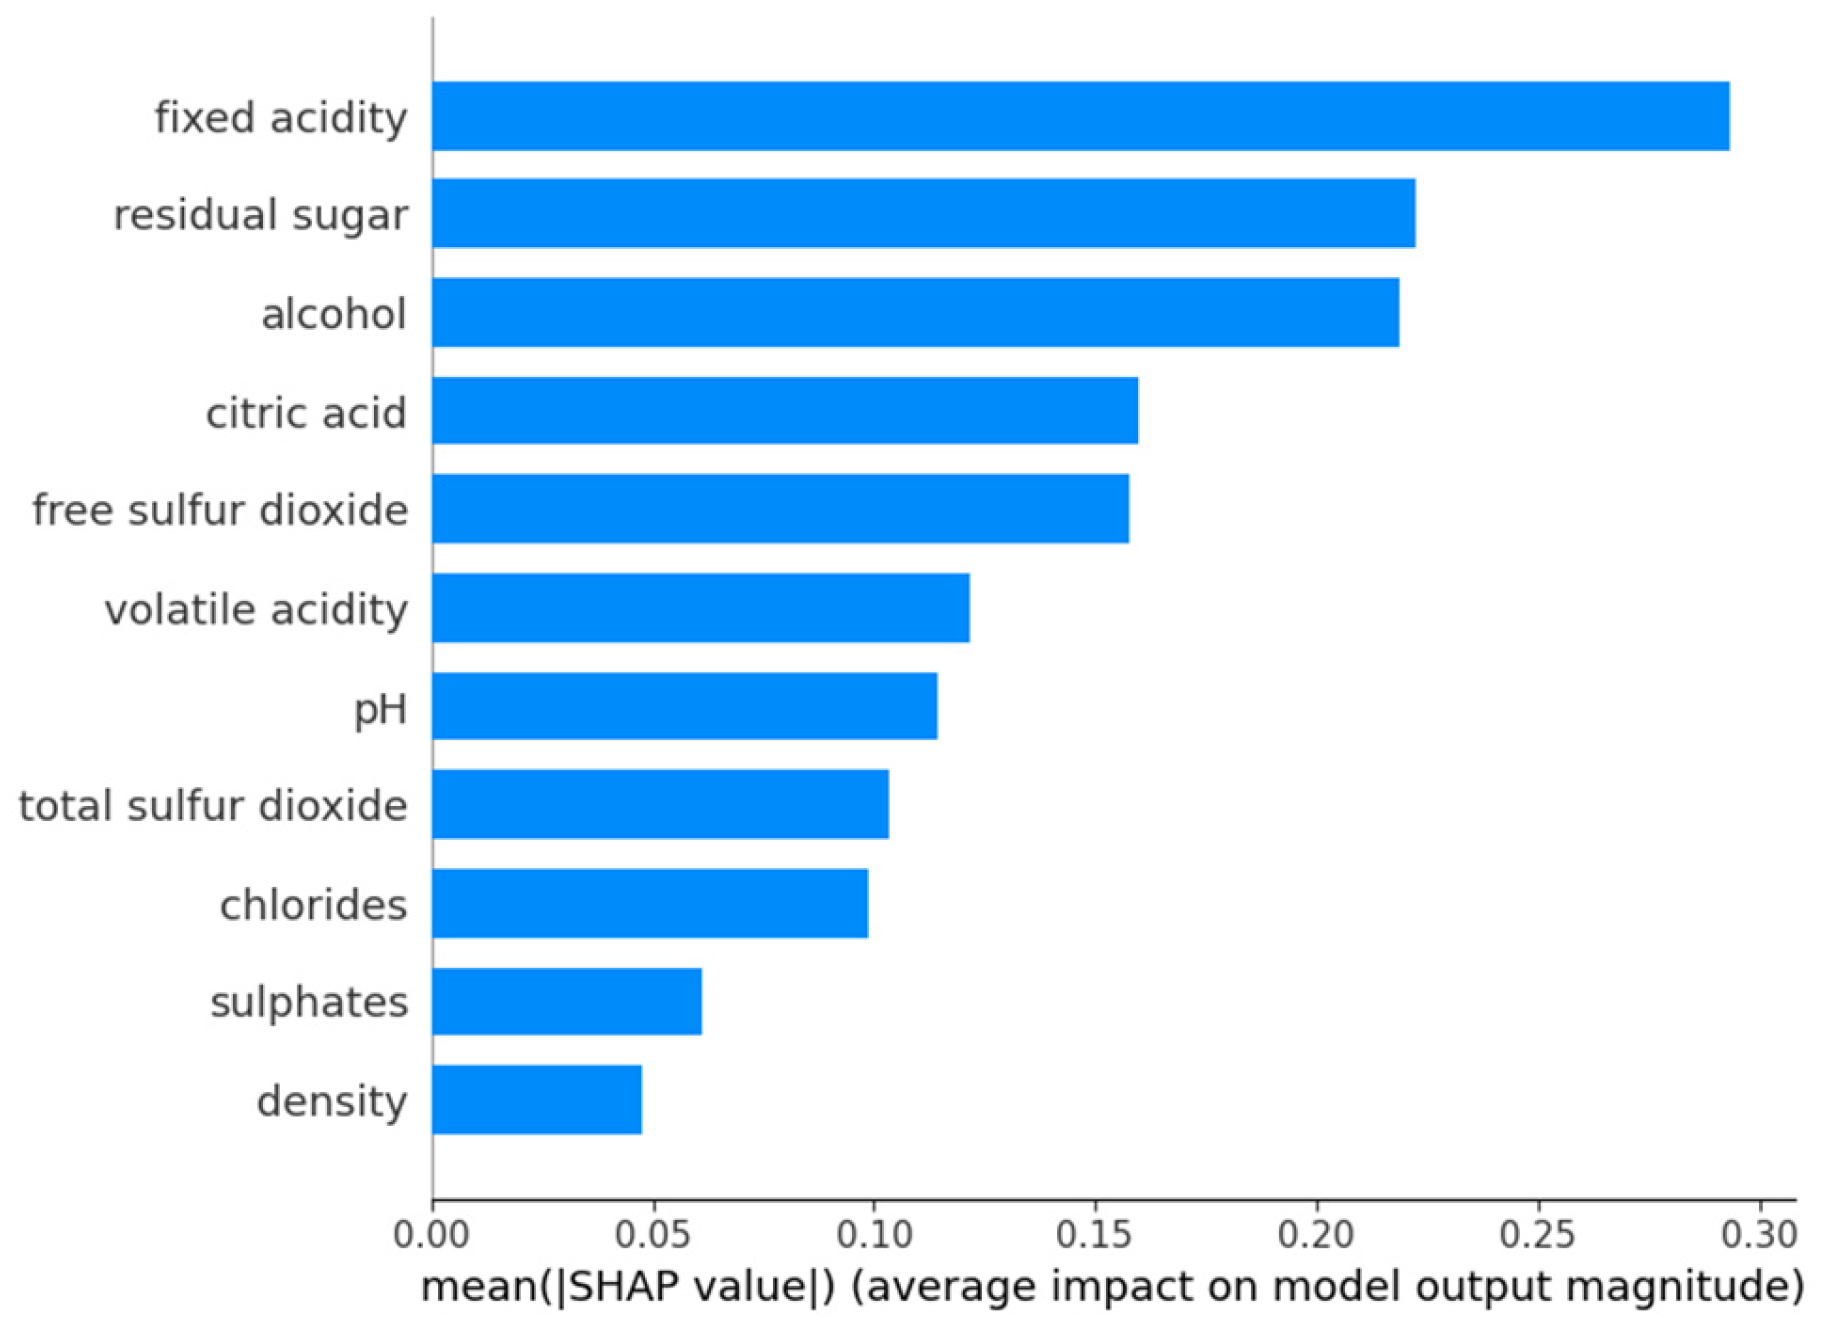
For medium quality wines (
Figure 16), the most influential characteristic is fixed acidity, closely followed by residual sugar and alcohol content. This suggests that well-balanced acidity and sugar–alcohol interaction are very important characteristics in determining whether a wine falls into the medium quality category. Other relevant factors are citric acid and free sulphur dioxide, which contribute to the stability and sensory characteristics of the wine. Volatile acidity and pH also play a role, indicating that slight variations in acidity can significantly influence the classification. Characteristics such as total sulphur dioxide, chlorides, sulphates, and density show less overall influence on the medium quality classification, suggesting that they play a secondary role in this category.
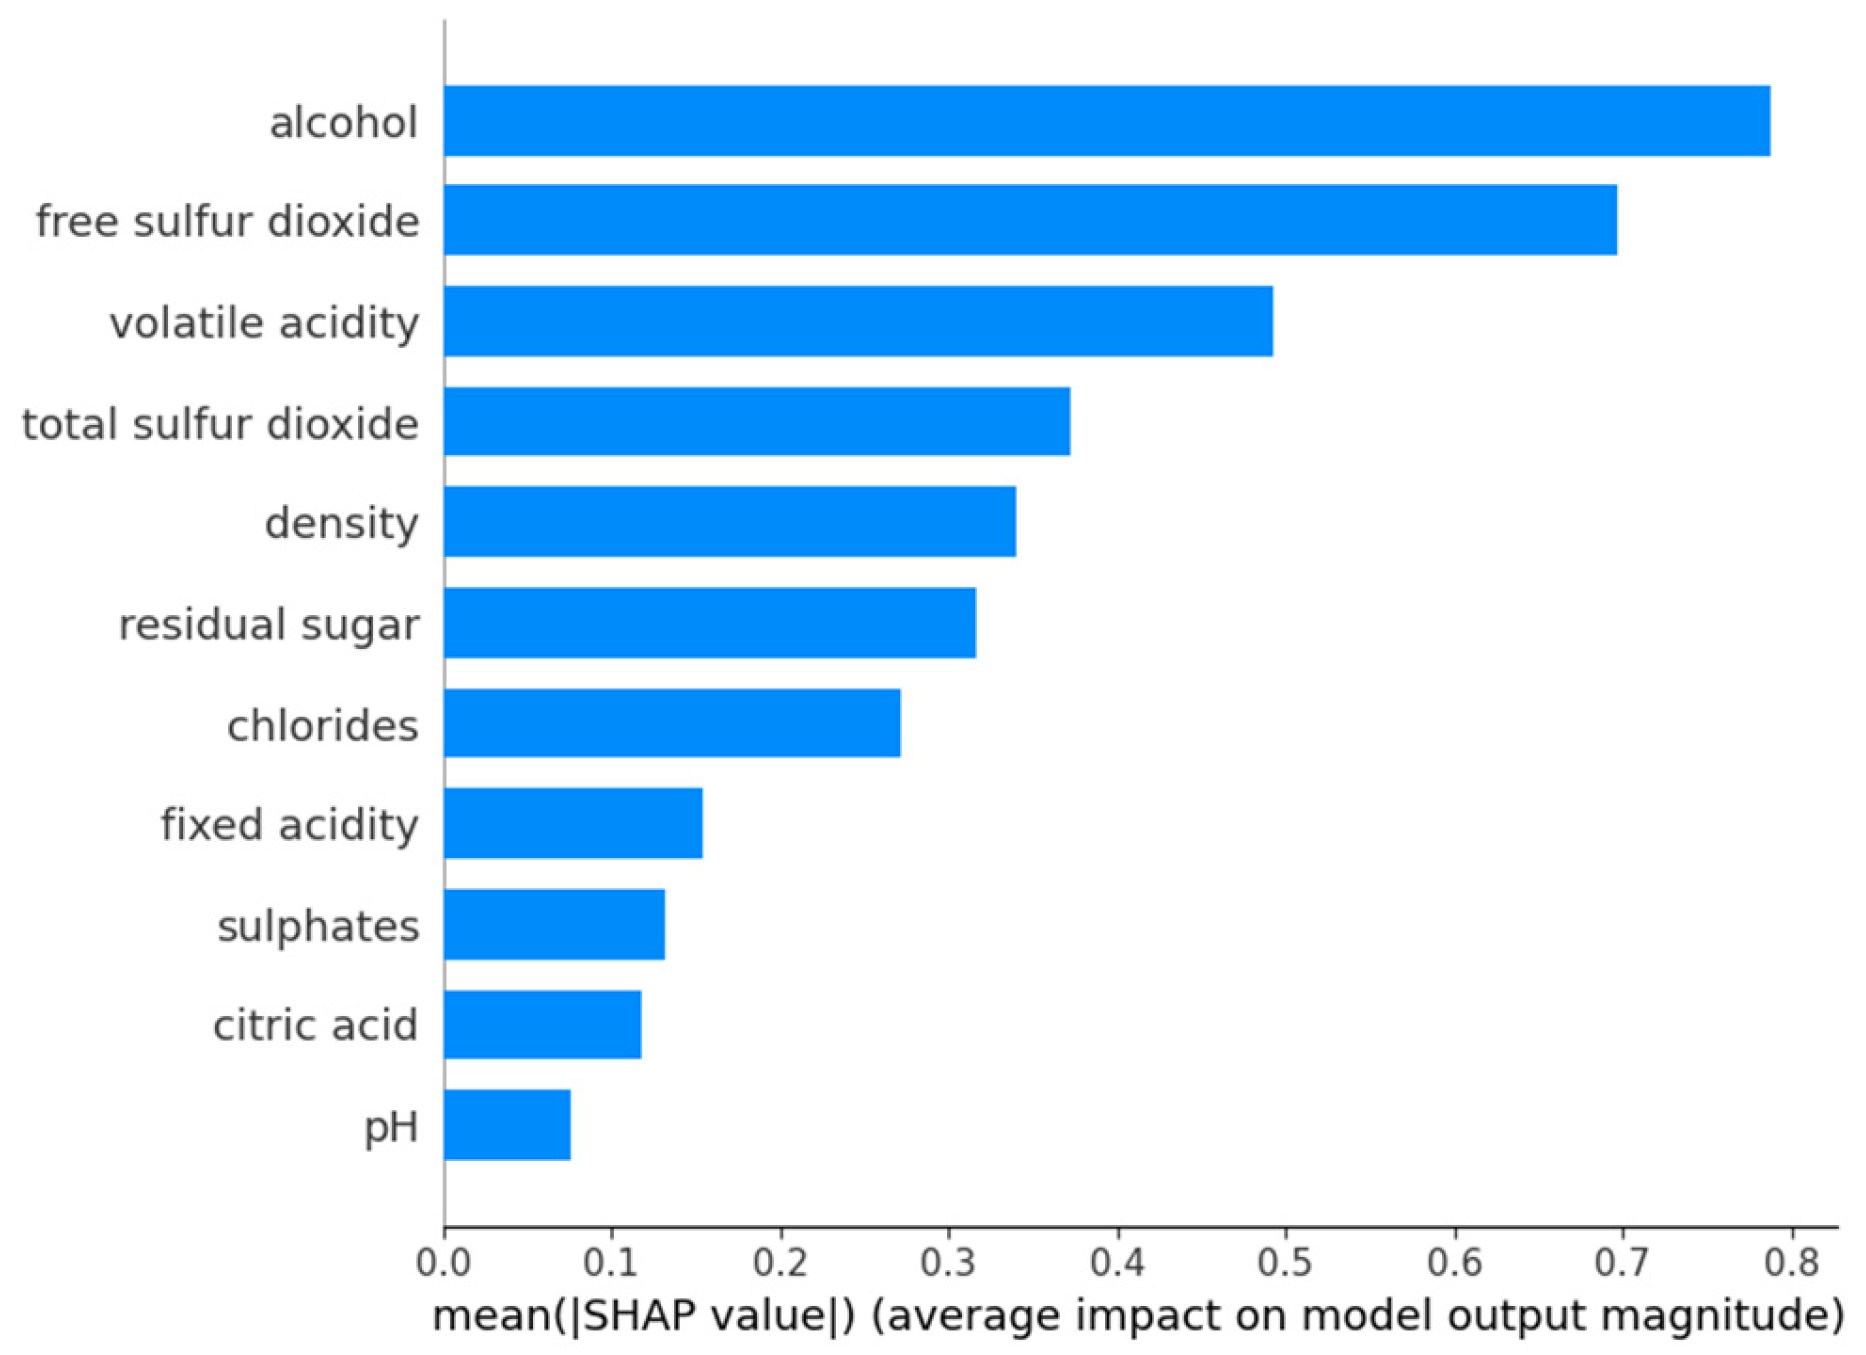
In contrast, for low-quality wines (
Figure 17), the most dominant feature is alcohol content, followed by free sulfur dioxide and volatile acidity. This indicates that wines classified as low quality tend to have suboptimal alcohol balance and excessive sulfur dioxide levels, which may lead to undesirable taste profiles. The impact of total sulfur dioxide and density is more pronounced in this category compared to medium-quality wines, suggesting that inconsistencies in these parameters contribute significantly to lower quality perception. Residual sugar, chlorides, and fixed acidity exhibit moderate importance, whereas sulphates and citric acid have relatively lower influence in predicting low-quality wines.
For high-quality wines (
Figure 18), the most impactful factor remains alcohol content, followed closely by free sulfur dioxide and volatile acidity, aligning with the trend observed in low-quality wines but with notable differences. Unlike low-quality wines, where excess sulfur dioxide negatively impacts classification, in high-quality wines, an optimal level of free sulfur dioxide seems to support stability and preservation. Additionally, citric acid and total sulfur dioxide gain more prominence compared to the lower classes, suggesting that wines classified as high quality tend to have a more refined acid-sulfur balance. The impact of residual sugar and pH increases slightly in high-quality wines compared to the lower categories, reinforcing their role in shaping premium sensory attributes.
4.5.2. Interpretable Model Explanations, LIME
Following the methodology detailed in
Section 3.5.2, LIME (Local Interpretable Model-Agnostic Explanations) is a widely used technique for interpreting the predictions of machine learning models, particularly those considered black-box models, such as XGBoost. Unlike SHAP, which provides both global and local explanations, LIME is specifically designed for local interpretability, focusing on the impact of features on individual predictions; see Equation (10).
LIME generates explanations by creating perturbed versions of the input data and fitting a simplified interpretable model, such as a linear model, to approximate the decision boundary of the original machine learning model within a local region. This method helps identify which features contributed most significantly to a specific classification and whether their influence was positive or negative.
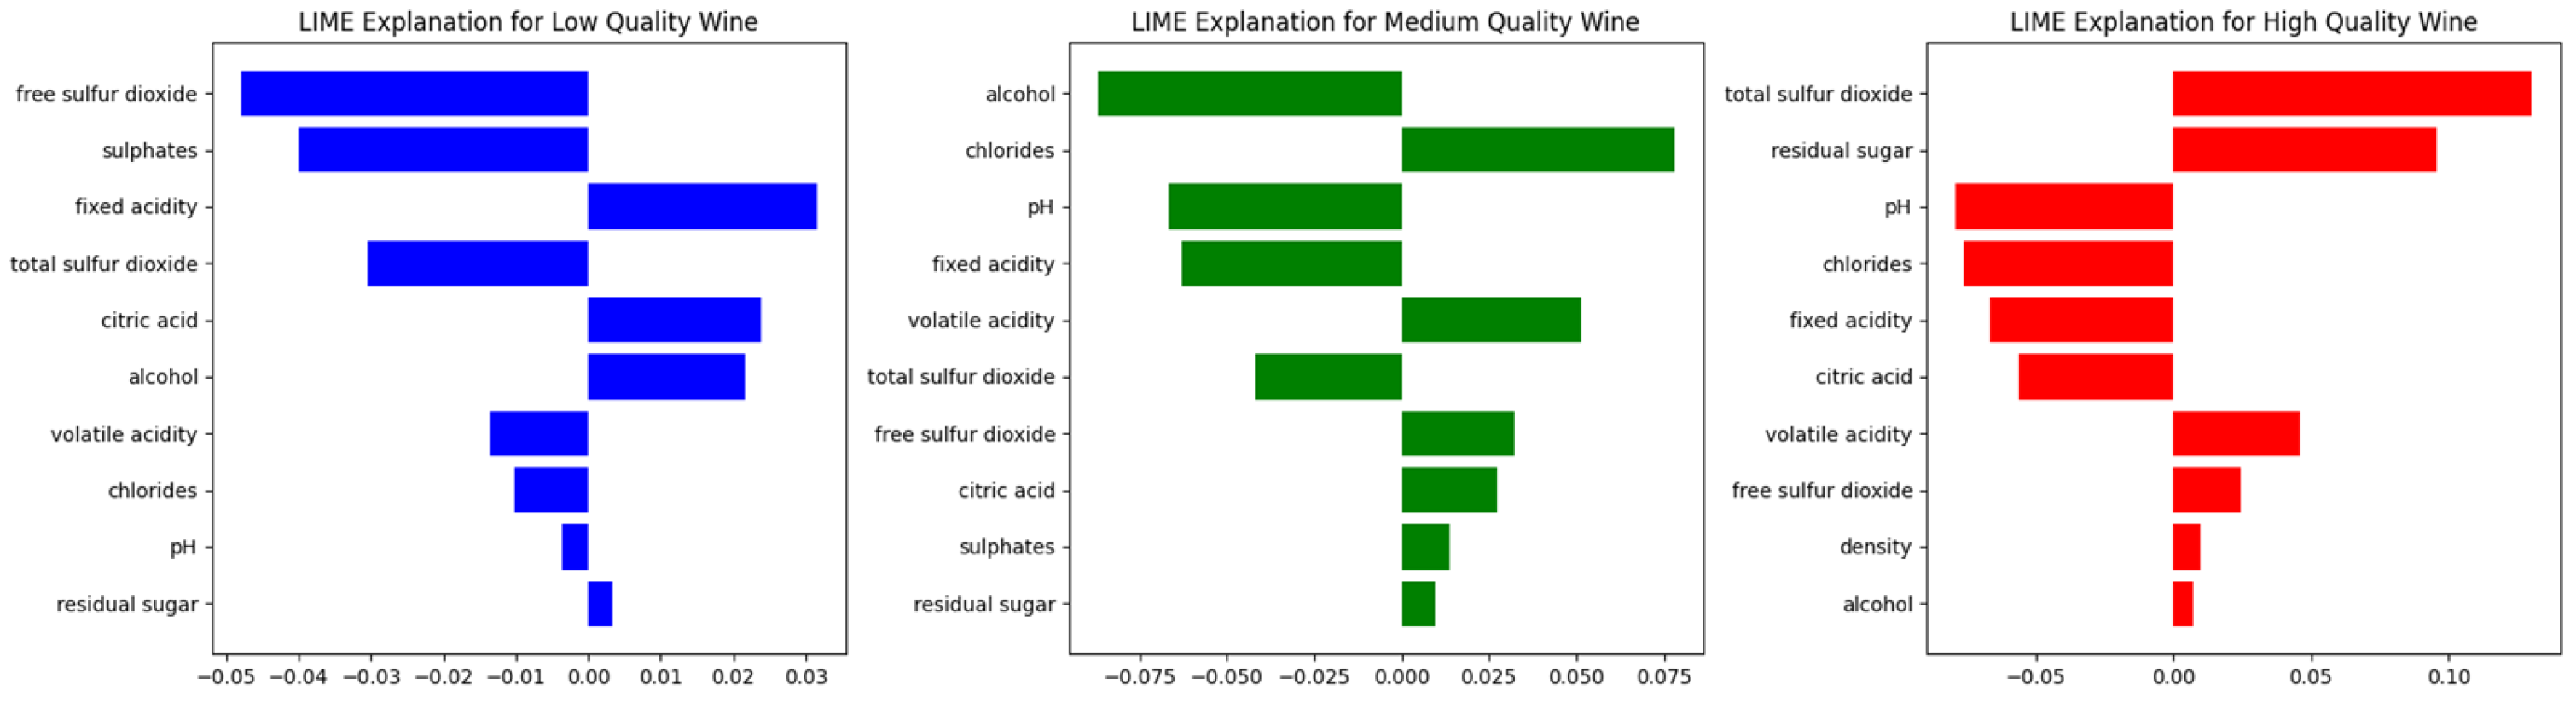
In this study, LIME was applied to three different wine samples, each corresponding to a different quality class (low, medium, and high), to analyze the most influential physicochemical properties affecting their classification. The results are presented in
Figure 19, where the magnitude and direction of each feature’s impact are visualized through horizontal bar plots.
For the low-quality wine sample, the most significant negative contributors were free sulfur dioxide and sulphates, indicating that higher levels of these compounds were associated with lower quality predictions. Additionally, fixed acidity and total sulfur dioxide had a negative impact. Conversely, some features such as alcohol and citric acid exerted a positive influence, but their effect was not sufficient to shift the classification toward a higher quality category. These results suggest that low-quality wines are likely affected by excessive sulfur dioxide levels and sulphates, which may contribute to undesired chemical imbalances and sensory defects.
In the case of the medium-quality wine sample, alcohol and chlorides were the strongest positive contributors, implying that higher values of these features favored a medium-quality classification. pH, fixed acidity, and volatile acidity also played a role in the prediction, while total sulfur dioxide and free sulfur dioxide exhibited a slight negative impact. These findings indicate that medium-quality wines benefit from a balance of alcohol, acidity, and chloride concentration, while excessive sulfur compounds may detract from their overall quality.
For the high-quality wine sample, total sulfur dioxide and residual sugar had the most significant positive influence, suggesting that higher levels of these features were associated with higher quality predictions. Other features, such as pH, chlorides, and fixed acidity, also contributed positively. Meanwhile, alcohol, density, and free sulfur dioxide had a relatively minor influence, with some displaying a slight negative impact. This analysis highlights the importance of controlling residual sugar and sulfur dioxide levels in high-quality wines, as these factors may enhance flavor complexity and contribute to better preservation.
As shown in
Figure 19, the application of LIME interpretability to three representative wine samples (low, medium, and high quality) reveals the specific physicochemical attributes that most influenced their classification. From an industrial perspective, the integration of LIME-based interpretability allows winemakers and quality control professionals to identify key factors influencing the classification of individual wine samples, providing actionable insights for production optimization. For low-quality wines, adjustments in sulfur dioxide levels and acidity management may help improve quality. For medium-quality wines, optimizing alcohol content and chloride concentration can enhance consistency, while for high-quality wines, monitoring sugar levels and sulfur dioxide balance is relevant for maintaining premium standards.
5. Discussion
The proposed methodology integrates FCM clustering, XGBoost classification, FIS, and XAI techniques to enhance the assessment of wine quality based on physicochemical properties. This study builds upon previous research that applies unsupervised and supervised learning techniques to food quality assessment, extending the scope by incorporating explainability methods to improve interpretability. Studies on wine classification using machine learning have traditionally relied on feature selection approaches combined with classification models; however, there is no related work on fuzzy clustering together with explainable models for decision-making; see
Section 2.4.
The clustering process successfully segmented the dataset into three distinct groups, where residual sugar, alcohol, and free sulfur dioxide are the most influential features in defining cluster membership. These findings align with prior studies that identified alcohol content as a key determinant of wine quality [
32], confirming that physicochemical attributes strongly correlate with sensory perception metrics used in traditional enology. The validation phase, using XGBoost as a predictive model, confirmed that the clusters generated by FCM exhibit strong separability, as demonstrated by the confusion matrix, where classification errors were minimal. This suggests that fuzzy clustering effectively captures inherent relationships between physicochemical variables, enabling more nuanced classifications than traditional k-means clustering or threshold-based approaches [
33].
By classifying wine quality into three discrete levels (low, medium, and high), the classification model demonstrated high accuracy, especially after applying the Synthetic Minority Oversampling Technique (SMOTE) to balance the data and perform hyperparameter fitting to optimize model performance. Compared to previous models that rely solely on feature selection and direct classification, the proposed hybrid approach allows for a more adaptive classification framework, where clustering results serve as input for supervised learning models. The importance of XGBoost derived features was leveraged to build the FIS quality score model, ensuring an interpretable framework for decision making.
One of the key contributions of this work is the incorporation of XAI techniques, including SHAP and LIME, to analyze the impact of features at both the global level (identifying the overall contribution of each physicochemical property to wine quality classification) and the local level (explaining the predictions of individual samples). These techniques significantly improve the interpretability of the model, making it more suitable for industrial applications where transparency in decision-making is essential. Previous work has discussed the limitations of machine learning in the wine industry due to the lack of interpretability of black box models [
34], and this study addresses this gap by providing a structured approach to feature attribution in classification decisions, global and local interpretability.
The strengths of the proposed approach lie in its robustness and interpretability. The combination of FCM and XGBoost provides a data-driven yet simple wine quality segmentation, which is particularly important in industrial quality control systems. The FIS model, built on the importance of XGBoost features, aligns with human expert assessments, facilitating a hybrid approach that integrates machine learning predictions with human decision making. In addition, the incorporation of XAI techniques ensures that the model does not function as a ‘black box’ but provides detailed insight into the factors driving quality assessments.
The robustness of the model is also supported by the high accuracy rates achieved by the XGBoost classifier in both quality classification and cluster prediction, as well as the close alignment of FIS-based scores with actual wine quality ratings. These results demonstrate strong predictive performance and the reliability of the hybrid approach in practical applications. The model’s capacity to combine unsupervised clustering, supervised classification, and interpretable inference ensures adaptability across different scenarios and confirms its readiness for industrial deployment.
Future work could address several improvements. Firstly, the FIS membership functions could be further refined using adaptive fuzzy logic models to improve accuracy in quality scoring. In this study, the model is based on physicochemical attributes only, and future studies could incorporate sensory evaluation data (such as taste, aroma, and texture), important attributes in wine quality assessment. Another potential extension is the exploration of hybrid clustering techniques, combining fuzzy clustering with deep learning-based feature extraction, to improve cluster identification in complex datasets. Finally, the implementation of this methodology in a real-time decision support system (DSS) could improve its practical applicability in wine production lines, allowing real-time adjustments in quality monitoring.
From a broader perspective, these results have implications beyond wine quality classification. The combination of fuzzy clustering methods, supervised learning, and both human and machine explainability could be applied to other food and beverage industries where quality assessment involves multiple interacting factors.
Although static datasets were used in this study as proof of concept, the framework was designed with real-time implementation in mind. Future validation will involve data collected from real-time industrial systems, including in-line sensors deployed in continuous production lines.
Additionally, the proposed methodology could be benchmarked against traditional process monitoring tools such as Multivariate Statistical Process Control (MSPC) using multivariate control charts [
35]. These techniques, widely adopted in continuous manufacturing environments, provide a well-established baseline for real-time quality monitoring. Comparing the hybrid AI-based approach with MSPC methods would allow for a more comprehensive assessment of the model’s robustness, adaptability, and added value under real-time conditions.
Beyond the wine industry, the proposed hybrid framework has strong potential for application in other quality-critical domains, including pharmaceuticals, food and beverage processing, and cosmetics manufacturing, where interpretability, accuracy, and traceability are essential to meeting regulatory and market standards. Future work will also explore the integration of this framework into decision support systems (DSS), aligned with Industry 4.0 technologies such as IoT platforms and industrial automation systems.
6. Conclusions
This study has developed a comprehensive and interpretable methodological framework for wine quality assessment by integrating fuzzy C-means (FCM) clustering, supervised classification using XGBoost, Fuzzy Inference Systems (FISs), and explainability techniques such as SHAP and LIME. The results demonstrate that this approach is effective for data-driven quality control, offering both high predictive performance and enhanced transparency in decision-making processes. The use of fuzzy clustering and supervised learning, supported by Fuzzy Inference Systems and explainability models, provides a differential approach that improves both classification performance and interpretability, addressing one of the main limitations of traditional machine learning models applied to quality assessment.
A major contribution of this work lies in the unified integration of these four methodological components within a single, structured workflow. While many studies have focused on individual components, such as clustering, supervised classification, or explainability, the proposed methodology is the first to unify these approaches into a single, adaptable framework. This structured approach enables real-time analysis and decision-making, which contributes to the development of similar models in industrial applications.
The approach outlined in this paper offers a scalable and adaptable solution for industrial automation, with broad implications across multiple sectors that require highly reliable and transparent real-time quality control mechanisms.


