Abstract
Poverty is a major concern worldwide, and so its eradication represents the first Sustainable Development Goal. Moreover, quality education and decent working conditions are among the factors that seem to reduce poverty, a detail also observed in the current research. The current study aimed to determine poverty and educational levels along with work conditions within the 11 EU Member States located in Central and Eastern Europe using 2023 Eurostat data. To identify them, two techniques were implemented: cluster analysis and the TOPSIS method. The first is used to determine similarities and differences between countries, and the second is used with the purpose of achieving a ranking of the countries based on the 10 indicators designed to examine the three SDGs investigated. Among the results discovered, the clear differentiation of Romania and Bulgaria compared to the other countries was observed for most of the indicators analysed, especially for the people in severe material and social deprivation, as well as the share of individuals having at least basic digital skills. Thus, by applying both methods, the grouping of Romania and Bulgaria is obvious, with these countries being characterised by the poorest performances within the analysed countries. At the opposite end of the scale was Slovenia, which presented the lowest values of the indicators intended to define poverty for the year evaluated, standing out among the countries with the best results for most of the indicators included in the analysis.
1. Introduction
Poverty remains a persistent challenge across the world and is especially pronounced in Africa and Asia. However, certain regions within the European Union also exhibit discrepancies between countries over time, making poverty eradication the first Sustainable Development Goal (SDG) adopted by the United Nations [1]. Thus, the European Union has set ambitious targets to reduce poverty and social exclusion, yet recent data show severe material deprivation and rising in-work poverty across parts of the region [2,3]. This study aims to analyse and compare poverty rates, education quality, and decent work conditions across 11 EU Member States in Central and Eastern Europe using cluster and TOPSIS (Technique for Order of Preference by Similarity to Ideal Solution) analysis to identify patterns and correlations and rank countries according to ten key indicators. By highlighting both the similarities and stark differences among these nations—such as the pronounced challenges faced by Romania [3,4] and Bulgaria [3,4,5] versus the stronger performance of the Czech Republic or Slovenia [3]—the research underscores the urgent need for targeted policy interventions.
The purpose of the current research is to provide decision-makers with a comprehensive understanding of socioeconomic dynamics to reduce the risk of poverty, enhance educational opportunities, and ensure fair and sustainable labour conditions in the most affected EU countries. The current research assesses the risk of poverty as has been described by Eurostat [3] by considering the population at risk of poverty with a disposable income below 60% of the national median income, people who are unable to afford at least 7 of the 13 essential deprivation items, and individuals under 65 years old that worked less than 20% of the potential working time in the last 12 months. In terms of decent work standards, the targets specified in the eight Sustainable Development Goal (SDG)—promote sustained, inclusive, and sustainable economic growth, full and productive employment and decent work for all—and the International Labour Organisation define the expected conditions on the labour market for employees [6,7].
In Central and Eastern European (CEE) countries, the intersection of poverty, education, and decent work standards is a pressing issue that reflects the broader socioeconomic challenges faced in the region, particularly since the transition from centrally planned to market economies. The dynamics of poverty in the CEE are influenced by the characteristics of the labour market, educational attainment, and the structure of social welfare systems. One significant dimension of poverty in the CEE relates to “working poverty,” where individuals are employed but still live below the poverty line. Research by Brady et al. [8] emphasises that the generosity of welfare states has a substantial impact on the prevalence of working poverty across Europe, including CEE nations. Their findings suggest that as welfare state support increases, the probability of working poverty decreases, highlighting the critical role of social safety nets in mitigating economic hardship for working individuals in the region [8]. Furthermore, Filandri and Struffolino [9] stress that labour market characteristics, such as wage levels and employment stability, significantly correlate with incidences of in-work poverty, further complicating the relationship between employment and poverty in CEE.
The relationship between education and poverty is a fundamental research question in the study of economics, as poverty restricts children’s access to quality education [10,11,12]. Psacharopoulos and Patrinos [13] state that every additional year of schooling can increase the private average global return by 9%, which highlights the importance of education in breaking the poverty cycle. The Poverty, Prosperity, and Planet Report published by the World Bank in 2024 [14] highlights the negative correlation level of education with the poverty rate, which reinforced that the poverty rate decreases as the level of education increases. López Peláez et al. [15] highlighted the role of decent work standards in reducing poverty by analysing 225 articles. Their study revealed that decent work, ethical workplace practices, and fair wages enrich economic stability. A stable economic situation within a family can encourage adults to invest in their children’s education.
Given the synergy of the Sustainable Development Goals, achieving one goal brings progress to another [16]. For this reason, it can be examined whether education emerges as a key factor in decreasing the level of poverty in less developed countries. Nae et al. [17] analyse income inequality within post-communist nations, emphasising the importance of educational investments in promoting economic equality and reducing poverty. Their findings reveal that higher educational attainment correlates positively with employment opportunities and, consequently, lowers poverty risks, as those with better education access tend to secure more stable and higher-paying jobs. This is echoed in Mulliqi et al.’s [18] work, which links human capital endowments, as defined by educational levels, to international competitiveness, suggesting that nations investing in education are better positioned to improve labour market outcomes and reduce poverty. Another significant aspect is the issue of informal employment, which is prevalent in CEE countries and exacerbates the situation of poverty. Pfau-Effinger [19] discusses the challenges posed by the informal labour sector, where individuals often lack access to benefits and job security, leading to vulnerabilities that perpetuate poverty cycles. Williams [20] also supports this by noting that the prevalence of informal sectors in Eastern Europe correlates with insufficient employment rights and protections, positioning informal workers at a higher risk of experiencing poverty.
In addition, the historical context of labour market transitions in CEE significantly shapes current work standards and poverty levels. The aftermath of the transition from a centrally planned economy to a market economy created uneven distributions of wealth and opportunities, with marginalised groups, particularly women and disabled individuals, facing greater hardships [21,22]. Employment policies and labour market institutions that emerged during this transition have had lasting effects on employment stability and the ability of citizens to secure decent work [23,24,25]. Furthermore, the varying impacts of social policies and labour market reforms in CEE countries further illustrate the complexity of labour dynamics in shaping education and poverty outcomes [26,27]. The interplay of poverty, education, and decent work standards in Central and Eastern EU countries illustrates a multifaceted issue that requires comprehensive strategies that include improved educational access, robust labour protections, and effective welfare systems. Addressing these interconnected dimensions can lead to sustainable improvements in both individual well-being and broader socio-economic stability within the region.
Although previous studies have examined the determinants of poverty and the role of education and labour market factors in Central and Eastern European countries, few have applied a combined cluster and TOPSIS approach to simultaneously classify and rank these countries based on a multidimensional set of indicators aligned with SDGs 1, 4, and 8. This article contributes to the literature by providing a comprehensive, data-driven typology of CEE EU Member States, highlighting different country groups and their specific challenges. The use of both cluster analysis and TOPSIS offers a novel methodological perspective that enables a more nuanced understanding of cross-country differences and policy needs in the region. By identifying clusters of countries with similar profiles, this study also provides a foundation for more targeted and effective policy recommendations, filling a gap in the comparative analysis of poverty, education, and decent work standards in post-communist EU contexts.
The current research is structured into five sections: Introduction, Materials and Methods, Results, Discussions, and Conclusions. The introduction presents this study’s goals, objectives, and literature review, which represent the foundation of the current research. The second section presents the indicators and countries considered for both analyses along with their connections to the Sustainable Development Goals. For the three concepts analysed, certain representative indicators were chosen, as there are several studies that have investigated these variables individually. Thus, in the case of poverty, the variables chosen were severe material and social deprivation [28,29,30], people living in households with very low work intensity [31], and the in-work at-risk-of-poverty rate [32,33]. For quality education, the indicators chosen were tertiary education attainment [34,35], the adult participation rate in education and training [36,37], and the share of individuals having at least basic digital skills [38,39]. The third area examined, decent work and economic growth, was formed by studying the employment rate by education level [40,41], young people neither in employment nor in education and training [42,43], and the long-term unemployment rate [44,45,46]. This section also details the steps to be followed in the present study and the results of the country clustering. The Results Section presents a description of the chosen indicators, the correlation matrix, the cluster analysis, and TOPSIS analysis. The fourth section compares the findings of this research with the existing literature and highlights the importance of education for populations at risk of poverty. The conclusions demonstrate that there is a clear difference between clusters, while underperformance countries such as Romania and Bulgaria should consider substantial investments to improve access to primary education and policies to reduce unemployment. Countries with the lowest poverty rates in CEE—such as Estonia, Poland, Slovakia, and the Czech Republic—should continue investing in education, with a focus on higher education and adapting to new demands on the labour market.
2. Materials and Methods
The 11 Central and Eastern European (CEE) countries that are members of the European Union selected for this analysis are Bulgaria, Croatia, the Czech Republic, Estonia, Hungary, Lithuania, Latvia, Poland, Romania, Slovenia, and Slovakia. The aim of this paper is to comparatively analyse key indicators related to poverty, education, and decent work in Central and Eastern European countries and to identify and characterise groups of countries with similar profiles using cluster analysis. The variables included in this study were selected based on their relevance to the Sustainable Development Goals (SDGs 1, 4, and 8); their frequent use in the literature as key determinants of poverty, education, and decent work; and the availability of comparable data in the analysed countries. Previous research has demonstrated the strong explanatory power of indicators such as work intensity, educational attainment, and employment rates to understand poverty and social exclusion in the context of the EU [28]. All variables were sourced from Eurostat (the last year for which data was available at the time of creating this analysis was 2023) to ensure consistency and comparability. The final set of indicators was chosen to capture multidimensional aspects of social welfare, in line with the approaches recommended in recent studies on multidimensional poverty and welfare analysis.
Table 1 illustrates the indicators and their associated Sustainable Development Goals. In this sense, the first three indicators were chosen to define poverty; the next three were chosen to determine the quality of education, and the last four were used to investigate decent work and economic growth.

Table 1.
Indicators.
Since the indicators intended to describe poverty are quite vague, that is, the names being taken from Eurostat, it was desired to explain them as briefly as possible; for additional information, the aforementioned database can be consulted. Thus, the severe material and social deprivation rate defines the proportion of the population that experiences 7 of the 13 items made available by Eurostat. Among these items are the inability to cope with unforeseen expenses, changing worn-out clothes with new ones, the inability to heat their homes properly, etc. [20]. People living in households with very low work intensity refers to individuals aged 0 to 64 living in households where adults work less than 20% of their combined work potential in a year [21]. The in-work at-risk-of-poverty rate defines the proportion of people who are employed and have a disposable income below the at-risk-of-poverty threshold (under 60% of the national median disposable income) [22].
The first step of the analysis consisted of investigating the indicators through descriptive statistics, determining the correlations between them, and through scatterplots intended to illustrate the context in which the countries are found for each of the 10 indicators.
The second step was to apply cluster analysis using the K-means algorithm [23]. Each country’s values were standardised before clustering to ensure comparability. Since this is an unsupervised clustering method and the number of classes must be defined a priori by the researcher, three methods were applied to help determine the optimal number of clusters.
In the first phase, the silhouette coefficients were calculated; the highest value corresponded to the best classification in the classes [24]. The second method consisted of calculating the within-cluster sum of squares; in this case, the variance between clusters is desirable to be as small as possible [25]. And the third method, Gap statistic, considers the optimal number of classes by the maximum difference in values associated with each class [26].
The K-means algorithm starts from a respective number of centroids based on the number of classes defined by the researcher (in this case, the number was determined by evaluating silhouette scores, within-cluster sum of squares, and the gap statistic), calculating at each step the distances between the centroids and objects, including an object in a class if the distance between the centroid and the object is minimal. At each new iteration, the centroids and the distances from the objects are recalculated [36]. The algorithm stops when all objects are assigned to classes. The final cluster assignment reflects the country’s overall similarity to cluster centres across these variables. Cluster membership was determined by minimising the Euclidean distance between each country’s vector of standardised indicator values and the centroid of each cluster to ensure that countries within a cluster are more similar to each other than to those in other clusters.
To ensure the similarity of the countries within the clusters, the ANOVA test was implemented to determine whether there are significant differences. The null hypothesis of this test implies the existence of equal means, whereas the alternative hypothesis assumes at least one different mean. For significance threshold values lower than 5%, the null hypothesis is rejected [27].
Cluster analysis was chosen for its ability to identify natural groupings between countries based on multidimensional data, making it suitable for exploring similarities and differences in indicators of poverty, education, and work. The K-means algorithm, in particular, was selected due to its widespread use, interpretability, and effectiveness in partitioning data into homogeneous clusters [28].
The final section of this study is dedicated to TOPSIS analysis. TOPSIS (Technique for Order of Preference by Similarity to Ideal Solution) analysis is a decision support method used when there are multiple criteria; it was developed in 1981 by Chiang-Lai Hwang and Yoon [29]. The method involves determining the positive and negative ideal solutions of each criterion and calculating, for each attribute, the distances between the values of the criteria associated with the attributes and these ideal solutions. The best alternative is designated as the one that is at the shortest distance from the positive ideal solution, and, at the same time, the greatest distance from the negative ideal solution [30].
The TOPSIS method was applied to provide a comprehensive ranking of countries, as it is well-suited for multi-criteria decision analysis and allows for the simultaneous consideration of multiple indicators, identifying countries closest to the ideal performance profile.
3. Results
The results began by presenting statistics and correlations between indicators, followed by scatterplots to illustrate the context in which the 11 countries are found for each indicator. A second subsection encapsulated a cluster analysis, while the results ended with a TOPSIS analysis.
3.1. Description of Indicators
To highlight the overall situation of the 10 indicators for the 11 countries located in the CEE of the European Union, Table 2 was produced, in which certain statistical indicators are presented. In the case of the fraction of people with severe material and social deprivation, the average of the 11 countries is found to indicate a value of 7.32%, while in half of these countries, the ratio exceeds 6.10%. Furthermore, the minimum value for 2023 was 2%, and the maximum value reached 19.80%. The positive value of the asymmetry coefficient indicates a preponderance of small values, while the kurtosis coefficient indicates a leptokurtic series, which predicts possible outliers. For people living in households with very low work intensity, 5.54% of the citizens of the 11 countries are classified in this category; the values associated with each country vary, on average, by 1.33% from the mean. The skewness and kurtosis coefficients describe, in this case, a platykurtic series in which small values predominate; given the relatively small values of these coefficients, a small deviation from the normal distribution can be stated. In the case of the in-work at-risk-of-poverty rate, 8.55% of the population of the 11 countries fell into this category; in the case of half of the countries, the values exceeded 9%. For this rate, the weights varied between 3.10% and 15.30% for the positive values of the skewness and kurtosis coefficients, indicating the presence of outliers for the high ratios.
Table 2.
Descriptive statistics.
For the variables intended to describe quality education, tertiary education attainment was 39.43%, with weights varying between 22.50% and 57.40%; the value of the skewness coefficient being very close to zero indicates a symmetric series, but the kurtosis coefficient being close to one denotes the presence of a leptokurtic distribution. In 2023, only 10.69% of adults participated in education and training programmes. In half of the states, the proportion did not exceed 9.90%, and the ratios being found were between 1.40% and 23.20%. The positive values of the skewness and kurtosis coefficients indicate the preponderance of low values; the high fractions of this series can be considered outliers. The share of individuals who had at least basic digital skills was 50.31% as an average across the 11 countries, and the shares vary on average by 12.10% from this value. The ratios ranged between 27.73% and 69.11%, and the relatively small but negative value of the kurtosis coefficient indicates a series close to normal, with a slight tendency towards a platykurtic distribution.
The last four indicators were chosen with the aim of testing the standards related to decent work and economic growth. In this sense, the employment rate for people who graduated with tertiary education was 89.04% in the year analysed; in half of the countries, the ratios exceeded 89.70%; the values vary between 86.50% and 91.40%. In the case of the employment rate for people who graduated with less than primary, primary, and lower secondary education, it is found that 30.91% of these people have a job; in the case of the 11 countries analysed, the proportions vary between 16.30% and 42.60%. For both series, the asymmetry and skewness coefficients are negative, indicating the presence of platykurtic distributions in which high values prevail. Among young people, 11.55% are neither in employment nor in education and training; the fractions vary, on average, by 3.13% from this value. For the long-term unemployment rate, the average value was 1.84%, with rates ranging between 0.80% and 3.80%. For the last two indicators analysed, the positive values of the asymmetry and skewness coefficients denote the preponderance of low values and the possibility of identifying high ratios as outliers.
Regarding the correlations between the indicators, it is found, according to Figure 1, that there is a direct and strong link between the ratio of young people neither in employment nor in education and training and the proportion of people in severe material and social deprivation. Moreover, a strong but negative link was found between the share of individuals having at least basic digital skills and people in severe material and social deprivation, respectively, for the in-work at-risk-of-poverty rate. In this sense, the important role of education in combating poverty is noted.
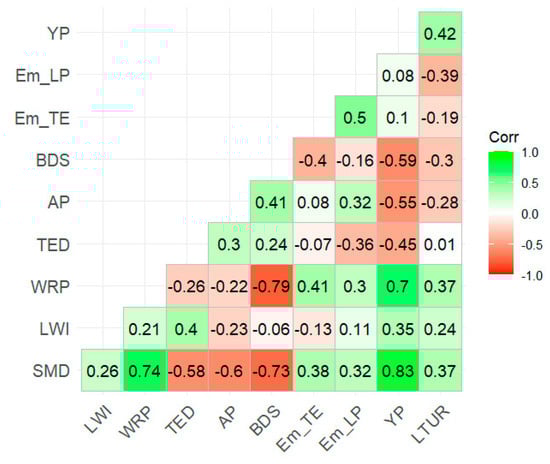
Figure 1.
Correlation matrix. Source: Authors’ research.
In the analysis of severe material and social deprivation and persons living in households with very low work intensity, it is found that Slovenia and Poland recorded the lowest values for both indicators, while Romania and Bulgaria have the highest proportions of persons in severe material and social deprivation, and Lithuania, Latvia, and Bulgaria present the highest shares of persons living in households with very low work intensity (Figure 2).
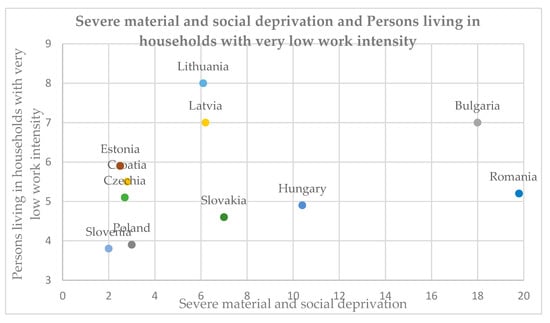
Figure 2.
Severe material and social deprivation and persons living in households with very low work intensity. Source: Authors’ research.
Similarly, for the share of individuals having at least basic digital skills and the in-work at-risk-of-poverty rate, Romania and Bulgaria present the worst performances, at the opposite pole being the Czech Republic with the lowest value of the in-work at-risk-of-poverty rate, as well as the highest share of individuals having at least basic digital skills (Figure 3).
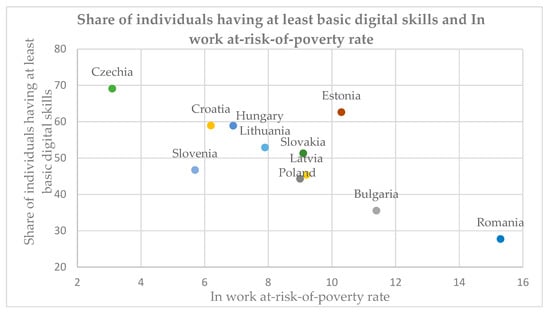
Figure 3.
Share of individuals having at least basic digital skills and the in-work at-risk-of-poverty rate. Source: Authors’ research.
Regarding young people neither in employment nor in education and training, Romania has by far the highest ratio of them, followed by Bulgaria and Lithuania. Also, the country with the highest long-term unemployment rate in 2023 was Slovakia followed by Lithuania and Bulgaria. The countries with the lowest long-term unemployment rate values were Poland and the Czech Republic, while Slovenia and Poland recorded the lowest values of young people neither in employment nor in education and training (Figure 4).
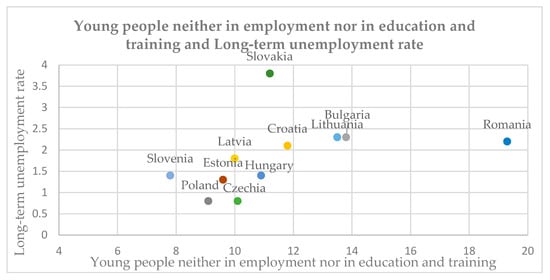
Figure 4.
Young people neither in employment nor in education and training and the long-term unemployment rate. Source: Authors’ research.
The countries with the lowest ratios of tertiary education attainment were Romania, Hungary, and the Czech Republic, while the highest fraction was achieved by Lithuania, significantly separating itself from the other states. Regarding the adult participation rate in education and training, the lowest value was recorded by Bulgaria, followed by Croatia and Romania, with Estonia and Slovenia being situated at the opposite pole (Figure 5).
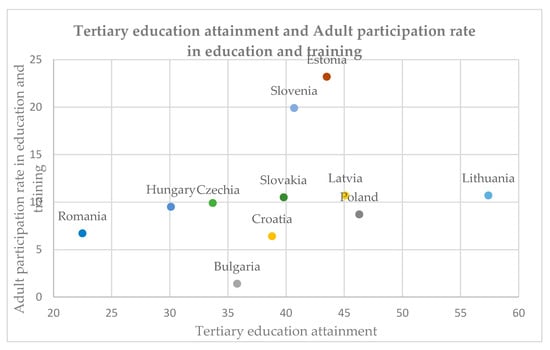
Figure 5.
Tertiary education attainment and the adult participation rate in education and training. Source: Authors’ research.
For the employment rate of tertiary education graduates, the difference between the lowest (Croatia and the Czech Republic) value and the highest (Hungary) value is 5%. In the case of the employment rate for those who graduated with less than primary, primary, and lower secondary education, the differences are much greater, with the minimum value found in Slovakia, while at the opposite pole, Estonia, Hungary, and Romania stood out (Figure 6).
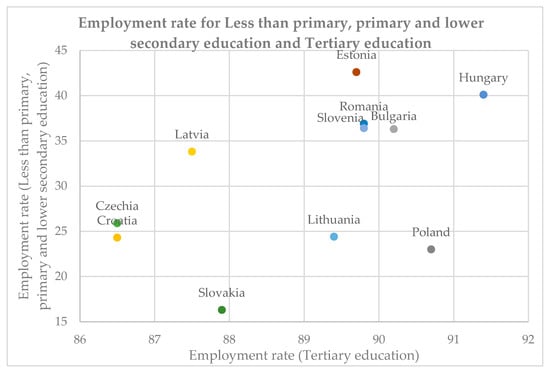
Figure 6.
Employment rate for less than primary, primary, and lower secondary education and tertiary education. Source: Authors’ research.
3.2. Cluster Analysis
The first step in the implementation of cluster analysis is to determine the number of classes. In the case of the K-means algorithm, the number of classes is declared a priori. To identify the number of clusters, the silhouette, within sum of squares, and statistical gap coefficients were calculated.
In the case of silhouette coefficients, their highest value is attributed to the best class distribution. According to Figure 7, by means of this criterion, the optimal number of classes is three.
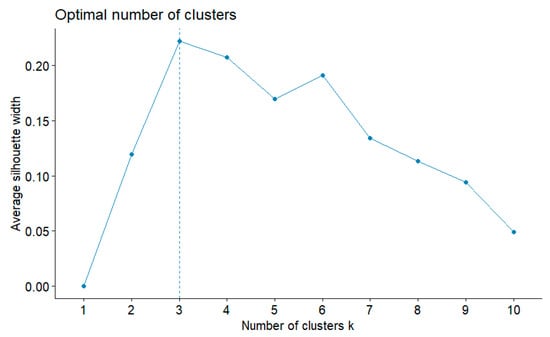
Figure 7.
Silhouette coefficients plot. Source: Authors’ research.
For within sum of square, it is desirable that the variance within the classes be as large as possible so that the data is as homogeneous as possible. Given that the maximum variance is 100 and for the first three classes, the value drops below 50, which is why, in this case, three classes can also be chosen (Figure 8).
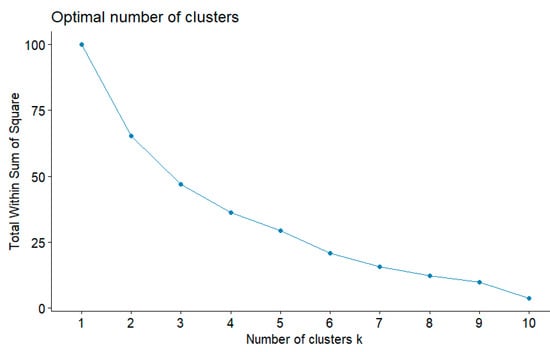
Figure 8.
Within sum of square plot. Source: Authors’ research.
For the gap statistic, it is noted that, according to Figure 9, the recommendation is to remain in one class.
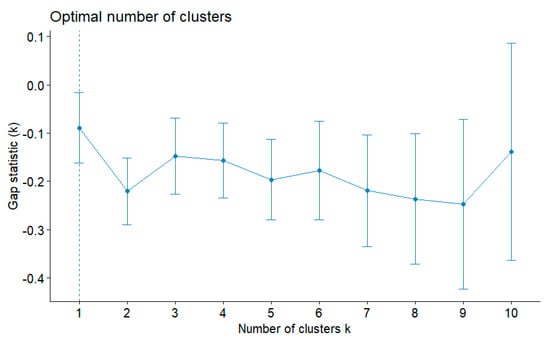
Figure 9.
Gap statistic plot. Source: Authors’ research.
According to the three criteria detailed above, three classes were chosen to encapsulate the 11 countries.
After implementing the K-means algorithm, the countries were divided into three classes, and the way they were grouped is highlighted in Figure 10. According to this classification, Romania and Bulgaria form one group, while Estonia, Poland, Hungary, and Slovenia constitute another class, and the other countries (Lithuania, Latvia, Croatia, Slovakia, and the Czech Republic) were grouped into another cluster.
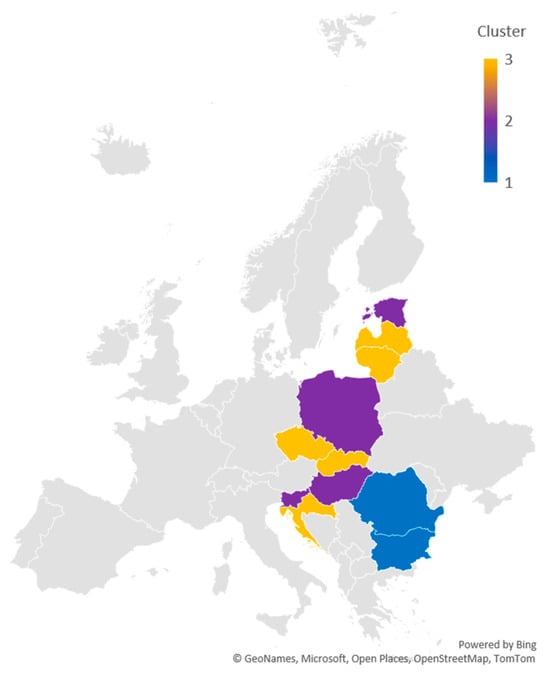
Figure 10.
Cluster analysis map. Source: Authors’ research.
Table 3 presents the averages obtained for each cluster related to the 10 indicators. Thus, in terms of poverty, cluster 1 (Romania and Bulgaria) faces the highest ratios of SMD, LWI, and WRP. The second cluster is characterised by the lowest values of SMD and LWI but ranks second in terms of WRP. The third cluster has values appropriate to those of cluster 2 for SMD, and WRT, the proportion of SMD being higher compared to cluster 2, but that of WRT is lower compared to the same cluster. In the case of LWI, the value is closer to that of cluster 1 but slightly lower. These results are consistent with Eurostat reports [3]. For the year 2024, the countries with the highest rate of people at risk of poverty or social exclusion were Bulgaria and Romania, while at the opposite pole were countries such as Slovenia and the Czech Republic.
Table 3.
Cluster means.
For the indicators designed to assess educational standards, it is noteworthy that, again, cluster 1 faces the worst performance for all three variables. Cluster 3 presents the highest proportions of TED and BDS, while cluster 2 had a much higher ratio of AP. Regarding decent work standards, it is found that the lowest values of Em_TE and Em_LP were obtained by the countries forming the third cluster, while cluster 1 is again characterised by the worst performances regarding YP and LTUR. Cluster 2 stands out not only for the lowest proportions of YP and LTUR but also for the highest fraction of Em_TE and the second highest ratio of Em_LP; for this last indicator, cluster 1 has the highest performance.
The poor results of the first cluster for all three plans are consistent with the observations of other studies [3,42,43,44], where the inverse relationship between educational attainment and the risk of poverty and the direct relationship between the unemployment rate and the risk of poverty were also noted.
To determine whether there are significant differences between the countries within the clusters, the ANOVA test was used (Table 4), for which the null hypothesis assumes that there are no significant differences [27].
Table 4.
ANOVA mean differences.
Given that the p-value for all three clusters is much higher than the significance level of 0.05, the null hypothesis cannot be rejected; thus, there is not enough evidence to indicate that the means are different, so there are no significant differences between the countries within the clusters.
3.3. TOPSIS Analysis
In the following section, the results of the TOPSIS analysis are presented, highlighting a ranking of countries based on their performance across the 10 indicators investigated.
Table 5 presents the normalised values of the indicators and illustrates the positive and negative ideals for each indicator. Subsequently, the distances between each country and these ideals (si+ and si−, respectively) were calculated to finally determine how close or how far they are to the positive and negative ideal solutions. This is established by calculating the ratio between si− and the sum of the two distances, obtaining the coefficient pi. The country with the highest registered value for pi is the closest to the positive ideal solution and, at the same time, the farthest from the negative ideal solution.
Table 5.
TOPSIS analysis results.
For an enhanced visualisation of the ranking, the map presented in Figure 11 was created. The results show that as in the case of the cluster analysis, Romania and Bulgaria are characterised by the worst performances and are the closest countries to the negative ideal solutions.
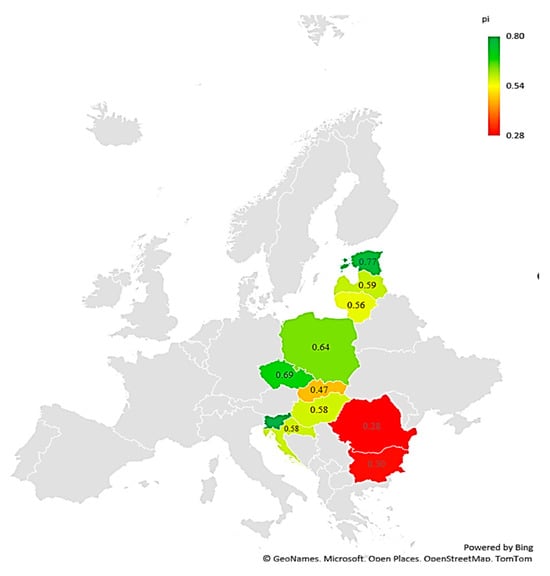
Figure 11.
TOPSIS analysis map. Source: Authors’ research.
According to this analysis, the country closest to the ideal positive solution is Slovenia, followed by Estonia, the Czech Republic, and Polonia. Of these four countries, three of them were part of the second cluster, together with Hungary, which was also characterised by this method, as the benchmark for the CEE countries that are part of the EU (Figure 11).
Moreover, the situation does not seem to have changed since 2021, which was when Romania and Bulgaria presented the highest values of people at risk of poverty or social exclusion, while the Czech Republic and Slovenia presented among the lowest values; an identical situation is also found in the case of early leavers from education and training or young people neither in employment nor in education and training [41].
4. Discussion
The findings align with and extend previous research on poverty, education, and labour dynamics in Central and Eastern Europe (CEE). The analyses revealed that Romania and Bulgaria consistently exhibited the poorest outcomes across most of the indicators of poverty, education, and decent work, as evidenced by both the cluster and TOPSIS analyses. In contrast, Slovenia, Estonia, and the Czech Republic demonstrated the most favourable profiles, ranking highest in key indicators such as low levels of severe material deprivation, high digital skills, and strong employment rates for tertiary graduates. The remaining countries formed an intermediate group, reflecting mixed performances in all three dimensions. These results highlight significant disparities among Central and Eastern European EU countries in achieving the targets of SDGs 1, 4, and 8. Cluster and TOPSIS analyses revealed stark disparities, particularly the underperformance of Romania and Bulgaria in poverty and education metrics, consistent with studies identifying structural challenges in these countries. Slovenia’s strong performance mirrors its robust social protection systems and educational investments, as noted in EU-wide comparisons of poverty determinants [42,43]. The strong correlation between the rates of NEET (young people not in employment, education, or training) and severe material deprivation (SMD) supports previous findings that youth disengagement exacerbates intergenerational poverty [44]. For instance, Tudorache [43] identified early school leavers and rural populations as key poverty drivers in CEE, which resonates with Romania’s and Bulgaria’s high levels of SMD (18.9% and 19.8%, respectively) and elevated NEET rates (16.55% and 19.3%). These nations’ reliance on low-skilled labour and seasonal agriculture further perpetuates cyclical deprivation [45].
The inverse relationship between basic digital skills (BDSs) and in-work poverty underscores education’s role in breaking poverty cycles. UNICEF’s regional studies emphasise that disparities in educational access—particularly for rural and marginalised groups—heighten vulnerability to low-wage informal work [46,47]. Our results reinforce this: Bulgaria and Romania had the lowest BDS scores (27.73% and 31.63%), while high-performing Slovenia (53.13%) and Estonia (69.11%) linked stronger digital literacy to lower poverty. This aligns with OECD findings that equitable education systems reduce skill gaps and improve labour outcomes.
The employment rate gap between tertiary-educated (89.04%) and low-educated individuals (30.91%) highlights systemic inequities in labour market access. Similar to Eurostat data [46], in-work poverty remains acute in CEE due to precarious employment and weak social safety nets. For example, Slovakia’s long-term unemployment (3.8%) and Bulgaria’s low adult education participation (1.4%) reflect institutional failures noted in the SDC analyses. Conversely, Slovenia’s success—rooted in vocational training and social transfers—offers a model for regional policymakers.
5. Conclusions
The purpose of this paper was to identify the standards of poverty, education, and decent work for the EU Member States located in Central and Eastern Europe. In this regard, 10 indicators were identified to help examine three Sustainable Development Goals (SDG 1, SDG 4, and SDG 8). According to the results provided, the poor performance of Romania and Bulgaria was highlighted. In the case of the cluster analysis, for 8 of the 10 indicators, this class was at the bottom of the ranking; also, in the situation of the TOPSIS analysis, this major difference between the score obtained by the two countries compared to the other countries investigated was also noted.
Furthermore, through the correlations between the indicators, the link between poverty, education, and work was observed. Thus, the strong but inverse link between the share of individuals having at least basic digital skills and people in severe material and social deprivation, respectively, as well as the in-work at-risk-of-poverty rate, was highlighted, as was the positive and strong link between the last two indicators mentioned and the proportion of young people neither in employment nor in education and training.
The countries whose results can be considered standards to be achieved for those at the bottom of the ranking created through the TOPSIS analysis are Slovenia, Estonia, and the Czech Republic, which consistently stand out as the countries with the best performances for 2023.
The findings of this study contribute to the theoretical understanding of the multidimensional links between poverty, education, and decent work in Central and Eastern European (CEE) EU countries. By applying both cluster analysis and TOPSIS, the research empirically confirms that educational attainment and labour market integration are decisive factors in reducing poverty risks, supporting established theories on human capital and social exclusion [43]. The clear differentiation of clusters—especially the persistent underperformance of Romania and Bulgaria—reinforces the argument that structural and institutional factors, such as welfare state generosity and labour market segmentation, remain central to explaining regional disparities [17]. This study further substantiates the literature, emphasising the compounded disadvantage faced by countries with high NEET rates, low digital skills, and weak social protection systems [48].
From a practical perspective, the cluster-based results offer tailored policy recommendations. For cluster 1 (Romania and Bulgaria), which faces the highest poverty rate and lowest education and employment outcomes, priority should be given to expanding access to quality education—including digital literacy—strengthening active labour market policies, and increasing investment in social protection, as recommended by Eurostat and the European Commission [48,49]. Targeted interventions such as raising minimum income schemes and improving measures for the take-up of the child guarantee can help break intergenerational poverty cycles. For cluster 2 (Estonia, Poland, Hungary, and Slovenia), which demonstrates the most favourable outcomes, the focus should be on sustaining high educational standards, fostering innovation, and addressing emerging labour market challenges such as automation and skill mismatches, in line with findings on cluster competitiveness and labour market resilience [50]. Cluster 3 (Lithuania, Latvia, Croatia, Slovakia, and the Czech Republic) would benefit from policies that bridge the gap between education and labour market needs, particularly by reducing early school abandonment and strengthening vocational training and adult education, as highlighted in recent research on poverty determinants and labour market integration. Across all clusters, reinforcing social dialogue, promoting inclusive labour institutions, and enhancing the coherence of social and employment policies are necessary to ensure that economic growth translates into poverty reduction and decent work for all [43,48,51,52,53,54,55,56,57,58,59,60,61,62,63,64,65,66,67,68,69,70].
By distinguishing the specific needs and strengths of each cluster, these proposals align with the latest EU policy frameworks and international recommendations, offering a concrete roadmap for advancing SDGs 1, 4, and 8 in the region [49].
The study showed that countries with low performance in one of the three concepts studied tend to have poor results in the other two. For further research, one can conduct an in-depth analysis of the causal relationships between poverty, education, and working conditions.
Author Contributions
Conceptualization, A.C. and V.V.; methodology, A.C. and A.-I.J.; software, A.C. and A.-I.J.; validation, A.C., V.V., C.P. and A.-I.J.; formal analysis, A.C., V.V., C.P. and A.-I.J.; investigation, A.C., V.V., C.P. and A.-I.J.; resources, A.C. and V.V.; data curation, A.C. and V.V.; writing—original draft preparation, A.C. and V.V.; writing—review and editing, A.C., V.V., C.P. and A.-I.J.; visualisation, A.C., V.V., C.P. and A.-I.J.; supervision, C.P. All authors have read and agreed to the published version of the manuscript.
Funding
This research received no external funding.
Institutional Review Board Statement
Not applicable.
Informed Consent Statement
Not applicable.
Data Availability Statement
Data are contained within the article.
Conflicts of Interest
The authors declare no conflicts of interest.
References
- THE 17 GOALS|Sustainable Development. Available online: https://sdgs.un.org/goals (accessed on 27 May 2024).
- Drigo, C. Human Dignity, Poverty and Social Exclusion Challenges for Europe. In Probing Human Dignity: Exploring Thresholds from an Interdisciplinary Perspective; Arel, S.N., Cooper, L., Hellmann, V., Eds.; Springer Nature: Cham, Switzerland, 2024; pp. 75–101. ISBN 978-3-031-42437-3. [Google Scholar]
- Living Conditions in Europe—Poverty and Social Exclusion. Available online: https://ec.europa.eu/eurostat/statistics-explained/index.php?title=Living_conditions_in_Europe_-_poverty_and_social_exclusion (accessed on 30 May 2025).
- Tummuru, S.N.R. Post-EU Accession Democratic Trends in Romania, Bulgaria, and Croatia: Analyzing Consolidation and Backsliding. 2024. Available online: http://lup.lub.lu.se/student-papers/record/9152742 (accessed on 30 May 2025).
- Dimitrov, P.M.; Kraseta, R.; Dimitrov, B.; Parvanov, P. Bulgarian Tourism and the Problem of Poverty in Bulgaria. Tour. Manag. Stud. 2018, 14, 45–52. [Google Scholar] [CrossRef]
- Transforming Our World: The 2030 Agenda for Sustainable Development|Department of Economic and Social Affairs. Available online: https://sdgs.un.org/2030agenda (accessed on 30 May 2025).
- Decent Work|International Labour Organization. Available online: https://www.ilo.org/topics-and-sectors/decent-work (accessed on 30 May 2025).
- Brady, D.; Fullerton, A.S.; Moren Cross, J. More Than Just Nickels and Dimes: A Cross-National Analysis of Working Poverty in Affluent Democracies. Soc. Probl. 2010, 57, 559–585. [Google Scholar] [CrossRef] [PubMed]
- Filandri, M.; Struffolino, E. Individual and Household In-Work Poverty in Europe: Understanding the Role of Labor Market Characteristics. Eur. Soc. 2019, 21, 130–157. [Google Scholar] [CrossRef]
- Hofmarcher, T. The Effect of Education on Poverty: A European Perspective. Econ. Educ. Rev. 2021, 83, 102124. [Google Scholar] [CrossRef]
- Laing, K.; Thomas, U.; Tiplady, L.; Todd, L. Partnerships to Tackle the Effects of Socio-Economic Inequality on Children’s Experiences of School. Eur. Educ. Res. J. 2025. ahead of print. [Google Scholar] [CrossRef]
- Vincze, E.; Ban, C.; Gog, S.; Friberg, J.H. The Political Economy of Extreme Poverty in Eastern Europe: A Comparative Historical Perspective of Romanian Roma, 1st ed.; Routledge: London, UK, 2024; ISBN 978-1-003-52203-4. [Google Scholar]
- Psacharopoulos, G.; Patrinos, H.A. Returns to Investment in Education: A Decennial Review of the Global Literature. Educ. Econ. 2018, 26, 445–458. [Google Scholar] [CrossRef]
- Poverty, Prosperity, and Planet Report 2024. Available online: https://www.worldbank.org/en/publication/poverty-prosperity-and-planet (accessed on 30 May 2025).
- López Peláez, A.; Aramendia-Muneta, M.E.; Erro-Garcés, A. Poverty, Social Work, and Social Intervention: Decent Work as a Strategy to Overcome Poverty after the Covid-19. J. Soc. Work Pract. 2023, 37, 213–229. [Google Scholar] [CrossRef]
- Weitz, N.; Carlsen, H.; Nilsson, M.; Skånberg, K. Towards Systemic and Contextual Priority Setting for Implementing the 2030 Agenda. Sustain. Sci. 2018, 13, 531–548. [Google Scholar] [CrossRef]
- Nae, T.M.; Florescu, M.-S.; Bălășoiu, G.-I. Towards Social Justice: Investigating the Role of Labor, Globalization, and Governance in Reducing Socio-Economic Inequality within Post-Communist Countries. Sustainability 2024, 16, 2234. [Google Scholar] [CrossRef]
- Mulliqi, A.; Adnett, N.; Hisarciklilar, M.; Rizvanolli, A. Human Capital and International Competitiveness in Europe, with Special Reference to Transition Economies. East. Eur. Econ. 2018, 56, 541–563. [Google Scholar] [CrossRef]
- Pfau-Effinger, B. Informal Employment in the Poor European Periphery. Int. J. Sociol. Soc. Policy 2017, 37, 387–399. [Google Scholar] [CrossRef]
- Williams, C.C. Out of the Shadows: A Classification of Economies by the Size and Character of Their Informal Sector. Work Employ. Soc. 2014, 28, 735–753. [Google Scholar] [CrossRef]
- Mussida, C.; Sciulli, D. Disability and Employment across Central and Eastern European Countries. IZA J. Labor Dev. 2016, 5, 4. [Google Scholar] [CrossRef]
- Schnepf, S.V. Gender Differences in Subjective Well-Being in Central and Eastern Europe. J. Eur. Soc. Policy 2010, 20, 74–85. [Google Scholar] [CrossRef]
- Cristescu, A.; Stănilă, L.; Vasilescu, M.D.; Munteanu, A.M. Macroeconomic Determinants of Labour Costs in the EU: A Comprehensive Panel and Cluster Analysis. Manag. Mark. 2024, 19, 538–554. [Google Scholar] [CrossRef]
- Davidescu, A.A.; Manta, E.M.; Geambasu, C.M.; Birlan, I. Informality and Inclusion: Assessing the Effects of the Shadow Economy and Informal Labour in Europe. Manag. Mark. 2024, 19, 307–335. [Google Scholar] [CrossRef]
- Lehmann, H.F.; Muravyev, A. Labor Markets and Labor Market Institutions in Transition Economies. SSRN Electron. J. 2011, 5905, 350–362. [Google Scholar] [CrossRef]
- Bosna, J.; Bušelić, M. Defining the Unemployment Determinants of the Post-Transition Central European EU Member Countries. Manag. Glob. Transit. 2019, 17, 79–103. [Google Scholar] [CrossRef]
- Ward-Warmedinger, M.; Macchiarelli, C. Transitions in Labour Market Status in EU Labour Markets. IZA J. Eur. Labor Stud. 2014, 3, 17. [Google Scholar] [CrossRef][Green Version]
- Farcomeni, A.; Pittau, M.G.; Viviani, S.; Zelli, R. A Measurement Scale for Material Deprivation: A Model-based Approach. Rev. Income Wealth 2025, 71, e12716. [Google Scholar] [CrossRef]
- Fabrizi, E.; Mussida, C.; Parisi, M.L. Material and Social Deprivation among One-Person Households: The Role of Gender. J. Popul. Econ. 2025, 38, 10. [Google Scholar] [CrossRef]
- Carella, M.; Misuraca, R.; Paterno, A. Investigating the Relationship between Material Deprivation and Household Context among Older People in Italy. Riv. Ital. Econ. Demogr. E Stat. 2025, 79, 19–30. [Google Scholar] [CrossRef]
- Stewart, K.; Patrick, R.; Reeves, A. A Time of Need: Exploring the Changing Poverty Risk Facing Larger Families in the UK. J. Soc. Policy 2025, 54, 75–99. [Google Scholar] [CrossRef]
- Barford, A.; Beales, A.; Zorila, M. An Expert Study of Systemic Influences on Progress Towards Living Wages: A Key to Unlock the Sustainable Development Goals. Bus. Strategy Dev. 2025, 8, e70048. [Google Scholar] [CrossRef]
- Henkel, F.; Fischer, A.; Sommer, C. Integrated Consideration of the Social and Ecological Dimension of the Mobility Transition: Barriers to Using Sustainable Transport Systems by People at Risk of Poverty. J. Urban Mobil. 2025, 7, 100124. [Google Scholar] [CrossRef]
- Kuyvenhoven, J.; Haandrikman, K. Childhood Residential and Neighbourhood Mobility: Consequences for Educational Attainment in Young Adulthood. Adv. Life Course Res. 2025, 63, 100655. [Google Scholar] [CrossRef]
- Williams, K. Do Migrants’ Remittances Improve Educational Attainment in Developing Countries? In Economic Challenges in Early 21st Century Guyana; DaSilva-Glasgow, D., Khemraj, T., Thomas, D., Eds.; Springer Nature: Cham, Switzerland, 2024; pp. 281–300. ISBN 978-3-031-75018-2. [Google Scholar]
- Jones, M.; Jones, D. Introduction: Adult Education in Higher Education in the UK. In Inclusive Adult Education; Jones, M., Jones, D., Eds.; Palgrave Studies in Adult Education and Lifelong Learning; Springer Nature: Cham, Switzerland, 2024; pp. 1–21. ISBN 978-3-031-67098-5. [Google Scholar]
- Fındık, L.Y. The Development of Adult Education: In Exploring Adult Education Through Learning Theory; IGI Global: Hershey, PA, USA; Fındık, L.Y., Ed.; 2024; pp. 1–28. ISBN 979-8-3693-5812-2. [Google Scholar]
- Loh, R.S.M.; Kraaykamp, G.; Van Hek, M. Plugging in at School: Do Schools Nurture Digital Skills and Narrow Digital Skills Inequality? Comput. Educ. 2025, 226, 105195. [Google Scholar] [CrossRef]
- Cattaneo, A.A.P.; Antonietti, C.; Rauseo, M. How Do Vocational Teachers Use Technology? The Role of Perceived Digital Competence and Perceived Usefulness in Technology Use across Different Teaching Profiles. Vocat. Learn. 2025, 18, 5. [Google Scholar] [CrossRef]
- Parvin, A. Comparative Analysis of Child Development Approaches Across Different Education Systems Globally. J. Humanit. Soc. Sci. Stud. 2025, 7, 95–113. [Google Scholar] [CrossRef]
- Demianova, A.; Gershman, M.; Kutsenko, E.; Polyakova, E.; Vlasova, V. The Four Worlds of Creative Employees: The Role of Education Level and Job-Education Match. Cult. Trends 2025, 34, 62–82. [Google Scholar] [CrossRef]
- Kingsbury, M.; Alaie, I.; Clayborne, Z.; Reme, B.-A.; Nilsen, W.; Colman, I. Pathways from Early Life Adversities to Youth Marginalization: A Longitudinal Study of Youth Not in Education, Employment, or Training. J. Adolesc. Health 2025, 76, 105–114. [Google Scholar] [CrossRef]
- Farina, I.; Sangiorgi, D.; Masella, C.; Simonelli, I.; Alves, R.; Marques, M.J.; Dias, S.; Dantas, C.; Herzog, S.; Paternoster, S.; et al. A Service Ecosystems Perspective to Explore Social Prescribing Value Co-Creation for Vulnerable Young People in NEET Situation. BMC Health Serv. Res. 2025, 25, 88. [Google Scholar] [CrossRef] [PubMed]
- Blomgren, S.; Saikku, P.; Partanen, J. Improving Employability? Individual Placement and Support for the Long-term Unemployed and Individuals with Developmental Disabilities in Finland. Int. J. Soc. Welf. 2025, 34, e70004. [Google Scholar] [CrossRef]
- Moridian, A.; Radulescu, M.; Usman, M.; Mahdavian, S.M.; Hagiu, A.; Serbanescu, L. Unemployment Rate and Its Relationship with Government Size, Trade, Inflation, Urbanization, and Economic Growth in Romania. Heliyon 2025, 11, e41579. [Google Scholar] [CrossRef]
- Barraud Froget, S.; Perez-Dandieu, B.; Marquebieille, C.; Tapia, G. Testing the Effectiveness of a New French Assisted Resilience Program among Long-Term Unemployed People: A Randomized Control Trial. Psychol. Health Med. 2025, 30, 737–751. [Google Scholar] [CrossRef]
- Abdul Rahman, M.; Sani, N.S.; Hamdan, R.; Ali Othman, Z.; Abu Bakar, A. A Clustering Approach to Identify Multidimensional Poverty Indicators for the Bottom 40 Percent Group. PLoS ONE 2021, 16, e0255312. [Google Scholar] [CrossRef]
- Eurostat Taux de Privation Matérielle et Sociale Sévère Par Âge et Sexe 2022. Available online: https://ec.europa.eu/eurostat/statistics-explained/index.php?title=Glossary:Severe_material_and_social_deprivation_rate_(SMSD) (accessed on 30 May 2025).
- Eurostat. In Haushalten Mit Sehr Niedriger Erwerbstätigkeit Lebende Personen, Nach Altersklasse 2024. Available online: https://ec.europa.eu/eurostat/statistics-explained/index.php?title=Glossary:Persons_living_in_households_with_low_work_intensity (accessed on 30 May 2025).
- Eurostat In Work At-Risk-of-Poverty Rate 2022. Available online: https://ec.europa.eu/eurostat/cache/metadata/en/sdg_01_41_esmsip2.htm (accessed on 30 May 2025).
- Likas, A.; Vlassis, N.; Verbeek, J.J. The Global K-Means Clustering Algorithm. Pattern Recognit. 2003, 36, 451–461. [Google Scholar] [CrossRef]
- Rousseeuw, P.J. Silhouettes: A Graphical Aid to the Interpretation and Validation of Cluster Analysis. J. Comput. Appl. Math. 1987, 20, 53–65. [Google Scholar] [CrossRef]
- Zhao, Q.; Xu, M.; Fränti, P.P. Sum-of-Squares Based Cluster Validity Index and Significance Analysis. In Adaptive and Natural Computing Algorithms; Springer: Berlin/Heidelberg, Germany, 2009; pp. 313–322. ISBN 978-3-642-04920-0. [Google Scholar]
- Tibshirani, R.; Walther, G.; Hastie, T. Estimating the Number of Clusters in a Data Set Via the Gap Statistic. J. R. Stat. Soc. Ser. B Stat. Methodol. 2001, 63, 411–423. [Google Scholar] [CrossRef]
- Steinhaus, H. Sur La Division Des Corps Mat’eriels En Parties Par. Bull. L’Académie Pol. Sci. 1956, 4, 801–804. [Google Scholar]
- Fisher, R. Design of Experiments, 9th ed.; Macmillan: New York, NY, USA, 1971; ISBN 978-0-02-844690-5. [Google Scholar]
- Ikotun, A.M.; Ezugwu, A.E.; Abualigah, L.; Abuhaija, B.; Heming, J. K-Means Clustering Algorithms: A Comprehensive Review, Variants Analysis, and Advances in the Era of Big Data. Inf. Sci. 2023, 622, 178–210. [Google Scholar] [CrossRef]
- Hwang, C.-L.; Yoon, K. Methods for Multiple Attribute Decision Making. In Multiple Attribute Decision Making: Methods and Applications A State-of-the-Art Survey; Hwang, C.-L., Yoon, K., Eds.; Springer: Berlin/Heidelberg, Germany, 1981; pp. 58–191. ISBN 978-3-642-48318-9. [Google Scholar]
- Lai, Y.-J.; Liu, T.-Y.; Hwang, C.-L. TOPSIS for MODM. Eur. J. Oper. Res. 1994, 76, 486–500. [Google Scholar] [CrossRef]
- Ciucu (Durnoi), A.-N.; Ioanăș, C.; Iordan, M.; Delcea, C. Forecasting Sustainable Development Indicators in Romania: A Study in the European Context. Sustainability 2024, 16, 4534. [Google Scholar] [CrossRef]
- Branyiczki, R. Employment, Education and Other Means of Reducing Poverty. Soc. Situat. Monit. 2015, 4, 1–53. [Google Scholar]
- Tudorache, M.-D. Poverty Rate Determinants in the Central and Eastern Europe Member States. Theor. Appl. Econ. 2019, 26, 163–180. [Google Scholar]
- Jianu, I. The Effect of Young People Not in Employment, Education or Training, On Poverty Rate in European Union. arXiv 2007, arXiv:2007.11435. [Google Scholar] [CrossRef]
- Peña-Casas, R.; Ghailani, D.; Spasova, S.; Vanhercke, B. In-Work Poverty in Europe: A Study of National Policies; European Commission, Directorate General for Employment, Social Affairs and Inclusion, Eds.; Publications Office: Luxembourg, 2019. [Google Scholar]
- OECD; United Nations Children’s Fund. Education in Eastern Europe and Central Asia: Findings from PISA; PISA; OECD: Paris, France, 2021; ISBN 978-92-64-71411-3. [Google Scholar]
- UNICEF Regional Office for CEE/CIS. Education for Some More than Others? A Regional Study on Education in Central and Eastern Europe and the Commonwealth of Independent States (CEE/CIS); UNICEF Regional Office for CEE/CIS: Geneva, Switzerland, 2007; ISBN 978-92-806-4161-5. [Google Scholar]
- European Commission Employment and Social Developments in Europe. Available online: https://ec.europa.eu/social/main.jsp?catId=738&langId=en (accessed on 30 May 2025).
- De Schutter, O. Statement by the United Nations Special Rapporteur on Extreme Poverty and Human Rights on the Announcement That the EU Would Adopt Its First-Ever EU Anti-Poverty Strategy 2024. Available online: https://www.srpoverty.org/fr/2024/10/15/statement-on-the-first-eu-anti-poverty-strategy/ (accessed on 30 May 2025).
- Chifor, D.-C.; Maier, L.C.; Arion, F.H. Empirical Insights—Mapping the Key Factors That Have an Influence on Clusters Competitiveness|Bulletin of University of Agricultural Sciences and Veterinary Medicine Cluj-Napoca. Horticulture. Bull. Univ. Agric. Sci. Vet. Med. CLUJ-NAPOCA Hortic. 2024, 81, 31–39. [Google Scholar] [CrossRef]
- Daly, M. Fighting Child Poverty; Policy Department for Economic, Scientific and Quality of Life Policies: Luxembourg; European Parliament: Strasbourg, France, 2019. [Google Scholar]
Disclaimer/Publisher’s Note: The statements, opinions and data contained in all publications are solely those of the individual author(s) and contributor(s) and not of MDPI and/or the editor(s). MDPI and/or the editor(s) disclaim responsibility for any injury to people or property resulting from any ideas, methods, instructions or products referred to in the content. |
© 2025 by the authors. Licensee MDPI, Basel, Switzerland. This article is an open access article distributed under the terms and conditions of the Creative Commons Attribution (CC BY) license (https://creativecommons.org/licenses/by/4.0/).