Abstract
Acid drainage resulting from mining operations has led to significant iron contamination in surface waters, posing serious ecological and public health hazards. Elevated iron levels in freshwater ecosystems can severely affect aquatic organisms and human health. However, there remains a considerable gap in the establishment of benchmark values and ecological risk assessments (ERAs) for iron in surface waters in China. This study collected and screened 47 acute and chronic toxicity data points of 22 species for ferric iron (Fe3+) from various studies and databases. Three widely utilized methodologies were applied to derive long-term and short-term water quality criteria (LWQC and SWQC, respectively) for Fe3+; the logistic fitting curve based on the species sensitivity distribution (SSD) method was identified as the most optimal method, yielding an acute HC5 of 689 μg/L and an SWQC of 345 μg/L. The LWQC of Fe3+ was estimated to be 28 μg/L by dividing HC5 by the acute-to-chronic ratio (ACR), owing to the inadequacy of chronic toxicity data for model fitting. Utilizing these benchmarks, an ecological risk assessment (ERA) was conducted to compare the benchmarks with 68 iron exposure data points collected from surface waters across 30 provinces from eight river basins of China. The findings of 30% of the acute risk quotients and 83% of the chronic risk quotients raise substantial ecological concerns, primarily regarding the Yellow River Basin, Huaihe River Basin, and Songhua and Liaohe River Basin. This research provides critical insights into Fe3+ toxicity data collection and benchmark derivations, offering a benchmark data foundation for the remediation of surface water iron contamination and water quality management in China.
1. Introduction
Iron (Fe) is an extensively used heavy metal element, and it is the second most abundant metallic element in the Earth’s crust [1]. China has abundant iron mineral resources [2], and iron contamination is common. In correlated studies, excessive iron concentrations were found in the river body of the Middle Yangtze River [3], and the annual maximum iron concentration was monitored up to 2.38 mg/L in the man-made Changtan Reservoir in Zhejiang Province, far exceeding the standard limits in China [4]. Studies on anthropogenic enclosed agriculture wetlands in eastern Liaoning Province declared that the extension of land reclamation, continuous agricultural fertilization, and industrial activities, such as papermaking, urban expansion, etc., greatly increased the accumulation of heavy metals [5]. Since the 1950s, population growth, economic development, extended mineral exploitation, large-scale water conservancy projects, etc., have led to more terrestrial-generated materials entering surface water bodies, which has caused a sharp increase in freshwater iron concentration in China [3]. In order to control and remediate iron contamination effectively, the Chinese government set the criteria for iron concentration in surface water systems to 0.3 mg/L in the Environmental quality standard for surface water (GB3838-2002) and Standard for drinking water quality (GB5749-2022) [6,7].
In ecology, iron plays an indispensable role in all organisms’ growth and maintenance functions, and it has been found to rank first in both significance and amount among 14 trace elements that humans need [1]. However, both monomeric and chemosynthetic iron are toxic or weakly toxic [8], indicating that excessive iron concentrations in the environment cause toxic effects to organisms and human health. Related studies have proven that dissolved or precipitated iron in surface water, once ingested by organisms, is hard to metabolize, decompose, or expel from the body, and it can easily accumulate in aquatic animals’ livers and kidneys [9] or cause sensitive reactions and persistent in-body storage in zoobenthos like shellfish [10,11], as well as bio-magnify along the food chain [12].
Ecological risk assessment (ERA) is a process of evaluating the likelihood that adverse ecological effects will occur or are occurring under exposure to stressors. It aids in anticipating future effects on both ecosystems and human health [13]. ERA has been efficiently applied in water quality measurement, prioritizing management actions, water quality standard amendment, and improvement tracking [14]. In recent years, relevant studies in China have conducted risk assessments of heavy metal concentrations in surface waters. For instance, Zhao et al. investigated metal elements in the Fenhe River, Shanxi Province, and conducted health risk assessments on adults and minors [15]. However, relevant benchmarks and thresholds of iron concentrations related to aquatic organisms remain largely unknown, especially compared to the understanding of other well-known heavy metals and metalloids, such as lead (Pb), mercury (Hg), cadmium (Cd) [16], and manganese (Mn) [17]. Moreover, redox-sensitive metals could change their speciation through valence transitions and state transitions or through interactions with other materials to realize their geochemical cycle [8]. Based on this, in North America, William A. Stubblefield, A. S. Cardwell, and Robert W. Gensemer investigated the acute and chronic toxicity of aluminum (Al) [18,19] and iron [20] to aquatic organisms. They established international water quality criteria (WQC) through the species sensitivity distribution (SSD) approach and considered different conditions (pH, hardness, dissolved organic carbon, etc.) [21]. In comparison to international academic frontiers, there are still gaps in Chinese research about metallic WQC in terms of comprehensiveness and applicability.
In natural water bodies, iron primarily exists in two oxidation states: ferrous iron (Fe2+) and ferric iron (Fe3+). Fe3+ has greater stability in aqueous environments characterized by severe oxidizing conditions, while Fe2+ is more abundant in reducing settings [22]. In surface water systems, especially in oxygenated waters, Fe3+ is the predominant form. For instance, in acidic mine drainage (AMD)-contaminated rivers, Fe3+ concentrations were found to be significantly elevated, frequently precipitating as hydroxides or iron oxides [23]. Additionally, Fe3+ demonstrates significant bioavailability in aquatic ecosystems and acts as an essential supply of iron for metabolic functions in various organisms. Currently, various studies have examined the ecotoxicity of ferric iron in surface water ecosystems; nevertheless, the systematic completion of data collection remains inadequate. Numerous studies have focused on regions or categories of aquatic environments, which have been extremely limited. In several countries and locations, water quality criteria often rely on total iron concentrations without distinguishing between valence states. Similarly to the research to on Sb3+ [24], investigating the toxicological impacts of Fe3+ on diverse aquatic species is necessary.
This study aimed to conduct ERA on ferric iron (Fe3+)’s toxic effects in surface water around China. In this study, acute and chronic toxicity data of ferric iron were collected from databases, including the Ecotoxicology Database (ECOTOX), the China National Knowledge Infrastructure, and Web of Science (WOS), to obtain aquatic biological benchmarks using three derivation methods commonly used internationally. The aquatic biological benchmarks were used to compare the collected exposure concentrations of iron in surface water bodies and centralized drinking water sources around China and to assess the potential ecological risks and human health risks of the iron concentration in China. Moreover, because the referenced Fe toxicity data were on dissolved Fe or filterable Fe, where other forms of Fe such as colloidal FeOOH were included, the derived LWQC and SWQC were higher, affecting the correlated risk quotient results. This study provides a data basis for the formulation of iron benchmarks and the revision of standards in China, supporting risk assessment and improving regional water quality management and aquatic organism protection.
2. Materials and Methods
2.1. Toxicity Data and Fe Exposure Data
2.1.1. Toxicity Data
The data on the toxicity of ferric iron to aquatic organisms in this study were obtained from the Ecotoxicology Database (ECOTOX) [25], the China National Knowledge Infrastructure, and Web of Science (WOS). Based on guidelines for evaluating ecotoxicity data, the search keywords were set as follows: “iron (Fe)” and “toxicity” or “ecotoxicity”. Acute toxicity endpoints were selected as 50% of effective concentration (EC50), 50% of inhibitory concentration (IC50), and 50% of lethal concentration (LC50), while chronic toxicity endpoints were selected as No observed effect concentration (NOEC), Lowest observed effect concentration (LOEC), and Maximum acceptable toxicant concentration (MATC) [26]. The following guidelines were also considered: (1) The species is genetically stable, with great sensitivity and consistency of toxic reactions, and can be domesticated in the laboratory. (2) Requisite information is needed, including the Latin name of the species, the source, the exposure conditions, the test operating procedures, endpoints, etc. (3) Preferential selection was made for data from dependable statistical analyses.
The toxicity experimental data of ferric iron were collected and screened. Toxicity data of eligible species were screened according to kingdom, phylum, family, genus, and species. Species of different categories were screened according to exposure duration difference, and the specific screening principles referred to [27].
Eventually, toxicity data of ferric iron to freshwater aquatic organisms that met the requirements were obtained. For the same species, multiple toxicity data points with the same toxicity endpoints and the geometric mean of all the endpoints, except the eliminated outliers, were calculated as the species’ toxicity value [28]. For the same genus, the geometric mean value of all the species’ toxicity values in the genus is the genus’s toxicity value.
2.1.2. Exposure Data
Surface water exposure data of ferric iron were obtained from research articles and academic dissertations published between 2009 and 2024 in WOS (CNKI, Wanfang Data Base, etc.). Given that the vast majority of dissolved iron behaves like ferric iron in surface water, we collected the exposure data of total iron to represent this. The data cover a range of surface water bodies in 30 of China’s 34 provinces (except Taiwan Province, the Hong Kong Special Administrative Region, the Macao Special Administrative Region, and Inner Mongolia), taken from 49 articles. Surface water bodies of rivers, streams, lakes, reservoirs, estuaries, and centralized drinking water sources were included. The following points were taken into account when selecting data to facilitate data reliability and relevance: (1) Data regarding the mean, standard deviation (SD), maximum value, minimum value, etc., were selected preferentially [29]. (2) Data from surface water bodies close to a contaminated site and/or an emergency event were eliminated. (3) From the same location, Fe exposure data of different river beaches or different precipitation seasons were separated.
2.2. Derivation Methods for the Water Quality Criteria
Aquatic life criteria cover the maximum permissible concentration at which contamination would not cause long-term or short-term adverse effects to aquatic organisms and the environmental service of the surface water. This concentration level is one of the core components of WQC [30]. Three methods are commonly used in the world to derive aquatic life criteria: the assessment factor (AF) method, the toxicity percentage ranking (TPR) method, and the species sensitivity distribution (SSD) method [31].
2.2.1. The Assessment Factor (AF) Method
Among the three methods, the AF method was developed the earliest and is used to derive the aquatic life criteria. It is based on the long-term experience of the risk assessment of chemical substances. The toxicity data of the most sensitive organism are multiplied by the corresponding assessment factor or substituted into the corresponding empirical formula to obtain a single value [32]. This method is used to determine the concentration threshold of pollutants that cannot be exceeded under any circumstances, which relies on the toxicity data of the most sensitive organism [33]. Requiring less toxicity data and a simple calculation process, the AF method has strong universality when toxicity data are insufficient [34].
2.2.2. The Toxicity Percentage Ranking (TPR) Method
The toxicity percentage ranking (TPR) method was gradually established with the understanding of the physical and chemical characteristics of pollutants and the development of ecotoxicology and derived by the US EPA in 1985 [30]. The method takes into account acute toxic effects (ATEs) and chronic toxic effects (CTEs). The criteria values derived include the criteria maximum concentration (CMC) and criteria continuous concentration (CCC). CMC relates to the ATEs of pollutants on aquatic animals, and CMC is 1/2 of the final acute toxic value (FAV, mg/L). CCC considers the CTEs of pollutants on aquatic animals, living plants, and bioaccumulation effects. It takes the minimum value of the final chronic toxic value (FCV, mg/L), final plant value (FPV, mg/L), and final residual value (FRV, mg/L) [35].
In accordance with the requirements of the TPR method, the species mean acute value (SMAV), genus mean acute value (GMAV), and cumulative probability (p) of each species are calculated, where the SMAV and GMAV are calculated using the geometric mean method [36]. The GMAVs are ranked in ascending order. Four genera with cumulative probabilities (p) close to 0.5 were selected for the CMC and CCC calculation:
CMC—criteria maximum concentration, mg/L.
HC5—hazardous concentration for 5% of the species, mg/L.
AF—assessment factors, 2.
2.2.3. The Species Sensitivity Distribution Method
The species sensitivity distribution (SSD) method was proposed by the US EPA in 1978 for the derivation of aquatic life criteria and has been widely used in ERA [37]. Different from models of a single species combined with a single pollutant, the SSD method reflects the dose–response relationship of contamination and species by fitting an SSD curve, calculating HC5 (the concentration of pollutants harmful to 5% of the species), and constructing an SSD model [38]. Therefore, the SSD method analyzes the harm degree of different contaminations to different species from the perspective of the ecosystem, contributing to the evaluation of ecological risks.
According to software recommended by Ministry of Ecology and Environment of the People’s Republic of China: National Ecological and Environmental Benchmark Calculation Software—Species Sensitivity Distribution Method (1.0), the endpoints of the acute toxicity data obtained for this study include LC50, IC50, and EC50; the obtained chronic toxicity data include NOEC, LOEC, MATC, EC50, and LC50. The geometric mean of the acute or chronic endpoints for each species was found to be AVE and CVE, respectively. The logarithms, lgAVE and lgCVE, were calculated and ranked from minimum to maximum. The rank order R was determined, and the cumulative frequency FR of each species was calculated according to the formula below:
FR—cumulative frequency, %.
R—rank of toxicity value, dimensionless.
f—frequency, the number of species corresponding to the rank R of the toxicity value.
A fitted SSD model (normal distribution model, lognormal distribution model, logistic Steele distribution model, logistic Steele distribution model, etc.) was developed using or as the independent variable “x” and the corresponding cumulative frequency FR as dependent variable “y”. Based on the coefficient of determination (R2), the root mean square (RMSE), and the probability p-value of the model fit (A–D test), the optimal fitting model was determined.
In the best-fitted SSD model, the and corresponding to the cumulative frequency of 5% were determined, the AVE and CVE were obtained through antilogarithm, SHC5 and LHC5 were obtained, and the short-time water quality criteria (SWQC) and long-time water quality (LWQC) were calculated as follows:
where SWQC denotes the short-term water quality criteria, measured in μg/L or mg/L; SHC5 denotes the 5% species hazard concentration based on acute toxicity data, in μg/L or mg/L; and SAF is the short-term assessment factor, which is dimensionless.
where LWQC denotes the long-term water quality criteria, in μg/L or mg/L; LHC5 denotes the 5% species hazard concentration based on chronic toxicity data, in μg/L or mg/L; and LAF is the long-term assessment factor, which is dimensionless.
The short-term criteria assessment factor (SAF) and long-term baseline assessment factors (LAFs) were determined based on the number of endpoints and the range of organisms covered, as well as the distribution of the fitted data.
The steps of the three criteria derivation methods are approximately equivalent in data collection and derivation calculation. However, there are differences among the three methods in the treatment of toxicity data and calculation formulas. In order to obtain the most appropriate criteria value, it is necessary to compare the results of the three methods comprehensively.
2.2.4. The Risk Quotient Method
The risk quotient method is a simple method widely used to characterize risk by comparing measured or predicted exposure toxicity data to those of a certain pollutant with the predicted no-effect criteria to obtain a quotient value [39]. Risk is assessed according to the quotient. The higher the QR, the higher the risk, which is generally considered to be significantly affected if QR > 1 [40]. The formula is as follows:
where MEC is the measured environmental concentration, measured in μg/L; PNEC is the recommended interim predicted no-effect concentration, equal to WQC, measured in μg/L.
3. Results and Discussion
3.1. Toxicity Data Collection and Screening
In this study, 1352 toxicity data points of ferric iron were screened from the Ecotoxicology Database (ECOTOX), among which 147 toxicity data points of ferric iron and 47 toxicity data points of 22 species were obtained after further screening, as shown in Table 1. The acute toxicity data of ferric iron involved 18 species in 17 genera, with a total of 31 data points, which mainly included Fleabane trevally, Reticulated trevally, Positive trematode, Blackmouth Softhead minnow, and Bluegill sun perch. The toxicity data values ranged from 123 μg/L to 1 × 10⁶ μg/L. Chronic toxicity data for ferric iron involved four species from four genera, with a total of 16 toxicity data points, including Chlorella, Trematoda, Coelenterata, and Minnow, whose range was distributed between 10 μg/L and 6 × 10³ μg/L.
The acute toxicity data were sufficient and covered a wide range of species types, allowing the data to be directly used to derive the long-term water quality criteria (LWQC) for ferric iron, but the chronic toxicity data were insufficient to directly derive the short-term water quality criteria (SWQC) for ferric iron [41], requiring calculation based on the LQWC and acute-to-chronic ratios (ACRs).

Table 1.
Data of ferric iron toxicity to aquatic organisms.
Table 1.
Data of ferric iron toxicity to aquatic organisms.
| Category | Latin Name | Genus | Endpoint | Toxicity Data of the Species (μg/L) | Toxicity Data of the Genera (μg/L) | Reference |
|---|---|---|---|---|---|---|
| Acute Toxicity | Asellus aquaticus | Asellus | EC50 | 124,000 | 124,000 | [42] |
| Ceriodaphnia dubia | Ceriodaphnia | LC50 | 36,700 | 33,200 | [43] | |
| Ceriodaphnia dubia | Ceriodaphnia | LC50 | 30,100 | [43] | ||
| Chironomus javanus | Chironomus | LC50 | 1650 | 1650 | [44] | |
| Daphnia magna | Daphnia | LC50 | 76,000 | 15,600 | [45] | |
| Daphnia magna | Daphnia | EC50 | 9600 | [46] | ||
| Daphnia magna | Daphnia | LC50 | 21,000 | [47] | ||
| Daphnia pulex | Daphnia | LC50 | 12,900 | [48] | ||
| Daphnia pulex | Daphnia | LC50 | 15,800 | [48] | ||
| Daphnia pulex | Daphnia | LC50 | 17,400 | [48] | ||
| Daphnia pulex | Daphnia | LC50 | 9000 | [49] | ||
| Daphnia pulex | Daphnia | LC50 | 2800 | [49] | ||
| Duttaphrynus melanostictus | Duttaphrynus | LC50 | 400 | 400 | [50] | |
| Gambusia affinis | Gambusia | LC50 | 133,000 | 99,200 | [51] | |
| Gambusia affinis | Gambusia | LC50 | 74,000 | [51] | ||
| Lepomis macrochirus | Lepomis | LC50 | 20,300 | 20,300 | [48] | |
| Melanoides tuberculata | Melanoides | LC50 | 8490 | 8490 | [50] | |
| Nais elinguis | Nais | LC50 | 123 | 123 | [50] | |
| Orconectes limosus | Orconectes | LC50 | 32,000 | 32,000 | [52] | |
| Physa gyrina | Physa | LC50 | 12,100 | 12,100 | [48] | |
| Pimephales promelas | Pimephales | LC50 | 21,800 | 21,800 | [48] | |
| Ptychocheilus oregonensis | Ptychocheilus | LC50 | 54,800 | 54,800 | [48] | |
| Salmo trutta | Salmo | LC50 | 28,000 | 36,300 | [53] | |
| Salmo trutta | Salmo | LC50 | 47,000 | [53] | ||
| Stenocypris major | Stenocypris | LC50 | 279 | 279 | [50] | |
| Tubifex tubifex | Tubifex | EC50 | 102,000 | 94,300 | [54] | |
| Tubifex tubifex | Tubifex | EC50 | 86,100 | [55] | ||
| Tubifex tubifex | Tubifex | EC50 | 95,400 | [55] | ||
| Tubifex tubifex | Tubifex | EC50 | 71,300 | [55] | ||
| Tubifex tubifex | Tubifex | EC50 | 125,000 | [55] | ||
| Xenopus laevis | Xenopus | EC50 | 1,000,000 | 1,000,000 | [56] | |
| Chronic Toxicity | Chlorella vulgaris | Chlorella | LOEC | 6000 | 4240 | [57] |
| Chlorella vulgaris | Chlorella | NOEC | 3000 | [57] | ||
| Daphnia pulex | Daphnia | LOEC | 1310 | 958 | [48] | |
| Daphnia pulex | Daphnia | LOEC | 1310 | [48] | ||
| Daphnia pulex | Daphnia | LOEC | 1310 | [48] | ||
| Daphnia pulex | Daphnia | MATC | 960 | [48] | ||
| Daphnia pulex | Daphnia | MATC | 960 | [48] | ||
| Daphnia pulex | Daphnia | MATC | 960 | [48] | ||
| Daphnia pulex | Daphnia | NOEC | 700 | [48] | ||
| Daphnia pulex | Daphnia | NOEC | 700 | [48] | ||
| Daphnia pulex | Daphnia | NOEC | 700 | [48] | ||
| Lecane quadridentata | Lecane | LOEC | 100 | 31.6 | [58] | |
| Lecane quadridentata | Lecane | NOEC | 10 | [58] | ||
| Pimephales promelas | Pimephales | LOEC | 1010 | 569 | [48] | |
| Pimephales promelas | Pimephales | MATC | 570 | [48] | ||
| Pimephales promelas | Pimephales | NOEC | 320 | [48] |
3.2. WQC Derivation
3.2.1. Criteria of the Assessment Factor (AF) Method
According to the derivation steps of the AF method, the acute toxicity value (ATV) and chronic toxicity value (CTV) of Fe3+ were calculated. From the acute toxicity data in Table 1, it can be seen that the most sensitive organism is Nymphobranchus elegans, from which we can derive an ATV of 123 μg/L. Moreover, the acute and chronic toxicity data of Flea-flycatchers and the black-headed soft-mouthed minnow were obtained under the same experimental conditions as this study. Therefore, the geometric mean of ACR was determined to be 24.7. Correspondingly, the WQC of Fe3+ was derived by dividing the ATV of Nymphobranchus elegans by the geometric mean of the ACR. The obtained WQC was 4.98 μg/L.
3.2.2. Results of the Toxicity Percentage Ranking Method
Based on the acute toxicity data of ferric iron in Table 1, the four genera with a p value close to 0.05 were Cynomolgus, Narrow star mesopotamus, Cephalopod toad, and Anopheles. From the formula of the TPR method, the acute toxicity value (ATV) of ferric iron was 222 μg/L, and therefore, the criteria maximum concentration (CMC) of Fe3+ was 111 μg/L. The chronic toxicity value (CTV) of ferric iron was transformed using the ACR and calculated to be 9.0 μg/L. Since no toxicity data of plants that met the requirements were collected, this study could not obtain the final plant chronic value (FPV) of ferric iron. Moreover, since the current food safety standard in China does not indicate an Fe3+ concentration value, the final residual value (FRV) could not be obtained either. In summary, the criteria continuous concentration (CCC) of ferric iron was 9.0 μg/L, and the CMC and CCC derived using the TPR method were 111 μg/L and 9.0 μg/L, respectively.
3.2.3. Results of the SSD Method
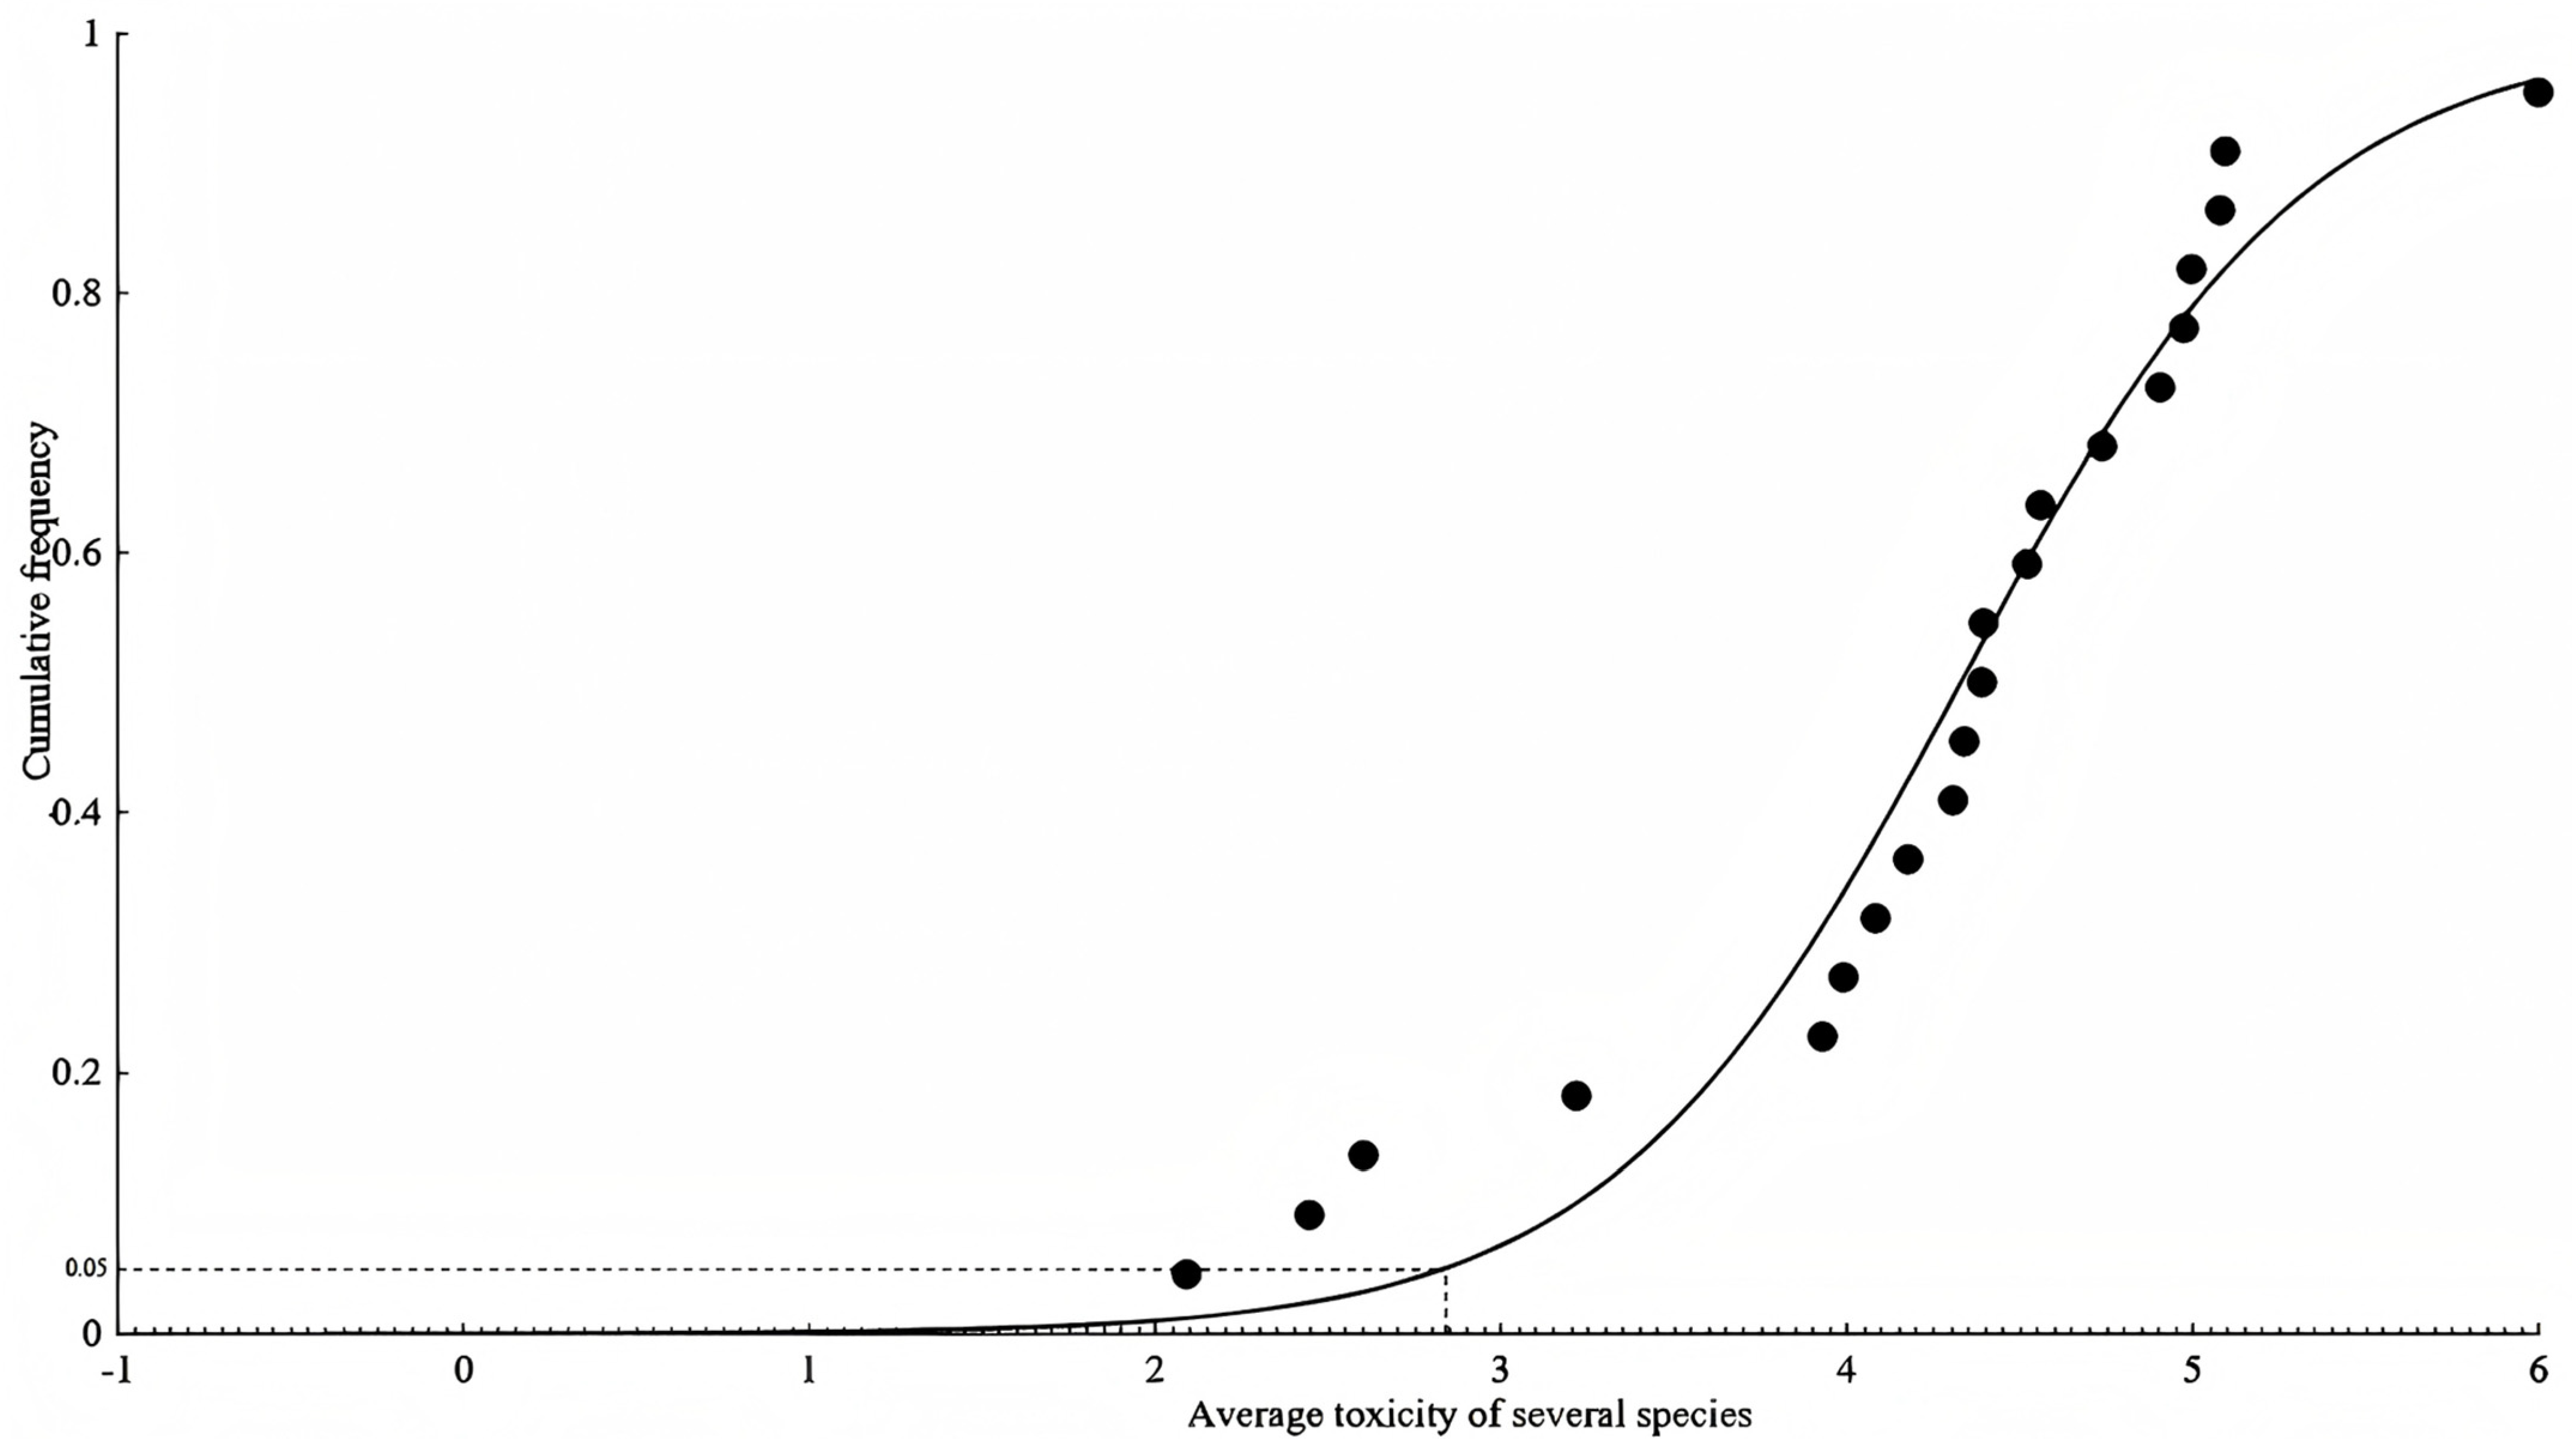
According to the derivation steps of the SSD method, the SSD model and curve were fitted to the obtained acute water quality criteria of ferric iron. After comparison, the logistic model, with the best goodness-of-fit, was selected as the final derivation model for the acute water quality criteria, as shown in Figure 1 and Table 2. The R2 of the fitted curve was 0.96, and the model derived a value of HC5 of 689 μg/L. With the assessment factor taken to be two, the acute water quality criterium of Fe3+ was deduced to be 345 μg/L. Since the amount of chronic toxicity data is insufficient to be used for model fitting, the chronic water quality of Fe3+ was derived by dividing HC5 by the acute-to-chronic ratio (ACR), yielding 27.9 μg/L.

Figure 1.
Logistic Steele model fitting based on species-averaged toxicity data using the SSD method.
Table 2.
LHC5, assessment factor, and LWQC.
3.2.4. Comparison of the WQCs from Three Methods
In this study, three methods were used to derive the WQC of Fe3+, and there were some differences among the WQCs obtained from each. Across the three methods, the WQC result from the assessment factor method (AF) was a single value that was relatively low. Using this value might cause “overprotection” for surface aquatic organisms. A single value is also controversial because of the lack of theoretical support from statistics and the high level of uncertainty. Therefore, the WQC derived from the assessment factor method (AF) lacks feasibility. The WQCs derived using the other two methods also have some differences and need to be further analyzed and compared.
Although both methods (TPR and SSD) use the toxicity data of all species, the CMC and LWQC calculated using the TPR method only depend on four generic toxicity values of the most sensitive genera, which means the WQC calculated from the TPR method cannot fully reflect the distribution pattern of all species. In contrast, the species sensitivity distribution (SSD) method fits the model using the toxicity data of all species, and the calculation results are more statistically significant. Based on the SSD, the SWQC and LWQC of Fe3+ were 345 μg/L and 27.9 μg/L, respectively.
3.3. Ecological Risk Assessment (ERA) of Fe3+ in the Regional Surface Water of China
Based on the derived LWQC and SWQC, this study aimed to conduct an ecological risk assessment (ERA) of Fe3+ in surface water across provinces in China. The collected Fe3+ exposure concentrations in surface water are shown in Table S1 of the Supplementary Materials, covering 30 provinces (there is a total of 34 provincial administrative regions in China; data from Hong Kong, Macao, Inner Mongolia, and Taiwan were not included). The exposure concentration data included the maximum value, minimum value, mean value, and standard deviation (SD). The QRs of the mean value within the standard deviation range of each data point were calculated according to the risk quotient method, and the derived risk quotient data were analyzed and evaluated, as shown in Table 3.
Table 3.
Analytical results of Fe3+ acute and chronic risk quotients (QRs) of exposure concentration in China. The QR index equals the reported measured environmental concentration (MEC) divided by our recommended interim predicted no-effect concentration (PNEC); the MEC refers to the selected Fe exposure concentration; and the PNEC was derived using the SWQC (345 μg/L) and LWQC (27.9 μg/L). ND indicates not detected. Risk class: low is QR < 0.1, medium is 0.1 < QR < 1, high is QR > 1; the proportion of each risk class is shown in parentheses.
According to Table 3, some risk quotients could not be calculated due to the exclusion of four data points resulting in the absence of a mean value; a total of 64 risk quotients were obtained, 31 of which were range data points regarding the standard deviation (SD). Each of the derived risk quotients included a chronic risk quotient from a comparison with the LWQC and an acute risk quotient from the SWQC, both deduced below. The range of acute QRs was from 0.0090 to 6.2, while chronic QRs ranged from 0.11 to 77.
For acute risk quotients, the mean value of QRs for 64 data points was 0.923, proving that the average Fe3+ concentration was qualified in the surface water of China. Specifically, the SQRs of 19 of 64 data points (30%) exceeded 1, indicating that these surface water systems have excessive levels of Fe3+, which can cause adverse impacts on aquatic organisms and human health in the short term. Water quality management is urgently needed in these areas of concern. In addition, the acute risk quotient data comprised 31 data points (48%) and 14 data points (22%), covering the ranges of 0.1–1 and 0.01–0.1, respectively. This indicates that the concentration of Fe3+ in these areas meets the requirements of the LWQC but also needs attention. For chronic risk quotients, the average LQRs was 11, which is far above the standard. In total, the values of 53 out of the 64 data points (83%) were greater than 1, which is much larger than the relative number of acute risk quotients. This indicates that the toxic effects caused by excessive Fe3+ concentration in surface water systems have an obvious time-cumulative effect and that aquatic organisms will exhibit a significant response under long-term impact in most surface water systems in China. Overall, the total concentration of Fe3+ and the derived WQC for surface water systems in China is severe; in nearly 30% of the surface water systems, this could cause toxic effects in the short term, while in over 80% of the surface water systems, it would cause harm in the long term.
3.4. Obvious Spatial Differences Existed in Fe3+ Content in China
In consideration of China’s nine major water systems’ general geographical classification, 68 pieces of data from 30 provinces were divided across eight basins (provinces from the Haihe River Basin and Huaihe River Basin had a high degree of overlap, so they were combined). The means of the acute and chronic risk quotients within each basin were calculated and compared; as shown in Table 4, the acute and chronic QRs exhibit highly positive correlations. The surface river from South China (Yangtze River Basin, Southeast Basin, and Pearl River Basin) and the continental area (Continental Basin) have an acute QRs below or close to 1 and a chronic QRs between 6 and 13, indicating relatively high water quality. In contrast, surface waters from North China (Yellow River Basin, Huaihe River Basin, and Songhua and Liaohe River Basin) show severe problems in water quality, with an average acute QRs higher than 2 and chronic QRs above 25. Differences in annual precipitation, river velocity, and agriculture and industry types between the north and south may cause the spatial contrast in Fe3+.
Table 4.
Proportions of Fe3+ acute and chronic risk quotients of exposure concentration in China.
In addition, Table 5 shows the QRs of different reaches in the Yangtze River. Notably, in the same river, lower reaches have an obviously higher toxic effect than upper and middle reaches, demonstrating that anthropogenic discharge could be highly blamed for Fe3+ pollution and the WQC.
Table 5.
Analysis of Fe3+ risk quotient in basins.
4. Discussion
4.1. Comparison and Contrast of the WQC and International Standard Limits
Many countries and non-government environmental organizations (NGEOs) at home and abroad have formulated corresponding standards for the water environment, stipulating the standard limit of iron (Fe) concentration in water bodies. The main stipulated limits are shown in Table 6. The US EPA’s current standard, the “National Recommended Water Quality Criteria”, stipulates the standard limit of aquatic pollutants, involving aquatic organisms’ thresholds, human health standards, and sensory effects. However, for the iron benchmark, only the iron benchmark continuous concentration value (CCC) for the protection of freshwater organisms was put forward as a clear provision. The specific limit value reference QUALITY CRITERIA FOR WATER (Gold Book) was promulgated in 1986. In addition, in the “QUALITY CRITERIA FOR WATER” issued by the U.S. Environmental Protection Agency (EPA) in 1976, the limits of iron in the aquatic environment were stipulated based on the protection of human health and aquatic organisms. In comparing the “GOLD BOOK”, revised in 1986, with the “GOLD BOOK” of 1976, no changes were made to the standard limits for iron. In the WHO’s drinking water standard, “Guidelines for Drinking-water Quality”, the limits for contaminant concentrations are derived from the tolerable daily intake of substances by humans, but the standard does not have a limit value for iron concentrations because the level of iron concentration in drinking water is not considered to have an impact on human health. The European Union’s Drinking Water Quality Directive (Drinking Water Directive) set iron concentration limits for the purpose of protecting human health. Canada, Germany, and France do not have limits for iron concentrations in surface water standards either.
Table 6.
Standard limits for iron according to different countries and organizations.
Similarly, China’s current Environmental Quality Standards for Surface Water, implemented in 2002, has been an essential tool for evaluating and assessing the environmental quality of surface water in China, playing an important role in China’s water environment management system. The Hygienic Standard for Drinking Water for Life was implemented in 2007; the water quality standards of many countries or organizations in the world were referenced and revised, while also considering the actual situation in China. In comparison with the standards of other countries, China’s Hygienic Standard for Drinking Water for Domestic Use takes into account the differences between different water sources and meets the requirements of using water from different sources in various regions. However, as compared above, the iron concentration standard limit still needs strict supervision in China. China is still in the stage of continuously improving drinking water safety [67].
4.2. Work Limitations and Future Prospects
Although the reliability screening method of toxicity data and the criteria derivation method have been listed in guideline documents and existing studies at home and abroad, biological toxicity data may vary due to different screening principles, subsequently affecting the WQC results. Organisms in different regions may also have differences in drug tolerance. In the future, relevant species will be selected for experimentation to further verify the derived WQC.
Secondly, since most of the dissolved iron in freshwater bodies exists in the form of ferric iron, this study used exposure concentrations in the surface water of total dissolved iron instead of ferric iron, for which the method remains uncertain. There is little research on ferric iron or iron in various water systems in China; much of the literature does not contain the average iron exposure concentration, meaning that reliable analysis cannot be conducted. In various studies, the estimation of ferric iron concentration in freshwater may have been affected by water quality parameters such as pH, dissolved organic matter, and temperature at sampling points, and the current study was unable to quantitatively correct the effects of these factors, which may have resulted in erroneous results in the spatial discussion. At the same time, data on ferric concentration in surface water in the Huaihe River basin, Taiwan Province, and Inner Mongolia should be further collected to comprehensively evaluate the surface water quality.
In addition, the surface water environmental exposure data of iron have a time span of 15 years, which is time-sensitive, and the temporal fate and transfer of ferric iron cannot be analyzed. Future studies should combine environmental monitoring and hydrological monitoring toxicity risk assessment to comprehensively promote the development of surface water system studies.
4.3. Contribution to Science
Despite significant progress in deriving water quality benchmarks and conducting ERAs for various heavy metals, such as antimony (Sb) and cadmium (Cd), the collection of toxicity data of Fe3+ in aquatic environments remains limited. Moreover, studies have shown that in regions like Hunan and Guizhou in China, low iron concentrations in acid mine drainage-affected water bodies are associated with high mortality rates in aquatic organisms, which highlights the complexity of iron’s ecological impacts and the urgent necessity of deriving biological toxicity benchmarks.
This study systematically collected, screened, and organized aquatic toxicity data from ECOTOX, CNKI, and Web of Science (WOS). A total of 896 studies were collected from WOS with the following keyword searches: TS = iron AND toxicity AND water AND (biological effect OR risk assessment OR benchmarks OR criteria). In addition, 51 Chinese articles from CNKI were obtained. Among them, 47 data points met the requirements of benchmark derivation, in which screening elements included test species, endpoints, exposure time, and experimental methods. Thus, a foundational database was created for Fe3+ toxicity benchmarking. The application of the AF, TPR, and SSD methodologies and the derived LWQC and SWQC from the logistic model using the SSD method could serve as a reference for subsequent research. Moreover, this study contributed to ERAs by aggregating a comprehensive, credible dataset of Chinese Fe exposure concentrations, sourced from 49 articles and covering 30 provinces. With an innovated dual-criteria QRs approach based on the newly derived LWQC and SWQC, a more precise identification of both acute and chronic Fe risks could be conducted, which is often overlooked in studies employing conventional single-threshold methods. The spatial distribution analysis of iron QRs informed the development of targeted regional management and remediation strategies, supporting constructive water quality management and policy decisions.
5. Conclusions
Based on the research gap in the derivation of benchmarks for Fe3+ in both Chinese and international studies, this study performed a comprehensive assessment of Fe3+ toxicity by compiling and screening 47 acute and chronic toxicity data points from 22 species, sourced from multiple literature sources in the ECOTOX, the China National Knowledge Infrastructure, and WOS. Utilizing established methodologies—the AF, TPR, and SSD methods—we derived the LWQC and SWQC for Fe3+. Notably, the SSD method, employing logistic fitting curves, was identified as the most appropriate for estimating the acute hazardous concentration for 5% of species (HC5), yielding a value of 689 μg/L. The derived SWQC was calculated to be 345 μg/L, reflecting a robust short-term guideline for Fe3+. In the absence of sufficient chronic toxicity data, the LWQC was estimated by adjusting the acute HC5 with an acute-to-chronic ratio (ACR), yielding an LWQC of 27.9 μg/L. However, there was a limitation in that the quoted Fe toxicity data included innoxious colloidal FeOOH, resulting in relevantly higher benchmark results.
Subsequent ERA conducted on 68 Fe3+ exposure data points across 30 provinces and eight river basins of China demonstrated that approximately 30% of acute risk quotients (SQRs) and 83% of LQRs exceeded 1, indicating substantial ecological concerns. High-risk values were particularly prevalent in the Yellow River Basin, Huaihe River Basin, and the Songhua and Liaohe River Basins, with the lower reaches exhibiting higher QRs than the upper and middle reaches, thus substantiating that anthropogenic discharge is a credible contributor for Fe3+. These findings underscore the urgent necessity for region-specific management strategies to address Fe3+ contamination and the critical importance of developing and applying accurate benchmarks for effective water quality management.
This study represents a critical step toward filling the existing gap regarding Fe3+ toxicity and its environmental impacts, particularly in China. The benchmarks derived from this research can provide a foundational dataset for future regulatory standards and the remediation of iron contamination in surface waters. Moreover, it highlights the importance of further toxicity data collection, particularly chronic exposure studies, to refine water quality criteria and support informed decision making in water quality management and ecosystem protection.
Supplementary Materials
The following supporting information can be downloaded at https://www.mdpi.com/article/10.3390/toxics13060475/s1, Table S1: Ecological risk assessment quantified using the risk quotient approach based on Fe exposure concentrations in China. References [15,47,49,68,69,70,71,72,73,74,75,76,77,78,79,80,81,82,83,84,85,86,87,88,89,90,91,92,93,94,95,96,97,98,99,100,101,102,103,104,105,106,107,108,109,110,111,112,113] are cited in the supplementary materials.
Author Contributions
Conceptualization, F.G.; methodology, Q.G.; software, Q.G.; validation, Q.G.; formal analysis, Q.G.; investigation, Q.G.; resources, Q.G.; data curation, Q.G.; writing—original draft preparation, Q.G.; writing—review and editing, Q.G.; visualization, Q.G.; supervision, F.G.; project administration, F.G.; and funding acquisition, F.G. All authors have read and agreed to the published version of the manuscript.
Funding
This research received no external funding.
Institutional Review Board Statement
Not applicable.
Informed Consent Statement
Not applicable.
Data Availability Statement
The original data presented in the study are openly available in the [Ecotoxicology Database (ECOTOX)] or the [China National Knowledge Infrastructure] or the [Web of Science (WOS) Database].
Acknowledgments
The authors have reviewed and edited the output and take full responsibility for the content of this publication.
Conflicts of Interest
The authors declare no conflicts of interest.
References
- Li, Z.; Li, W.; Lei, J.; Li, Q.; Liu, L.; Zhou, L. Effect and hazard of common metal elements on human body. Mater. China 2020, 39, 934–944. [Google Scholar]
- Han, Y.X.; Zhang, X.L.; Gao, P.; Li, J.Y.; Sun, Y.S. Development and Prospect of Iron Ore Processing Technologies in China. Met. Mine 2024, 2, 1–24. [Google Scholar]
- Shi, X.L.; Qin, B.Q. Grain-size Characteristics and their environemental significance of Wanghu Lake sediments in the Middle Reaches of Yangtze River. Mar. Geol. Quat. Geol. 2009, 29, 117–122. [Google Scholar]
- Liu, S.Y.; Zheng, C.; Yuan, Q.; Wang, X.-B.; Wang, Z.-Y. Analysis on the variation characteristics of iron and manganese concentration and its genesis in Changtan Reservoir in Taizhou, Zhejiang Province. Environ. Sci. 2014, 35, 3702–3708. [Google Scholar]
- Yan, X.L.; Sun, C.; Hu, Y.; Zhong, J. Effect of reclamation on soil heavy metal content of coastal wetland and ecological risk assessment in Northern Liaodong Bay, China. Acta Ecol. Sin. 2020, 41, 1055–1067. [Google Scholar]
- GB 3838-2002; Environmental Quality Standards for Surface Water. Ministry of Ecology and Environment the People’s Republic of China & Ministry of Ecology and Environment the People’s Republic of China: Beijing, China, 2002.
- GB 5749-2022; Standards for Drinking Water Quality. State Administration for Market Regulation, China and Standardization Administration, China: Beijing, China, 2022.
- Yang, S.Y.; Zhao, J.; Yu, H.-Z.; Peng, L.; Xiao, L.-J. Vertical Distribution Characteristics of Fe and Mn in Subtropical Reservoirs During Summer. Environ. Sci. 2017, 38, 4546–4552. [Google Scholar]
- Hong, Y.J.; Feng, C.; Xv, Z.; Liao, W.; Yan, Z.; Liu, D.; Fu, Z. Advance on ecotoxicity effects of heavy metals to aquatic organisms and the mechanisms. Environ. Eng. 2019, 37, 1–9. [Google Scholar]
- Jiang, W.X.; Jia, X.; Tang, T.; Cai, Q. Response of macroinvertebrate functional feeding groups to acid mine drainage in the Gaolan River. Acta Ecol. Sin. 2016, 36, 5670–5681. [Google Scholar]
- Chen, B.; Lv, L.X.; Wang, Z.Y.; Zhong, Y.H.; Wu, M.G.; Hu, X.S.; Xiao, Y.Z. Assessment of the potential ecological risk of heavy metals in the surface sediments and biological accumulation in Pearl River Estuary. Period. Ocean Univ. China 2021, 51, 73–82. [Google Scholar]
- Wang, G.S.; Chai, M.W.; Luan, S.J. A comparative study of heavy metal accumulation characteristics in typical mangrove wetlands of Shenzhen, China. Ecol. Environ. Sci. 2017, 26, 862–870. [Google Scholar]
- Risk Assessment Forum; US EPA: Washington, DC, USA, 2024. Available online: https://www.epa.gov/scientific-leadership/risk-assessment-current-projects (accessed on 16 February 2025).
- EPA 810-R-11-01; A Primer on Using Biological Assessment to Support Water Quality Management. US EPA: Washington, DC, USA, 2011.
- Zhao, C.H.; Shen, H.; Zhao, Y.; Wang, Z.; Tang, C.; Xie, H. Distribution characteristics and health risk assessment of metal elements in surface water of Fenhe River Basin. Environ. Chem. 2024, 43, 549–560. [Google Scholar]
- Kong, X.Z.; He, W.; Qin, N.; He, Q. Assessing acute ecological risks of heavy metals to freshwater organisms by species sensitivity distributions. China Environ. Sci. 2011, 31, 1555–1562. [Google Scholar]
- Li, H.X.; Zhang, R.; Guo, G.; Feng, C.; Shi, D.; Wang, H. Water quality criteria and ecological risk assessment of manganese in flesh water environment in China. Asian J. Ecotoxicol. 2023, 18, 195–206. [Google Scholar]
- Saili, K.S.; Cardwell, A.S.; Stubblefield, W.A. Stubblefield, Chronic Toxicity of Cobalt to Marine Organisms: Application of a Species Sensitivity Distribution Approach to Develop International Water Quality Standards. Environ. Toxicol. Chem. 2021, 40, 1405–1418. [Google Scholar] [CrossRef]
- Cardwell, A.S.; Adams, W.J.; Gensemer, R.W.; Nordheim, E.; Santore, R.C.; Ryan, A.C.; Stubblefield, W.A. Chronic toxicity of aluminum, at a pH of 6, to freshwater organisms: Empirical data for the development of international regulatory standards/criteria. Environ. Toxicol. Chem. 2018, 37, 36–48. [Google Scholar] [CrossRef]
- Cardwell, A.S.; Rodriguez, P.H.; Stubblefield, W.A.; DeForest, D.K.; Adams, W.J. Chronic Toxicity of Iron to Aquatic Organisms under Variable pH, Hardness, and Dissolved Organic Carbon Conditions. Environ. Toxicol. Chem. 2023, 42, 1371–1385. [Google Scholar] [CrossRef]
- Gensemer, R.W.; Gondek, J.C.; Rodriquez, P.H.; Arbildua, J.J.; Stubblefield, W.A.; Cardwell, A.S.; Santore, R.C.; Ryan, A.C.; Adams, W.J.; Nordheim, E. Evaluating the effects of pH, hardness, and dissolved organic carbon on the toxicity of aluminum to freshwater aquatic organisms under circumneutral conditions. Environ. Toxicol. Chem. 2018, 37, 49–60. [Google Scholar] [CrossRef]
- Cornell, R.M.; Schwertmann, U. The Iron Oxides: Structure, Properties, Reactions, Occurences and Uses, 2nd ed.; Wiley: Hoboken, NJ, USA, 2004; ISBN 3527302743. [Google Scholar]
- Lintnerová, O.; Sottník, P.; Soltés, S. Dissolved matter and suspended solids in the Smolnik Creek polluted by acid mine drainage (Slovakia). Geol. Carpathica 2006, 57, 311–324. [Google Scholar]
- Obiakor, M.O.; Tighe, M.; Wang, Z.; Ezeonyejiaku, C.D.; Pereg, L.; Wilson, S.C. The relative sensitivity of freshwater species to antimony(III): Implications for water quality guidelines and ecological risk assessments. Environ. Sci. Pollut. Res. 2017, 24, 25276–25290. [Google Scholar] [CrossRef]
- US EPA. Ecotoxicology Database. Available online: https://cfpub.epa.gov/ecotox/ (accessed on 16 February 2025).
- Yang, H.C.M.C.L.; Li, Y.Y.; Zhou, Y.S.; Wang, Y.L.; Guo, J. Native species sensitivity distribution and water quality criteria for imidacloprid. J. Lake Sci. 2024, 36, 177–186. [Google Scholar]
- HJ 831-2017; Technical Guideline for Deriving Water Quality Criteria for Freshwater Organisms. Ministry of Ecology and Environment, China: Beijing, China, 2017.
- Li, X.Y. Methodology and Case Study for Developing Water Quality Standards for Protection of Aquatic Ecosystems. Master’s Thesis, Tianjin University of Science and Technology, Tianjin, China, 2015. [Google Scholar]
- Lin, Y.; Gao, J.M.; Guo, J.S.; Hou, X.Y.; Zhang, L.; Wu, J.C. Long-term water quality criteria derivation of typical antibiotics based on species sensitivity distribution and its application to ecological risk assessment. Acta Sci. Circumstantiae 2023, 43, 503–515. [Google Scholar]
- Guidelines for Deriving Numerical National Water Quality Criteria for the Protection of Aquatic Organisms and Their Uses; US EPA: Washington, DC, USA, 2024.
- Wang, H.; Sui, F.; Gao, C.; Qin, L.; Zhao, L.; Song, X.; Ru, S.; Wang, J. Seawater quality criteria derivation and ecological risk assessment for atrazinc in Laizhou Bay. Period. Ocean Univ. China 2024, 54, 78–87. [Google Scholar]
- Canadian Council of Ministers of the Environment. Protocol for the Derivation of Water Wuality Guidelines for the Protection of Aquatic Life; Canadian Council of Ministers of the Environment: Winnipeg, MB, Canada, 1999. [Google Scholar]
- Wang, X.L. Study on the Aquatic Organism Criteria for the Key Pesticide in the Yangtze River Delta Region. Master’s Thesis, Nanjing University of Information Science and Technology, Nanjing, China, 2013. [Google Scholar]
- Li, Q.; Qinglin, L.; Mengshuo, L.; Li, W. Literature research on freshwater aquatic life water quality criteria for antibiotic in China. Asian J. Ecotoxicol. 2024, 19, 222–236. [Google Scholar]
- Wu, F.C.; Meng, W.; Cao, Y.; Li, H.; Zhang, R.; Feng, C.; Yan, Z. Derivation of Aquatic Life Water Quality Criteria for Cadmium in Freshwater in China. Res. Environ. Sci. 2011, 24, 172–184. [Google Scholar]
- Si, J.Y.; Hong, Y.; Xia, P.; Bai, Y.; Feng, C. Water Quality Criteria/Standards and Ecological Risk Assessment of Oxytetracycline for Freshwater Organisms in China. Res. Environ. Sci. 2023, 36, 403–413. [Google Scholar]
- Wheeler, J.R.; Grist, E.; Leung, K.; Morritt, D.; Crane, M. Species sensitivity distributions: Data and model choice. Mar. Pollut. Bull. 2002, 45, 192–202. [Google Scholar] [CrossRef]
- Mi, Y.D.; Zhou, L.; Feng, C.; Su, H.; Chen, Y.; Liang, W.; Xu, Z.; Wu, F. Toxicity effect, water quality criteria and standards of fluoride: Progress and prospects. Asian J. Ecotoxicol. 2024, 19, 148–164. [Google Scholar]
- Brain, R.A.; Sanderson, H.; Sibley, P.K.; Solomon, K.R. Probabilistic ecological hazard assessment: Evaluating pharmaceutical effects on aquatic higher plants as an example. Ecotoxicol. Environ. Saf. 2006, 64, 128–135. [Google Scholar] [CrossRef]
- Li, D.W.; Yao, W.; Zhang, S.; Pan, H.; Lin, L.; Wu, X. Ecological risk assessment of microplastics in typical freshwater waters in China based on method of risk quotient. Asian J. Ecotoxicol. 2022, 17, 425–434. [Google Scholar]
- Li, Y.S.; Wu, F.; Cui, X.; Zhang, R.; Guo, G.; Li, H.; Feng, C.; Du, D. Freshwater quality criteria for benzene in China. Chin. J. Ecol. 2012, 31, 908–915. [Google Scholar]
- Martin, T.; Holdich, D. The Acute Lethal Toxicity of Heavy-Metals to Peracarid Crustaceans (with Particular Reference to Fresh-Water Asellids and Gammarids). Water Res. 1986, 20, 1137–1147. [Google Scholar] [CrossRef]
- Fort, D.J.; Stover, E.L. Impact of toxicities and potential interactions of flocculants and coagulant aids on whole effluent toxicity testing. Water Environ. Res. 1995, 67, 921–925. [Google Scholar] [CrossRef]
- Shuhaimi-Othman, M.; Yakub, N.; Ramle, N.-A.; Abas, A. Toxicity of Metals to a Freshwater Ostracod: Stenocypris major. J. Toxicol. 2011, 2011, 136104. [Google Scholar] [CrossRef] [PubMed]
- Biesinger, K.E.; Christensen, G.M. Effects of Various Metals on Survival, Growth, Reproduction, and Metabolism of Daphnia-Magna. J. Fish. Res. Board Can. 1972, 29, 1691–1700. [Google Scholar] [CrossRef]
- Dowden, B.F.; Bennett, H.J. Toxicity of Selected Chemicals to Certain Animals. J. Water Pollut. Control Fed. 1965, 37, 1308–1316. [Google Scholar]
- Li, G.L.; Zhang, Y.; Wang, Y.; Jiang, X.-Y.; Li, H.-B.; Zhang, J.-M.; Chen, X.; Xie, F.-Z. Enrichment characteristics, risk evaluation, and source apportionment of heavy metals in Wabu Lake of Yangtze River Water Diversion Project. Environ. Sci. 2024, 45, 7111–7122. [Google Scholar]
- Birge, W.J.; Black, J.A.; Westerman, A.G.; Short, T.M.; Taylor, S.B.; Bruser, D.M.; Wallingford, E.D. Recommendations on Numerical Values for Regulating Iron and Chloride Concentrations for the Purpose of Protecting Warmwater Species of Aquatic Life in the Commonwealth of Kentucky Source; Kentucky Natural Resources and Environmental Protection Cabinet: Frankfort, KY, USA, 1985.
- Shu, Z.C.; Cheng, C. Distribution characteristics and pollution evaluation of heavy metals in Fuyang Section of Huaihe River. J. Green Sci. Technol. 2023, 25, 157–160. [Google Scholar]
- Shuhaimi-Othman, M.; Nadzifah, Y.; Umirah, N.; Ahmad, A. Toxicity of metals to tadpoles of the common Sunda toad, Duttaphrynus melanostictus. Toxicol. Environ. Chem. 2012, 94, 364–376. [Google Scholar] [CrossRef]
- Wallen, I.E.; Greer, W.C.; Lasater, R. Toxicity to Gambusia-Affinis of Certain Pure Chemicals in Turbid Waters. Sew. Ind. Wastes 1957, 29, 695–711. [Google Scholar]
- Boutet, C.; Chaisemartin, C. Specific toxic properties of metal salts of Austro-potamobius pallipes pallipes and Orconectes limosus. C. R. Seances Soc. Biol. Fil. 1973, 167, 1933–1938. [Google Scholar]
- Dalzell, D.J.B.; Macfarlane, N.A.A. The toxicity of iron to brown trout and effects on the gills: A comparison of two grades of iron sulphate. J. Fish Biol. 1999, 55, 301–315. [Google Scholar] [CrossRef]
- Khangarot, B.S. Toxicity of metals to a freshwater tubificid worm, Tubifex tubifex (Muller). Bull. Environ. Contam. Toxicol. 1991, 46, 906–912. [Google Scholar] [CrossRef] [PubMed]
- Rathore, R.S.; Khangarot, B.S. Effects of temperature on the sensitivity of sludge worm Tubifex tubifex Muller to selected heavy metals. Ecotoxicol. Environ. Saf. 2002, 53, 27–36. [Google Scholar] [CrossRef] [PubMed]
- Nations, S.; Wages, M.; Cañas, J.E.; Maul, J.; Theodorakis, C.; Cobb, G.P. Acute effects of Fe2O3, TiO2, ZnO and CuO nanomaterials on Xenopus laevis. Chemosphere 2011, 83, 1053–1061. [Google Scholar] [CrossRef] [PubMed]
- Dejong, L.E.D. Tolerance of Chlorella Vulgaris for Metallic and Non-Metallic Ions. Antonie Van Leeuwenhoek J. Microbiol. Serol. 1965, 31, 301–313. [Google Scholar]
- Guzmán, F.T.; González, F.J.A.; Martínez, R.R. Implementing Lecane quadridentata acute toxicity tests to assess the toxic effects of selected metals (Al, Fe and Zn). Ecotoxicol. Environ. Saf. 2010, 73, 287–295. [Google Scholar] [CrossRef]
- National Recommended Water Quality Criteria (Section 304(a)); US EPA: Washington, DC, USA, 2009.
- EPA 440-9-76-023; Quality Criteria for Water 1976. US EPA: Washington, DC, USA, 1976.
- EPA 440/5-86-001; Quality Criteria for Water. US EPA: Washington, DC, USA, 1986.
- Guidelines for Drinking-Water Quality: Fourth Edition Incorporating the First and Second Addenda; World Health Organization: Geneva, Switzerland, 2022; ISBN 978-92-4-004506-4.
- EUR-Lex, Directive 98/83/EC. Drinking Water Directive; Official Journal of the European Union: Luxembourg, 2020. [Google Scholar]
- Canada, H.C.S. Guidelines for Canadian Drinking Water Quality-Summary Tables; Water and Air Quality Bureau, Healthy Environments and Consumer Safety Branch, Health Canada: Ottawa, ON, Canada, 2025.
- Drinking Water Ordinance of 20 June 2023; Federal Ministry of Justice and the Federal Office of Justice, Federal Law Gazette, Germany: Bonn, Germany, 2023.
- Drinking Water Standards; Diplomatie, France, French Water Partnership: Paris, France, 2020.
- Peng, H.X.; Li, C. Comparative study of drinking water quality standards among China, the United States and Japan. China Water Wastewater 2018, 34, 24–31. [Google Scholar]
- Ren, L.J.; Zhang, Y.; Zhang, X.; Shan, Z.; Zhang, C. Pollution characteristics and health risk assessment of heavy metals in surface water in Guanzhong Section of the Weihe River Basin. Ecol. Environ. Sci. 2022, 31, 131–141. [Google Scholar]
- Guo, Y.K.; Gao, Y.; Qian, H.; Tang, S.; Wang, H.; Shi, X. Spatial and temporal distribution characteristics and health risk assessment of heavy metals in the Chu River basin. Environ. Eng. 2023, 41, 112–119. [Google Scholar]
- Wu, B.; Zhao, D.Y.; Jia, H.Y.; Zhang, Y.; Zhang, X.X.; Cheng, S.P. Preliminary risk assessment of trace metal pollution in surface water from Yangtze River in Nanjing Section, China. Bull. Environ. Contam. Toxicol. 2009, 82, 405–409. [Google Scholar] [CrossRef]
- Chen, Y.F.; Guo, J.; Guo, S.; Chen, J.; Li, T.; Ma, S.; Chen, H. Pollution assessment and source analysis of heavy metals in the Wunan River, Changzhou. Acta Sci. Circumstantiae 2024, 44, 157–166. [Google Scholar]
- Wang, C.X.; Huang, J.; Yang, Z.W. Study on dynamic change feature of heavy metals in Zhenjiang Section of Yangtze River and their effects on health risks of residents. Environ. Prot. Technol. 2022, 28, 22–27. [Google Scholar]
- Si, W.; Xu, J.; Liu, G.; He, M.; Wu, H.; Wang, G.; Li, Y. Distribution characteristics and risk assessment of dissolved metal (loid)s in typical river basin of Hozhou City. Acta Sci. Circumstantiae 2024, 44, 181–192. [Google Scholar]
- Liu, Y.B.; Xu, Y.; Zhang, H.; Yang, H. Assessment of heavy metal pollution and health risks in a main river in Huayuan County, Xiangxi, Hunan Province. Chin. J. Appl. Environ. Biol. 2018, 24, 602–608. [Google Scholar]
- Ma, Y.Q.; Shi, Y.; Qin, Y.W.; Zheng, B.H.; Zhao, Y.M.; Zhang, L. Temporal-spatial distribution and pollution assessment of heavy metals in the Upper Reaches of Hunhe River (Qingyang Section), northeast China. Environ. Sci. 2014, 35, 108–116. [Google Scholar]
- Yu, C.C.; Zhao, W.T.; Gao, X.F.; Cheng, S.G.; Xie, D.; Ma, P.T. Distribution characteristics and health risks assessment of metals in drinking water sources from the Luhun Reservior. Environ. Sci. 2018, 39, 89–98. [Google Scholar]
- Li, S.Y.; Xu, Z.; Cheng, X.; Zhang, Q. Dissolved trace elements and heavy metals in the Danjiangkou Reservoir, China. Environ. Geol. 2008, 55, 977–983. [Google Scholar] [CrossRef]
- Mi, W.J.; Song, G.; Zhang, Y.; Zhu, Y.; Bi, Y. Contents and risk assessment of heavy metals in water environment of Lushui Reservoir. Environ. Sci. Technol. 2023, 46, 9–16. [Google Scholar]
- Liu, Z.T.; Li, C.H.; Zhang, G.Y. Application of principal component analysis to the distributions of heavy metals in the water of lakes and reservoirs in Yunnan Province. Res. Environ. Sci. 2010, 23, 459–466. [Google Scholar]
- Tu, C.L.; Cun, D.; Tao, L.; Chen, C.; Zou, Z.; He, C.; Pang, L. Distribution and health risk assessment of heavy metals in Xiaohuangni River Basin on Yunnan-Guizhou Plateau. Environ. Chem. 2023, 42, 4238–4252. [Google Scholar]
- Zhang, Y.J.; Deng, M.; Huang, X.-R.; Yao, J.; Li, Y.-Y.; Liu, R. Health risk assessment of metals form drinking water sources in Chongqing Ecological Protection Area. Adm. Tech. Environ. Monit. 2017, 29, 32–36. [Google Scholar]
- He, S.J.; Zhao, R.-Y.; Li, Z.-T.; Huang, S.-Q.; Lai, X.-H. Health Risk Assessment and Source Analysis of Heavy Metal Pollution in the Liangtan River Basin, Chongqing City. J. Hydroecol. 2023, 44, 115–123. [Google Scholar]
- He, Y.; Hong, X.; Bi, X.Y. Characteristic and sources of heavy metal pollution in water environment of Jiuzhou River basin. Environ. Chem. 2021, 40, 240–253. [Google Scholar]
- Zhang, Q.H.; Wei, Y.Z.; Cao, J.H.; Yu, S. Heavy metal pollution of the drinking water sources in the Liujiang River Basin, and related health risk assessments. Environ. Sci. 2018, 39, 1598–1607. [Google Scholar]
- Zhang, M.; Zhu, G.-Y.; Hua, G.-C.; Shi, W.-J. Spatial distribution characteristics and health risk assessment of heavy metals in Yamdrok Lake, Tibet. Water Resour. Hydropower Northeast China 2024, 3, 23–28. [Google Scholar]
- Lü, L.L.; Li, Z.X.; Huang, Y.; Cui, C. Distribution characteristics and risk assessment of heavy metals in Niyang River, Tibet. Trans. Chin. Soc. Agric. Eng. 2019, 35, 193–199. [Google Scholar]
- Qin, H.H.; Gao, B.; Huang, B.-X.; Zhang, S.-Q.; Dong, L.; Sun, Z.-X. Distribution characteristics and pollution risk assessment of heavy metals in Lhasa River Basin. Nonferrous Met. (Extr. Metall.) 2020, 10, 79–86. [Google Scholar]
- Wang, Z.G.; Zhan, H.M.; Xu, L.G.; Guo, H.K.; Li, J.L. Distribution of heavy metal and human health risk assessment of water bodies in the Basin of Poyang Lake into the Yangtze River. Resour. Environ. Yangtze Basin 2023, 32, 1281–1290. [Google Scholar]
- Chen, J.H. Study on Pollution Characteristics and Health Risk of Heavy Metals in Nanchang Section of the Fuhe River, in Hydraulic Engineering. Master’s Thesis, East China University of Technology, Shanghai, China, 2021. [Google Scholar]
- Zhao, Q.L.; Li, J.; Dong, Y.; Ao, Y.; Zhu, S.; Zhang, X.; Sun, Z. Pollution characteristics and human health risk assessment of heavy metals in water bodies around Poyang Lake. Nonferrous Met. Eng. 2024, 14, 194–206. [Google Scholar]
- Ge, Q.; Gao, B.; Lin, C.Y. Sources of heavy metals and related health risk of surfae water in Xinjiang River Basin. Sci. Technol. Eng. 2023, 23, 4984–4994. [Google Scholar]
- Zhang, Y.H.; Tang, Y.H.; Chen, J.H.; Sun, K.X.; Wu, J.X.; Liu, B. Pollution characteristics and health risk assessment of heavy metals in surface water of Pingshui River. Nonferrous Met. (Extr. Metall.) 2021, 7, 116–125. [Google Scholar]
- Zhao, Z.F.; Shi, W.; Qiu, X.C.; Ouyang, H.; Wang, S.Q.; Sun, X.Y.; Li, S.L. Distribution characteristics and health risk assessment of five heavy metals in the w of Qingshuihe River Basin. Adm. Tech. Environ. Monit. 2021, 33, 35–40. [Google Scholar]
- Pu, Y.L. Heavy Metal Contamination Pollution Assessment and Source Analysis of Natural Water Sediments in Shanghai, in Environmental Science. Master’s Thesis, Shanghai Normal University, Shanghai, China, 2018. [Google Scholar]
- Shi, X.S. The Time and Space Distribution and Geochemical Characteristics of Heavy Metals in Haihe River Trunk Stream Water, in Environmental Science. Master’s Thesis, Tianjin Normal University, Tianjin, China, 2014. [Google Scholar]
- Xin, C.L.; Ren, J.L.; Zhang, G.L.; Shao, Y.P.; Liu, S.M. Distributions and pollution status of heavy metals in the suspended particles of the Esyuaries and Coastal Area of Eastern Hainan. Environ. Sci. 2013, 34, 1315–1323. [Google Scholar]
- Wang, Q.; Mai, Z.Y.; Zhao, Y. Characteristics of heavy metal content and health risk Assessment in centralized drinking water sources in western Zhuhai. Shandong Chem. Ind. 2024, 53, 274–278. [Google Scholar] [CrossRef]
- Wang, R.S.; Xu, Q.J.; Zhang, X.; Wei, Q.S.; Yan, C.Z. Health risk assessment of heavy metals in typical township water sources in Dongjiang River Basin. Environ. Sci. 2012, 33, 3083–3088. [Google Scholar]
- Xie, W.P.; Chen, K.C.; Zhu, X.P.; Nie, X.P.; Zheng, G.M.; Pan, D.B.; Wang, S.B. Evaluation on heavy metal contents in water and fishes collected from the waterway in the Pearl River Delta, South China. J. Agro-Environ. Sci. 2010, 29, 1917–1923. [Google Scholar]
- Wang, H.H.; Sun, Y.; Zhang, S.; Xu, X.; Shang, C.; Li, C. Pollution characteristics and health risk assessment of heavy metals in drinking water source of Guiyang. Ecol. Environ. Sci. 2022, 31, 2039–2047. [Google Scholar]
- Guo, Y.Y.; Hua, J.H.; Zhu, Y.X.; Song, G.F.; Li, R.W.; Han, J.; Yang, L.H.; Zhou, B.S. Contents and risk assessment of heavy metals in surface water in the main canal of middle route of the South-to-North Water Diversion Project. Acta Ecol. Sin. 2022, 46, 995–1006. [Google Scholar]
- He, X.; Zhang, Y.J.; Lai, C.Y. Preliminary assessment on health risks of heavy metals in drinking water sources in Chengdu City. Water Resour. Dev. Manag. 2023, 6, 7–12. [Google Scholar]
- Zheng, Q.; Tang, C.M.; Liao, Y.M.; Quan, Q.M.; Li, Y.X. Preliminary assessment of health risk of heavy metals in urban drinking water source of Guangyuan City from 2012–2014. Sichuan Environ. 2020, 39, 172–178. [Google Scholar]
- Zhao, R.Y.; Huang, S.; Zhang, Q.; Liu, C.; Wang, Y.; Li, Z. Distribution characteristics of heavy metals and health risk assessment for Yingjing River. Ecol. Environ. Monit. Three Gorges 2021, 6, 24–31. [Google Scholar]
- Wu, J.W.; Zeng, Y.; Yang, Y.; Chen, Q. Environmental health risk assessment of heavy metals in drinking water source based on cloud model. J. Fuzhou Univ. (Nat. Sci. Ed.) 2014, 42, 327–332. [Google Scholar]
- Sun, Q.Z.; Zang, S.; Sun, L.; Li, M. Heavy metal pollution and its potential ecological risk assessment of Xianhe Lake. Chin. Agric. Sci. Bull. 2012, 28, 261–266. [Google Scholar]
- Liu, F.; Li, P.; Han, Z.; Zhaxi, G.; Zheng, Q.; Ni, Y.; Liu, S. Monitoring and health risk assessment of Heavy Metals in River of Spring City. Shandong Chem. Ind. 2017, 46, 176–178. [Google Scholar]
- Xu, M.J.; Yang, J.; Ren, X.J.; Zhao, H.Y.; Gao, F.Y.; Jiang, Y.J. Temporal-spatial distribution and health risk assessment of heavy metals in the surface water of Ningbo. Environ. Sci. 2023, 44, 1407–1415. [Google Scholar]
- Wang, L.; Wang, W.D.; Liu, D.; Li, G.; Yu, H.M.; Huang, S.; Xu, Y.Y. Risk assessment and source analysis of heavy metals in the river of a typical bay watershed. Environ. Sci. 2020, 41, 3194–3203. [Google Scholar]
- Zhang, G.Z.; Gao, G.H.; Wang, G.Z.; Wu, F.P.; Zhou, T.H. Water quality assessment and heavy metal health risk evaluation in Northwest Alpine Pastoral Area. China Water Wastewater 2023, 39, 42–48. [Google Scholar]
- Li, M.Y.; Xu, J.R.; Liu, Z.X.; Shi, Z.W. Characteristic analysis of trace heavy metal elements of Kunes River. Water Resour. Prot. 2009, 25, 44–48. [Google Scholar]
- Xu, X.Y.; Pu, X.; Liu, X.L. Tempo-spatial variations of dissolved organic carbon and heavy metals in Miyun Section of Chaobai River. J. Ecol. Rural Environ. 2020, 36, 1177–1184. [Google Scholar]
- Ye, D.Y. Water Environment Quality Status of Inlet Streams and Its Response to the Spatial Pattern of Land Use in the Watershed of Nansihu Lake, in Geography. Master’s Thesis, Qufu Normal University, Qufu, China, 2022. [Google Scholar]
Disclaimer/Publisher’s Note: The statements, opinions and data contained in all publications are solely those of the individual author(s) and contributor(s) and not of MDPI and/or the editor(s). MDPI and/or the editor(s) disclaim responsibility for any injury to people or property resulting from any ideas, methods, instructions or products referred to in the content. |
© 2025 by the authors. Licensee MDPI, Basel, Switzerland. This article is an open access article distributed under the terms and conditions of the Creative Commons Attribution (CC BY) license (https://creativecommons.org/licenses/by/4.0/).