Abstract
Air pollution exposure has been increasingly linked to adverse pregnancy outcomes. This study aimed to investigate the effects of PM2.5 exposure throughout pregnancy on preterm birth, low birth weight (LBW), and small for gestational age (SGA). We analyzed a cohort of 16,965 pregnant women living in northern Thailand between 2016 and 2022. PM2.5 concentration data were collected from two air quality monitoring stations operated by the Pollution Control Department (PCD) of Thailand. Logistic regression models were used to assess the association between daily PM2.5 exposure and pregnancy outcomes. PM2.5 exposure at levels exceeding 37.5 μg/m3 throughout pregnancy significantly increased the risk of preterm birth (aOR = 2.19, p < 0.001) and LBW (aOR = 1.99, p < 0.001) compared to the reference group (15.1–37.5 μg/m3). However, exposure at levels ≤15.0 μg/m3 also increased the risk for both outcomes compared to the same reference group. Subgroup analysis of high-risk pregnant women, including women aged > 35 years, with pre-pregnancy BMI (<18.5), pregnancy-induced hypertension, and nulliparous women, showed that the range of the critical PM2.5 exposure threshold was 32.3–38.4 μg/m3 for preterm birth and 31.2–38.2 μg/m3 for LBW. This study highlights the significant association between PM2.5 exposure and adverse pregnancy outcomes and suggests the need for targeted interventions to mitigate its effects on maternal and child health.
1. Introduction
Air pollution is a global health issue, particularly fine particulate matter with a diameter of 2.5 microns or less, known as PM2.5. Pregnant women are particularly vulnerable to PM2.5 exposure, which is linked to maternal inflammation [1], increased risks of preterm birth [2], and low birth weight [3]. PM2.5 can also affect feto-placental hemodynamics, potentially increasing umbilical arterial resistance [4]. It also contributes to adverse pregnancy outcomes, such as increased risk of fetal mortality and placental damage, through oxidative stress and mitochondrial apoptosis in trophoblasts [5].
One of the most concerning effects of PM2.5 exposure during pregnancy is the increased risk of premature birth, which means preterm delivery before 37 weeks [6]. Importantly, preterm delivery is a major factor associated with infant morbidity and mortality in the perinatal period and throughout the life course. Preterm infants have a high risk of developing complications such as respiratory problems, infections, and delayed development [7,8]. Several studies have shown a relationship between higher PM2.5 concentrations and increased preterm birth rates [2,9,10]. For example, a study in China found that an increase in PM2.5 per 10 µg/m3 is associated with an increase of 4% in the risk of preterm birth [11].
There is also evidence suggesting that exposure to high PM2.5 concentrations during pregnancy may increase the risk of low birth weight (LBW), defined as birth weight below 2500 g [12]. Additionally, PM2.5 exposure during pregnancy has been linked to small for gestational age (SGA) which is defined as birth weight below the 10th percentile for gestational age and sex. As reported, preterm birth, LBW, and SGA infants are at high risk of developing complications during childbirth and both short- and long-term adverse health outcomes, including metabolic disorders, in adulthood [3,13,14,15]. Evidence suggests that PM2.5 disrupts placental function and nutrient transport, which affects fetal growth [16], but the mechanism is not clearly understood.
Although numerous studies have demonstrated a relationship between PM2.5 exposure and adverse pregnancy outcomes, studies remain limited in Southeast Asia, and none of these studies have been conducted in the Thai population. PM2.5 pollution in Southeast Asia is characterized by seasonal biomass burning, industrial emissions, and transboundary haze. Studies in Indonesia and Vietnam have linked this pollution to adverse pregnancy outcomes, with exposure patterns that differ from those in Western populations [17,18].
Given that the differences in composition and magnitude of air pollution and the varying susceptibility to environmental stressors in different populations, it is crucial to investigate the potential health risks within a given local/regional context. Chiang Mai exhibits a unique pattern of PM2.5 sources influenced by agricultural practices and geographic factors. During the dry season, the primary sources of PM2.5 is the burning of local crop residue and transboundary pollution from the Thai–Myanmar border. In contrast, during the wet season, local traffic emissions become the dominant source of PM2.5 [19,20]. This particular seasonal variation underscores the importance of region-specific studies to better understand the impact of PM2.5 exposure in this population.
Therefore, the primary objective of our study was to examine the relationships between PM2.5 concentrations and the likelihood of adverse pregnancy outcomes, namely preterm birth, LBW, and SGA, among Thai pregnant women. Also, we aimed to identify the period during pregnancy that is most sensitive to the potential harmful effects of PM2.5 and to explore potential interactions between PM2.5 exposure and other risk factors.
Although the WHO guidelines have established that PM2.5 concentrations exceeding 37.6 μg/m3 daily and 15.1 μg/m3 annual [21,22] are associated with increased mortality risk in the general population, the threshold at which PM2.5 exposure begins to affect pregnancy outcomes remains unknown. Therefore, another objective of our study was to identify the critical threshold level of PM2.5 exposure at which adverse effects on pregnancy outcomes begin to occur. This is intended to contribute essential evidence for the formulation of air quality control guidelines, with particular emphasis on protecting pregnant women.
Consequently, the study of the relationship between PM2.5 and pregnancy outcomes are of paramount importance, both in terms of public health and medical research. These results will enhance our understanding of the effects of air pollution on the health of pregnant women and infants and lead to the development of more effective policies and preventive measures. Ultimately, this will improve the overall quality of life for the population.
2. Materials and Methods
2.1. Ethics Approval
All procedures for this study were reviewed and approved by the Institutional Review Boards of both hospitals (Maharaj Nakorn Chiang Mai Hospital: SUR-2566-0534; Regional Health Promotion Center1 Hospital Chiang Mai: 34/2567) on 6 November 2023. The requirement for written informed consent was waived by the ethics committees due to the study’s retrospective design.
2.2. Study Design
This study was conducted in Muang district, Chiang Mai Province, which has the highest population density in the northern part of Thailand, with a permanent population of almost 200,000. Chiang Mai is situated in northern Thailand, in a flat plain surrounded by high mountain ranges. In Chiang Mai Province, the major source of PM2.5 during episodes of haze has been identified as biomass burning [20]. This study aimed to assess the associations between PM2.5 exposure and the risk of preterm birth, low birth weight (LBW), and small gestational age (SGA). The data used in this study were derived from two hospitals, namely, Maharaj Nakorn Chiang Mai Hospital and Regional Health Promotion Center1 Hospital, Chiang Mai, which are the two largest maternal and child health hospitals in Chiang Mai Province, located 4.7 km apart from each other. Maharaj Nakorn Chiang Mai Hospital is a tertiary referral center that primarily manages patients with severe and complex conditions. In contrast, Regional Health Promotion Center 1 Hospital is a secondary care facility focused on preventive care and a broader range of maternal and child health services. To ensure that all socioeconomic levels of pregnant women are included in the study, we used data from the two major hospitals which include different insurance schemes.
Pregnant women who received antenatal care and delivered in these two hospitals between 1 January 2016, and 31 December 2022, were included in this analysis. We excluded pregnant women who experienced abortion or stillbirth during the index pregnancy, had multiple pregnancy and for whom information regarding maternal or infant health was missing. To ensure data independence and avoid bias, pregnant women with multiple deliveries at the hospital were included only once in the study. For woman with multiple eligible deliveries, only the most recent delivery was selected for inclusion in the analysis.
This study presents the categories of daily average of PM2.5 concentration, each reflecting different levels of potential health impacts according Thai national standards and WHO guidelines [21,22]: “very good” (≤15.0 μg/m3), “good and moderate” (15.1–37.5 μg/m3), and “starting to affect health and harmful to health” (>37.5 μg/m3).
2.3. Meteorological Data and Exposure Assessment
In this study, meteorological data were collected from hourly reports provided by the Pollution Control Department during the study period. According to the protocol of the Chiang Mai National Air Quality Monitoring Network, the concentrations of PM2.5 in Chiang Mai were measured consecutively at two designated national monitoring sites. These measurements utilized the tapered element oscillating microbalance (TEOM) method, with hourly readings aggregated into daily averages. From 1 January 2015 to 31 December 2022, the Yupparaj High School site (T36), the monitoring site nearest to the two study hospitals, served as the primary data source for PM2.5 concentrations. However, when needed, the missing data from site T36 were supplemented by measurements from the Chiang Mai Government Center site (T35) that is also located in the urban area, approximately 6 km from the two hospitals. This approach ensured comprehensive and continuous monitoring of PM2.5 concentrations in the area.
Daily PM2.5 data were imputed using the random forest machine learning method when the data were missing from both stations [23]. Concentrations of PM2.5 were calculated to daily average for the different periods and for the entire duration of pregnancy up to the day of delivery. To evaluate association of PM2.5 concentration exposure during different stages of pregnancy, which may occur in various windows of peak level of PM2.5 concentration and result in different pregnancy outcomes, the daily average exposure concentration of individual pregnant women was estimated for four exposure windows: first trimester (<14 weeks), second trimester (≥14 to <27 weeks), third trimester (≥27 weeks), and the entire pregnancy. This was calculated according to concentration of PM2.5 from the start to end date of each trimester.
Supplementary Figure S1 shows the study area in Chiang Mai City, Thailand. The detailed map includes the two air quality monitoring stations (T35 and T36, indicated by blue stars) and the two Chiang Mai hospitals where maternal and infant data were collected.
2.4. Data Collection and Outcome Measurements
This study aimed to create comprehensive perinatal care profiles by collecting and analyzing extensive data on infant characteristics. Baseline information was established, including sociodemographic factors and pregnancy-related complications. The study collected a wide range of maternal data (including age, Asia–Pacific classification of BMI at pre-pregnancy, occupation, education level, parity, as well as pregnancy-related information such as gestational age, number of antenatal care visits, and mode of delivery). Infant data included APGAR scores at 5 min, sex, and birth weight.
To establish a detailed timeline of pregnancy, we recorded or calculated several key dates (the end of first and second trimesters and the date of delivery). Our database contained information on preterm births (delivery before 37 weeks of gestation), LBW (birth weight < 2500 g), and SGA (birth weight below the 10th percentile for gestational age and infant sex according to INTERGROWTH-21st standards) [24].
2.5. Subgroup Analysis
To address the critical threshold concentration of PM2.5 exposure at which pregnancy outcomes begin to be impacted, subgroup analysis was performed. This analysis is specifically for pregnant women in high-risk groups, including pregnant women aged over 35 years underweight pregnant women, women experiencing pregnancy-induced hypertension, and nulliparous women. Since exposure levels ≤15 μg/m3 daily are considered acceptable by both Thai national standards and WHO guidelines [21,22], we focused specifically on women exposed to levels exceeding this daily threshold throughout pregnancy to examine potential adverse effects of sustained elevated exposure. Then, we excluded participants with daily PM2.5 exposure ≤15 μg/m3, classified as “very good air quality”. By concentrating on higher exposure daily levels (>15 μg/m3), we aim to detect and quantify the effects of 10 μg/m3 increment of daily average of PM2.5 concentration on maternal and infant outcomes in environments where air pollution may pose health risks.
2.6. Statistical Analysis
The characteristics of the study population, distribution of daily concentrations of PM2.5, and meteorological data were presented using descriptive statistics. Categorical variables were displayed as frequencies with proportions, while continuous variables were reported as medians with interquartile range (IQR) and the range of maximum and minimum values. The distribution of maternal and infant characteristics between the three groups—pregnant women exposed to PM2.5 ≤ 15.0 µg/m3, 15.1–37.5 µg/m3, and PM2.5 > 37.5 µg/m3—were compared using the chi-square or Fisher’s exact test for categorical characteristics and the Kruskal–Wallis test for continuous characteristics. The associations between PM2.5 exposure and infant outcomes (including preterm birth, LBW, and SGA) were estimated using binary logistic regression models with adjustment of potential confounding factors. The odds ratios (ORs) were adjusted for potential confounders, including maternal age, pre-pregnancy BMI, frequency of antenatal care visits, parity, pregnancy-induced hypertension, thalassemia, history of abortion, infant sex, gestational diabetes, maternal occupation, and maternal education level. Adjusted odds ratios (aORs) with 95% confidence intervals (CIs) were calculated to indicate the risk of preterm birth, LBW, and SGA for an increase in PM2.5. A backward stepwise selection method was employed to determine the most important factors associated with the outcomes. Variables with p-values greater than 0.2 were excluded from the model in each step, while those with p-values less than 0.05 were retained. To assess the predictive capability of PM2.5 for preterm birth and LBW, receiver operating characteristic (ROC) curve analysis was performed. The area under the curve (AUC) was calculated to quantify the overall predictive performance, with 95% confidence intervals (CIs) computed to estimate the precision of the AUC. The p-values were also calculated to determine the statistical significance of the predictive relationship. A p-value < 0.05 was considered statistically significant. The ROC curve analysis was performed separately for preterm birth and LBW to compare the predictive performance of PM2.5 for each condition.
All statistical analyses were conducted using STATA software (StataCorp. 2021. Stata Statistical Software: Release 17. StataCorp LLC, College Station, TX, USA). All the statistical analyses were calculated using two-sided tests with a 5% level of significance.
3. Results
3.1. Study Selection
Overall, 18,909 pregnant women attended antenatal clinics in the two hospitals, but 1944 failed to meet the inclusion criteria and were excluded. Thus,16,965 women and their infants were studied (Figure 1). Of those, 8420 (49.6%) women delivered at Maharaj Nakorn Chiang Mai Hospital and 8545 (50.4%) delivered at Regional Health Promotion Center1 Hospital, Chiang Mai. Daily average PM2.5 concentrations for each pregnancy exposure window were calculated using data from two monitoring sites of the Pollution Control Department in Chiang Mai, providing a comprehensive dataset for analyzing the relationship between PM2.5 exposure and pregnancy outcomes.
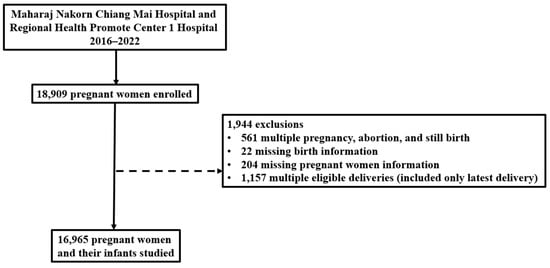
Figure 1.
Flow diagram of participant recruitment for the study with reasons for exclusion.
3.2. Population Characteristics
Table 1 presents the characteristics of pregnant women and infants stratified by PM2.5 exposure levels (≤15.0, 15.1–37.5, and >37.5 μg/m3). Among 16,965 pregnancies, 15,615 (92.0%) pregnant women were exposed to PM2.5 concentrations ≤15.0 µg/m3 (lowest-exposure group), 15.1–37.5 µg/m3 (middle-exposure group), and >37.5 µg/m3 (highest-exposure group), respectively, throughout pregnancy, while 1350 (8.0%) pregnant women were exposed to PM2.5 concentrations >37.5 µg/m3. Most participants aged 20–35 years (81.4%) had normal BMI (46.7%), worked indoors (52.8%), had a secondary school education or higher (81.7%), attended more than eight antenatal care visits (59.6%), and were nulliparous (53.9%). Three dominant complications during pregnancy were pregnancy-induced hypertension (PIH) (8.7%), gestational diabetes mellitus (14.2%), and thalassemia (16.9%). Most infants were male (50.8%) and born via vaginal delivery (69.6%) with APGAR scores greater than 7 (98.5%). The median gestational age at delivery was 38 weeks (IQR: 38, 39), and median birth weight was 3065 g (IQR: 2785, 3350).

Table 1.
Descriptive characteristics of pregnant women and infants, stratified by PM2.5 exposure levels during 2016–2022.
Maternal characteristics were comparable among the three groups. Maternal age distribution varied across exposure groups, with a higher proportion of women aged >35 years in the lowest-exposure group (≤15.0 μg/m3) compared to other groups (18.4% vs. 14.4% in both other groups, p = 0.019). Similarly, women with obesity (BMI > 25.0 kg/m2) were more prevalent in the lowest-exposure group (27.2%) compared to the middle- (24.2%) and highest-exposure groups (20.9%), p = 0.015.
Women in the highest-exposure group (>37.5 μg/m3) attended significantly fewer antenatal care visits (median: seven) compared to both lower-exposure groups (median: eight for both), p < 0.001. Notably, the rate of pregnancy-induced hypertension (PIH) was higher in the lowest-exposure group (12.8%) compared to the middle- (8.4%) and highest-exposure groups (10.7%), p < 0.001. Also, gestational diabetes mellitus (GDM) was more prevalent in the lowest-exposure group (17.3%) compared to the middle- (14.0%) and highest-exposure groups (14.4%), though this difference was not statistically significant (p = 0.146).
The proportion of infants with APGAR scores < 7 at 5 min was significantly higher in the lowest-exposure group (4.3%) compared to the middle- (1.4%) and highest-exposure groups (2.2%), p < 0.001, while Cesarean section rates were highest in the lowest-exposure group (38.7%) compared to the middle- (30.1%) and highest-exposure groups (30.4%), p < 0.001. Additionally, women in the lowest-exposure group were more likely to receive care at Maharaj Nakorn Chiang Mai Hospital, a tertiary referral center (58.2% vs. 49.4% and 49.3%, p = 0.001).
3.3. Characteristics of PM2.5 Exposure with Preterm Birth and Low Birth Weight: A Pregnancy Stage Analysis
PM2.5 concentrations during the rainy season (June to November) were consistently low (Supplementary Figure S2). In the study area, the annual average of PM2.5 concentrations from 2015 to 2022 reached the level of “harmful to health” (>15 μg/m3) according to the Thai national standards and World Health Organization (WHO) annual PM2.5 air quality guideline (the red dashed line). Despite some reductions in variability, the median concentrations remained above the WHO guideline throughout the study period, underscoring the persistent problem of elevated PM2.5 levels in the region (Supplementary Figure S3).
As shown in Table 2, preterm births accounted for 1780 cases (10.5%), while LBW occurred in 1894 cases (11.2%). Additionally, SGA cases represented 1361 infants (8.0%). During the first trimester, median PM2.5 exposure was slightly higher among preterm births (22.3 μg/m3) compared to term births (22.0 μg/m3), while LBW and SGA infants had lower exposures (21.8 and 21.3 μg/m3) than both NBW and non-SGA infants (22.1 μg/m3). In the second trimester, preterm births had slightly lower median PM2.5 concentrations (20.2 μg/m3) compared to term births (20.8 μg/m3). LBW and SGA infants had exposure levels (20.5 and 20.7 μg/m3) that were highly comparably to those of both NBW and non-SGA infants (20.4 μg/m3). Third-trimester PM2.5 exposure was lower for both preterm births and LBW infants (19.4 μg/m3) than for term births and NBW infants (19.9 μg/m3). Similarly, SGA and non-SGA infants had comparable third-trimester exposures (19.9 and 19.8 μg/m3). When analyzing the entire pregnancy period, preterm births had a lower median PM2.5 exposure (26.5 μg/m3) compared to term births (27.1 μg/m3). Similarly, LBW and SGA infants had slightly lower exposures (26.9 μg/m3) compared to NBW and non-SGA infants, both of which had a median exposure of 27.1 μg/m3.
Table 2.
Average daily PM2.5 concentrations for a range of adverse pregnancy outcomes according to the timing of exposure.
3.4. Factors Associated with Preterm Birth, Low Birth Weight, and Small for Gestational Age: A Univariate Logistic Regression Analysis
The associations between maternal, infant, and environmental factors with preterm birth, LBW, and SGA were analyzed using univariate logistic regression, as shown in Supplementary Table S1. Factors that significantly increased the risk of preterm birth included maternal age, with higher risk observed in pregnant women aged <20 and >35 years (OR 1.61 and 1.58, respectively, p < 0.001) compared to those aged 20–35 years. Additional risk factors were pre-pregnancy underweight (BMI < 18.5 kg/m2) (OR 1.48, p < 0.001) compared to normal BMI, outdoor occupation (OR 1.17, p = 0.011) compared to indoor occupation, primary school education or lower (OR 1.22, p = 0.001), and PIH (OR 1.96, p < 0.001). Furthermore, exposure to PM2.5 throughout pregnancy at levels >37.5 μg/m3 was significantly associated with an increased risk of preterm birth (adjusted OR = 2.46, p < 0.001) compared to the reference group (15.1–37.5 μg/m3). Also, exposure at levels ≤15.0 μg/m3 was linked to a higher risk (adjusted OR = 3.36, p < 0.001) relative to the same reference group. Conversely, the factors that significantly decreased the risk of preterm birth included adequate antenatal care (≥8 visits) (OR 0.35, p < 0.001), thalassemia (OR 0.55, p < 0.001), and multiparity (OR 0.89, p = 0.018).
Factors that significantly increased the risk of LBW included maternal age, with higher risk observed in pregnant women aged <20 and >35 years (OR 1.62 and 1.58, respectively, p < 0.001) compared to pregnant women aged 20–35 years. Additional risk factors were pre-pregnancy underweight (BMI < 18.5 kg/m2) (OR 1.79, p < 0.001) compared to normal BMI, outdoor occupation showed (OR 1.21, p = 0.001) compared to indoor occupation, PIH (OR 1.98, p < 0.001), and gestational diabetes (OR 1.21, p = 0.004). Furthermore, exposure to PM2.5 throughout pregnancy at levels >37.5 μg/m3 was significantly associated with an increased risk of LBW (adjusted OR = 2.17, p < 0.001) compared to the reference group (15.1–37.5 μg/m3). Also, exposure at levels ≤15.0 μg/m3 was linked to a higher risk (adjusted OR = 3.18, p < 0.001) relative to the same reference group. Conversely, factors that significantly decreased the risk of LBW included adequate antenatal care (≥8 visits) (OR 0.49, p < 0.001), thalassemia (OR 0.52, p < 0.001), male infants (OR 0.86, p = 0.001), and multiparity (OR 0.70, p < 0.001). For SGA, significant risk factors included maternal age <20 years (OR 1.40, p = 0.009) compared to those aged 20–35 years, pre-pregnancy underweight (BMI <18.5 kg/m2) (OR 1.68, p < 0.001), and PIH (OR 1.54, p < 0.001). Conversely, protective factors included higher pre-pregnancy BMI categories, with overweightness (23.0–24.9 kg/m2) (OR 0.74, p = 0.001) and obesity (>25.0 kg/m2) (OR 0.70, p < 0.001) significantly reducing the risk of SGA. Multiparity was also associated with a lower risk of SGA (OR 0.51, p < 0.001).
3.5. Association of PM2.5 Exposure with Preterm Birth, Low Birth Weight, and Small for Gestational Age: A Multivariable Analysis Across Pregnancy Stage
Table 3 presents the association between PM2.5 exposure categories during different periods of pregnancy and adverse outcomes, specifically preterm, LBW, and SGA, after adjustment for potential confounders. PM2.5 exposure over the entire pregnancy period at levels >37.5 μg/m3 was significantly associated with an increased risk of preterm birth (adjusted OR = 2.19, p < 0.001) compared to the reference group (15.1–37.5 μg/m3). Also, exposure at levels ≤15.0 μg/m3 was linked to a higher risk (adjusted OR = 3.18, p < 0.001) relative to the same reference group. For the risk of LBW, PM2.5 exposure over the entire pregnancy period at levels >37.5 μg/m3 was significantly associated with an increased risk of LBW (adjusted OR = 1.99, p < 0.001) compared to the reference group (15.1–37.5 μg/m3). Also, exposure at levels ≤15.0 μg/m3 was linked to a higher risk (adjusted OR = 3.02, p < 0.001) relative to the same reference group. However, no statistically significant association was observed between PM2.5 exposure and SGA.
Table 3.
Adjusted odds ratios (95% confidence intervals) of preterm birth, low birth weight, and small for gestational age by PM2.5 concentration categories during different time periods of pregnancy.
When analyzed by trimester, no statistically significant associations were found between PM2.5 exposure in the first, second, or third trimesters and any of the adverse outcomes (preterm birth, LBW, or SGA).
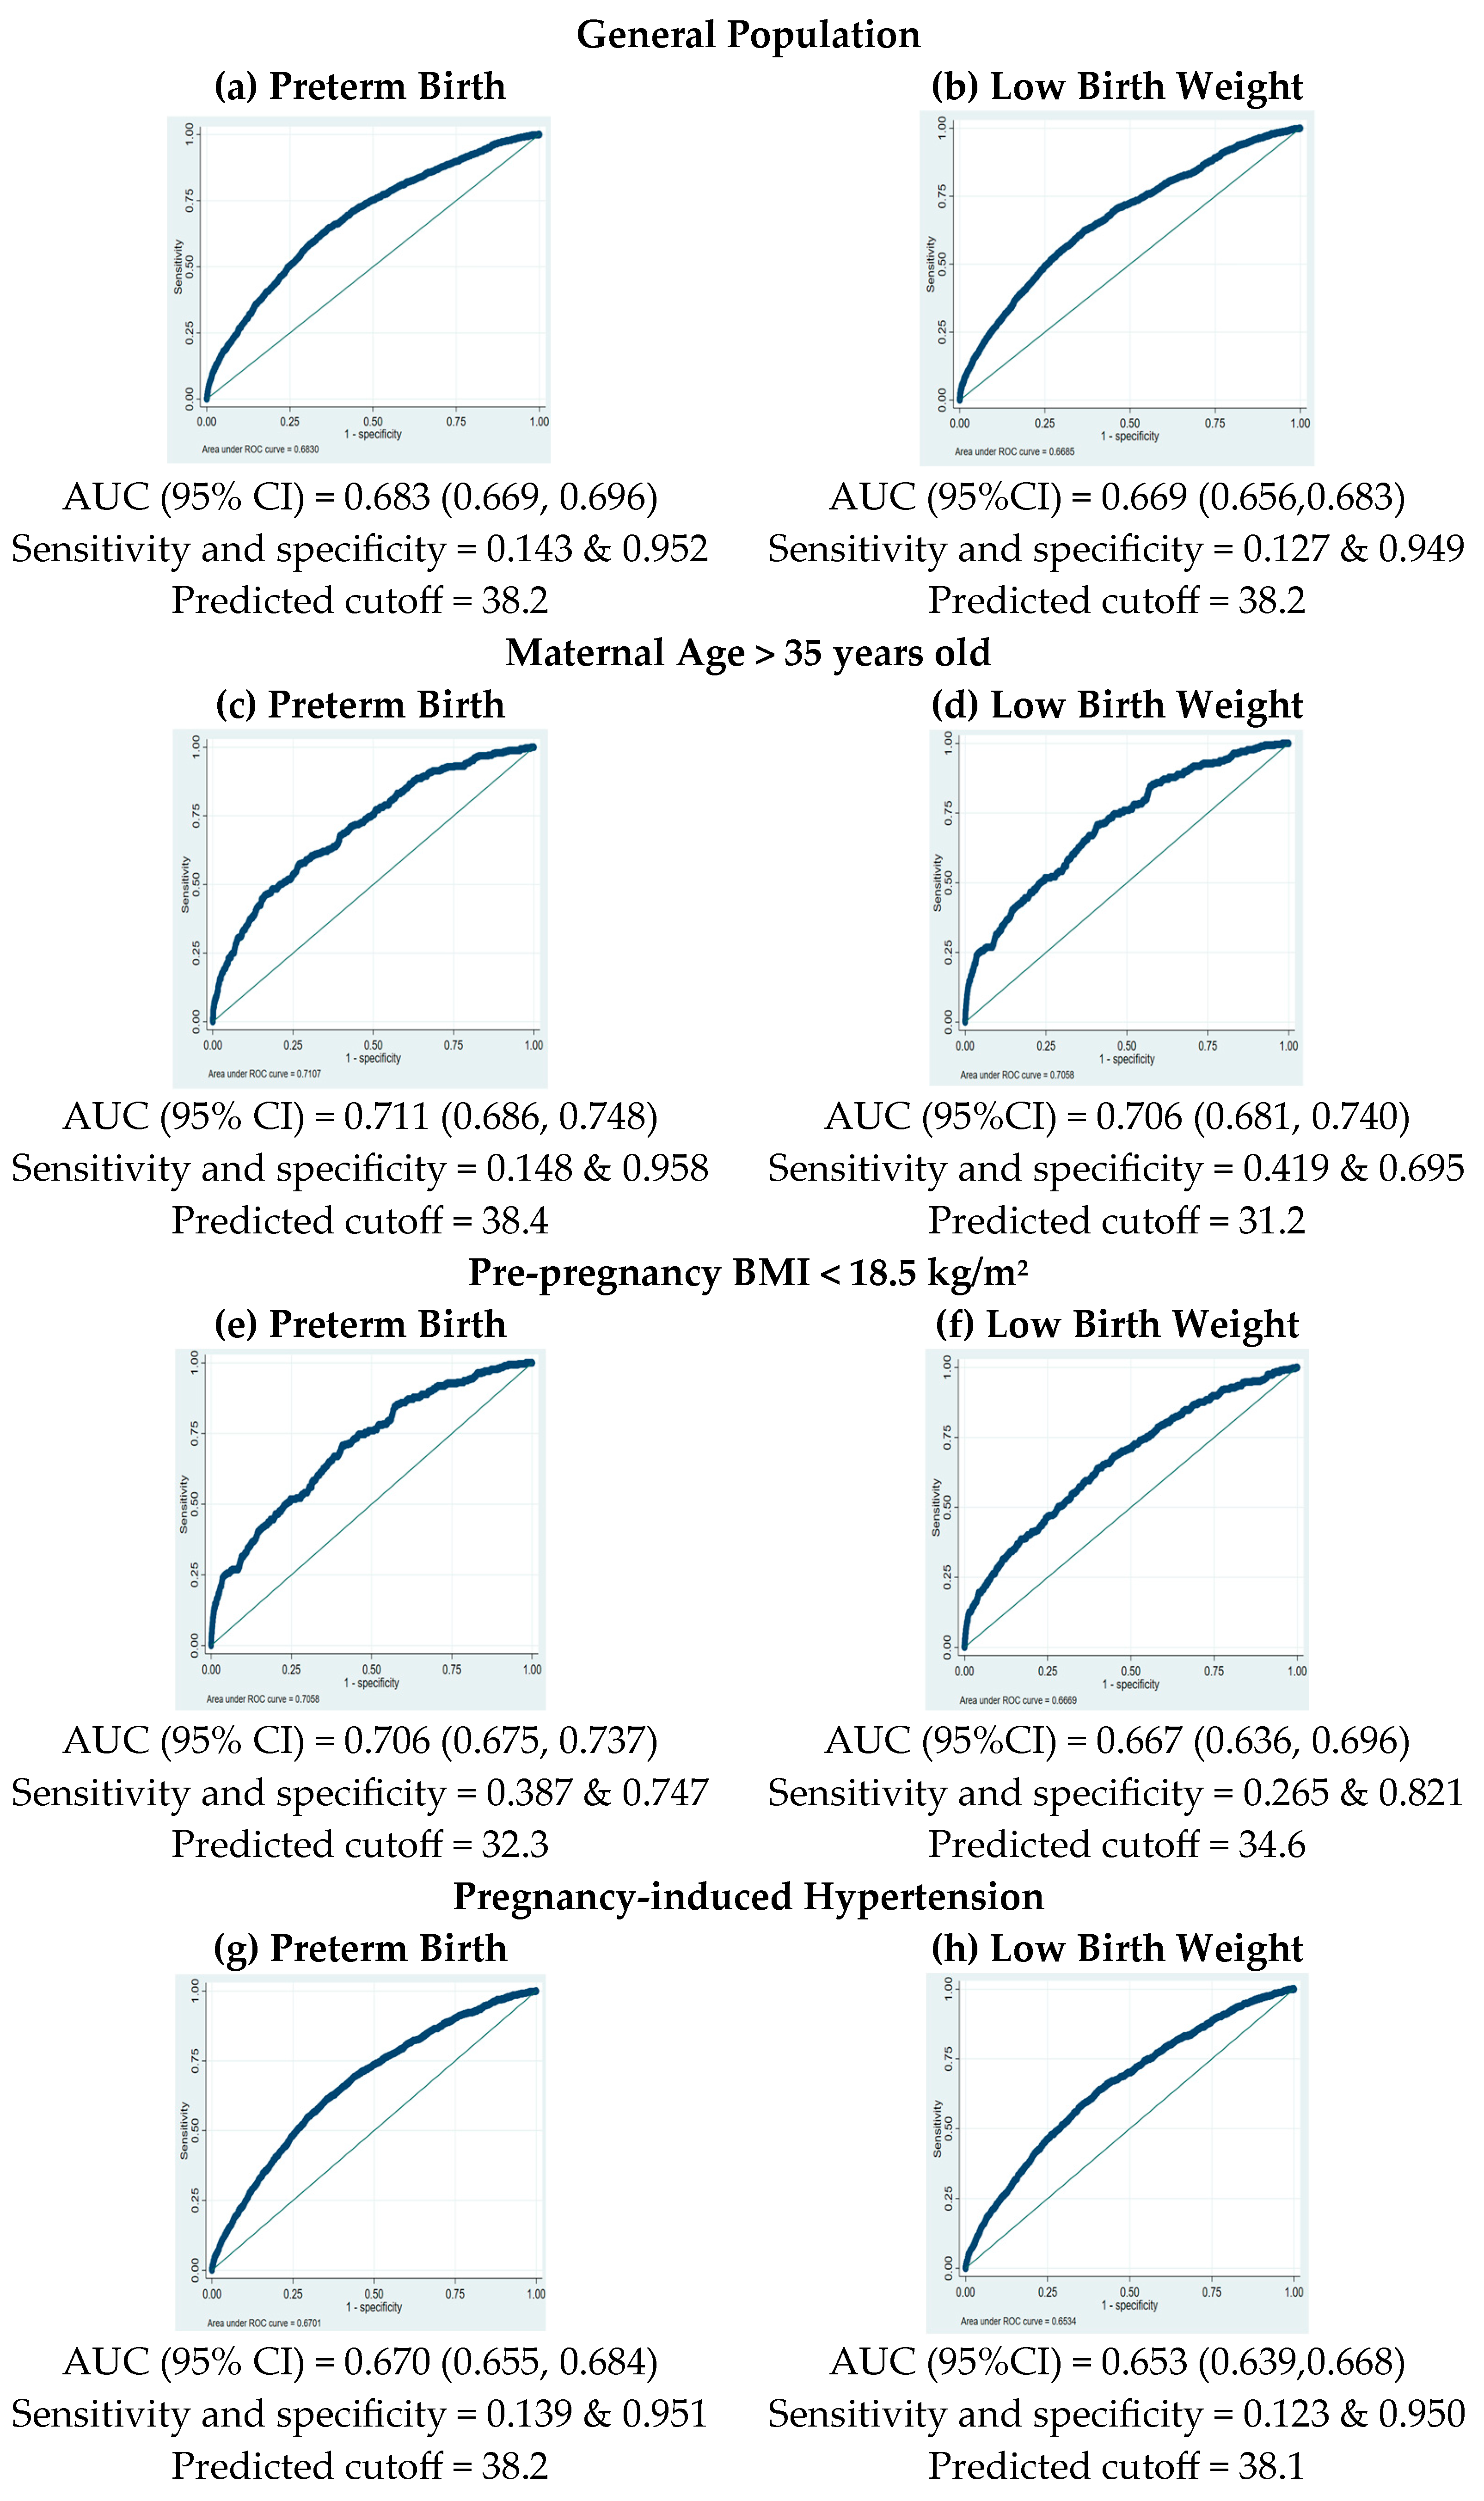
3.6. Determining the Critical Threshold of PM2.5 Exposure for Adverse Pregnancy Outcomes Using ROC Curve Analysis
Table 4 presents the results of subgroup analyses (n = 16,520). Among pregnant women aged over 35 years, a significant association was observed between average PM2.5 exposure throughout pregnancy and LBW (adjusted OR 1.35, p = 0.001), indicating a 35% increased risk of LBW per 10 μg/m3 increase in PM2.5. In the subgroup of women with pre-pregnancy BMI < 18.5 kg/m2, PM2.5 exposure was significantly associated with preterm birth (adjusted OR 1.26, p = 0.016), suggesting a 26% higher risk of preterm birth per 10 μg/m3 increase in PM2.5. In the subgroup of women with pregnancy-induced hypertension, PM2.5 exposure was associated with both preterm birth (adjusted OR 1.09, p = 0.030) and LBW (adjusted OR 1.11, p = 0.012), indicating 9% and 11% increased risks, respectively, per 10 μg/m3 increase in PM2.5 exposure. For nulliparous women, PM2.5 exposure was significantly associated with both preterm birth (adjusted OR 1.12, p = 0.023) and LBW (adjusted OR 1.15, p = 0.022), suggesting a 12% and 15% increased risk, respectively, per 10 μg/m3 increase in PM2.5 throughout pregnancy.
Table 4.
Odds ratios (95% confidence intervals) of preterm birth and low birth weight per 10 μg/m3 increase in PM2.5 concentration during the entire pregnancy, stratified by potential confounders.
The analysis utilized ROC curves to determine the optimal PM2.5 cutoff concentration for classifying preterm birth and LBW, as shown in Figure 2. The PM2.5 cutoff concentration for both outcomes, preterm birth and LBW, was 38.2 μg/m3, with specificity of 95.2% and 94.9%, for preterm birth and LBW, respectively, and sensitivity of 14.3% and 12.7%, respectively. The predictive ability assessed by the area under the curve (AUC) was 68.3% (95% CI: 66.9–69.6%) for preterm birth and 66.9% (95% CI: 65.6–68.3%) for LBW. In pregnant women aged over 35 years, the PM2.5 cutoff value for LBW was at 31.2 μg/m3, with a sensitivity at 41.9% and a specificity at 69.5%. The AUC for this subgroup was 70.6% (95% CI: 68.1–74.0%). For women with pre-pregnancy BMI < 18.5 kg/m2, the optimal PM2.5 cutoff value for preterm birth was 32.3 μg/m3, with a sensitivity at 38.7%, specificity at 74.7%, and an AUC for this group at 70.6% (95% CI: 67.5–73.7%). In the subgroup of PIH, the PM2.5 cutoff value was 38.2 μg/m3 for preterm birth and 38.1 for LBW, with specificity at 95.1% and 95.0%, respectively, sensitivity at 13.9% and 12.3%, respectively, and AUCs for this group at 67.0% (95% CI: 65.5–68.4%) for preterm birth and 65.3% (95% CI: 63.9–66.8%) for LBW. For nulliparous women, the PM2.5 cutoff value was 38.2 μg/m3 for preterm birth and LBW, with specificity at 95.1% and 94.9%, respectively, sensitivity at 14.3% and 12.7%, respectively, and AUCs for this group at 68.2% (95% CI: 66.4–70.0%) for preterm birth and 67.8% (95% CI: 65.7–69.8%) for LBW, respectively.
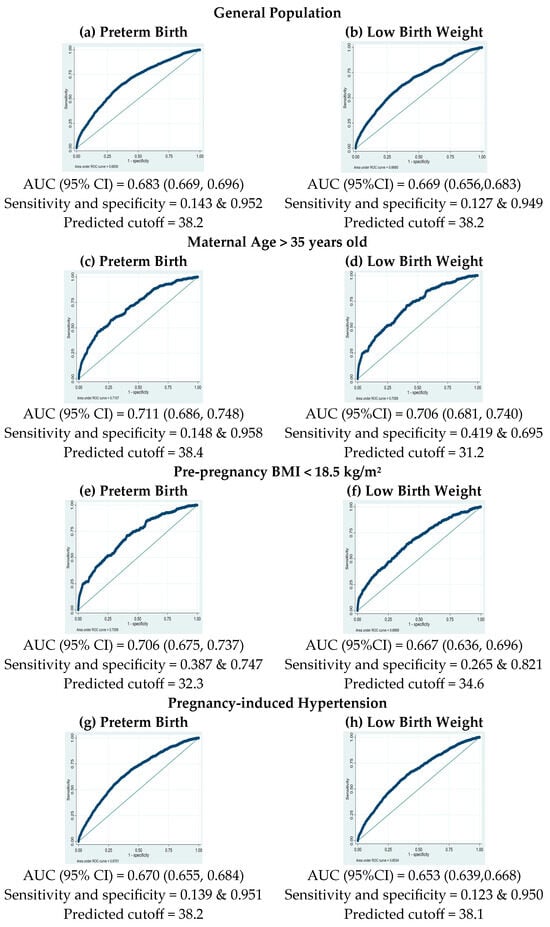
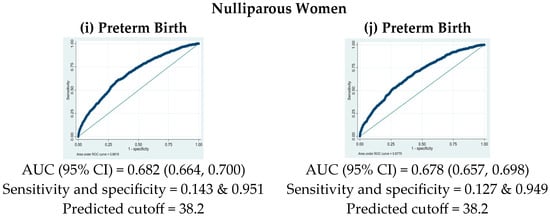
Figure 2.
Receiver operating characteristic (ROC) curves for PM2.5 exposure in predicting preterm birth (left column) and low-birth-weight risks (right column) in different subgroups.
4. Discussion
The primary finding of this study is that PM2.5 exposure during pregnancy is an independent risk factor for preterm birth and low birth weight (LBW) among Thai pregnant women, even after controlling for potential confounding factors. The finding is further supported by the observation of significantly reduced gestational age and birth weight among infants born to exposed mothers. Notably, the effect size of this association is particularly pronounced among women aged over 35 years, those with a pre-pregnancy BMI of less than 18.5 kg/m2, and those complicated with pregnancy-induced hypertension.
To the best of our knowledge, this study represents the first comprehensive investigation of PM2.5 exposure effects on pregnancy outcomes in the Thai population, where unique seasonal patterns of air pollution and biomass burning may influence exposure–outcome relationships differently than previously studied populations. Our findings of an increased risk of adverse pregnancy outcomes align with those reported in a previous study involving a Chinese population [11], a large study conducted in Africa [25], and recent meta-analyses encompassing diverse populations worldwide [26,27], underscoring the global impact of air pollution on pregnancy outcomes. Although no prior studies in Thailand have specifically examined the effects of PM2.5 on pregnancy outcomes, a large nationwide study of pregnant women found that exposure to PM10 throughout pregnancy was associated with reduced birth weight [28], indirectly supporting our finding regarding the adverse effects of air pollution on pregnancy outcomes.
In terms of the timing of PM2.5 exposure during pregnancy and its effects, results vary across studies. Previous research has reported significant associations between PM2.5 exposure during individual trimesters and adverse pregnancy outcomes. Some studies found associations with preterm birth and LBW throughout pregnancy [29], while others reported significant relationships only during the first, second, and third trimesters [18]. In our study, PM2.5 exposure throughout the entire pregnancy at levels >37.5 μg/m3 was significantly associated with an increased risk of preterm birth and LBW compared to the reference group (15.1–37.5 μg/m3). However, exposure at levels ≤15.0 μg/m3 was also associated with a higher risk for both outcomes relative to the same reference group. This controversy may be attributable to the higher proportion of complications observed in the group of mothers exposed to low PM2.5 levels (≤15.0 μg/m3), which may be associated with a greater proportion of women in the tertiary hospital compared to the other groups. In our study, we considered the complications of pregnant women, including GDM, PIH, and thalassemia, in the adjusted model. However, other complications that influence preterm birth and LBW may not have been considered due to the lack of data. Furthermore, no significant association with SGA was found, and individual trimester exposures did not show significant relationships with pregnancy outcomes. These findings align with several studies that reported similar associations between sustained PM2.5 exposure and preterm birth and LBW [26]. Our findings on the association between PM2.5 exposure and adverse pregnancy outcomes align with those of previous studies. A meta-analysis by Sun et al. demonstrated that PM2.5 exposure throughout pregnancy is linked to an increased risk of preterm birth [30]. Similarly, large cohort studies have reported associations between PM2.5 and reduced birth weight across various countries [31,32]. However, the effect size observed in our study differs, possibly due to the PM2.5 levels in our population, our focus on entire pregnancy exposure, and unique geographic factors. Methodological differences in data collection and analysis may also contribute to the variance in effect magnitude. Our results differ from studies that found significant trimester-specific effects that may relate to the components of PM2.5 [33,34] and those reporting associations with SGA [14]. The discrepancy in SGA findings may be verified using differences in population characteristics, exposure methods, or regional PM2.5 composition. A meta-analysis and other studies have found that PM2.5 exposure during pregnancy increased the risk of SGA, particularly with first, second or third trimester exposure [35,36], but other studies reported no significant relationship with SGA, emphasizing the need for standardized methods and more nuanced analyses of exposure timing. In this population, exposure to PM2.5 did not have a significant effect on SGA, suggesting that PM2.5 did not directly disrupt fetal growth, leading to LBW. Rather, the higher risk of LBW in our study group seems to be largely influenced by an increased likelihood of preterm birth, as preterm deliveries are associated with lower birth weight. In addition, genetic and nutritional factors may play larger roles on SGA than PM2.5 exposure. Interestingly, cumulative PM2.5 exposure throughout pregnancy was significantly associated with adverse pregnancy outcomes, whereas trimester-specific exposure was not. This suggests that sustained exposure may be more critical than short-term peaks [37,38].
Subgroup analyses revealed variability in the impact of PM2.5, with heightened risk observed among pregnant women aged over 35 years (aOR 1.35 for LBW) and those with pre-pregnancy BMI < 18.5 kg/m2 (aOR 1.26 for preterm birth). These findings underscore the compounding effects of maternal risk factors and environmental exposures, emphasizing the need for targeted interventions and enhanced prenatal care in areas with poor air quality [39,40]. The association between PM2.5 exposure and PIH was particularly notable, as increased risks for preterm birth and LBW in PIH cases suggest a potential mechanistic link between air pollution, maternal cardiovascular health, and infant outcomes [41]. Among nulliparous women, higher PM2.5 concentrations were associated with an increased risk of preterm birth and LBW in our study, whereas this association was not observed in the Korean population [42]. The ROC curve analysis showed moderate predictive ability of PM2.5 for adverse pregnancy outcomes (AUC of 68.3% for preterm birth and 66.9% for LBW), with improved performance in the general population. The identified threshold of 31.2 μg/m3 for LBW in pregnant women aged over 35 years. A threshold of 32.3 μg/m3 was observed for preterm birth in mothers with a pre-pregnancy BMI < 18.5, while thresholds of 38.1 and 38.2 μg/m3 were associated with preterm birth and LBW in pregnant women with PIH. Similarly, a threshold of 38.2 μg/m3 was associated with both preterm birth and LBW in nulliparous women. These findings emphasize the need for targeted interventions to reduce PM2.5 exposure among vulnerable groups. Public health strategies should include raising awareness about the risks of outdoor PM2.5 exposure during pregnancy [43]. Additionally, the threshold of 37.5 µg/m3 for PM2.5 exposure is a significant finding for air quality management efforts aimed at protecting maternal and infant health. This threshold corresponds to the concentration at which health risks begin for the general population, as recommended by the WHO [22].
The mechanisms by which PM2.5 exposure impacts pregnancy outcomes are complex. PM2.5 can induce systemic inflammation, which affects fetal growth [44], and cause oxidative stress, damaging cells and DNA [45,46]. It can also disrupt endocrine function by altering hormone levels critical for pregnancy [47]. Furthermore, PM2.5 may influence gene expression through epigenetic mechanisms [48,49]. PM2.5 exposure may also impair placental development and function, reducing oxygen and nutrient transport to the fetus. This could exacerbate the risks of preterm birth and LBW, particularly in vulnerable subgroups, and alter the microbiome, contributing to adverse outcomes [50].
The seasonal variation in PM2.5 concentrations in Chiang Mai, peaking during the dry season (December to May), underscores the need for season-specific interventions. This pattern, consistent with findings from studies conducted in regions with seasonal air quality changes, suggests that pregnancy planning and protective measures during high-pollution periods may be beneficial. The peak concentrations observed in March highlight the importance of targeted interventions during high-risk times, especially in areas with distinct wet and dry seasons [51]. Our findings suggest that pregnant women should avoid outdoor work, particularly during high-pollution periods; this is especially important, as we found that outdoor work was associated with both preterm birth and LBW. This recommendation extends beyond PM2.5 exposure, as other pollutants such as PM10, carbon monoxide, ozone, and additional components of PM2.5 have also been linked to an increased risk of preterm birth and/or LBW [28,52,53,54].
To maintain analytical clarity and focus, this study specifically concentrated on PM2.5 due to PM2.5’s well-established relationship with adverse pregnancy outcomes such as preterm birth and LBW, as supported by epidemiological studies [12,26,27]. PM2.5 is widely acknowledged as a significant component of urban air pollution, particularly in industrial areas and regions with agricultural burning practices. While other pollutants, including PM10, carbon monoxide, and ozone, have also been linked to preterm birth and LBW, incorporating multiple pollutants could potentially lead to multivariable regression complications, making the interpretation of individual pollutant impacts more complex [55]. It is recommended that future research develop multi-pollutant models that could explore cumulative or synergistic effects, potentially utilizing advanced analytical techniques such as machine learning [56].
This study emphasizes the significant public health impact of daily PM2.5 exposure during pregnancy. The association between PM2.5 concentrations exceeding 31.2 μg/m3 and adverse pregnancy outcomes underscores the need for stricter air quality standards. Public health campaigns should raise awareness about risks of PM2.5 exposure and about protective measures [57]. Developing surveillance and early warning systems can enable timely protective actions. A multi-sectoral approach integrating environmental and urban planning policies is crucial for reducing PM2.5 emissions.
The strengths of this study, which enhance the reliability of our conclusions, include a large sample size, high ethnic homogeneity among participants recruited from the same geographical areas, and a robust exposure assessment utilizing data from two air quality monitoring sites to ensure comprehensive coverage.
Limitations of this study include reliance on population-level PM2.5 data, which may not capture individual exposure variations; the lack of PM2.5 chemical composition analysis; and the absence of data on long-term child health impacts. Additionally, although the sample size is adequate to address the primary objective, it is too small to assess the effects of PM2.5 exposure on important but rare outcomes such as fetal death or fetal distress. Additionally, the data do not provide sufficient evidence to determine whether the same concentration of PM2.5 exposure has a different effect size at various stages of pregnancy.
Future research should explore these limitations, including long-term effects of PM2.5 exposure, the impact of climate change on PM2.5 concentrations, and the potential synergistic effects of PM2.5 with other pollutants on pregnancy outcome and child development. Employing personal air quality monitors, assessing socioeconomic and environmental variables, analyzing PM2.5 constituents, conducting longitudinal studies, and investigating genetic susceptibility and pollutant interactions will deepen our understanding of the effects of PM2.5 effects on maternal and child health. Also, assessment of whether PM2.5 exposure increases the risk of developing other pregnancy complications, such as PIH, uteroplacental insufficiency, and fetal growth restriction, should be explored. Finally, the correlation between fetal blood concentrations of PM2.5 biomarkers and infant outcomes remains a significant knowledge gap requiring further in-depth study.
Our findings, consistent with previous studies conducted in different populations, strengthen the recommendation for pregnant women to minimize PM2.5 exposure as much as possible. Furthermore, our evidence may encourage healthcare providers to incorporate this awareness into antenatal care counseling. Finally, these findings specific to Thai population could potentially prompt the development of preventive measures such as a national policy with special consideration for pregnant women.
5. Conclusions
The main finding of this study is that PM2.5 exposure at levels exceeding 37.5 μg/m3 during pregnancy significantly increases the risk of preterm birth and low birth weight, with greater impacts observed in high-risk pregnancies (women over 35 years of age, those with pre-pregnancy BMI < 18.5 kg/m2, those with pregnancy-induced hypertension, and nulliparous women). The critical PM2.5 exposure threshold ranged from 32.3 (pre-pregnancy BMI < 18.5 kg/m2) to 38.4 μg/m3 (maternal age > 35 years) for preterm birth and ranged from 31.2 (maternal age > 35 years) to 38.2 μg/m3 (nulliparous) for LBW. Accordingly, our findings could be used to raise awareness among pregnant women and healthcare providers about the detrimental effects of PM2.5 exposure or air pollution on maternal and infant health, potentially prompting the development of more effective policies and preventive measures. Ultimately, this could contribute to improving the overall quality of life for the general population.
Supplementary Materials
The following supporting information can be downloaded at: https://www.mdpi.com/article/10.3390/toxics13040304/s1, Figure S1: Map of the study area in Chiang Mai City, Thailand. Figure S2: Daily average variation in PM2.5 concentration of particulate matters from 1 January 2015 to 31 December 2022 over Chiang Mai, Thailand. Figure S3: Annual distribution of PM2.5 concentrations (µg/m3) from 2015 to 2022. Table S1: Univariate analysis of risk factors for preterm birth, low birth weight, and small for gestational age using logistic regression.
Author Contributions
Conceptualization, P.T., P.S., A.R., T.T., S.S. (Suraphan Sangsawang), S.K., W.S., C.W., S.S. (Sirinart Sirilert), N.M., C.P., K.O., J.G.B.D. and K.R.; methodology, P.T., P.S., A.R., T.T., S.S. (Suraphan Sangsawang), S.K., W.S., C.W., S.S. (Sirinart Sirilert), N.M., C.P., K.O., J.G.B.D. and K.R.; validation, P.T., P.S., A.R., T.T., S.K., C.W., S.S. (Sirinart Sirilert), J.G.B.D. and K.R.; formal analysis, P.T., P.S., A.R., S.K., W.S., J.G.B.D. and K.R.; data curation, P.T., P.S., A.R., T.T., S.S. (Suraphan Sangsawang), S.K., W.S., C.W., S.S. (Sirinart Sirilert), C.P. and K.R.; writing—original draft, P.T., P.S. and K.R.; writing—review and editing, P.T., P.S., A.R., T.T., S.S. (Suraphan Sangsawang), S.K., W.S., C.W., S.S. (Sirinart Sirilert), N.M., C.P., K.O., J.G.B.D. and K.R.; supervision, P.T., P.S., A.R., T.T., S.S. (Suraphan Sangsawang), S.K., W.S., C.W., S.S. (Sirinart Sirilert), N.M., C.P., K.O., J.G.B.D. and K.R.; funding acquisition, P.S., A.R., S.S. (Suraphan Sangsawang), S.K., W.S., N.M., K.O. and K.R. All authors will be updated at each stage of manuscript processing, including submission, revision, and revision reminder, via emails from our system or the assigned Assistant Editor. All authors have read and agreed to the published version of the manuscript.
Funding
This research was partially supported by Chiang Mai University.
Institutional Review Board Statement
All procedures for this study were reviewed and approved by the Institutional Re-view Boards of both hospitals (Maharaj Nakorn Chiang Mai Hospital: SUR-2566-0534; Regional Health Promotion Center1 Hospital Chiang Mai: 34/2567) on 6 November 2023.
Informed Consent Statement
Patient consent was waived due to the study’s retrospective nature and the use of deidentified data.
Data Availability Statement
The data supporting this study is available within the article. Raw data supporting this study’s findings are available from the corresponding author upon reasonable request.
Acknowledgments
This study was supported by National Research Council of Thailand, Health Systems Research Institute, Thailand, and Chiang Mai University, Thailand. Pak Thaichana was supported by CMU Proactive Researcher Program, Chiang Mai University [EX010100/2567].
Conflicts of Interest
The authors declare no conflicts of interest.
References
- Gogna, P.; Borghese, M.M.; Villeneuve, P.J.; Kumarathasan, P.; Johnson, M.; Shutt, R.H.; Ashley-Martin, J.; Bouchard, M.F.; King, W.D. A cohort study of the multipollutant effects of PM2.5, NO2, and O3 on C-reactive protein levels during pregnancy. Environ. Epidemiol. 2024, 8, e308. [Google Scholar] [CrossRef]
- Shen, Y.; Wang, Y.; Fu, Z.; Zhou, T.; Yuan, Z.; Gao, J.; Ji, Y. Ambient PM2.5, household environment and preterm birth: A birth cohort study in Shandong, China. Atmos. Environ. 2024, 332, 120612. [Google Scholar] [CrossRef]
- Jiang, P.; Li, Y.; Tong, M.K.; Ha, S.; Gaw, E.; Nie, J.; Mendola, P.; Wang, M. Wildfire particulate exposure and risks of preterm birth and low birth weight in the Southwestern United States. Public Health 2024, 230, 81–88. [Google Scholar] [CrossRef] [PubMed]
- Lin, W.; Lai, Y.; Zhuang, S.; Wei, Q.; Zhang, H.; Hu, Q.; Cheng, P.; Zhang, M.; Zhai, Y.; Wang, Q.; et al. The effects of prenatal PM2.5 oxidative potential exposure on feto-placental vascular resistance and fetal weight: A repeated-measures study. Environ. Res. 2023, 234, 116543. [Google Scholar] [CrossRef] [PubMed]
- Li, S.; Li, L.; Zhang, C.; Fu, H.; Yu, S.; Zhou, M.; Guo, J.; Fang, Z.; Li, A.; Zhao, M.; et al. PM2.5 leads to adverse pregnancy outcomes by inducing trophoblast oxidative stress and mitochondrial apoptosis via KLF9/CYP1A1 transcriptional axis. eLife 2023, 12, e85944. [Google Scholar] [CrossRef]
- Dadvand, P.; Basagaña, X.; Figueras, F.; Martinez, D.; Beelen, R.; Cirach, M.; de Nazelle, A.; Hoek, G.; Ostro, B.; Nieuwenhuijsen, M.J. Air pollution and preterm premature rupture of membranes: A spatiotemporal analysis. Am. J. Epidemiol. 2014, 179, 200–207. [Google Scholar] [CrossRef]
- Collins, A.; Weitkamp, J.H.; Wynn, J.L. Why are preterm newborns at increased risk of infection? Arch. Dis. Child.-Fetal Neonatal Ed. 2018, 103, F391–F394. [Google Scholar] [CrossRef]
- Siffel, C.; Hirst, A.; Sarda, S.; Kuzniewicz, M.; Li, D.-K. The clinical burden of extremely preterm birth in a large medical records database in the United States: Mortality and survival associated with selected complications. Early Hum. Dev. 2022, 171, 105613. [Google Scholar] [CrossRef]
- Zhang, X.; Fan, C.; Ren, Z.; Feng, H.; Zuo, S.; Hao, J.; Liao, J.; Zou, Y.; Ma, L. Maternal PM2.5 exposure triggers preterm birth: A cross-sectional study in Wuhan, China. Glob. Health Res. Policy 2020, 5, 17. [Google Scholar] [CrossRef]
- Park, S.; Kwon, E.; Lee, G.; You, Y.A.; Kim, S.M.; Hur, Y.M.; Jung, S.; Jee, Y.; Park, M.H.; Na, S.H.; et al. Effect of Particulate Matter 2.5 on Fetal Growth in Male and Preterm Infants through Oxidative Stress. Antioxidants 2023, 12, 1916. [Google Scholar] [CrossRef]
- Wang, X.; Wang, X.; Gao, C.; Xu, X.; Li, L.; Liu, Y.; Li, Z.; Xia, Y.; Fang, X. Relationship Between Outdoor Air Pollutant Exposure and Premature Delivery in China-Systematic Review and Meta-Analysis. Int. J. Public Health 2023, 68, 1606226. [Google Scholar] [CrossRef] [PubMed]
- Li, L.; Zhang, X. The causal impact of fetal exposure to PM2.5 on birth outcomes: Evidence from rural China. Econ. Hum. Biol. 2024, 53, 101380. [Google Scholar] [CrossRef]
- Grillo, M.A.; Mariani, G.; Ferraris, J.R. Prematurity and Low Birth Weight in Neonates as a Risk Factor for Obesity, Hypertension, and Chronic Kidney Disease in Pediatric and Adult Age. Front. Med. 2021, 8, 769734. [Google Scholar] [CrossRef]
- Zhu, Z.; Hu, H.; Benmarhnia, T.; Ren, Z.; Luo, J.; Zhao, W.; Chen, S.; Wu, K.; Zhang, X.; Wang, L.; et al. Gestational PM2.5 exposure may increase the risk of small for gestational age through maternal blood pressure and hemoglobin: A mediation analysis based on a prospective cohort in China, 2014–2018. Ecotoxicol. Environ. Saf. 2022, 242, 113836. [Google Scholar] [CrossRef]
- Ludvigsson, J.F.; Lu, D.; Hammarström, L.; Cnattingius, S.; Fang, F. Small for gestational age and risk of childhood mortality: A Swedish population study. PLoS Med. 2018, 15, e1002717. [Google Scholar] [CrossRef] [PubMed]
- Zhu, N.; Ji, X.; Geng, X.; Yue, H.; Li, G.; Sang, N. Maternal PM2.5 exposure and abnormal placental nutrient transport. Ecotoxicol. Environ. Saf. 2021, 207, 111281. [Google Scholar] [CrossRef] [PubMed]
- Ardiyani, V.; Wooster, M.; Grosvenor, M.; Lestari, P.; Suri, W. The infiltration of wildfire smoke and its potential dose on pregnant women: Lessons learned from Indonesia wildfires in 2019. Heliyon 2023, 9, e18513. [Google Scholar] [CrossRef]
- Ho, T.H.; Van Dang, C.; Pham, T.T.B.; Thi Hien, T.; Wangwongwatana, S. Ambient particulate matter (PM2.5) and adverse birth outcomes in Ho Chi Minh City, Vietnam. Hyg. Environ. Health Adv. 2023, 5, 100049. [Google Scholar] [CrossRef]
- Ponsawansong, P.; Prapamontol, T.; Rerkasem, K.; Chantara, S.; Tantrakarnapa, K.; Kawichai, S.; Li, G.; Fang, C.; Pan, X.; Zhang, Y. Sources of PM2.5 Oxidative Potential During Haze and Non-Haze Seasons in Chiang Mai, Thailand. Aerosol Air Qual. Res. 2023, 23, 230030. [Google Scholar] [CrossRef]
- Kawichai, S.; Prapamontol, T.; Cao, F.; Song, W.; Zhang, Y.-L. Characteristics of Carbonaceous Species of PM2.5 in Chiang Mai City, Thailand. Aerosol Air Qual. Res. 2024, 24, 230269. [Google Scholar] [CrossRef]
- Gazette, R. Ministry of Public Health Announcement on General Air Quality Standards. Available online: https://ratchakitcha.soc.go.th/documents/140D157S0000000000300.pdf (accessed on 1 June 2023).
- WHO. WHO Global Air Quality Guidelines: Particulate Matter (PM2.5 and PM10), Ozone, Nitrogen Dioxide, Sulfur Dioxide and Carbon Monoxide. Available online: https://iris.who.int/bitstream/handle/10665/345329/9789240034228-eng.pdf?sequence=1 (accessed on 22 September 2021).
- Kawichai, S.; Sripan, P.; Rerkasem, A.; Rerkasem, K.; Srisukkham, W. Long-term retrospective predicted concentration of PM2.5 in upper northern Thailand using machine learning models. Toxics 2025, 13, 170. [Google Scholar] [CrossRef] [PubMed]
- Villar, J.; Cheikh Ismail, L.; Victora, C.G.; Ohuma, E.O.; Bertino, E.; Altman, D.G.; Lambert, A.; Papageorghiou, A.T.; Carvalho, M.; Jaffer, Y.A.; et al. International standards for newborn weight, length, and head circumference by gestational age and sex: The Newborn Cross-Sectional Study of the INTERGROWTH-21st Project. Lancet 2014, 384, 857–868. [Google Scholar] [CrossRef] [PubMed]
- Bachwenkizi, J.; Liu, C.; Meng, X.; Zhang, L.; Wang, W.; van Donkelaar, A.; Martin, R.V.; Hammer, M.S.; Chen, R.; Kan, H. Maternal exposure to fine particulate matter and preterm birth and low birth weight in Africa. Environ. Int. 2022, 160, 107053. [Google Scholar] [CrossRef]
- Parasin, N.; Amnuaylojaroen, T.; Saokaew, S. Prenatal PM2.5 Exposure and Its Association with Low Birth Weight: A Systematic Review and Meta-Analysis. Toxics 2024, 12, 446. [Google Scholar] [CrossRef]
- Ghosh, R.; Causey, K.; Burkart, K.; Wozniak, S.; Cohen, A.; Brauer, M. Ambient and household PM2.5 pollution and adverse perinatal outcomes: A meta-regression and analysis of attributable global burden for 204 countries and territories. PLoS Med. 2021, 18, e1003718. [Google Scholar] [CrossRef] [PubMed]
- Mueller, W.; Tantrakarnapa, K.; Johnston, H.J.; Loh, M.; Steinle, S.; Vardoulakis, S.; Cherrie, J.W. Exposure to ambient particulate matter and biomass burning during pregnancy: Associations with birth weight in Thailand. J. Expo. Sci. Environ. Epidemiol. 2021, 31, 672–682. [Google Scholar] [CrossRef]
- Bekkar, B.; Pacheco, S.; Basu, R.; DeNicola, N. Association of Air Pollution and Heat Exposure with Preterm Birth, Low Birth Weight, and Stillbirth in the US: A Systematic Review. JAMA Netw. Open 2020, 3, e208243. [Google Scholar] [CrossRef]
- Sun, X.; Luo, X.; Zhao, C.; Chung Ng, R.W.; Lim, C.E.; Zhang, B.; Liu, T. The association between fine particulate matter exposure during pregnancy and preterm birth: A meta-analysis. BMC Pregnancy Childbirth 2015, 15, 300. [Google Scholar] [CrossRef]
- Pedersen, M.; Giorgis-Allemand, L.; Bernard, C.; Aguilera, I.; Andersen, A.M.; Ballester, F.; Beelen, R.M.; Chatzi, L.; Cirach, M.; Danileviciute, A.; et al. Ambient air pollution and low birthweight: A European cohort study (ESCAPE). Lancet Respir. Med. 2013, 1, 695–704. [Google Scholar] [CrossRef]
- Rich, D.Q.; Liu, K.; Zhang, J.; Thurston, S.W.; Stevens, T.P.; Pan, Y.; Kane, C.; Weinberger, B.; Ohman-Strickland, P.; Woodruff, T.J.; et al. Differences in Birth Weight Associated with the 2008 Beijing Olympics Air Pollution Reduction: Results from a Natural Experiment. Environ. Health Perspect. 2015, 123, 880–887. [Google Scholar] [CrossRef]
- O’Sharkey, K.; Xu, Y.; Cabison, J.; Rosales, M.; Yang, T.; Chavez, T.; Johnson, M.; Lerner, D.; Lurvey, N.; Corral, C.M.T.; et al. Effects of in-utero personal exposure to PM2.5 sources and components on birthweight. Sci. Rep. 2023, 13, 21987. [Google Scholar] [CrossRef] [PubMed]
- Cai, J.; Zhao, Y.; Kan, J.; Chen, R.; Martin, R.; van Donkelaar, A.; Ao, J.; Zhang, J.; Kan, H.; Hua, J. Prenatal Exposure to Specific PM2.5 Chemical Constituents and Preterm Birth in China: A Nationwide Cohort Study. Environ. Sci. Technol. 2020, 54, 14494–14501. [Google Scholar] [CrossRef]
- Tapia, V.L.; Vasquez, B.V.; Vu, B.; Liu, Y.; Steenland, K.; Gonzales, G.F. Association between maternal exposure to particulate matter PM2.5 and adverse pregnancy outcomes in Lima, Peru. J. Expo. Sci. Environ. Epidemiol. 2020, 30, 689–697. [Google Scholar] [CrossRef]
- Zhu, X.; Liu, Y.; Chen, Y.; Yao, C.; Che, Z.; Cao, J. Maternal exposure to fine particulate matter (PM2.5) and pregnancy outcomes: A meta-analysis. Environ. Sci. Pollut. Res. Int. 2015, 22, 3383–3396. [Google Scholar] [CrossRef]
- Guan, T.; Xue, T.; Gao, S.; Hu, M.; Liu, X.; Qiu, X.; Liu, X.; Zhu, T. Acute and chronic effects of ambient fine particulate matter on preterm births in Beijing, China: A time-series model. Sci. Total Environ. 2019, 650, 1671–1677. [Google Scholar] [CrossRef] [PubMed]
- Estarlich, M.; Ballester, F.; Aguilera, I.; Fernández-Somoano, A.; Lertxundi, A.; Llop, S.; Freire, C.; Tardón, A.; Basterrechea, M.; Sunyer, J.; et al. Residential exposure to outdoor air pollution during pregnancy and anthropometric measures at birth in a multicenter cohort in Spain. Environ. Health Perspect. 2011, 119, 1333–1338. [Google Scholar] [CrossRef] [PubMed]
- Li, J.; Yan, J.; Jiang, W. The role of maternal age on adverse pregnancy outcomes among primiparous women with singleton birth: A retrospective cohort study in urban areas of China. J. Matern. Fetal Neonatal Med. 2023, 36, 2250894. [Google Scholar] [CrossRef]
- Du, H.; Sun, Y.; Zhang, Y.; Wang, S.; Zhu, H.; Chen, S.; Pan, H. Interaction of PM2.5 and pre-pregnancy body mass index on birth weight: A nationwide prospective cohort study. Front. Endocrinol. 2022, 13, 963827. [Google Scholar] [CrossRef]
- Zhang, M.; Mueller, N.T.; Wang, H.; Hong, X.; Appel, L.J.; Wang, X. Maternal Exposure to Ambient Particulate Matter ≤ 2.5 µm During Pregnancy and the Risk for High Blood Pressure in Childhood. Hypertension 2018, 72, 194–201. [Google Scholar] [CrossRef]
- Ahn, T.G.; Kim, Y.J.; Lee, G.; You, Y.A.; Kim, S.M.; Chae, R.; Hur, Y.M.; Park, M.H.; Bae, J.G.; Lee, S.J.; et al. Association Between Individual Air Pollution (PM10, PM2.5) Exposure and Adverse Pregnancy Outcomes in Korea: A Multicenter Prospective Cohort, Air Pollution on Pregnancy Outcome (APPO) Study. J. Korean Med. Sci. 2024, 39, e131. [Google Scholar] [CrossRef]
- Fleischer, N.L.; Merialdi, M.; van Donkelaar, A.; Vadillo-Ortega, F.; Martin, R.V.; Betran, A.P.; Souza, J.P. Outdoor air pollution, preterm birth, and low birth weight: Analysis of the world health organization global survey on maternal and perinatal health. Environ. Health Perspect. 2014, 122, 425–430. [Google Scholar] [CrossRef] [PubMed]
- Zhang, B.; Gong, X.; Han, B.; Chu, M.; Gong, C.; Yang, J.; Chen, L.; Wang, J.; Bai, Z.; Zhang, Y. Ambient PM2.5 exposures and systemic inflammation in women with early pregnancy. Sci. Total Environ. 2022, 829, 154564. [Google Scholar] [CrossRef] [PubMed]
- Niu, B.Y.; Li, W.K.; Li, J.S.; Hong, Q.H.; Khodahemmati, S.; Gao, J.F.; Zhou, Z.X. Effects of DNA Damage and Oxidative Stress in Human Bronchial Epithelial Cells Exposed to PM2.5 from Beijing, China, in Winter. Int. J. Environ. Res. Public Health 2020, 17, 4874. [Google Scholar] [CrossRef]
- Meng, Q.; Liu, J.; Shen, J.; Del Rosario, I.; Janzen, C.; Devaskar, S.U.; Lakey, P.S.J.; Shiraiwa, M.; Weichenthal, S.; Zhu, Y.; et al. Ambient exposure to fine particulate matter with oxidative potential affects oxidative stress biomarkers in pregnancy. Am. J. Epidemiol. 2024, 194, 27–34. [Google Scholar] [CrossRef]
- Zhou, J.; Yu, S.; Wang, C.; Fu, R.; Wu, D.; Abuduwaili, D.; Wang, C. Relationship between environmental PM2.5 exposure in early pregnancy and thyroid hormone levels in pregnant women. Ecotoxicol. Environ. Saf. 2024, 286, 117182. [Google Scholar] [CrossRef] [PubMed]
- Rider, C.F.; Carlsten, C. Air pollution and DNA methylation: Effects of exposure in humans. Clin. Epigenetics 2019, 11, 131. [Google Scholar] [CrossRef]
- Breton, C.V.; Marsit, C.J.; Faustman, E.; Nadeau, K.; Goodrich, J.M.; Dolinoy, D.C.; Herbstman, J.; Holland, N.; LaSalle, J.M.; Schmidt, R.; et al. Small-Magnitude Effect Sizes in Epigenetic End Points are Important in Children’s Environmental Health Studies: The Children’s Environmental Health and Disease Prevention Research Center’s Epigenetics Working Group. Environ. Health Perspect. 2017, 125, 511–526. [Google Scholar] [CrossRef]
- Fouladi, F.; Bailey, M.J.; Patterson, W.B.; Sioda, M.; Blakley, I.C.; Fodor, A.A.; Jones, R.B.; Chen, Z.; Kim, J.S.; Lurmann, F.; et al. Air pollution exposure is associated with the gut microbiome as revealed by shotgun metagenomic sequencing. Environ. Int. 2020, 138, 105604. [Google Scholar] [CrossRef]
- Jarernwong, K.; Gheewala, S.H.; Sampattagul, S. Health Impact Related to Ambient Particulate Matter Exposure as a Spatial Health Risk Map Case Study in Chiang Mai, Thailand. Atmosphere 2023, 14, 261. [Google Scholar] [CrossRef]
- Ming, X.; Yang, Y.; Li, Y.; He, Z.; Tian, X.; Cheng, J.; Zhou, W. Association between risk of preterm birth and long-term and short-term exposure to ambient carbon monoxide during pregnancy in chongqing, China: A study from 2016–2020. BMC Public Health 2024, 24, 1411. [Google Scholar] [CrossRef]
- Fussell, J.C.; Jauniaux, E.; Smith, R.B.; Burton, G.J. Ambient air pollution and adverse birth outcomes: A review of underlying mechanisms. BJOG 2024, 131, 538–550. [Google Scholar] [CrossRef] [PubMed]
- Wang, Q.; Miao, H.; Warren, J.L.; Ren, M.; Benmarhnia, T.; Knibbs, L.D.; Zhang, H.; Zhao, Q.; Huang, C. Association of maternal ozone exposure with term low birth weight and susceptible window identification. Environ. Int. 2021, 146, 106208. [Google Scholar] [CrossRef] [PubMed]
- Evangelopoulos, D.; Katsouyanni, K.; Schwartz, J.; Walton, H. Quantifying the short-term effects of air pollution on health in the presence of exposure measurement error: A simulation study of multi-pollutant model results. Environ. Health 2021, 20, 94. [Google Scholar] [CrossRef] [PubMed]
- Wang, S.; Zhang, T.; Li, Z.; Hong, J. Exploring pollutant joint effects in disease through interpretable machine learning. J. Hazard. Mater. 2024, 467, 133707. [Google Scholar] [CrossRef]
- Ramírez, A.S.; Ramondt, S.; Van Bogart, K.; Perez-Zuniga, R. Public Awareness of Air Pollution and Health Threats: Challenges and Opportunities for Communication Strategies to Improve Environmental Health Literacy. J. Health Commun. 2019, 24, 75–83. [Google Scholar] [CrossRef]


Disclaimer/Publisher’s Note: The statements, opinions and data contained in all publications are solely those of the individual author(s) and contributor(s) and not of MDPI and/or the editor(s). MDPI and/or the editor(s) disclaim responsibility for any injury to people or property resulting from any ideas, methods, instructions or products referred to in the content. |
© 2025 by the authors. Licensee MDPI, Basel, Switzerland. This article is an open access article distributed under the terms and conditions of the Creative Commons Attribution (CC BY) license (https://creativecommons.org/licenses/by/4.0/).