
Trends of Exposure to Acrylamide as Measured by Urinary Biomarkers Levels within the HBM4EU Biomonitoring Aligned Studies (2000–2021)

 ,
,  , , , , , , , ,
  , , , , , , , ,
  , , ,
, , ,  , , and
  add
Show full author list
add
Show full author list
Abstract
:1. Introduction
2. Materials and Methods
2.1. Data Sources
2.2. Stratification
2.2.1. Age
2.2.2. Smoking
2.3. Statistics
3. Results
3.1. Trends in Data-Pools of Non-Smokers and Detected Multicollinearity
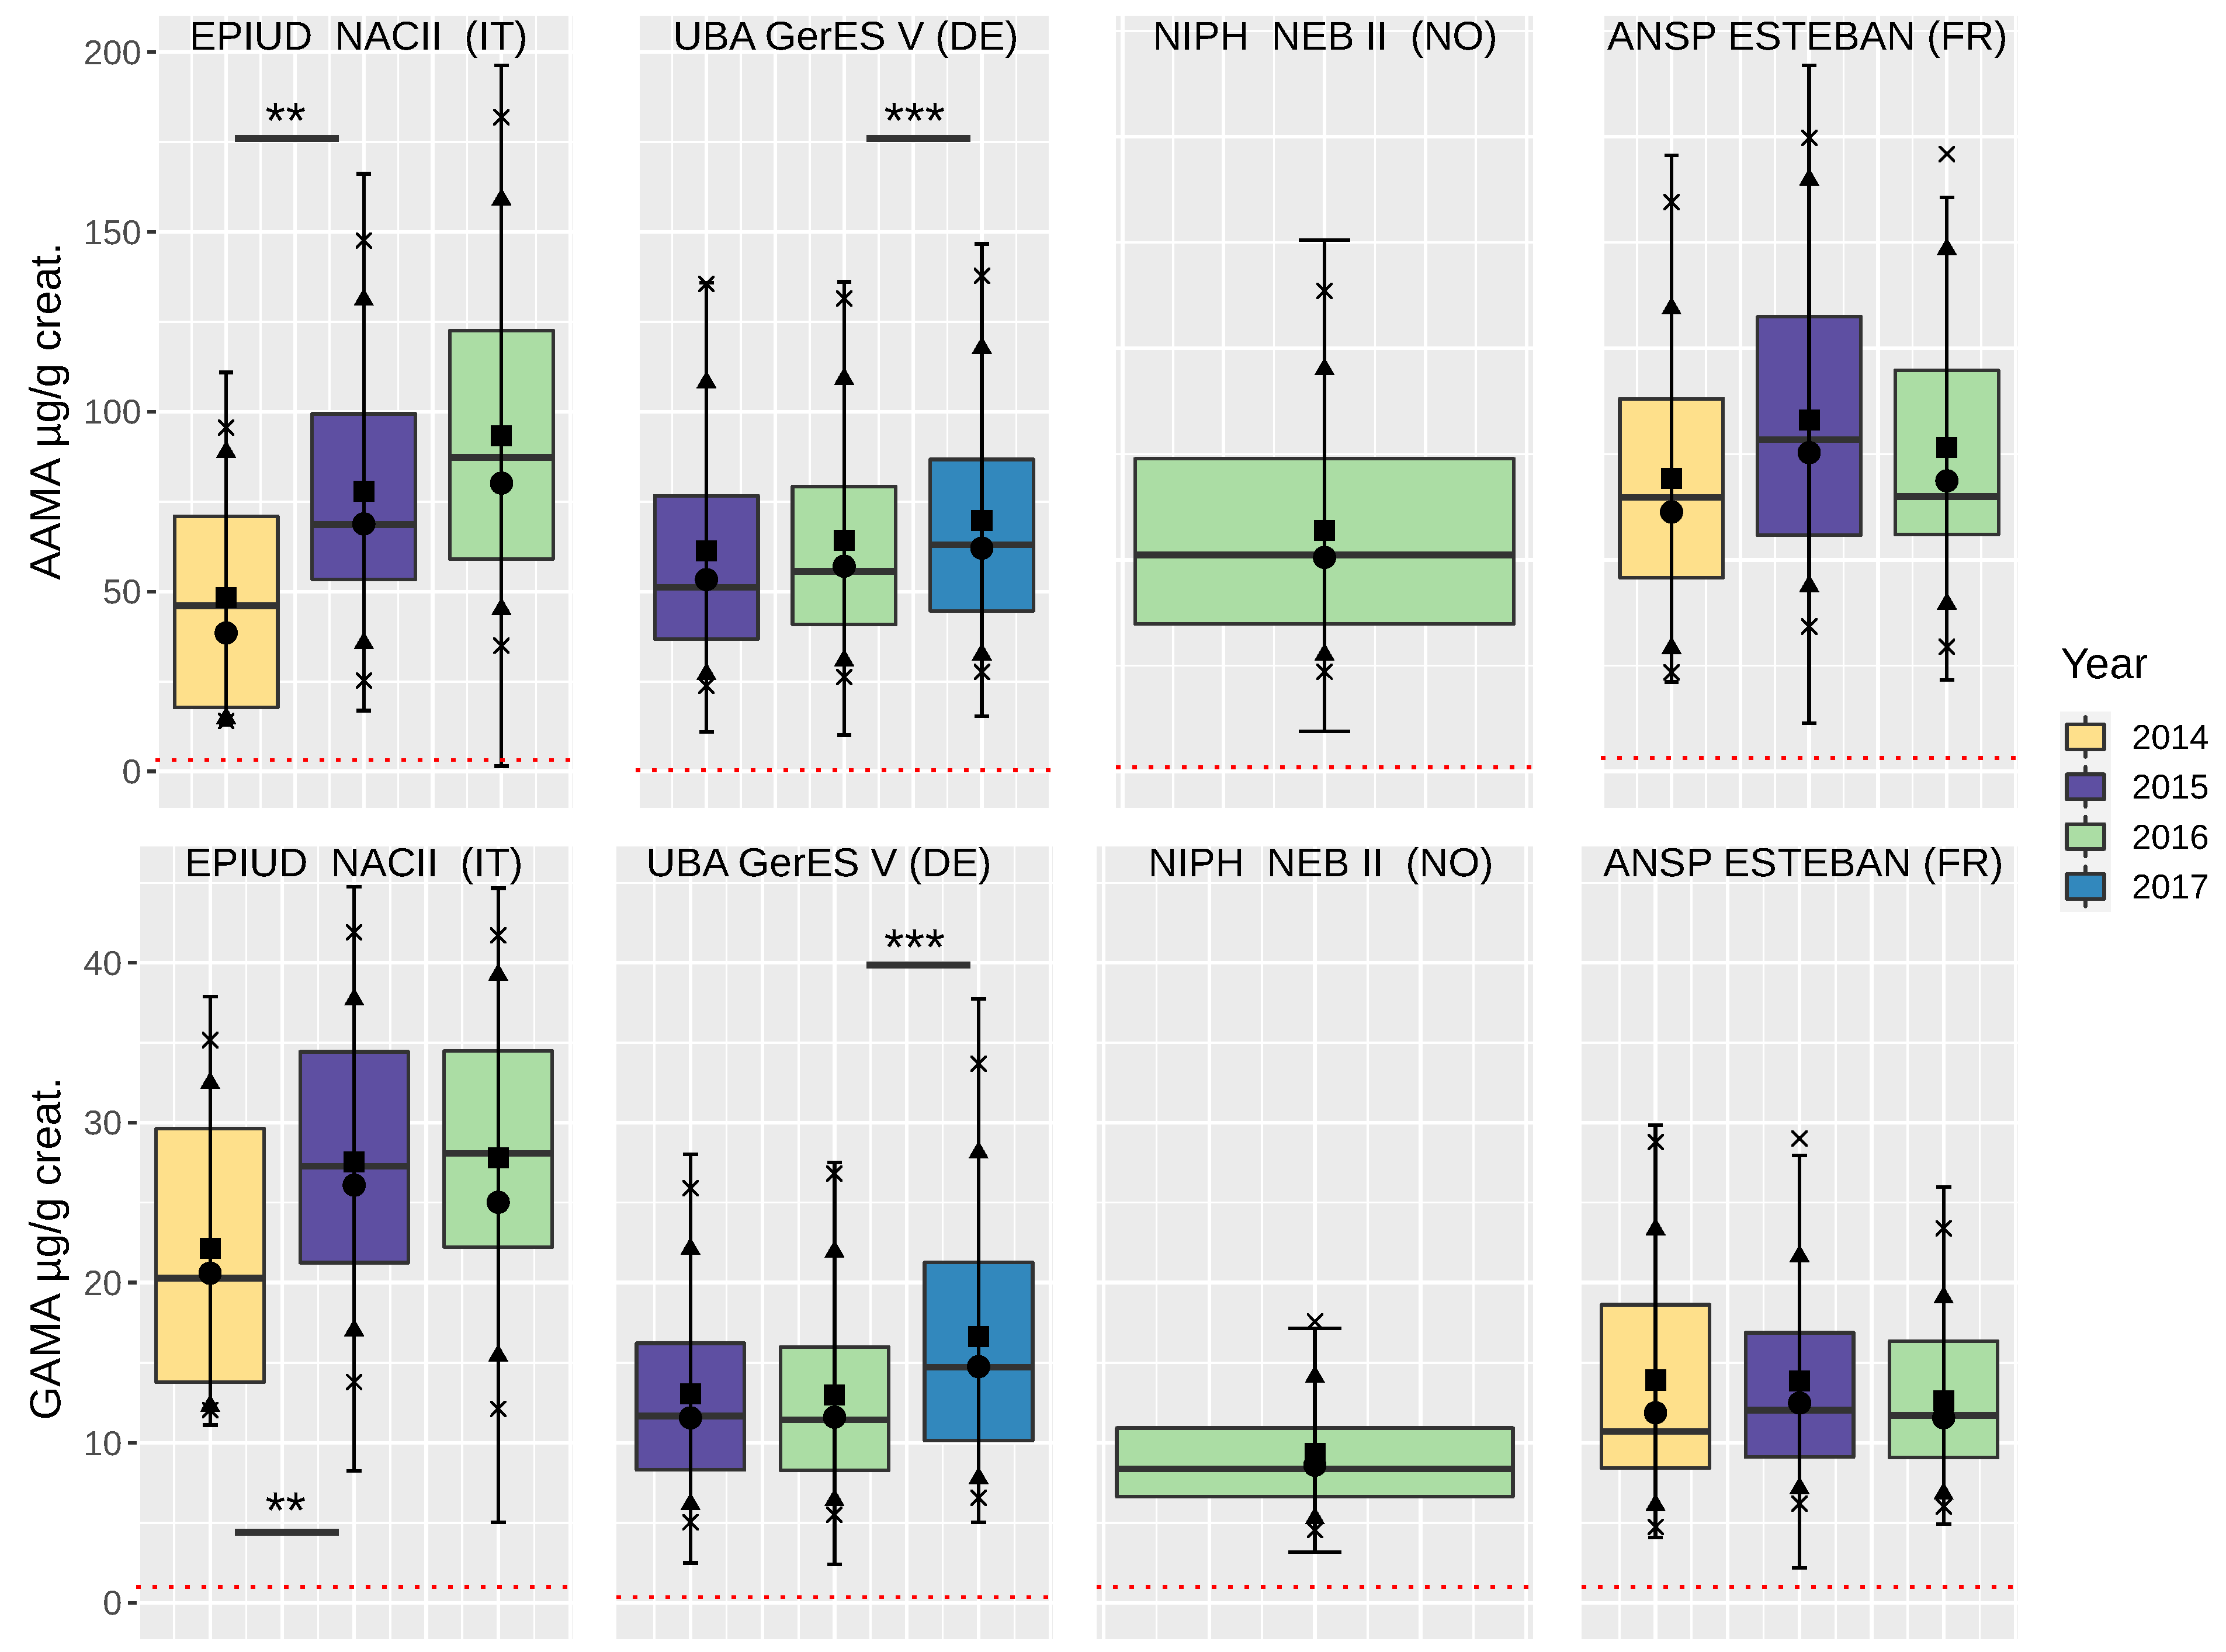
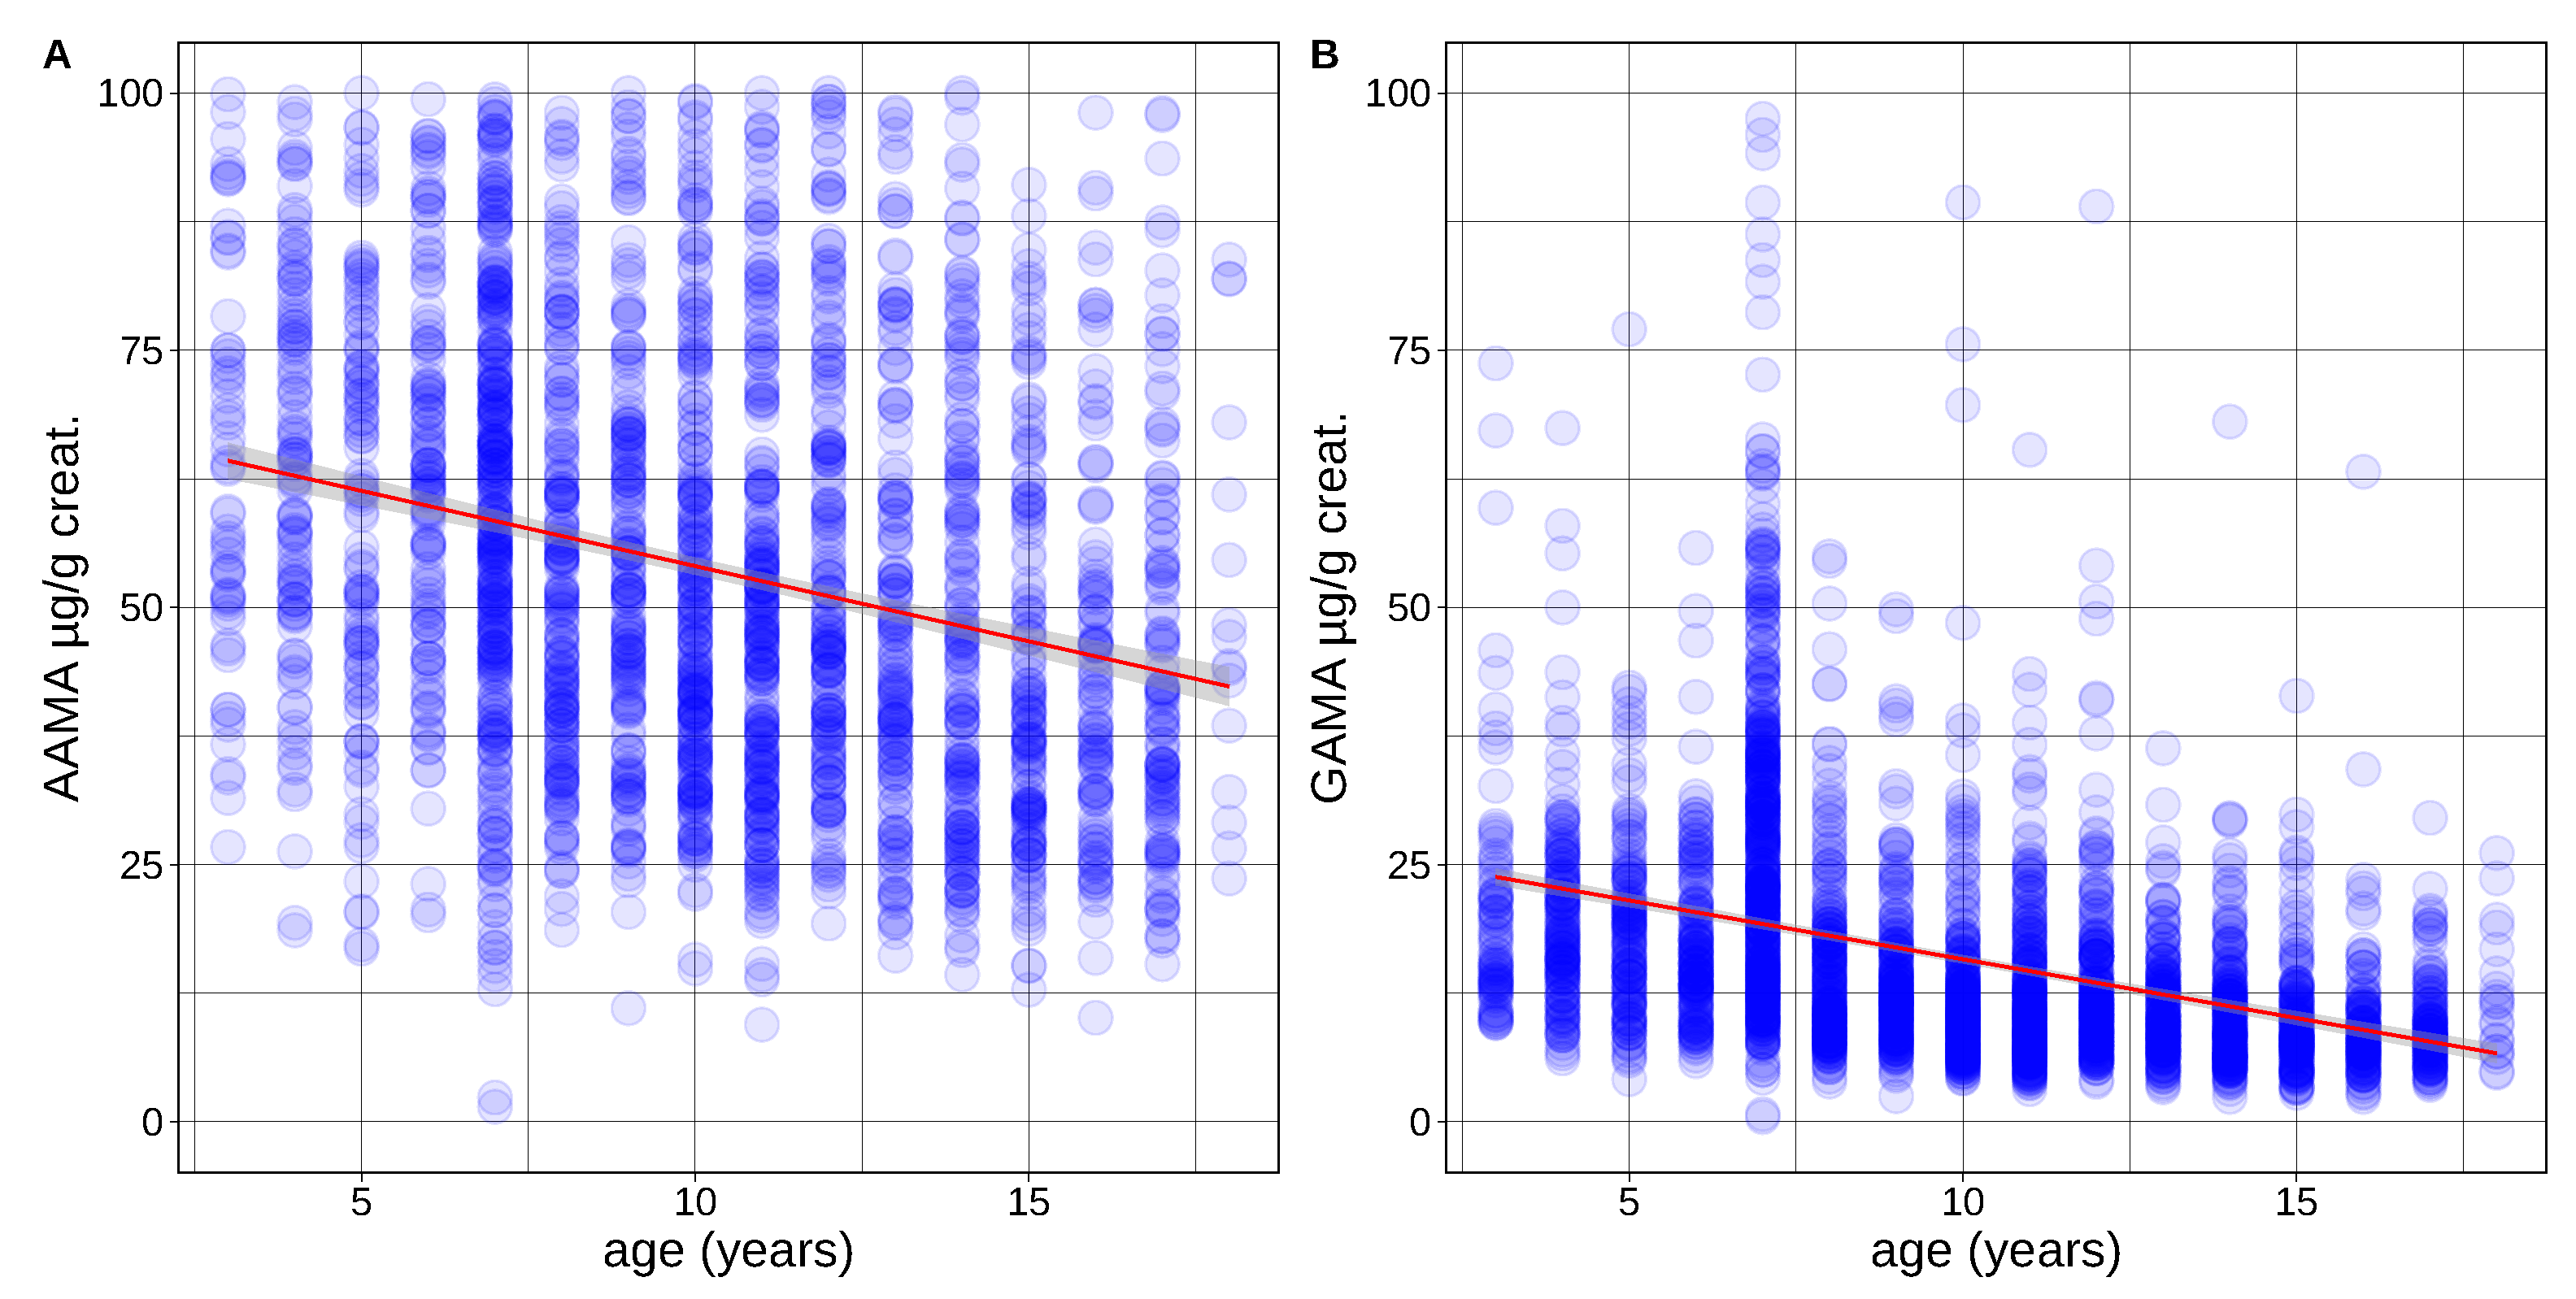
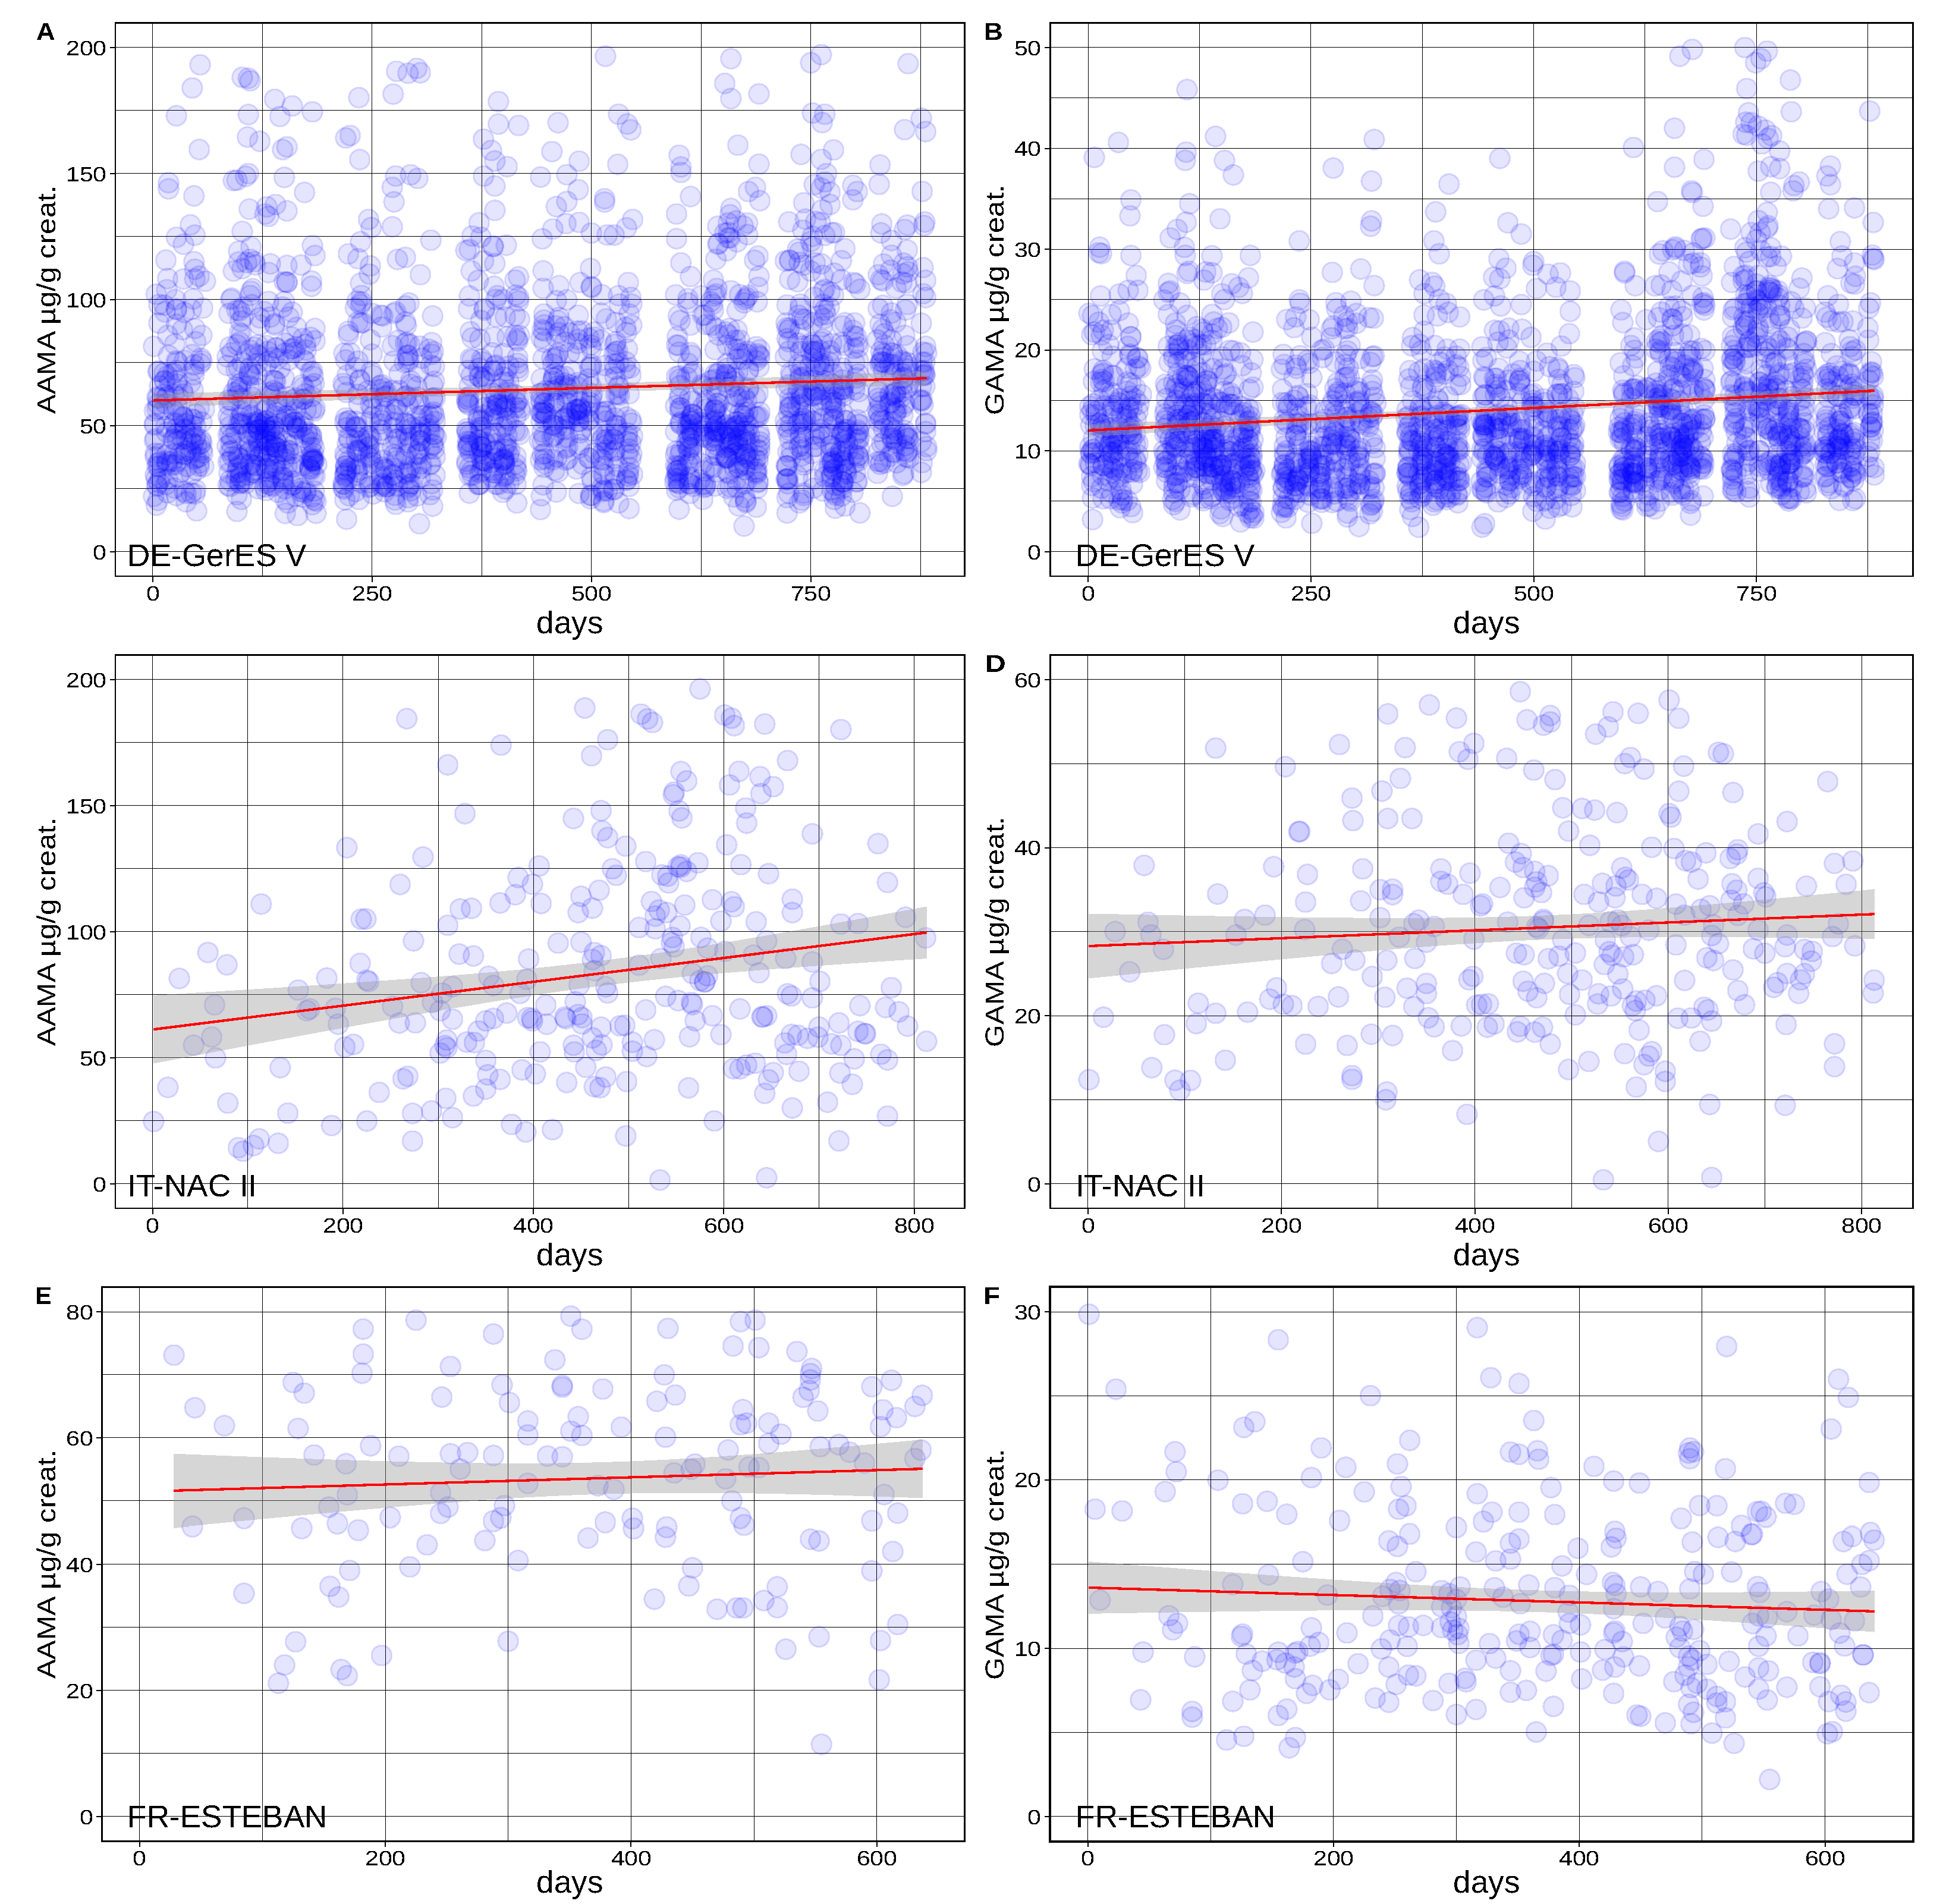
3.2. Children and Teenagers (3–18 Years)
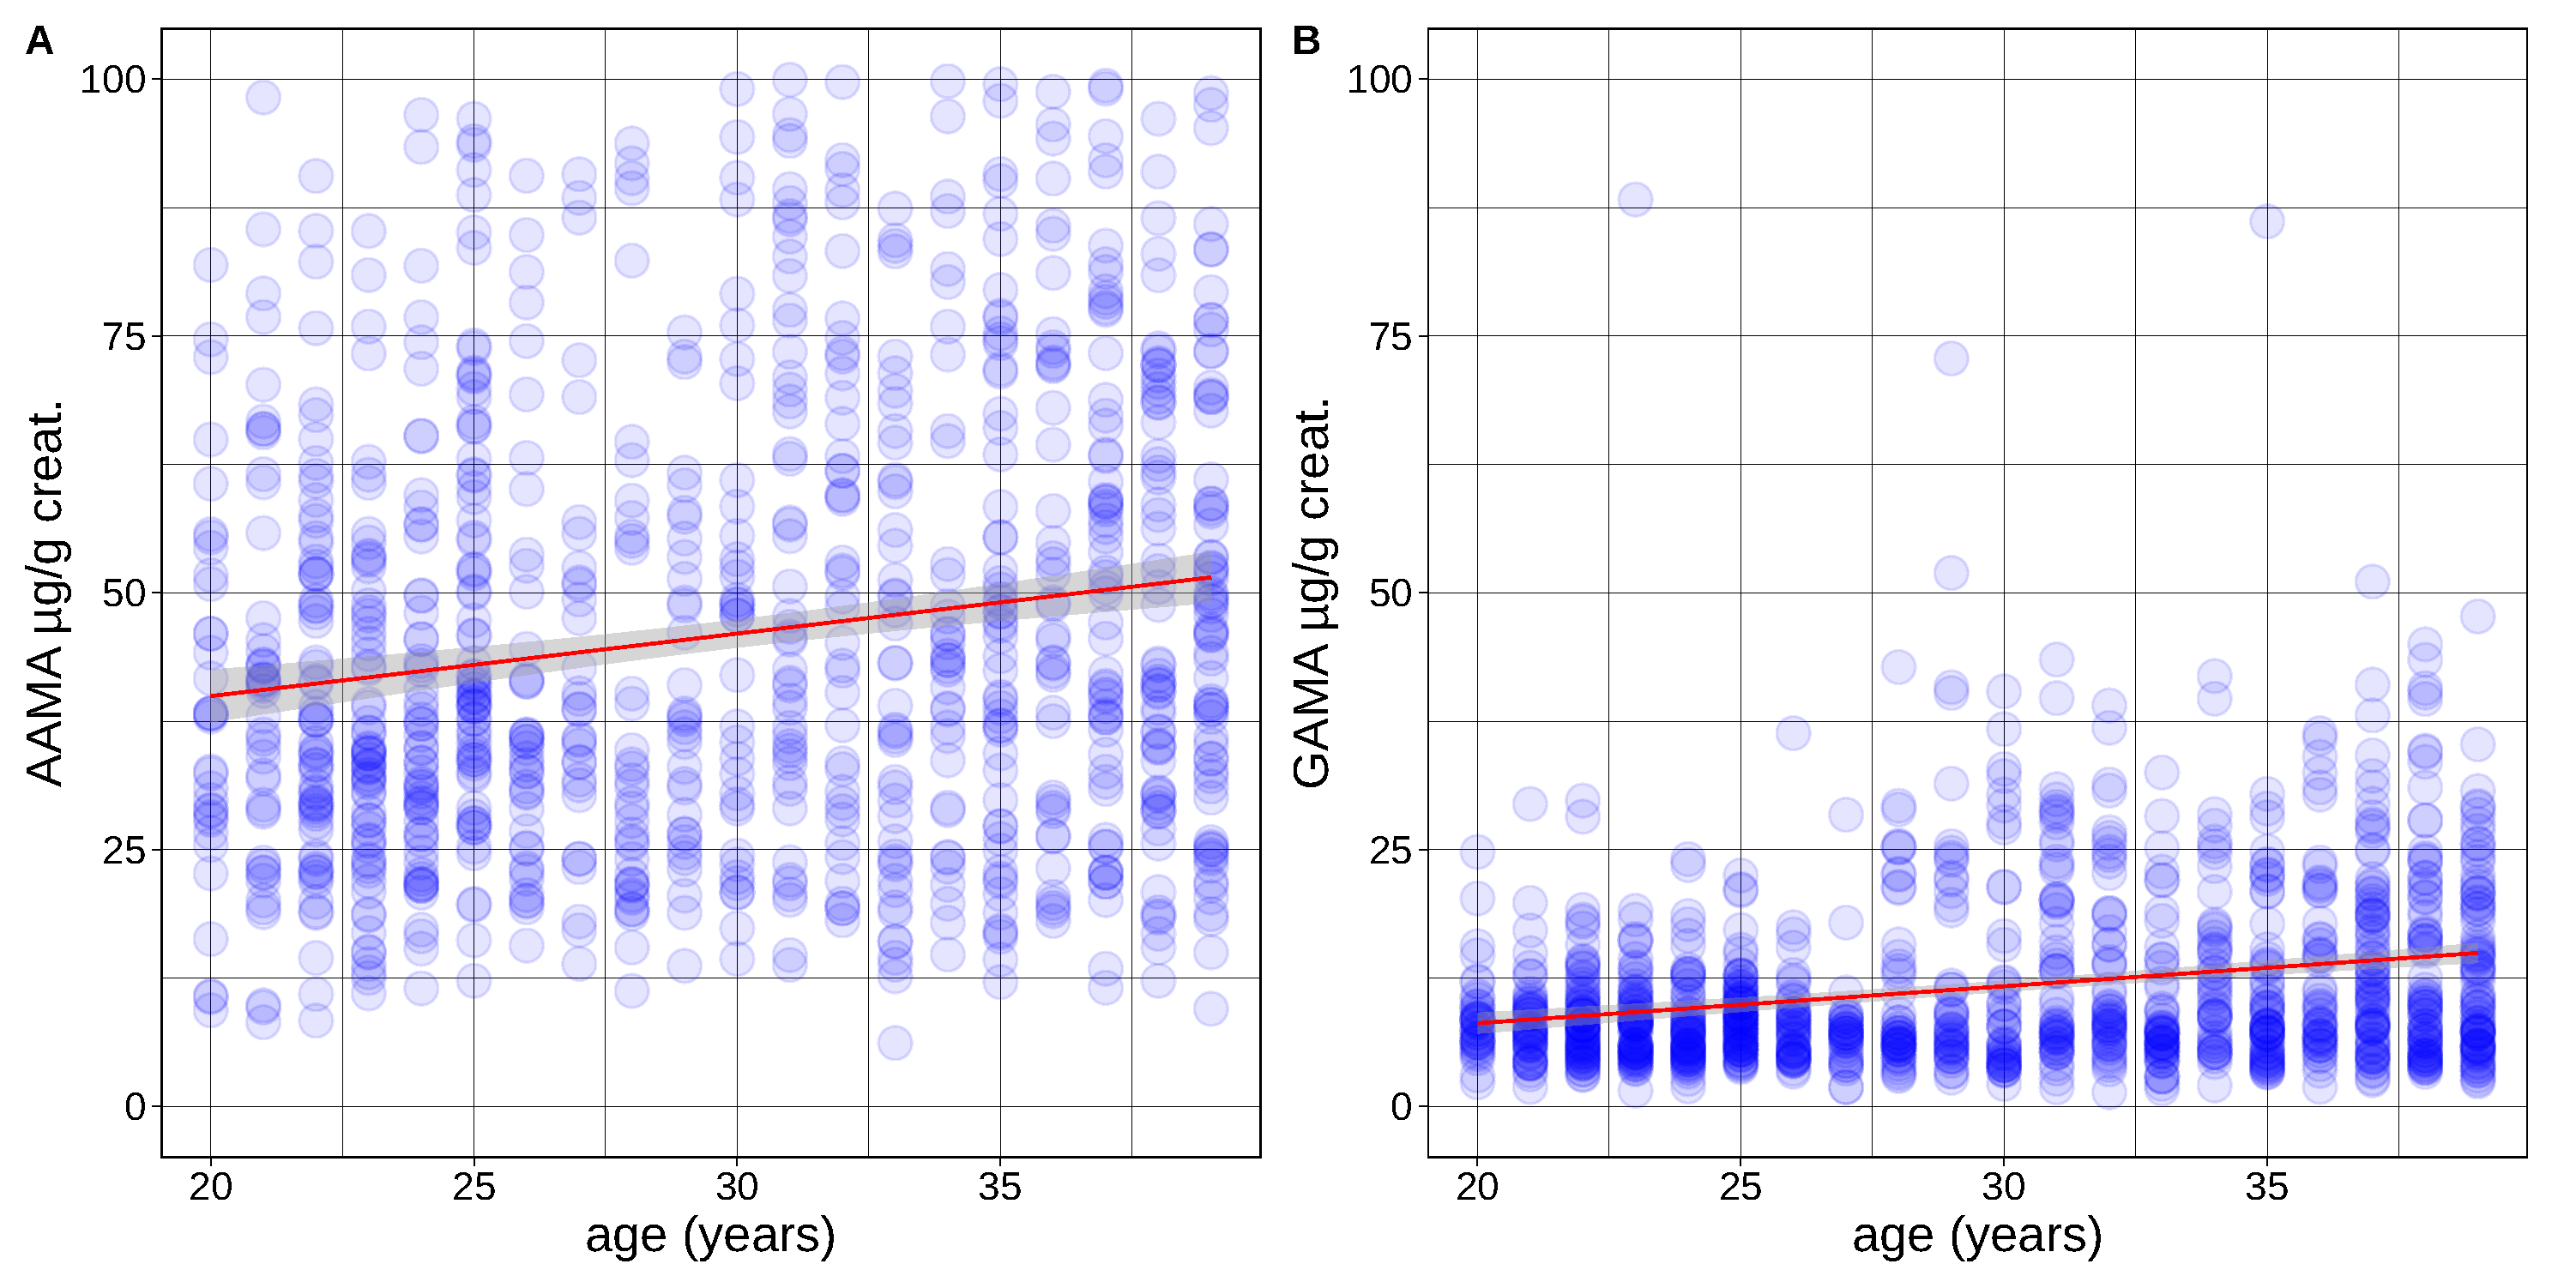
3.3. Non-Smoking Adults (20–39 Years)
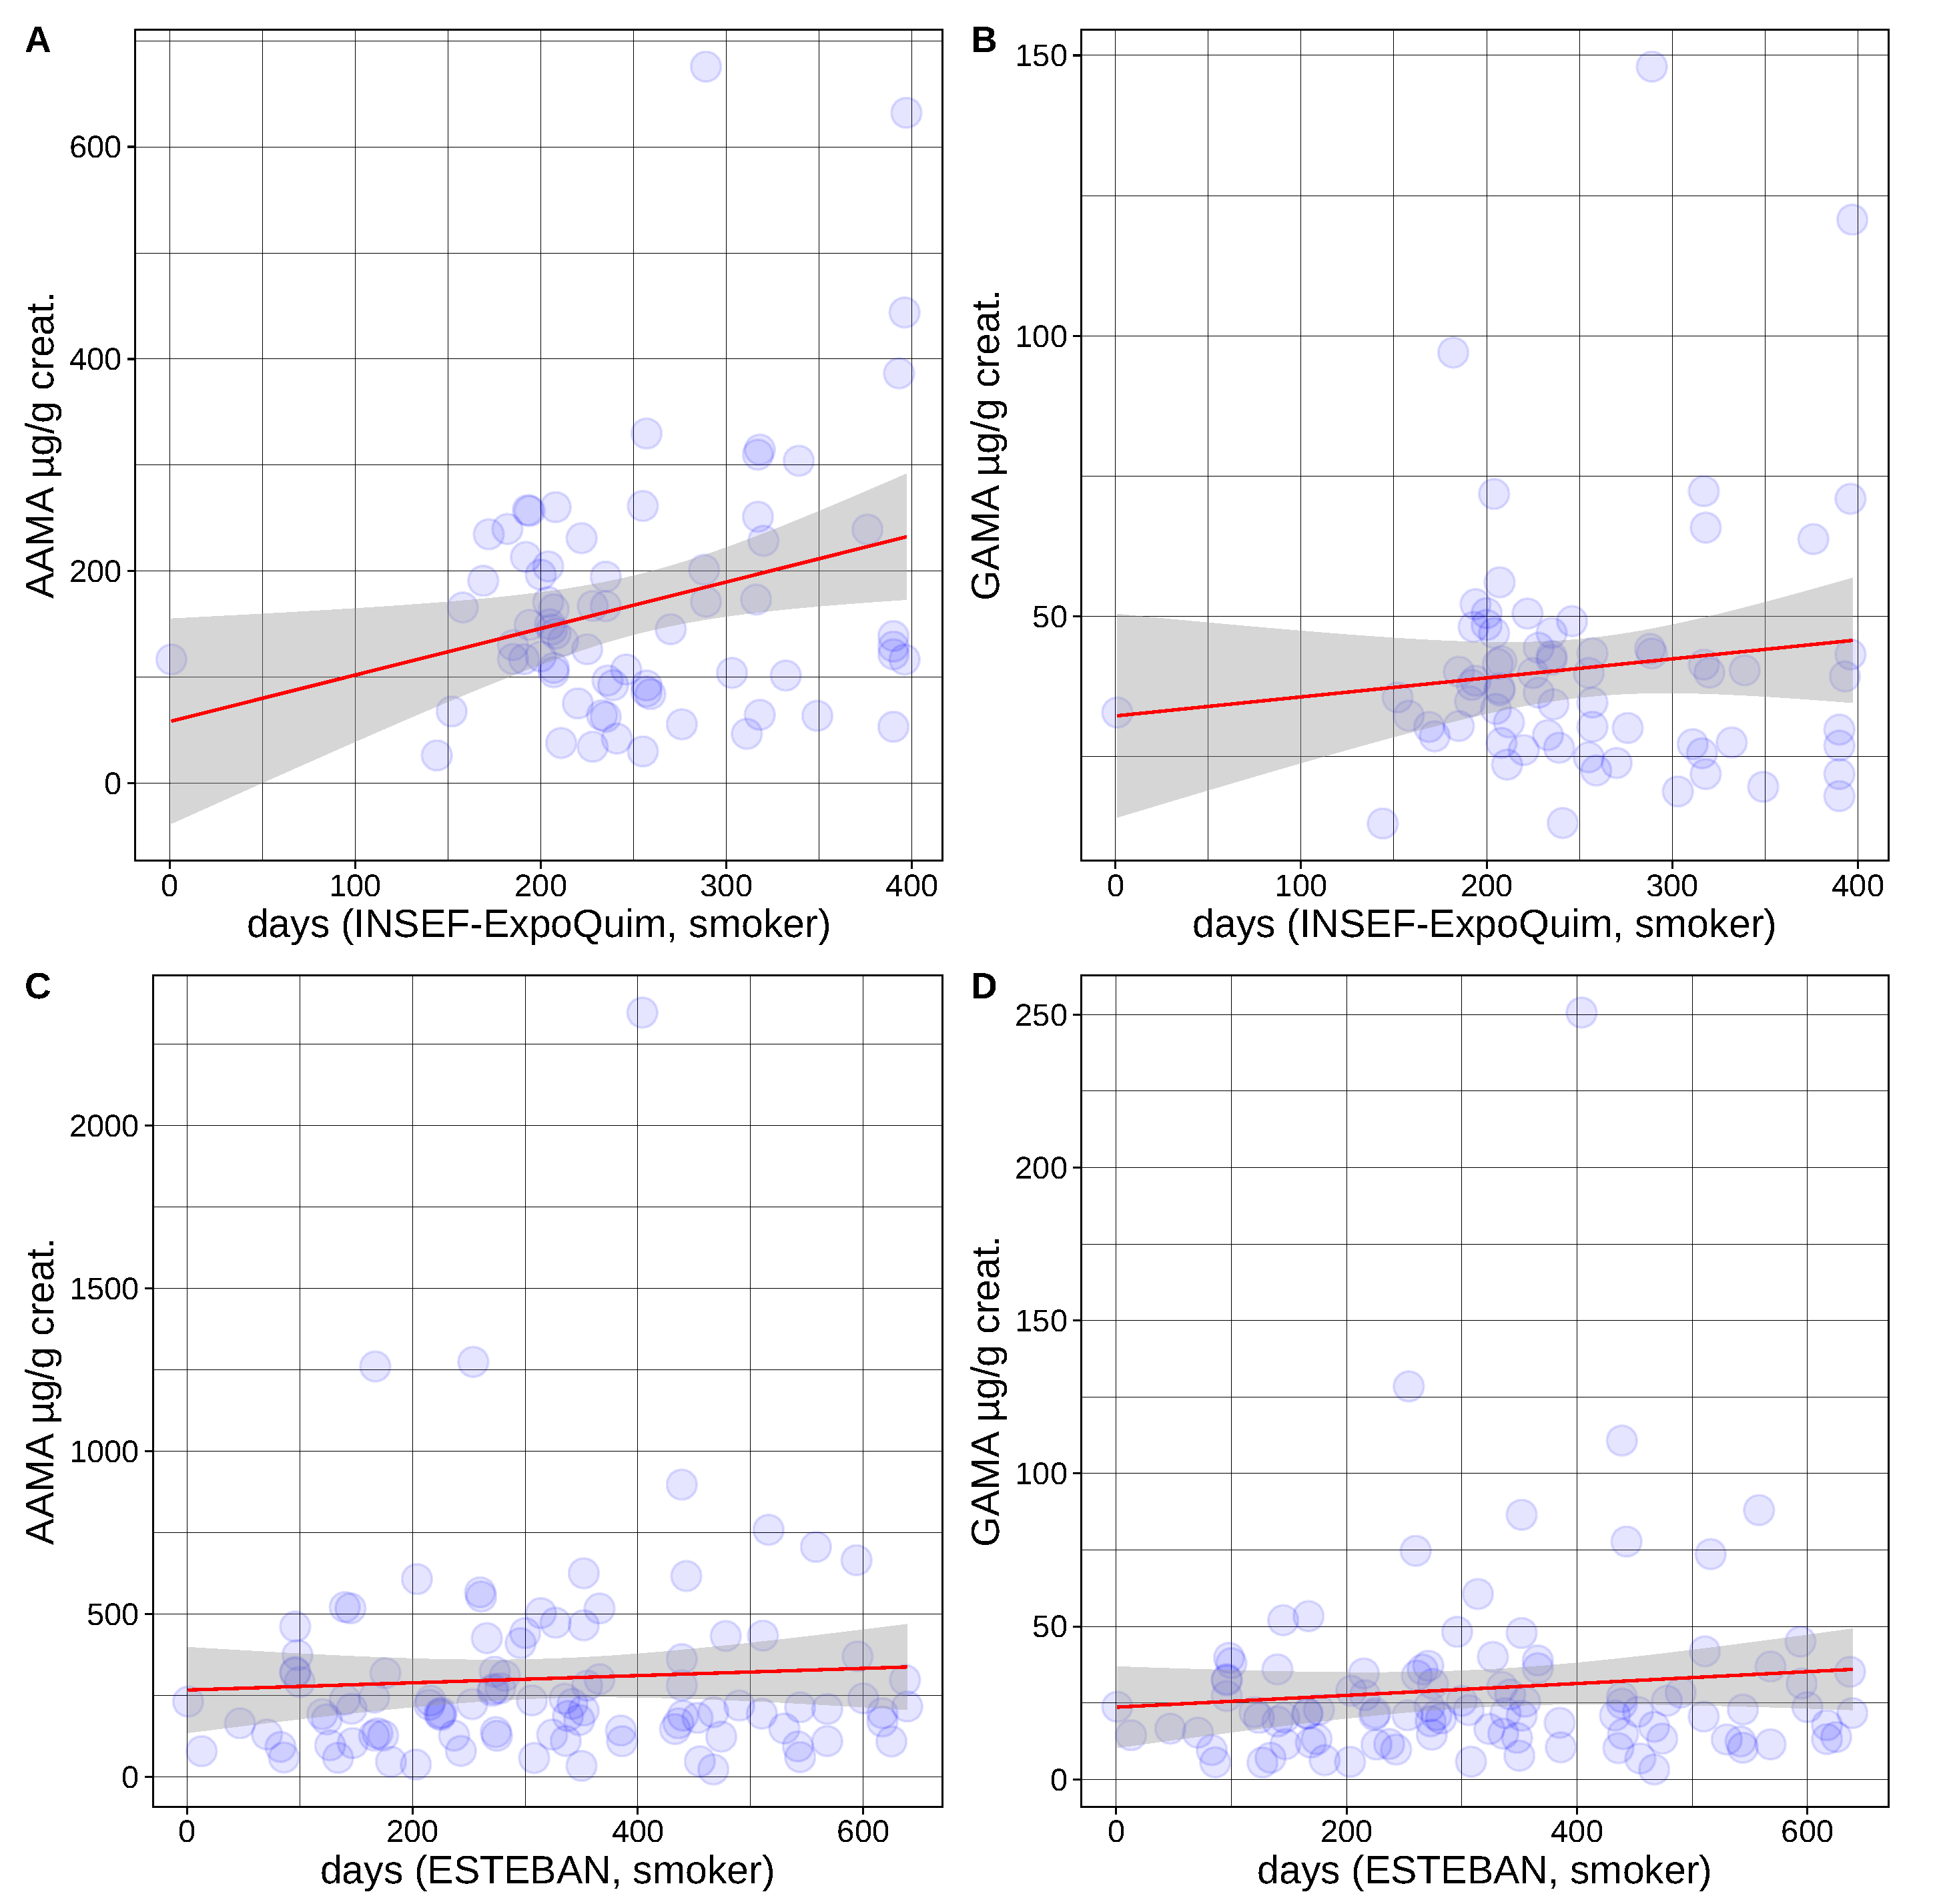
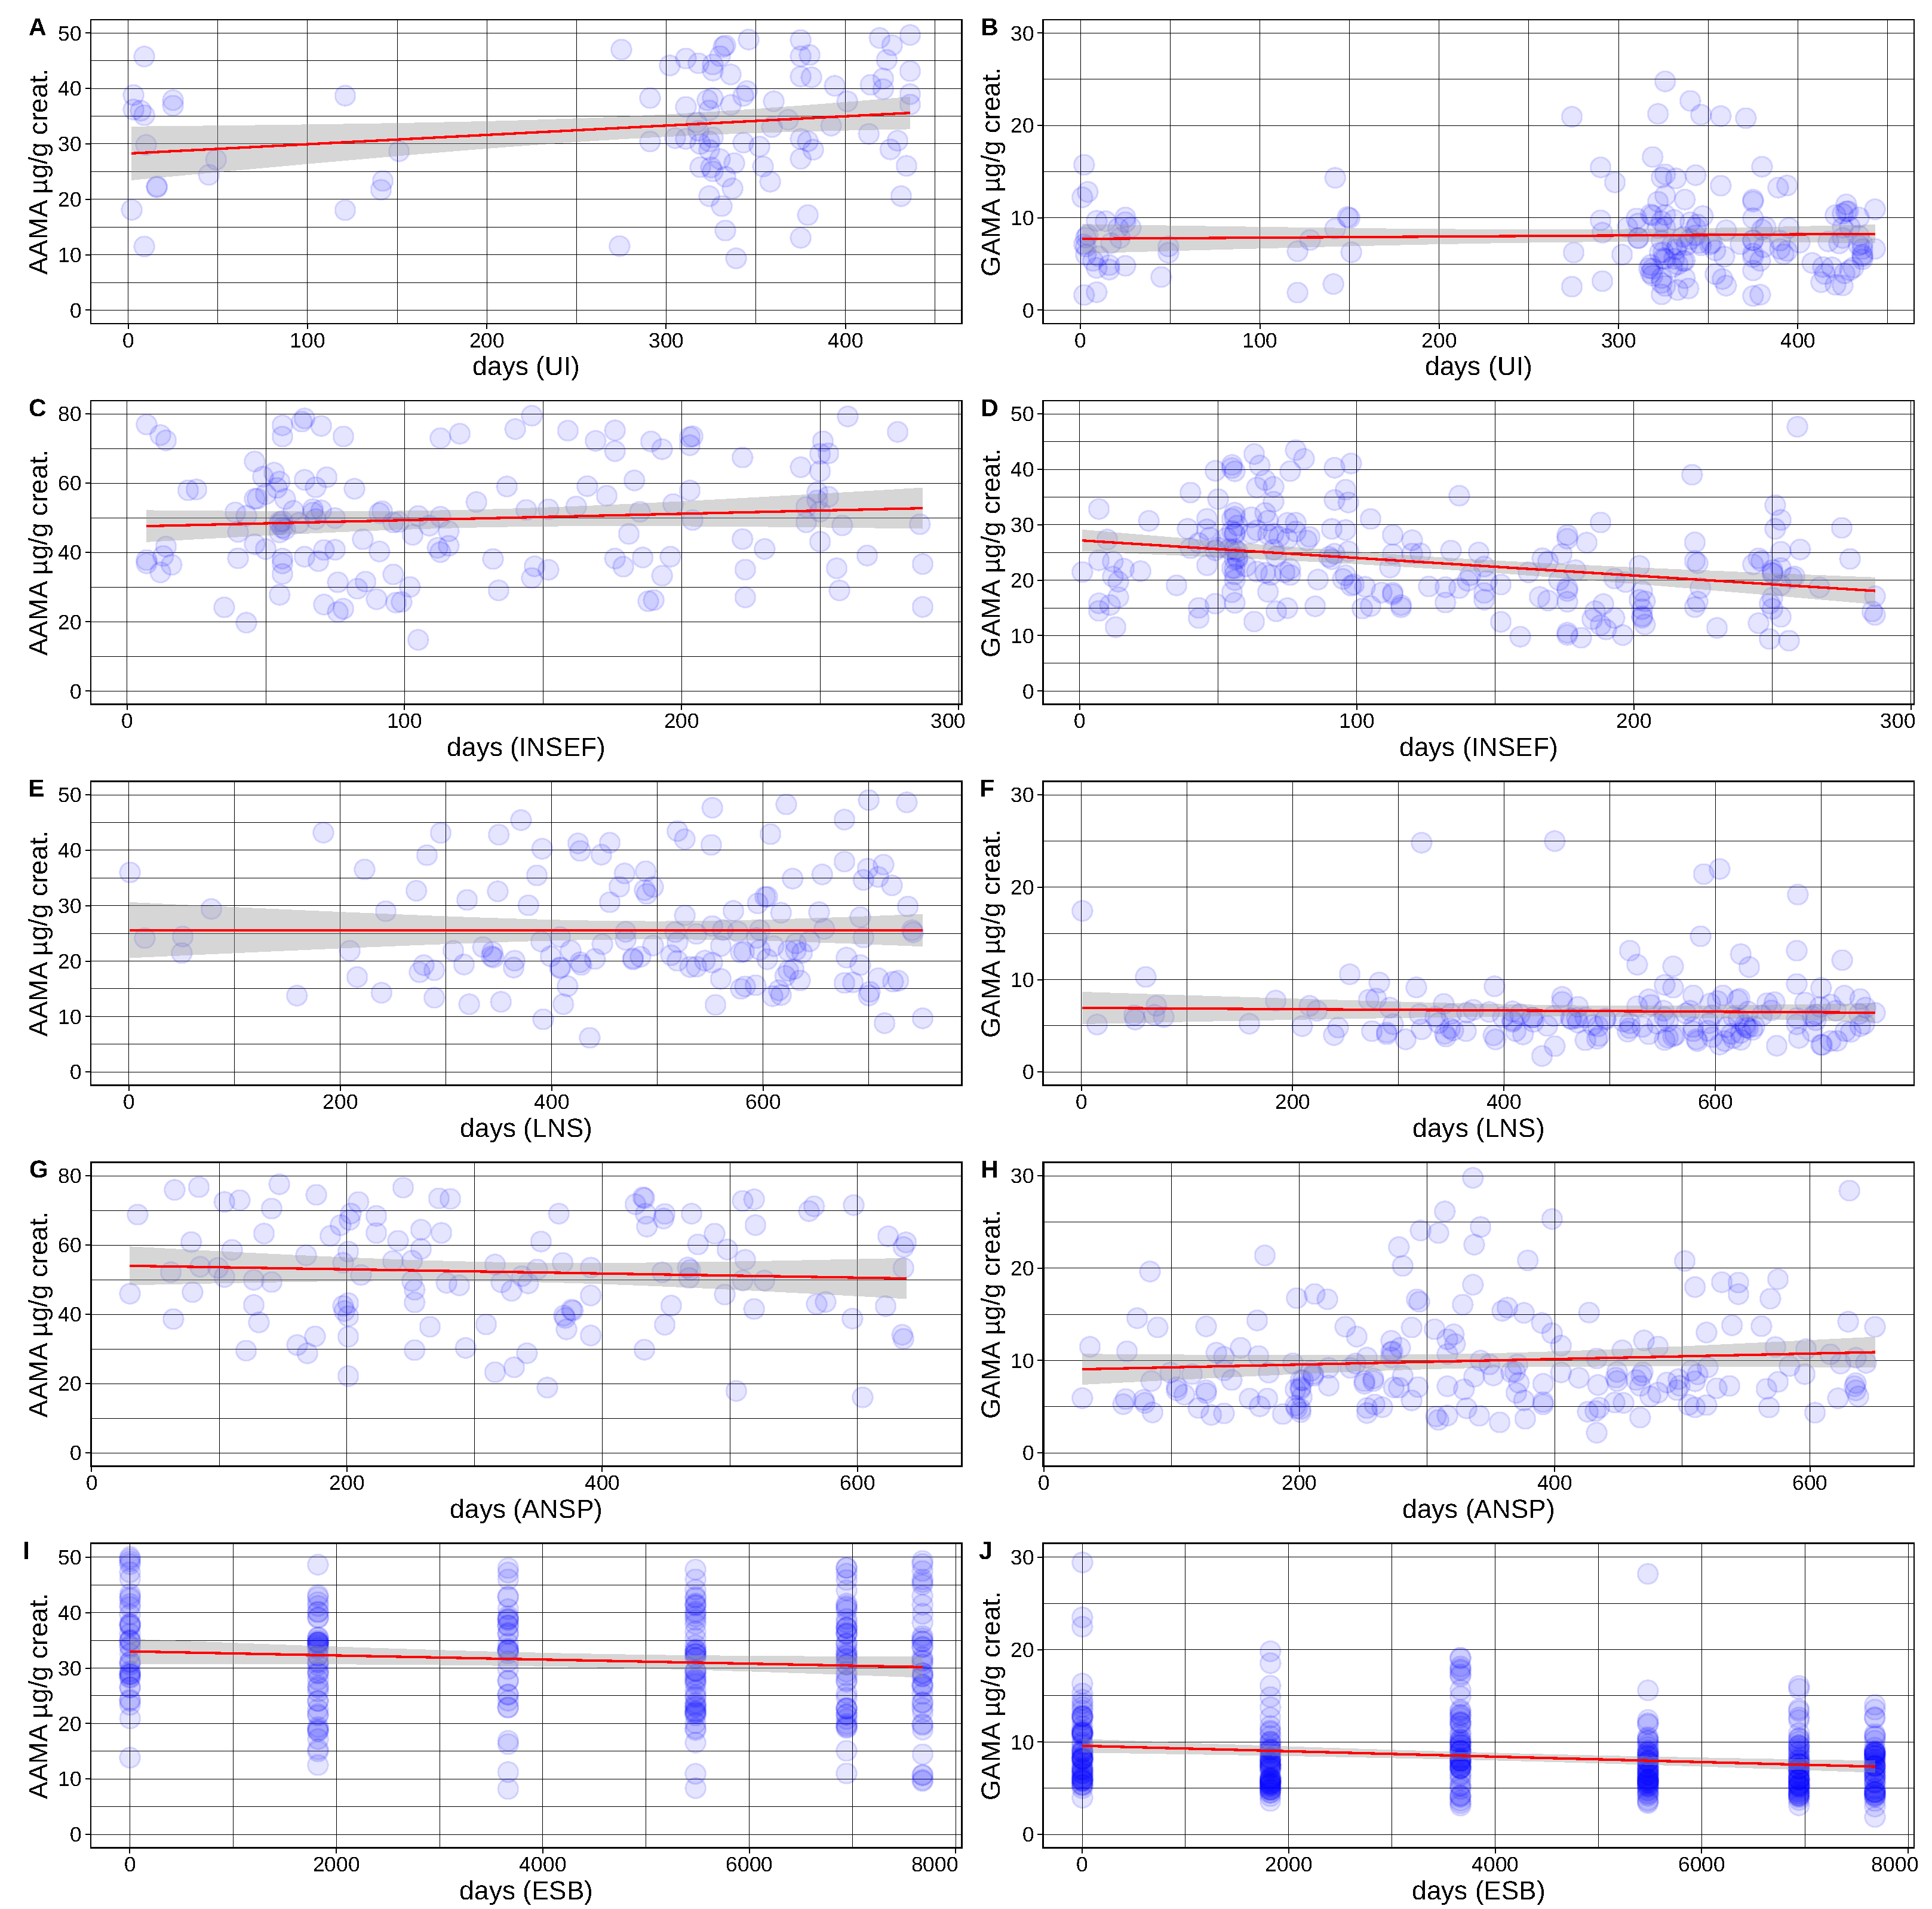
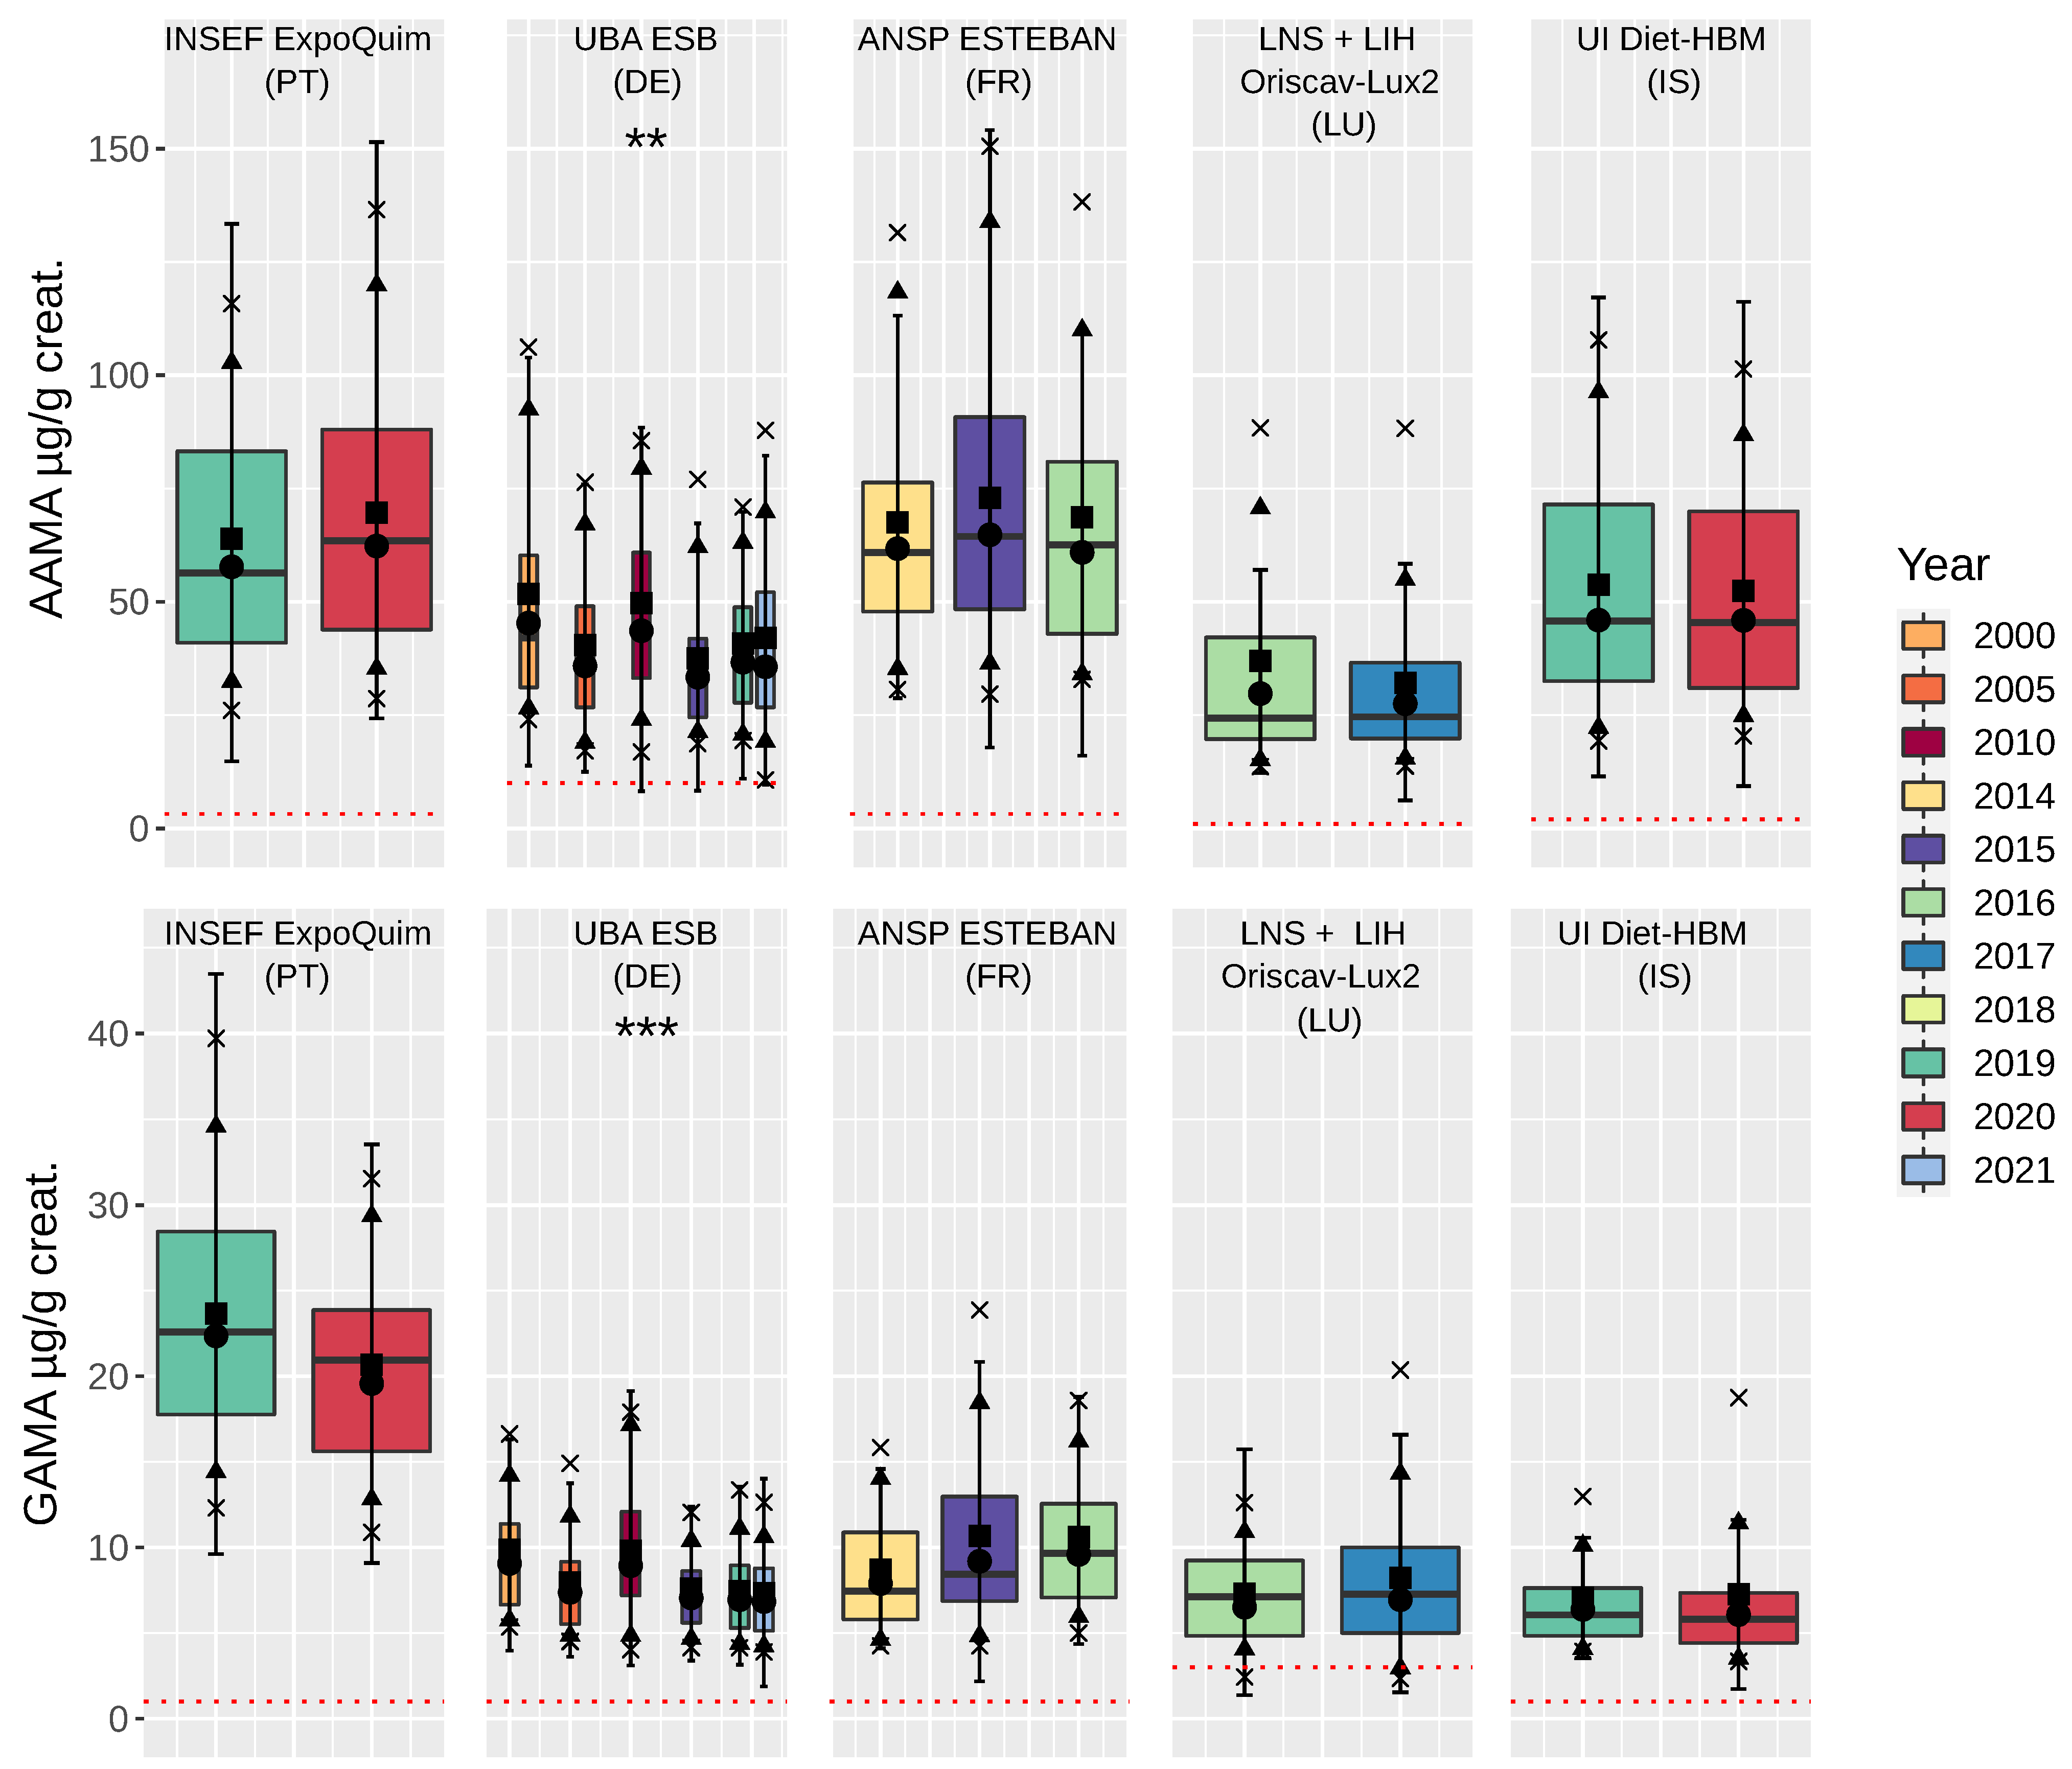
3.4. Smoking Adults (20–39 Years)
4. Discussion
Author Contributions
Funding
Institutional Review Board Statement
Informed Consent Statement
Data Availability Statement
Acknowledgments
Conflicts of Interest
Abbreviations
| AAMA | N-acetyl-S-(carbamoylethyl)-l-cysteine) |
| GAMA | N-acetyl-S-(1-carbamoyl-2-hydroxyethyl)-l-cysteine) |
| HBM4EU | Human Biomonitoring for European Union |
| CYP2E1 | Cytochrome P450 2E1 |
Appendix A

| Study | AAMA (ln(µg/g Creatinine)/Day) | GAMA(ln(µg/g Creatinine)/Day) |
|---|---|---|
| UBA, GerES V (Germany), children | s: 0.0002, *** | s: 0.0003, *** |
| EPIUD, NAC II (Italy), children | s: 0.0008, *** | s: 0.0003, ns |
| ANSP, ESTEBAN (France), children | s: 0.0004, ns | s: −0.0003, ns |
| Study | AAMA (ln(µg/g Creatinine)/Day) | GAMA (ln(µg/g Creatinine)/Day) |
|---|---|---|
| UI (Diet-HBM, Iceland) | s: 0.0003, ns | s: 0.0001, ns |
| INSEF (ExpoQuim, Portugal) | s: 0.0005, ns | s: −0.0013, *** |
| LNS + LIH (Oriscav-Lux2, Luxembourg) | s: 0.00001, ns | s: −0.0001, ns |
| ANSP (ESTEBAN, France) | s: 0.0005, ns | s: 0.0005, ns |
| UBA (ESB, Germany) | s: −0.00003, ** | s: −0.00003, *** |
Appendix B
| Study | Pop | Type | Mean | Sd | Geom. Mean | Min | Max | Median | q10 | q25 | q75 | q90 |
|---|---|---|---|---|---|---|---|---|---|---|---|---|
| IS-UI | 171 | AAMA-crt | 59.7 | 52.7 | 48.39 | 9.36 | 521.5 | 45.83 | 24.08 | 31.11 | 71.76 | 96.15 |
| IS-UI | 171 | AAMA | 80.92 | 68.97 | 61.47 | 7.85 | 620.58 | 60.17 | 24.97 | 35.11 | 108.15 | 154.35 |
| IS-UI | 171 | GAMA-crt | 8.48 | 5.76 | 7.15 | 1.53 | 51.93 | 7.28 | 3.37 | 5.34 | 9.96 | 14.27 |
| IS-UI | 171 | GAMA | 12.13 | 9.68 | 8.84 | 1.5 | 61.8 | 9.97 | 3.13 | 5.13 | 15.55 | 23.03 |
| IS-UI | 171 | AGE | 30.63 | 5.37 | 30.13 | 20 | 39 | 30 | 23 | 26 | 35 | 38 |
| DE-ESB | 354 | AAMA-crt | 43.75 | 24.67 | 38.21 | 8.19 | 148.21 | 36.51 | 21.46 | 28.17 | 52.94 | 74.31 |
| DE-ESB | 354 | AAMA | 37.56 | 31.19 | 28.54 | 5 | 250 | 28.4 | 11.66 | 17.43 | 46.78 | 72.84 |
| DE-ESB | 354 | GAMA-crt | 8.35 | 3.76 | 7.67 | 1.89 | 29.44 | 7.66 | 4.6 | 5.8 | 9.75 | 12.85 |
| DE-ESB | 354 | GAMA | 7 | 4.99 | 5.73 | 0.5 | 38.1 | 5.95 | 2.6 | 3.8 | 8.3 | 12.57 |
| DE-ESB | 354 | AGE | 23.42 | 2.13 | 23.32 | 20 | 29 | 23 | 21 | 22 | 25 | 26 |
| PT-INSEF | 212 | AAMA-crt | 69.59 | 40.49 | 60.8 | 14.78 | 281.82 | 58.09 | 33.34 | 41.89 | 85.89 | 113.85 |
| PT-INSEF | 212 | AAMA | 84.27 | 60.47 | 67.59 | 7.5 | 347.67 | 66.72 | 28.45 | 44.82 | 108.61 | 162.61 |
| PT-INSEF | 212 | GAMA-crt | 23.79 | 9.58 | 22.2 | 9.09 | 86.16 | 22.38 | 13.8 | 17.37 | 28.31 | 34.62 |
| PT-INSEF | 212 | GAMA | 28.88 | 16.51 | 24.68 | 5.39 | 114.04 | 25.17 | 12.23 | 16.63 | 37.57 | 52.23 |
| PT-INSEF | 212 | AGE | 34.69 | 3.35 | 34.52 | 28 | 39 | 35 | 30 | 32 | 38 | 39 |
| LU-LNS+LIH | 157 | AAMA-crt | 35.58 | 38.44 | 28.48 | 6.17 | 413.73 | 24.45 | 15.46 | 19.79 | 39.11 | 56.77 |
| LU-LNS+LIH | 157 | AAMA | 69.3 | 81.45 | 47.7 | 4.2 | 730.1 | 49 | 17.32 | 25.8 | 78.3 | 132.54 |
| LU-LNS+LIH | 157 | GAMA-crt | 7.22 | 5.82 | 6.15 | 1.73 | 43.5 | 5.84 | 3.64 | 4.45 | 7.41 | 10.89 |
| LU-LNS+LIH | 157 | GAMA | 14.2 | 15.72 | 10.29 | 1.4 | 136.8 | 10.6 | 3.66 | 6.4 | 16 | 23.16 |
| LU-LNS+LIH | 157 | AGE | 33.54 | 3.82 | 33.32 | 25 | 39 | 33 | 28 | 31 | 37 | 38.4 |
| Study | Pop | Type | Mean | Sd | Geom. Mean | Min | Max | Median | q10 | q25 | q75 | q90 |
|---|---|---|---|---|---|---|---|---|---|---|---|---|
| NO-NIPH | 289 | AAMA-crt | 63.61 | 57.1 | 53.08 | 9.44 | 801.62 | 52.14 | 27.59 | 35.02 | 75.72 | 102.5 |
| NO-NIPH | 289 | AAMA | 75.92 | 105.85 | 56.6 | 8.1 | 1615 | 53.7 | 25.96 | 35.1 | 84.8 | 135.88 |
| NO-NIPH | 289 | GAMA-crt | 9.54 | 5.33 | 8.66 | 3.17 | 65.32 | 8.38 | 5.28 | 6.64 | 10.96 | 14.28 |
| NO-NIPH | 289 | GAMA | 11.13 | 9.95 | 9.24 | 1.7 | 131.6 | 8.9 | 4.68 | 6.7 | 12.6 | 18.62 |
| NO-NIPH | 289 | AGE | 9.82 | 1.17 | 9.74 | 7 | 11 | 10 | 8 | 9 | 11 | 11 |
| DE-GerES V | 2218 | AAMA-crt | 73.03 | 63.3 | 59.93 | 10.11 | 1000 | 56.93 | 30.03 | 40.05 | 83.63 | 125.61 |
| DE-GerES V | 2218 | AAMA | 92.56 | 89.15 | 70.05 | 2.8 | 1490 | 70.05 | 28.47 | 45.23 | 109 | 171 |
| DE-GerES V | 2218 | GAMA-crt | 14.53 | 9.51 | 12.51 | 2.42 | 147.01 | 12.21 | 6.52 | 8.62 | 17.55 | 24.72 |
| DE-GerES V | 2218 | GAMA | 17.83 | 12.23 | 14.62 | 0.5 | 130 | 15 | 6.5 | 10 | 22.3 | 31.63 |
| DE-GerES V | 2218 | AGE | 10.3 | 4.08 | 9.35 | 3 | 18 | 11 | 4 | 7 | 14 | 16 |
| IT-EPIUD | 300 | AAMA-crt | 100.24 | 94.61 | 78.58 | 1.46 | 993.34 | 78.68 | 37.97 | 55.76 | 119.37 | 180.35 |
| IT-EPIUD | 300 | AAMA | 88.59 | 73.93 | 66.03 | 1.6 | 757.02 | 72.51 | 22.22 | 46.48 | 109.65 | 160.86 |
| IT-EPIUD | 300 | GAMA-crt | 34.54 | 19.8 | 29.9 | 0.46 | 174.84 | 30.74 | 16.65 | 22.36 | 39.94 | 55.41 |
| IT-EPIUD | 300 | GAMA | 30.89 | 20.17 | 25.13 | 0.5 | 174.66 | 27.11 | 10.15 | 17.86 | 38.93 | 54.4 |
| IT-EPIUD | 300 | AGE | 7.02 | 0.18 | 7.02 | 6 | 8 | 7 | 7 | 7 | 7 | 7 |
| FR-ESTEBAN | 197 | AAMA-crt | 90.51 | 70.95 | 73.17 | 16.02 | 493.12 | 68.79 | 36.76 | 49.25 | 108.99 | 168.24 |
| FR-ESTEBAN | 197 | AAMA | 83.1 | 70.99 | 65.62 | 5.73 | 588.88 | 67.4 | 28.56 | 42.51 | 101.59 | 148.16 |
| FR-ESTEBAN | 197 | GAMA-crt | 10.91 | 8.72 | 9.17 | 2.18 | 88.3 | 8.53 | 4.86 | 6.5 | 12.84 | 18.45 |
| FR-ESTEBAN | 197 | GAMA | 10.11 | 7.87 | 8.22 | 0.5 | 69.96 | 8.5 | 3.53 | 5.64 | 12.77 | 17.47 |
| FR-ESTEBAN | 197 | AGE | 32.72 | 5.23 | 32.26 | 20 | 39 | 34 | 25 | 29 | 37 | 39 |
| Study | Pop | Sype | Mean | Sd | Geom. Mean | Min | Max | Median | q10 | q25 | q75 | q90 |
|---|---|---|---|---|---|---|---|---|---|---|---|---|
| PT-INSEF | 72 | AAMA-crt | 168.58 | 119.23 | 135.92 | 26.38 | 675.61 | 140.08 | 56.39 | 93.83 | 217.21 | 299.83 |
| PT-INSEF | 72 | AAMA | 228.03 | 187.44 | 164.47 | 29.3 | 893.75 | 175.18 | 47.36 | 95.81 | 293.13 | 498.81 |
| PT-INSEF | 71 | GAMA-crt | 40.87 | 21.73 | 36.91 | 13.09 | 148 | 37.17 | 22.53 | 28.08 | 44.33 | 63.78 |
| PT-INSEF | 71 | GAMA | 52.04 | 30.52 | 44.22 | 13.55 | 170.69 | 43.53 | 19.71 | 29.46 | 66.36 | 92.78 |
| PT-INSEF | 72 | AGE | 34.11 | 2.96 | 33.98 | 28 | 39 | 34 | 30 | 32 | 36 | 38 |
| FR-ESTEBAN | 102 | AAMA-crt | 302.29 | 302.67 | 218.98 | 22.98 | 2346.83 | 217.83 | 81.12 | 131.47 | 367.95 | 565.61 |
| FR-ESTEBAN | 102 | AAMA | 288.69 | 202.08 | 225.61 | 39.78 | 959.76 | 227.42 | 81.44 | 143 | 396.5 | 548.49 |
| FR-ESTEBAN | 102 | GAMA-crt | 29.79 | 30.68 | 22.32 | 3.25 | 250.68 | 21.7 | 9.8 | 13.99 | 34.46 | 51.66 |
| FR-ESTEBAN | 102 | GAMA | 27.62 | 16.66 | 23 | 5.63 | 115.89 | 25.63 | 9.36 | 14.42 | 38.28 | 47.58 |
| FR-ESTEBAN | 102 | AGE | 32.38 | 4.78 | 32.01 | 20 | 39 | 33 | 26 | 29 | 36 | 38 |
| Study | Pop | Year | Sample | Mean | SD | Geom. Mean | Min | Max | Median | q10 | q25 | q75 | q90 |
|---|---|---|---|---|---|---|---|---|---|---|---|---|---|
| FR-ESTEBAN | 55 | 2014 | AAMA | 103.36 | 74.22 | 81.15 | 21.14 | 349.44 | 77.24 | 35.05 | 48.13 | 141.23 | 213.73 |
| FR-ESTEBAN | 207 | 2015 | AAMA | 115.66 | 130.22 | 89.05 | 11.43 | 1309.23 | 84.65 | 44.26 | 57.86 | 126.99 | 191.81 |
| FR-ESTEBAN | 37 | 2016 | AAMA | 89.47 | 50.36 | 76.88 | 21.67 | 218.46 | 68.104 | 40.81 | 56.70 | 113.32 | 170.74 |
| FR-ESTEBAN | 55 | 2014 | GAMA | 13.93 | 8.53 | 11.89 | 4.08 | 44.85 | 10.71 | 6.10 | 8.44 | 18.65 | 23.32 |
| FR-ESTEBAN | 207 | 2015 | GAMA | 15.19 | 11.18 | 13.00 | 2.19 | 110.44 | 12.41 | 7.25 | 9.26 | 17.55 | 22.82 |
| FR-ESTEBAN | 37 | 2016 | GAMA | 12.64 | 5.30 | 11.58 | 4.92 | 25.98 | 11.72 | 6.82 | 9.09 | 16.36 | 19.10 |
| NO-NEBII | 289 | 2016 | AAMA | 63.61 | 57.10 | 53.08 | 9.44 | 801.62 | 52.14 | 27.59 | 35.02 | 75.72 | 102.50 |
| NO-NEBII | 289 | 2016 | GAMA | 9.54 | 5.33 | 8.66 | 3.17 | 65.32 | 8.38 | 5.28 | 6.64 | 10.96 | 14.28 |
| IT-EPIUD | 18 | 2014 | AAMA | 58.14 | 49.87 | 42.46 | 12.89 | 224.45 | 47.98 | 14.88 | 19.50 | 78.82 | 97.51 |
| IT-EPIUD | 133 | 2015 | AAMA | 91.12 | 92.77 | 73.63 | 16.90 | 992.60 | 70.34 | 36.48 | 54.22 | 109.00 | 146.45 |
| IT-EPIUD | 149 | 2016 | AAMA | 113.47 | 97.86 | 89.71 | 1.46 | 993.34 | 93.98 | 45.61 | 59.59 | 134.95 | 186.04 |
| IT-EPIUD | 18 | 2014 | GAMA | 23.80 | 10.52 | 21.67 | 11.12 | 51.85 | 20.88 | 12.31 | 14.79 | 29.91 | 35.51 |
| IT-EPIUD | 133 | 2015 | GAMA | 34.17 | 16.09 | 30.84 | 8.26 | 97.50 | 31.25 | 18.05 | 22.23 | 41.92 | 55.17 |
| IT-EPIUD | 149 | 2016 | GAMA | 36.16 | 22.99 | 30.24 | 0.46 | 174.84 | 30.94 | 16.89 | 23.37 | 40.05 | 56.45 |
| DE-GerES V | 852 | 2015 | AAMA | 67.52 | 57.27 | 55.60 | 11.04 | 780.10 | 51.61 | 27.23 | 37.24 | 78.91 | 115.60 |
| DE-GerES V | 849 | 2016 | AAMA | 69.68 | 53.51 | 59.07 | 10.11 | 774.44 | 56.24 | 30.88 | 41.31 | 82.01 | 121.66 |
| DE-GerES V | 517 | 2017 | AAMA | 87.63 | 82.46 | 69.44 | 15.31 | 1000.00 | 65.51 | 33.94 | 45.79 | 96.95 | 146.11 |
| DE-GerES V | 852 | 2015 | GAMA | 13.46 | 8.20 | 11.71 | 2.49 | 89.38 | 11.68 | 6.17 | 8.32 | 16.38 | 22.31 |
| DE-GerES V | 849 | 2016 | GAMA | 13.27 | 7.37 | 11.72 | 2.42 | 69.67 | 11.47 | 6.42 | 8.31 | 16.06 | 22.77 |
| DE-GerES V | 517 | 2017 | GAMA | 18.36 | 12.99 | 15.53 | 5.02 | 147.01 | 15.26 | 7.85 | 10.29 | 22.82 | 30.82 |
| Study | Pop | Year | Sample | Mean | SD | Geom. Mean | Min | Max | Median | q10 | q25 | q75 | q90 |
|---|---|---|---|---|---|---|---|---|---|---|---|---|---|
| DE-ESB | 60 | 2000 | AAMA | 51.73 | 29.47 | 45.32 | 13.85 | 145.13 | 42.04 | 26.55 | 31.12 | 60.26 | 92.44 |
| DE-ESB | 60 | 2005 | AAMA | 40.43 | 21.62 | 35.85 | 12.50 | 131.74 | 34.61 | 18.97 | 26.70 | 49.04 | 67.15 |
| DE-ESB | 60 | 2010 | AAMA | 49.73 | 25.77 | 43.62 | 8.19 | 148.21 | 44.47 | 24.00 | 33.17 | 60.86 | 79.42 |
| DE-ESB | 60 | 2015 | AAMA | 37.51 | 20.40 | 33.37 | 8.34 | 132.29 | 32.57 | 21.33 | 24.50 | 41.90 | 62.11 |
| DE-ESB | 60 | 2019 | AAMA | 40.86 | 20.55 | 36.66 | 11.00 | 122.50 | 36.30 | 20.72 | 27.74 | 48.80 | 63.08 |
| DE-ESB | 54 | 2021 | AAMA | 42.08 | 25.64 | 35.67 | 9.63 | 144.29 | 34.83 | 19.16 | 26.71 | 52.13 | 69.79 |
| DE-ESB | 60 | 2000 | GAMA | 9.87 | 4.59 | 9.07 | 3.98 | 29.44 | 8.69 | 5.35 | 6.67 | 11.37 | 14.21 |
| DE-ESB | 60 | 2005 | GAMA | 7.95 | 3.37 | 7.38 | 3.61 | 19.82 | 7.28 | 4.85 | 5.52 | 9.17 | 11.81 |
| DE-ESB | 60 | 2010 | GAMA | 9.80 | 4.11 | 8.94 | 3.11 | 19.14 | 9.05 | 4.85 | 7.20 | 12.10 | 17.15 |
| DE-ESB | 60 | 2015 | GAMA | 7.60 | 3.57 | 7.06 | 3.39 | 28.20 | 6.89 | 4.67 | 5.61 | 8.63 | 10.39 |
| DE-ESB | 60 | 2019 | GAMA | 7.45 | 2.89 | 6.95 | 3.15 | 16.08 | 7.03 | 4.38 | 5.30 | 8.95 | 11.11 |
| DE-ESB | 54 | 2021 | GAMA | 7.35 | 2.64 | 6.85 | 1.89 | 14.02 | 7.39 | 4.25 | 5.14 | 8.79 | 10.62 |
| IC-DietHBM | 27 | 2019 | AAMA | 53.79 | 28.82 | 45.97 | 11.48 | 117.17 | 45.77 | 22.26 | 32.50 | 71.49 | 96.27 |
| IC-DietHBM | 144 | 2020 | AAMA | 60.81 | 55.99 | 48.86 | 9.36 | 521.50 | 45.94 | 25.26 | 31.14 | 71.57 | 95.50 |
| IC-DietHBM | 27 | 2019 | GAMA | 7.36 | 3.15 | 6.60 | 1.64 | 15.74 | 7.13 | 4.07 | 5.10 | 9.24 | 10.91 |
| IC-DietHBM | 144 | 2020 | GAMA | 8.68 | 6.10 | 7.26 | 1.53 | 51.93 | 7.38 | 3.20 | 5.35 | 10.11 | 14.35 |
| POR-INSEF | 175 | 2019 | AAMA | 69.56 | 41.75 | 60.48 | 14.78 | 281.82 | 57.97 | 32.90 | 41.54 | 85.35 | 112.82 |
| POR-INSEF | 37 | 2020 | AAMA | 69.71 | 33.90 | 62.32 | 24.29 | 159.59 | 63.47 | 35.30 | 43.88 | 88.02 | 119.92 |
| POR-INSEF | 175 | 2019 | GAMA | 24.30 | 9.83 | 22.68 | 9.62 | 86.16 | 22.70 | 14.43 | 17.80 | 28.68 | 35.59 |
| POR-INSEF | 37 | 2010 | GAMA | 21.39 | 7.90 | 20.05 | 9.09 | 47.70 | 21.22 | 12.93 | 15.77 | 23.95 | 30.02 |
| Study | Pop | Year | Sample | Mean | SD | Geom. Mean | Min | Max | Median | q10 | q25 | q75 | q90 |
|---|---|---|---|---|---|---|---|---|---|---|---|---|---|
| FR-ESTEBAN | 36 | 2014 | AAMA | 70.72 | 34.64 | 63.64 | 28.74 | 182.77 | 61.75 | 35.65 | 48.59 | 76.94 | 126.40 |
| FR-ESTEBAN | 138 | 2015 | AAMA | 97.02 | 78.81 | 76.77 | 17.88 | 493.12 | 69.05 | 37.07 | 49.66 | 120.35 | 200.83 |
| FR-ESTEBAN | 23 | 2016 | AAMA | 82.40 | 55.11 | 68.23 | 16.02 | 257.73 | 69.79 | 35.03 | 43.25 | 95.25 | 141.77 |
| FR-ESTEBAN | 36 | 2014 | GAMA | 8.71 | 4.15 | 7.89 | 4.11 | 21.38 | 7.44 | 4.62 | 5.80 | 10.88 | 14.02 |
| FR-ESTEBAN | 138 | 2015 | GAMA | 11.54 | 9.89 | 9.47 | 2.18 | 88.30 | 8.51 | 4.85 | 6.88 | 13.30 | 20.40 |
| FR-ESTEBAN | 23 | 2016 | GAMA | 10.60 | 5.24 | 9.59 | 4.35 | 28.39 | 9.66 | 5.95 | 7.08 | 12.55 | 16.20 |
| LU-LNS+LIH | 34 | 2016 | AAMA | 37.01 | 30.90 | 29.75 | 12.23 | 169.78 | 24.30 | 15.14 | 19.71 | 42.14 | 70.68 |
| LU-LNS+LIH | 123 | 2017 | AAMA | 35.19 | 40.26 | 28.14 | 6.17 | 413.73 | 24.91 | 15.51 | 19.92 | 37.33 | 56.09 |
| LU-LNS+LIH | 34 | 2016 | GAMA | 7.07 | 4.06 | 6.38 | 3.54 | 24.82 | 6.07 | 4.09 | 4.85 | 7.64 | 10.11 |
| LU-LNS+LIH | 123 | 2017 | GAMA | 7.27 | 6.22 | 6.08 | 1.73 | 43.50 | 5.80 | 3.53 | 4.42 | 7.36 | 11.42 |
| POR-INSEF | 62 | 2019 | AAMA | 157.77 | 102.16 | 130.06 | 26.38 | 675.61 | 143.10 | 56.39 | 92.37 | 203.73 | 260.07 |
| POR-INSEF | 9 | 2020 | AAMA | 251.27 | 183.23 | 191.88 | 53.38 | 632.07 | 138.92 | 104.06 | 121.69 | 386.56 | 481.49 |
| POR-INSEF | 62 | 2019 | GAMA | 39.79 | 19.85 | 36.41 | 13.09 | 148.00 | 36.98 | 23.62 | 28.68 | 44.04 | 52.03 |
| POR-INSEF | 9 | 2020 | GAMA | 48.30 | 30.76 | 40.51 | 17.97 | 120.71 | 39.30 | 21.11 | 26.98 | 63.78 | 80.91 |
| Study | Pop | Year | Sample | Mean | SD | Geom. Mean | Min | Max | Median | q10 | q25 | q75 | q90 |
|---|---|---|---|---|---|---|---|---|---|---|---|---|---|
| FR-ESTEBAN | 27 | 2014 | AAMA | 255.54 | 238.11 | 189.25 | 46.65 | 1260.31 | 192.75 | 71.36 | 115.46 | 318.86 | 484.11 |
| FR-ESTEBAN | 64 | 2015 | AAMA | 322.55 | 337.86 | 227.84 | 22.98 | 2346.83 | 222.62 | 84.04 | 145.99 | 427.72 | 595.29 |
| FR-ESTEBAN | 11 | 2016 | AAMA | 299.19 | 196.00 | 248.76 | 108.99 | 706.27 | 216.37 | 110.05 | 183.06 | 333.85 | 665.53 |
| FR-ESTEBAN | 27 | 2014 | GAMA | 22.20 | 12.92 | 18.49 | 5.52 | 53.36 | 20.22 | 6.76 | 12.59 | 29.78 | 38.70 |
| FR-ESTEBAN | 64 | 2015 | GAMA | 32.84 | 36.34 | 23.60 | 3.25 | 250.68 | 22.36 | 10.26 | 14.78 | 34.96 | 69.73 |
| FR-ESTEBAN | 11 | 2016 | GAMA | 30.73 | 20.91 | 25.58 | 11.46 | 88.03 | 23.63 | 13.18 | 15.79 | 36.04 | 45.03 |
| POR-INSEF | 62 | 2019 | AAMA | 157.77 | 102.16 | 130.06 | 26.38 | 675.61 | 143.10 | 56.39 | 92.37 | 203.73 | 260.07 |
| POR-INSEF | 9 | 2020 | AAMA | 251.27 | 183.23 | 191.88 | 53.38 | 632.07 | 138.92 | 104.06 | 121.69 | 386.56 | 481.49 |
| POR-INSEF | 62 | 2019 | GAMA | 39.79 | 19.85 | 36.41 | 13.09 | 148.00 | 36.98 | 23.62 | 28.68 | 44.04 | 52.03 |
| POR-INSEF | 9 | 2020 | GAMA | 48.30 | 30.76 | 40.51 | 17.97 | 120.71 | 39.30 | 21.11 | 26.98 | 63.78 | 80.9 |
References
- Gilles, L.; Govarts, E.; Rambaud, L.; Vogel, N.; Castaño, A.; Esteban López, M.; Rodriguez Martin, L.; Koppen, G.; Remy, S.; Vrijheid, M.; et al. HBM4EU Combines and Harmonises Human Biomonitoring Data across the EU, Building on Existing Capacity—The HBM4EU survey. Int. J. Hyg. Environ. Health 2021, 237, 113809. [Google Scholar] [CrossRef] [PubMed]
- EFSA Panel on Contaminants in the Food Chain (CONTAM). Scientific Opinion on Acrylamide in Food. Efsa J. 2015, 13, 4104. [Google Scholar]
- International Agency for Research on Cancer. Acrylamide. IARC Monogr. Eval. Carcinog. Risks Hum. 1994, 60, 389–483. [Google Scholar]
- Eisenbrand, G. Revisiting the Evidence for Genotoxicity of Acrylamide (AA), Key to Risk Assessment of Dietary AA Exposure. Arch. Toxicol. 2020, 94, 2939–2950. [Google Scholar] [CrossRef]
- Pennisi, M.; Malaguarnera, G.; Puglisi, V.; Vinciguerra, L.; Vacante, M.; Malaguarnera, M. Neurotoxicity of Acrylamide in Exposed Workers. Int. J. Environ. Res. Public Health 2013, 10, 3843–3854. [Google Scholar] [CrossRef] [Green Version]
- Maddu, N.; Begum, S.F. Review on Chronic Exposure of Acrylamide Causes a Neurotoxicity Risk. INNOSC Theranostics Pharmacol. Sci. 2019, 1, 20–26. [Google Scholar] [CrossRef] [Green Version]
- Ghanayem, B.I.; Bai, R.; Kissling, G.E.; Travlos, G.; Hoffler, U. Diet-Induced Obesity in Male Mice Is Associated with Reduced Fertility and Potentiation of Acrylamide-Induced Reproductive Toxicity. Biol. Reprod. 2010, 82, 96–104. [Google Scholar] [CrossRef] [Green Version]
- Mojska, H.; Gielecińska, I.; Cendrowski, A. Acrylamide Content in Cigarette Mainstream Smoke and Estimation of Exposure to Acrylamide from Tobacco Smoke in Poland. Ann. Agric. Environ. Med. 2016, 23, 456–461. [Google Scholar] [CrossRef]
- Kenwood, B.M.; Zhu, W.; Zhang, L.; Bhandari, D.; Blount, B.C. Cigarette Smoking Is Associated with Acrylamide Exposure among the US Population: NHANES 2011–2016. Environ. Res. 2022, 209, 112774. [Google Scholar] [CrossRef]
- Esposito, F.; Squillante, J.; Nolasco, A.; Montuori, P.; Macrì, P.G.; Cirillo, T. Acrylamide Levels in Smoke from Conventional Cigarettes and Heated Tobacco Products and Exposure Assessment in Habitual Smokers. Environ. Res. 2022, 208, 112659. [Google Scholar] [CrossRef]
- Bjellaas, T.; Stølen, L.H.; Haugen, M.; Paulsen, J.E.; Alexander, J.; Lundanes, E.; Becher, G. Urinary Acrylamide Metabolites as Biomarkers for Short-Term Dietary Exposure to Acrylamide. Food Chem. Toxicol. 2007, 45, 1020–1026. [Google Scholar] [CrossRef]
- Schettgen, T.; Weiss, T.; Drexler, H.; Angerer, J. A First Approach to Estimate the Internal Exposure to Acrylamide in Smoking and Non-Smoking Adults from Germany. Int. J. Hyg. Environ. Health 2003, 206, 9–14. [Google Scholar] [CrossRef]
- Urban, M.; Kavvadias, D.; Riedel, K.; Scherer, G.; Tricker, A.R. Urinary Mercapturic Acids and a Hemoglobin Adduct for the Dosimetry of Acrylamide Exposure in Smokers and Nonsmokers. Inhal. Toxicol. 2006, 18, 831–839. [Google Scholar] [CrossRef]
- Mottram, D.S.; Wedzicha, B.L.; Dodson, A.T. Acrylamide Is Formed in the Maillard Reaction. Nature 2002, 419, 448–449. [Google Scholar] [CrossRef]
- Mesias, M.; Delgado-Andrade, C.; Morales, F.J. An Updated View of Acrylamide in Cereal Products. Curr. Opin. Food Sci. 2022, 46, 100847. [Google Scholar] [CrossRef]
- Esposito, F.; Velotto, S.; Rea, T.; Stasi, T.; Cirillo, T. Occurrence of Acrylamide in Italian Baked Products and Dietary Exposure Assessment. Molecules 2020, 25, 4156. [Google Scholar] [CrossRef]
- Amrein, T.M.; Andres, L.; Escher, F.; Amadò, R. Occurrence of Acrylamide in Selected Foods and Mitigation Options. Food Addit. Contam. 2007, 24 (Suppl. 1), 13–25. [Google Scholar] [CrossRef]
- Strocchi, G.; Rubiolo, P.; Cordero, C.; Bicchi, C.; Liberto, E. Acrylamide in Coffee: What Is Known and What Still Needs to Be Explored. A Review. Food Chem. 2022, 393, 133406. [Google Scholar] [CrossRef]
- Bjellaas, T.; Olesen, P.T.; Frandsen, H.; Haugen, M.; Stølen, L.H.; Paulsen, J.E.; Alexander, J.; Lundanes, E.; Becher, G. Comparison of Estimated Dietary Intake of Acrylamide with Hemoglobin Adducts of Acrylamide and Glycidamide. Toxicol. Sci. 2007, 98, 110–117. [Google Scholar] [CrossRef]
- Choi, S.Y.; Ko, A.; Kang, H.S.; Hwang, M.S.; Lee, H.S. Association of Urinary Acrylamide Concentration with Lifestyle and Demographic Factors in a Population of South Korean Children and Adolescents. Environ. Sci. Pollut. Res. 2019, 26, 18247–18255. [Google Scholar] [CrossRef]
- Hartmann, E.C.; Boettcher, M.I.; Schettgen, T.; Fromme, H.; Drexler, H.; Angerer, J. Hemoglobin Adducts and Mercapturic Acid Excretion of Acrylamide and Glycidamide in One Study Population. J. Agric. Food Chem. 2008, 56, 6061–6068. [Google Scholar] [CrossRef]
- Zhang, Y.; Wang, Q.; Cheng, J.; Zhang, J.; Xu, J.; Ren, Y. Comprehensive Profiling of Mercapturic Acid Metabolites from Dietary Acrylamide as Short-Term Exposure Biomarkers for Evaluation of Toxicokinetics in Rats and Daily Internal Exposure in Humans Using Isotope Dilution Ultra-High Performance Liquid Chromatography Tandem Mass Spectrometry. Anal. Chim. Acta 2015, 894, 54–64. [Google Scholar] [CrossRef]
- Albiach-Delgado, A.; Esteve-Turrillas, F.A.; Fernández, S.F.; Garlito, B.; Pardo, O. Review of the State of the Art of Acrylamide Human Biomonitoring. Chemosphere 2022, 295, 133880. [Google Scholar] [CrossRef]
- Besaratinia, A.; Pfeifer, G.P. Genotoxicity of Acrylamide and Glycidamide. J. Natl. Cancer Inst. 2004, 96, 1023–1029. [Google Scholar] [CrossRef] [Green Version]
- Settels, E.; Bernauer, U.; Palavinskas, R.; Klaffke, H.S.; Gundert-Remy, U.; Appel, K.E. Human CYP2E1 mediates the formation of glycidamide from acrylamide. Arch. Toxicol. 2008, 82, 717–727. [Google Scholar] [CrossRef]
- Paulsson, B.; Rannug, A.; Henderson, A.P.; Golding, B.T.; Tornqvist, M.; Warholm, M. In Vitro Studies of the Influence of Glutathione Transferases and Epoxide Hydrolase on the Detoxification of Acrylamide and Glycidamide in Blood. Mutat. Res. 2005, 580, 53–59. [Google Scholar] [CrossRef]
- Duale, N.; Bjellaas, T.; Alexander, J.; Becher, G.; Haugen, M.; Paulsen, J.E.; Frandsen, H.; Olesen, P.T.; Brunborg, G. Biomarkers of Human Exposure to Acrylamide and Relation to Polymorphisms in Metabolizing Genes. Toxicol. Sci. 2009, 108, 90–99. [Google Scholar] [CrossRef] [Green Version]
- Pellè, L.; Carlsson, H.; Cipollini, M.; Bonotti, A.; Foddis, R.; Cristaudo, A.; Romei, C.; Elisei, R.; Gemignani, F.; Törnqvist, M.; et al. The Polymorphism Rs2480258 within CYP2E1 Is Associated with Different Rates of Acrylamide Metabolism in Vivo in Humans. Arch. Toxicol. 2018, 92, 2137–2140. [Google Scholar] [CrossRef]
- Tareke, E.; Rydberg, P.; Karlsson, P.; Eriksson, S.; Törnqvist, M. Acrylamide: A Cooking Carcinogen? Chem. Res. Toxicol. 2000, 13, 517–522. [Google Scholar] [CrossRef]
- Hagmar, L.; Wirfält, E.; Paulsson, B.; Törnqvist, M. Differences in Hemoglobin Adduct Levels of Acrylamide in the General Population with Respect to Dietary Intake, Smoking Habits and Gender. Mutat. Res. 2005, 580, 157–165. [Google Scholar] [CrossRef] [PubMed] [Green Version]
- Obón-Santacana, M.; Freisling, H.; Peeters, P.H.; Lujan-Barroso, L.; Ferrari, P.; Boutron-Ruault, M.C.; Mesrine, S.; Baglietto, L.; Turzanski-Fortner, R.; Katzke, V.A.; et al. Acrylamide and Glycidamide Hemoglobin Adduct Levels and Endometrial Cancer Risk: A Nested Case-Control Study in Nonsmoking Postmenopausal Women from the EPIC Cohort. Int. J. Cancer 2016, 138, 1129–1138. [Google Scholar] [CrossRef] [PubMed] [Green Version]
- Vikström, A.C.; Warholm, M.; Paulsson, B.; Axmon, A.; Wirfält, E.; Törnqvist, M. Hemoglobin Adducts as a Measure of Variations in Exposure to Acrylamide in Food and Comparison to Questionnaire Data. Food Chem. Toxicol. 2012, 50, 2531–2539. [Google Scholar] [CrossRef] [PubMed]
- Chevolleau, S.; Jacques, C.; Canlet, C.; Tulliez, J.; Debrauwer, L. Analysis of Hemoglobin Adducts of Acrylamide and Glycidamide by Liquid Chromatography-Electrospray Ionization Tandem Mass Spectrometry, as Exposure Biomarkers in French Population. J. Chromatogr. A 2007, 1167, 125–134. [Google Scholar] [CrossRef] [PubMed]
- Schettgen, T.; Rossbach, B.; Kütting, B.; Letzel, S.; Drexler, H.; Angerer, J. Determination of Haemoglobin Adducts of Acrylamide and Glycidamide in Smoking and Non-Smoking Persons of the General Population. Int. J. Hyg. Environ. Health 2004, 207, 531–539. [Google Scholar] [CrossRef]
- Kütting, B.; Schettgen, T.; Schwegler, U.; Fromme, H.; Uter, W.; Angerer, J.; Drexler, H. Acrylamide as Environmental Noxious Agent: A Health Risk Assessment for the General Population Based on the Internal Acrylamide Burden. Int. J. Hyg. Environ. Health 2009, 212, 470–480. [Google Scholar] [CrossRef]
- Boettcher, M.I.; Schettgen, T.; Kütting, B.; Pischetsrieder, M.; Angerer, J. Mercapturic Acids of Acrylamide and Glycidamide as Biomarkers of the Internal Exposure to Acrylamide in the General Population. Mutat. Res. 2005, 580, 167–176. [Google Scholar] [CrossRef]
- Schettgen, T.; Müller, J.; Fromme, H.; Angerer, J. Simultaneous Quantification of Haemoglobin Adducts of Ethylene Oxide, Propylene Oxide, Acrylonitrile, Acrylamide and Glycidamide in Human Blood by Isotope-Dilution GC/NCI-MS/MS. J. Chromatogr. B Analyt. Technol. Biomed Life Sci. 2010, 878, 2467–2473. [Google Scholar] [CrossRef]
- Heudorf, U.; Hartmann, E.; Angerer, J. Acrylamide in Children–Exposure Assessment via Urinary Acrylamide Metabolites as Biomarkers. Int. J. Hyg. Environ. Health 2009, 212, 135–141. [Google Scholar] [CrossRef]
- Von Stedingk, H.; Vikström, A.C.; Rydberg, P.; Pedersen, M.; Nielsen, J.K.S.; Segerbäck, D.; Knudsen, L.E.; Törnqvist, M. Analysis of Hemoglobin Adducts from Acrylamide, Glycidamide, and Ethylene Oxide in Paired Mother/Cord Blood Samples from Denmark. Chem. Res. Toxicol. 2011, 24, 1957–1965. [Google Scholar] [CrossRef]
- Kopp, E.K.; Dekant, W. Toxicokinetics of Acrylamide in Rats and Humans Following Single Oral Administration of Low Doses. Toxicol. Appl. Pharmacol. 2009, 235, 135–142. [Google Scholar] [CrossRef]
- Duarte-Salles, T.; von Stedingk, H.; Granum, B.; Gützkow, K.B.; Rydberg, P.; Törnqvist, M.; Mendez, M.A.; Brunborg, G.; Brantsæter, A.L.; Meltzer, H.M.; et al. Dietary Acrylamide Intake during Pregnancy and Fetal Growth-Results from the Norwegian Mother and Child Cohort Study (MoBa). Environ. Health Perspect. 2013, 121, 374–379. [Google Scholar] [CrossRef]
- Vikström, A.C.; Abramsson-Zetterberg, L.; Naruszewicz, M.; Athanassiadis, I.; Granath, F.N.; Törnqvist, M.A. In Vivo Doses of Acrylamide and Glycidamide in Humans after Intake of Acrylamide-Rich Food. Toxicol. Sci. 2011, 119, 41–49. [Google Scholar] [CrossRef] [Green Version]
- Goerke, K.; Ruenz, M.; Lampen, A.; Abraham, K.; Bakuradze, T.; Eisenbrand, G.; Richling, E. Biomonitoring of Nutritional Acrylamide Intake by Consumers without Dietary Preferences as Compared to Vegans. Arch. Toxicol. 2019, 93, 987–996. [Google Scholar] [CrossRef] [Green Version]
- Goempel, K.; Tedsen, L.; Ruenz, M.; Bakuradze, T.; Schipp, D.; Galan, J.; Eisenbrand, G.; Richling, E. Biomarker Monitoring of Controlled Dietary Acrylamide Exposure Indicates Consistent Human Endogenous Background. Arch. Toxicol. 2017, 91, 3551–3560. [Google Scholar] [CrossRef]
- Frigerio, G.; Mercadante, R.; Campo, L.; Polledri, E.; Boniardi, L.; Olgiati, L.; Missineo, P.; Fustinoni, S. Urinary Biomonitoring of Subjects with Different Smoking Habits. Part I: Profiling Mercapturic Acids. Toxicol. Lett. 2020, 327, 48–57. [Google Scholar] [CrossRef]
- Schwedler, G.; Murawski, A.; Schmied-Tobies, M.I.H.; Rucic, E.; Scherer, M.; Pluym, N.; Scherer, G.; Bethke, R.; Kolossa-Gehring, M. Benzene Metabolite SPMA and Acrylamide Metabolites AAMA and GAMA in Urine of Children and Adolescents in Germany—Human Biomonitoring Results of the German Environmental Survey 2013-2017 (GerES V). Environ. Res. 2021, 192, 110295. [Google Scholar] [CrossRef]
- Waikar, S.S.; Sabbisetti, V.S.; Bonventre, J.V. Normalization of Urinary Biomarkers to Creatinine during Changes in Glomerular Filtration Rate. Kidney Int. 2010, 78, 486–494. [Google Scholar] [CrossRef] [Green Version]
- Esteban López, M.; Göen, T.; Mol, H.; Nübler, S.; Haji-Abbas-Zarrabi, K.; Koch, H.M.; Kasper-Sonnenberg, M.; Dvorakova, D.; Hajslova, J.; Antignac, J.P.; et al. The European Human Biomonitoring Platform—Design and Implementation of a Laboratory Quality Assurance/Quality Control (QA/QC) Programme for Selected Priority Chemicals. Int. J. Hyg. Environ. Health 2021, 234, 113740. [Google Scholar] [CrossRef]
- Hays, S.M.; Aylward, L.L. Biomonitoring Equivalents (BE) Dossier for Acrylamide (AA) (CAS No. 79-06-1). Regul. Toxicol. Pharmacol. 2008, 51, S57–S67. [Google Scholar] [CrossRef]
- EPA’s National Center for Environmental Assessment (NCEA). IRIS Toxicological Review of Acrylamide (External Review Draft); EPA’s National Center for Environmental Assessment (NCEA): Washington, DC, USA, 2004.
- European Food Safety Authority (EFSA); Benford, D.; Bignami, M.; Chipman, J.K.; Ramos Bordajandi, L. Assessment of the Genotoxicity of Acrylamide. EFSA J. 2022, 20, e07293. [Google Scholar] [CrossRef]
- Li, Y.; Jiang, J.; Wang, Q.; Zhu, L.; Jia, W.; Chen, X.; Zhang, Y. The Construction and Application of Physiologically Based Toxicokinetic Models for Acrylamide, Glycidamide and Their Biomarkers in Rats and Humans. Chemosphere 2022, 292, 133458. [Google Scholar] [CrossRef] [PubMed]
- DeWoskin, R.S.; Sweeney, L.M.; Teeguarden, J.G.; Sams, R.; Vandenberg, J. Comparison of PBTK Model and Biomarker Based Estimates of the Internal Dosimetry of Acrylamide. Food Chem. Toxicol. 2013, 58, 506–521. [Google Scholar] [CrossRef] [PubMed]
- Vesper, H.W.; Caudill, S.P.; Osterloh, J.D.; Meyers, T.; Scott, D.; Myers, G.L. Exposure of the U.S. Population to Acrylamide in the National Health and Nutrition Examination Survey 2003–2004. Environ. Health Perspect. 2010, 118, 278–283. [Google Scholar] [CrossRef] [PubMed] [Green Version]
- Gielecińska, I.; Mojska, H.; Szponar, L. Preliminary Assessment of Exposure of Children and Adolescents to Acrylamide Originating from Food. Rocz. Panstw. Zakl. Hig. 2007, 58, 217–221. [Google Scholar]
- Food and Agriculture Organization of the United Nations; World Health Organization (Eds.) Health Implications of Acrylamide in Food: Report of a Joint FAO/WHO Consultation, WHO Headquarters, Geneva, Switzerland, 25–27 June 2002; Food Safety Consultations, Food Safety Programme; World Health Organization: Geneva, Switzerland, 2002. [Google Scholar]
- Walker, K.; Hattis, D.; Russ, A.; Sonawane, B.; Ginsberg, G. Approaches to Acrylamide Physiologically Based Toxicokinetic Modeling for Exploring Child-Adult Dosimetry Differences. J. Toxicol. Environ. Heal. Part A 2007, 70, 2033–2055. [Google Scholar] [CrossRef]
- Barton, H.A.; Cogliano, V.J.; Flowers, L.; Valcovic, L.; Setzer, R.W.; Woodruff, T.J. Assessing Susceptibility from Early-Life Exposure to Carcinogens. Environ. Health Perspect. 2005, 113, 1125–1133. [Google Scholar] [CrossRef]
- Erdemli, M.; Turkoz, Y.; Altinoz, E.; Elibol, E.; Dogan, Z. Investigation of the Effects of Acrylamide Applied during Pregnancy on Fetal Brain Development in Rats and Protective Role of the Vitamin E. Hum. Exp. Toxicol. 2016, 35, 1337–1344. [Google Scholar] [CrossRef]
- Erdemli, M.E.; Arif Aladag, M.; Altinoz, E.; Demirtas, S.; Turkoz, Y.; Yigitcan, B.; Bag, H.G. Acrylamide Applied during Pregnancy Causes the Neurotoxic Effect by Lowering BDNF Levels in the Fetal Brain. Neurotoxicology Teratol. 2018, 67, 37–43. [Google Scholar] [CrossRef]
- Lindeman, B.; Johansson, Y.; Andreassen, M.; Husøy, T.; Dirven, H.; Hofer, T.; Knutsen, H.K.; Caspersen, I.H.; Vejrup, K.; Paulsen, R.E.; et al. Does the Food Processing Contaminant Acrylamide Cause Developmental Neurotoxicity? A Review and Identification of Knowledge Gaps. Reprod. Toxicol. 2021, 101, 93–114. [Google Scholar] [CrossRef]
- Hubacek, J.A. Drug Metabolising Enzyme Polymorphisms in Middle- and Eastern-European Slavic Populations. Drug Metab. Drug Interact. 2014, 29, 29–36. [Google Scholar] [CrossRef]
| Provider of Data | Study Label | Data Code | Year of Sampling | Number of Participants (Non-Smoker) | Mean Age (Years) | Age Range |
|---|---|---|---|---|---|---|
| EPIUD | NAC II | IT1 | 2014 | 18 | 7.0 | 7 |
| EPIUD | NAC II | IT2 | 2015 | 132 | 7.2 | 7–8 |
| EPIUD | NAC II | IT3 | 2016 | 147 | 7.0 | 7 |
| UBA | GerES V | DE1 | 2015 | 852 | 10.3 | 3–18 |
| UBA | GerES V | DE2 | 2016 | 849 | 10.3 | 3–18 |
| UBA | GerES V | DE3 | 2017 | 517 | 10.3 | 3–18 |
| NIPH | NEB II | NO | 2016 | 289 | 9.8 | 7–11 |
| ANSP | ESTEBAN | FR1c | 2014 | 55 | 8.5 | 6–11 |
| ANSP | ESTEBAN | FR2c | 2015 | 208 | 8.9 | 6–11 |
| ANSP | ESTEBAN | FR3c | 2016 | 37 | 8.9 | 6–11 |
| Provider of Data | Study Label | Data Code | Year of Sampling | Number of Participants (Non-Smoker) | Number Participants (Smoker) | Mean Age(Years) | Age Range |
|---|---|---|---|---|---|---|---|
| UI | Diet-HBM | IS1 | 2019 | 289 | 6 | 31.6 | 21–39 |
| UI | Diet-HBM | IS1 | 2020 | 154 | 12 | 30.6 | 20–39 |
| INSA | INSEF-ExpoQuim | PT1 | 2019 | 177 | 67 | 34.5 | 28–39 |
| INSA | INSEF-ExpoQuim | PT2 | 2020 | 37 | 12 | 34.7 | 28–39 |
| LNS+LIH | Oriscav-Lux2 | LU1 | 2016 | 34 | 7 | 33.3 | 26–39 |
| LNS+LIH | Oriscav-Lux2 | LU2 | 2017 | 123 | 25 | 33.5 | 25–39 |
| LNS+LIH | Oriscav-Lux2 | LU3 | 2018 | 12 | 36.0 | 33–39 | |
| UBA | ESB | ESB1 | 2000 | 60 | 24,4 | 20–29 | |
| UBA | ESB | ESB2 | 2005 | 60 | 23.6 | 20–28 | |
| UBA | ESB | ESB3 | 2010 | 60 | 23.3 | 20–28 | |
| UBA | ESB | ESB4 | 2015 | 60 | 23.0 | 20–28 | |
| UBA | ESB | ESB5 | 2019 | 60 | 23.0 | 20–28 | |
| UBA | ESB | ESB6 | 2021 | 54 | 23.0 | 20.28 | |
| ANSP | ESTEBAN | FR1a | 2014 | 36 | 27 | 31.4 | 20–39 |
| ANSP | ESTEBAN | FR2a | 2015 | 138 | 64 | 32.5 | 20–39 |
| ANSP | ESTEBAN | FR3a | 2016 | 23 | 10 | 34.0 | 26–39 |
| Variable | AAMA (ln(µg/g Creat.)/Year) | GAMA(ln(µg/g Creat.)/Year) |
|---|---|---|
| Age (years) | s: −0.04, *** | s: −0.072, *** |
| Sampling year | s: 0.04, ** | s: 0.061, *** |
| Variable | AAMA (ln[µg/g Cerat.]/Year) | GAMA (ln[µg/g cerat.]/Year) |
|---|---|---|
| Age (years) | s: 0.018, *** | s: 0.0239, *** |
| Sampling year | s: −0.004, ns | s: 0.0024, ns |
Publisher’s Note: MDPI stays neutral with regard to jurisdictional claims in published maps and institutional affiliations. |
© 2022 by the authors. Licensee MDPI, Basel, Switzerland. This article is an open access article distributed under the terms and conditions of the Creative Commons Attribution (CC BY) license (https://creativecommons.org/licenses/by/4.0/).
Share and Cite
Poteser, M.; Laguzzi, F.; Schettgen, T.; Vogel, N.; Weber, T.; Murawski, A.; Schmidt, P.; Rüther, M.; Kolossa-Gehring, M.; Namorado, S.; et al. Trends of Exposure to Acrylamide as Measured by Urinary Biomarkers Levels within the HBM4EU Biomonitoring Aligned Studies (2000–2021). Toxics 2022, 10, 443. https://doi.org/10.3390/toxics10080443
Poteser M, Laguzzi F, Schettgen T, Vogel N, Weber T, Murawski A, Schmidt P, Rüther M, Kolossa-Gehring M, Namorado S, et al. Trends of Exposure to Acrylamide as Measured by Urinary Biomarkers Levels within the HBM4EU Biomonitoring Aligned Studies (2000–2021). Toxics. 2022; 10(8):443. https://doi.org/10.3390/toxics10080443
Chicago/Turabian StylePoteser, Michael, Federica Laguzzi, Thomas Schettgen, Nina Vogel, Till Weber, Aline Murawski, Phillipp Schmidt, Maria Rüther, Marike Kolossa-Gehring, Sónia Namorado, and et al. 2022. "Trends of Exposure to Acrylamide as Measured by Urinary Biomarkers Levels within the HBM4EU Biomonitoring Aligned Studies (2000–2021)" Toxics 10, no. 8: 443. https://doi.org/10.3390/toxics10080443
APA StylePoteser, M., Laguzzi, F., Schettgen, T., Vogel, N., Weber, T., Murawski, A., Schmidt, P., Rüther, M., Kolossa-Gehring, M., Namorado, S., Nieuwenhuyse, A. V., Appenzeller, B., Dufthaksdóttir, E., Olafsdóttir, K., Haug, L. S., Thomsen, C., Barbone, F., Rosolen, V., Rambaud, L., ... Moshammer, H. (2022). Trends of Exposure to Acrylamide as Measured by Urinary Biomarkers Levels within the HBM4EU Biomonitoring Aligned Studies (2000–2021). Toxics, 10(8), 443. https://doi.org/10.3390/toxics10080443