Abstract
Post-processing contamination of Listeria monocytogenes has remained a major concern for the safety of ready-to-eat (RTE) meat products that are not reheated before consumption. Mathematical models are rapid and cost-effective tools to predict pathogen behavior, product shelf life, and safety. The objective of this study was to develop and validate a comprehensive model to predict the Listeria growth rate in RTE meat products as a function of temperature, pH, water activity, nitrite, acetic, lactic, and propionic acids. The Listeria growth data in RTE food matrices, including RTE beef, pork, and poultry products (731 data sets), were collected from the literature and databases like ComBase. The growth parameters were estimated using the logistic-with-delay primary model. The good-quality growth rate data (n = 596, R2 > 0.9) were randomly divided into 80% training (n = 480) and 20% testing (n = 116) datasets. The training growth rates were used to develop a secondary gamma model, followed by validation in testing data. The growth model’s performance was evaluated by comparing the predicted and observed growth rates. The goodness-of-fit parameter of the secondary model includes R2 of 0.86 and RMSE of 0.06 (μmax) during the development stage. During validation, the gamma model with interaction included an RMSE of 0.074 (μmax), bias, and accuracy factor of 0.95 and 1.50, respectively. Overall, about 81.03% of the relative errors (RE) of the model’s predictions were within the acceptable simulation zone (RE ± 0.5 log CFU/h). In lag time model validation, predictions were 7% fail-dangerously biased, and the accuracy factor of 2.23 indicated that the lag time prediction is challenging. The model may be used to quantify the Listeria growth in naturally contaminated RTE meats. This model may be helpful in formulations, shelf-life assessment, and decision-making for the safety of RTE meat products.
1. Introduction
Listeria monocytogenes is a gram-positive, facultative pathogen that can cause severe foodborne illness in humans. It has been a significant threat to the safety of ready-to-eat (RTE) meats that are frequently implicated in listeriosis outbreaks [1,2]. Listeria is ubiquitous and can grow in a range of temperature (−1.5 to 45 °C), pH (4.3 to 9.4), aw (>0.92), and NaCl concentration up to 13%. Prevention of post-processing contamination in RTE food during handling, processing, and packaging facilities has remained a challenge over the years [3,4]. Ready-to-eat meals (31%), cooked meat and seafood (16.80%), dairy & poultry products (14.47%), and fruits and vegetables (2.2–15.6%) are the leading food vehicles for Listeria contamination [5,6,7]. According to the EU 2022 report, the occurrence of Listeria in RTE food products (3.5–5.4%) includes pork meat products (2.7%), sausages (2.5–3.1%), poultry meat products (broilers and turkeys—1.3%), bovine meat products (3.9%), fish and fishery products (3.5–5.4%), soft and hard cheeses (0.69%), milk (0.3%), and fruits, vegetables, and juices (3.0%) [8]. The USDA-FSIS initiated a “zero tolerance” policy (≤1 CFU in 25 g sample) for RTE food products [9]. In contrast, contamination <100 CFU/g at the time of consumption was imposed by EU Regulation (EC) 2073/2005 [10]. Listeria tolerance as per EC regulation is also followed by [11], Australia, and New Zealand [12]. These stringent food safety policies have increased pressure on food industries to control post-process contamination in RTE meat, seafood, and poultry products. In addition, the economic impact of Listeria on food industries is devastating due to the costs associated with recalls and loss of productivity. Listeriosis economic burden in the United States alone was estimated to be between 2.3 to 22 billion USD per year, while the global burden has never been accurately estimated [13].
RTE products consumed without reheating, such as deli meat and frankfurters, are considered high-risk products [14,15]. Listeria can be resistant to preservation methods and can grow even under refrigerated temperatures, which is a major concern for the food industry to ensure microbial safety. Therefore, post-processing hurdle techniques are required to inactivate or inhibit the growth of Listeria in RTE meats throughout the storage period. Post-packaging treatments such as irradiation and high-pressure processing approaches suffer from limitations related to low consumer acceptability, throughput, and high capital costs [16]. Therefore, the use of organic acids as antimicrobials is one of the most effective methods to inhibit Listeria growth and enhance the shelf life of RTE meats. In addition, approval of organic acids as food preservatives [17] and their recognition as a “generally recognized as safe” (GRAS) compound by FDA-21.CFR [18] has increased their usage of RTE meats. Acetates, lactates, and nitrites are the most preferred antimicrobial compounds in meat, poultry, and seafood [19,20].
The challenge studies to assess the effect of antimicrobials on microbial kinetics and product shelf life are expensive, impractical to perform during frequent changes in product recipes, and not ideal for large-scale sampling [21]. In this context, predictive modeling is a rapid solution to simulate the effect of change in product formulation on product safety and shelf life of products. The models could be built with minimal microbial studies and used to predict Listeria behavior. This can reduce a significant amount of challenging studies, saving time and resources through quick simulation. In addition, mathematical models can also quantify microbial behavior as a function of various environmental and inhibiting substances. The use of gamma concept modeling has gained significant interest. These models can simulate the combined effects of multiple factors on pathogen behavior and help in risk assessment [22,23]. The European Regulation [10] also suggested food business operators may use predictive models as a tool for evaluating compliance to microbiological criteria throughout the shelf-life of RTE foods. The existing broth models in the literature are often developed on liquid media, which offer highly conservative predictions due to the high mobility of nutrients and favorable growth conditions. These models fail to account for the complex interactions within real meat matrices. Additionally, the predictions may not represent real-world conditions resulting in over processing of foods. Therefore, the development and validation of an improved model considering the synergistic effect of environmental and antimicrobial factors in real meat matrices instead of conventional liquid growth media is crucial. Considering the combined effects of clean label solutions and environmental factors provides a more practical and reliable predictive tool to enhance food safety and precisely optimize preservative usage in RTE meat products.
Over the last decade, several secondary models for Listeria growth prediction as a function of several factors have been developed [23,24,25,26,27,28,29,30,31,32]. Most of these models were developed with lab culture media and validated either in liquid media alone and/or a combination of food matrices and culture media [33,34]. The broth models can only provide useful insights into microbial growth behavior and aid in predicting growth in food matrices [35]. Broth models are often considered to overestimate the growth rate due to the high mobility of nutrients in culture media and contain a range of compounds that favor rapid microbial growth [21,36]. This may result in over-prediction of growth rates when applied to food, which may not be acceptable for food quality [37,38]. These models often predict the worst-case scenario and are still models of real food. It is more effective to develop the model on real food matrices and optimize the use of preservatives. This is particularly important to reduce the overuse of organic acids as antimicrobials, as they can affect the sensory properties of RTE meat. In contrast, the food matrix is more complex due to pH, aw, low mobility of nutrients, chemical composition, and background microflora characteristics [36,39]. As a result, lab broth models are inappropriate and may not accurately predict the Listeria behavior in the food matrix [40,41]. A literature survey suggests that very limited Listeria models have been developed and validated in real food matrices [26,42,43]. Predictive models are yet to be developed in RTE meat foods and validated in RTE meat foods matrices to describe the combined effect of sodium nitrite and organic acids with other factors such as temperature, pH, and aw/NaCl, etc. The literature search revealed that only one study [43] reported a gamma-type model that was developed and validated in combined broth and RTE meat data as a function of acetic and propionic acids. Therefore, the objective of this study was to develop and validate a comprehensive Listeria growth model using exclusively RTE food matrices data to describe the individual and synergistic effects of various factors.
2. Materials and Methods
2.1. Data Collection and Growth Rate Estimation
Listeria growth curves (n = 731) in different RTE food matrices (beef, pork, poultry) were collected (shown in Table 1, Table 2 and Table 3) from previous publications, ComBase, and data directly contributed by authors through personal communication. Raw data were always extracted, when raw data were not available the published graphs were scanned and individual points were digitalized using plot digitizer 2.6.11 (https://sourceforge.net/projects/plotdigitizer/files/) software (accessed on 8 October 2022), following the method [44]. The logistic-with-delay primary model (Equation (1)) was fitted to growth curves to determine the exponential growth rate (µmax) and lag time (tlag) [45]. The non-linear fitting was performed (lsqcurvefit function, Optimization Toolbox) using MATLAB R2022b (The MathWorks, Natick, MA, USA).
where t is time (h), Nt is cell concentration (CFU/g) at time t, N0 is the initial cell concentration (CFU/g), Nmax is maximum population density (CFU/g), μmax is the maximum exponential growth rate (h−1), and tlag is the lag time (h).

Table 1.
Criteria used to filter and select growth rate data for modeling.
Table 2.
pKa values and initial guess values of MICs for undissociated organic acid and nitrite.
Table 3.
Estimated model parameters in this study with their 95% confidence intervals.
If the maximum exponential growth rates were directly taken from publications with different primary models, such data were transformed. The growth rates were transformed from the Gompertz, Logistic, and Baranyi models to the logistic-with-delay model using conversion factors of 0.84, 0.86, and 0.97, respectively. Similarly, lag times were transformed from Gompertz, Baranyi, and Logistic by using 0.82, 0.97, and 0.95, respectively [46]. The environmental factors considered in the study were temperature, pH, water activity, sodium nitrite, acetic acid, lactic acid, and propionic acid. The collected data included Listeria growth in RTE beef, pork, and poultry meat products.
2.2. Data Selection Criteria and Assumptions
The maximum exponential growth rates obtained from 731 curves were filtered based on quality criteria (reported in Table 1) to select good-quality data for the model development. After filtering, a total of 596 datasets were selected for model development and validation. The selected data included variables such as temperature (−1.5 to 37 °C), pH (4.8 to 6.8), water activity (0.9 to 0.997), nitrites (0 to 8.48 mM), acetic acid (0 to 8.95 mM), lactic acid (0 to 3.30 mM), and propionic acid (0 to 2.12 mM). The selected dataset was randomly divided into a model development dataset (n = 480) and a validation dataset (n = 116). The selected Listeria data includes 20 beef products, 30 pork products, and 22 poultry products from about 76 different publications (Table 1, Table 2 and Table 3).
When no information was available in the publications, pH was assumed based on similar types of meat products reported in other studies. If the formulation included nitrite but no concentration was reported, an average nitrite of 98.5 ppm for all other meat products was assumed as suggested by [49]. The water activity (aw) values were recalculated from NaCl concentration using the formula [50] shown in Equations (2) and (3). The missing concentration of NaCl (%) was calculated from the molar equivalent of sodium in the products obtained from the food databank of DTU Food databank [51] or the USDA food composition table [52], as suggested earlier [53]. The undissociated organic acid concentrations (mM) in water phase salts were calculated (Equation (4)), as only undissociated acids exhibit antimicrobial activity, followed by anions activity to a lesser extent [54].
where, WPS refers to water phase salts, which can be calculated by the following:
where,
aw = 1 − 0.0052471 ∗ %WPS − 0.00012206 ∗ %WPS2
The pka is the disassociation constant determining an acid’s strength, and the values of pka for different organic acids reported in Table 2 were used.
2.3. Development of Secondary Growth Rate Model
The gamma concept model was used to describe the influence of the environment and inhibiting conditions on microbial growth. The square root transformation for μmax values was applied to homogenize the variance as suggested earlier [28,30,55]. Modeling of maximum exponential growth rates (μmax, h−1) as a function of temperature, pH, water activity, nitrite, and organic acids was performed using Equation (6).
Here, µmax is the maximum exponential growth rate (log CFU/g/h), and the gamma terms γ(T), γ(pH), γ(aw), γ(NIT), and γ([OA]) refer to the effects of temperature, pH, water activity, nitrite, and organic acids, respectively. Xi (ξ) is the quantitative effect of interactions between the parameters. The gamma model was used to describe the effect of temperature (Equation (7)), pH (Equation (8)), and water activity (Equation (9)) on the growth rate [22,25].
where Topt, pHopt, Tmin, pHmin, awmin, and pHmax are theoretical minimal, optimal, and maximal values of temperature, pH, and water activity, respectively, for Listeria growth. The inhibitory effects of undissociated nitrite (Equation (10)), undissociated lactate (Equation (11)), undissociated acetate (Equation (12)) and propionate (Equation (12)), were modeled [47] as follows:
where MICNit and MICU are the minimal inhibitory concentrations of nitrite and organic acids, respectively; Nit and [OA] are undissociated nitrite (mM) and respective organic acid (mM) concentrations calculated using Equation (4), respectively. The initial guess values for MICs of nitrite and organic acids as shown in Table 2 were used.
An approach by [47] was used to model the interaction effect (Xi) between gamma factors using Equations (13)–(19).
where [OA1], [OA2], and [OA3] are the undissociated lactic, acetic, and propionic acids, respectively. The Xi (ξ) value indicates the growth or no growth boundary, and the value varies between 0 and 1. The Xi is calculated from Psi (ψ); Psi < 0.5 indicates no interaction (ξ = 1); if Psi is >1, no growth occurs (ξ = 0), and if Psi is <1 and >0.5, μmax (h−1) is reduced depending on Psi values.
2.4. Secondary Modeling Approach
The development of the secondary model involves the estimation of gamma parameter values using the model development dataset (n = 480) in initial fitting procedures. Two studies [28,43] have demonstrated that both “sequential” and “simultaneous” modeling approaches can be used to determine the gamma parameters. The variables estimated by “simultaneous” modeling had no strong correlation in the matrix of correlation analysis, and these parameters were used to develop the final model [43]. The sequential modeling approach involves the estimation of temperature parameters first using temperature variable data only, followed by pH parameters using pH variable data, and so on. In contrast, the simultaneous approach involves the estimation of all parameters at once using a complete dataset. In the current study, due to limited food matrices datasets, only a “simultaneous” modeling approach was employed to build the secondary model. This method generally offers better fit and better parameter estimates in limited and disparate datasets and offers a time advantage [43]. The Mathworks (MATLAB, R2022b Update2) with Optimization toolbox was used for the secondary modeling component of the study. The “lsqcurvefit” function was used to compute the minimum sum of squares of the residual errors by the non-linear fitting module. The “nlparci” function was used to estimate the confidence intervals of the parameters by linear approximation [29].
2.5. Secondary Growth Rate Model Validation
The developed model was validated using the validation dataset (n = 116). The predicted zero growth rates were replaced by a small value of 0.0003 h−1 to estimate numerical values for bias and accuracy validation criteria, as suggested earlier [56]. During model development, the goodness of fit was evaluated using the coefficient of determination (R2) and root mean square error (RMSE). Followed by the validation of the developed model using RMSE, bias factor (Bf), accuracy factor (Af), percent bias (% B), and percent discrepancy (% D) using Equations (20)–(24), respectively. The proportion of relative errors (RE) falling within the acceptable simulation zone (ASZ) with an acceptable boundary of ± 0.5 RE was also used to evaluate the model performance during validation [34,57]. It is suggested that a model describing the growth kinetics of Listeria is considered as good if the Bf is between 0.9 and 1.05, acceptable if it ranges from 0.7 to 0.9 or 1.06 to 1.15, and unacceptable if it is less than 0.7 or greater than 1.15 [58]. An accuracy factor between 1 and 1.5 is deemed acceptable, while an accuracy factor greater than 1.5 is unacceptable.
%D = (Af − 1) × 100%
%B = sgn (ln Bf) ∗ (exp (abs ((ln Bf)−1)) × 100%
2.6. Development of Lag Time Model and Its Validation
The lag time was modeled by following the relative lag time concept (RLT) by estimating the parameter K [25]. This parameter explains the physiological state of cells, a constant value for cells with similar pre-inoculation history. When these cells are exposed to the same favorable growth conditions, the amount of work to be done by bacteria will remain constant to adapt to the newly growing environment. Therefore, the ratio of ln(l/Tg) will produce a constant value, and the linear regression analysis (Figure 1) between ln(l) and ln(Tg) should produce a slope value close to 1. The median value for ln(l/Tg) ratios was estimated, and the exp(median) is the parameter K. Finally, the lag time was calculated using Equation (25). The validation of lag time prediction was done by estimating the bias and accuracy factors between observed and predicted ln(l) using Equations (21) and (22). The mean prediction error (MPE) for lag time was calculated using Equation (26).
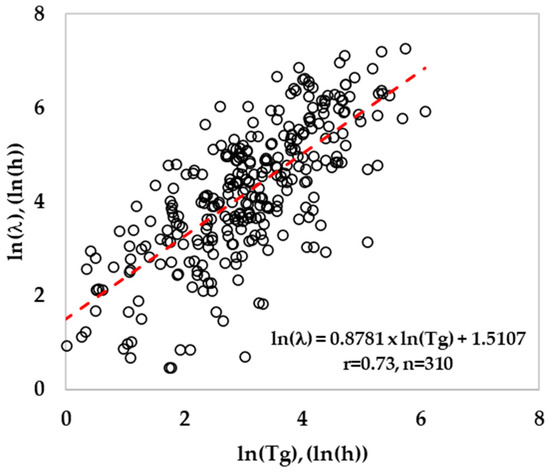
Figure 1.
Relationship between generation time and lag time for Listeria (training data).
3. Results
3.1. Development of a Secondary Model for Listeria Growth Prediction
The logistic-with-delay primary model was fitted to estimate the maximum exponential growth rates (µmax, log CFU/h) and used for secondary modeling. The logistic-with-delay model was used due to widespread usage and recognition in the literature as one of the most accurate models to describe the sigmoidal growth curve of Listeria. This model also accounts for the lag phase accurately, which enhances its reliability and usage. Similarly, the gamma secondary equation was employed in the current study due to its simplicity, robustness, and ability to quantify the effect of multiple factors on the growth of Listeria using the gamma function. Additionally, the gamma equations also describe the growth and no-growth boundaries through a graphical representation. In this context, a secondary model was developed by fitting Equation (6) to growth rates as a function of seven environmental factors. To be consistent with the literature, optimum growth rate (μopt) is reported as h−1, while the actual unit of μopt is log CFU/h. During the initial fitting of gamma equations to the raining dataset, due to the limited growth rate, the pHopt and pHmax values were not estimated. Instead, these values were selected [25,59] and fixed at 7 (pHopt), and 9.6 (pHmax), respectively, in the simultaneous fitting procedure. Except for fixed parameters, the remaining parameters were simultaneously estimated by following the earlier procedures [28,32]. The optimal growth rate (µopt) of the secondary model (Equation (6)) estimated by the model in the present study was 1.126 h−1 across all meats, which was within the range of literature values for processed meat (Table 3). The confidence interval for optimal growth rate (µopt) was slightly high (0.65 to 1.66 h−1) due to the variability in growth rates across the meat products and strain differences. The large variability causes difficulties in defining the growth trends (using µopt) in a mixture of food products. Similarly, a study [29] reported a high variability of µopt between 0.18 and 2.02 h−1 with a mean value of 0.49 ± 0.32 h−1, which includes meat (0.63 ± 0.73 h−1), seafood (3.61 ± 5.71 h−1), beef (0.18 ± 0.14 h−1), and poultry (0.765 ± 0.83 h−1) products. Figure 2a represents the correlation between the observed and predicted growth rates in meat products by the secondary model. Figure 2b shows the histogram plot of residual error, which is an indicator of over- and under-predictions of growth rates by the model. The negative values refer to over-predictions, the positive values refer to under-predictions, and values closer to the zero-region column refer to accurate predictions. The histogram plot with a symmetrical distribution of residual error around zero demonstrates the great robustness and accuracy of the model. In the development stage, the secondary model had a coefficient of determination R2 of 0.86 and RMSE of 0.06 μmax, demonstrating the overall quality of fit across the seven environmental conditions. On the other hand, the gamma model developed for Listeria growth prediction in meat products had an RMSE of 0.081 and R2 of 0.63 [22]. In another study, RMSE ranged between 0.919 and 1.148 and R2 adj from 0.81 to 0.88 for Ratkowsky square root model fitting in Listeria growth rate data in high-pressure processed cooked ham [31].
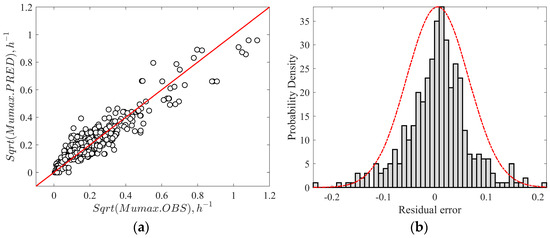
Figure 2.
(a) Correlation between the observed and predicted growth rates of L. monocytogenes. (b) Distribution of the relative error of predicted values by the secondary model.
3.1.1. Estimation of Gamma Model Parameters
The effect of minimum and maximum temperature on the growth rate of Listeria was estimated and summarized in Table 3. The sequential fitting of gamma equations to individual datasets could not be performed due to the limited data available for each factor. Therefore, the model parameters were simultaneously estimated at once using the whole data, following the method reported earlier [28,43]. The temperature parameters, including Topt of 37.0 °C and Tmin of −1.57 °C, were estimated in this study. The estimated Tmin and Topt values for Listeria were within the range of values reported for other gamma models in the literature (Table 3). It is reported that Listeria has a typical Tmin value between 0 and −5 °C in meat products [31,49]. A Tmin value ranging from 0 to −2.83 °C is considered a realistic estimate; while Tmin of −5.8 °C or below could result in an overestimation of the growth rate, particularly at temperatures between 2 and 5 °C [44]. The estimated Topt of 37.0 °C in the present study is consistent with the typical optimum temperature of 37 °C for Listeria growth in meat and poultry products as reported in previous studies [25,47]. The confidence interval for Topt was slightly larger because of the lack of growth data above the temperature optimum region. The estimated pHmin of 4.19, awmin of 0.932, and awopt of 0.998 were consistent with the literature ranges as summarized in Table 3. The slight difference in estimated pHmin, awopt, and awmin values compared to previous studies (literature) was mainly due to strain differences. The large confidence intervals obtained for pHmin were due to the insufficient growth rate data near the pHmin region. The simultaneous modeling technique has no role in yielding a large confidence interval, as reported earlier [28]. In this study, the predicted Listeria growth rate was largely dependent on Tmin and pHmin, which are independent of other growth conditions. This is evident when the growth rate contour plot (Figure 3) was built with temperature and pH as independent variables using Equation (6), for which a no-growth region is highlighted with dark shades. The growth and no growth interface are consistent with previous studies [24].
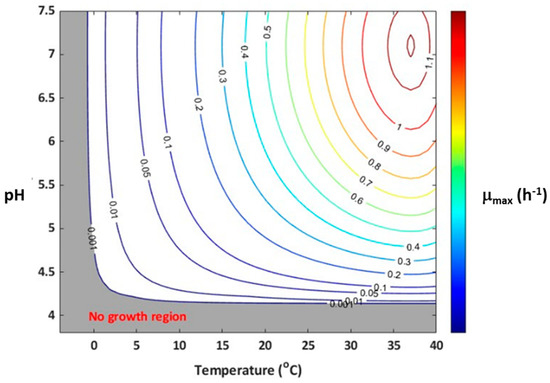
Figure 3.
Growth/no growth contour plot of µmax as a function of pH and temperature. The contour lines represent µmax predicted using Equation (6) with the model parameters reported in Table 3.
3.1.2. Estimation of MICs of Inhibitory Compounds
The inhibitory effect of organic acids is associated with their ability to reduce the water activity of the food matrix and intracellular pH within the bacterial cells. The organic acid existing in the water phase in its undissociated form is most likely to inhibit Listeria growth in the food matrices. This is because the undissociated acid penetrates the cell membrane effectively, reduces the intracellular pH, and disrupts microbial cellular metabolism functions [60]. Therefore, the water phase undissociated concentrations (mM) of the acids were calculated and used for modeling. The estimated MICs (mM) of undissociated nitrite, undissociated water phase organic acids, and their confidence intervals are summarized in Table 3. The estimated MICU of nitrite was 24.82 mM and was close to the value (25 mM) reported earlier [46]. The MICU values for organic acids are typically strain-specific, varying with growth medium and conditions. In this study, the estimated MICU was 18.3 mM for acetic acid, 6.8 mM for lactic acid, and 9.8 mM for propionic acid. In this study, the growth rates under acetic and propionic acid conditions varied linearly with the square root of undissociated acid concentrations, whereas for lactic acid, the growth rates varied linearly. A similar relation between growth rates (μmax) and organic acids was reported earlier [47]. The MICs of organic acids are within the range reported in the literature value shown in Table 3. In another study [42], the MIC varies between 6.2 to 18.9 mM (acetic), 3.6 to 5.7 mM (lactic), and 4 to 8 mM (propionic acid) for nine different Listeria strains, indicating variable sensitivity of strains to organic acids. Similarly, the estimated MICs ranged between 17.8 and 22.8 mM for acetic acid, 6.9 and 9.1 mM for lactic acid, and 7.6 and 9.9 mM for propionic acid in another study [47]. Therefore, the MIC variation in the current study was mostly attributed to strain differences and RTE food matrices to an extent. The large confidence interval for organic acids was attributed to inadequate data in RTE meat products under these acids’ conditions. This was also evident in another study reporting large confidence intervals ranging between 2.46 and 30.2 mM for a MIC value of 16.3 mM (for lactic acid), due to the inadequate growth data under lactate conditions [28].
3.2. Validation of the Secondary Growth Model
Several Listeria models in the literature have been developed in culture media, and limited models have been developed and validated in the RTE meat matrix. It was well established that the growth medium can significantly influence Listeria behavior, particularly the complexity of the food matrix [27]. The porosity in food imbalances microbial stability, while starch ingredients can immobilize the cells of bacteria, resulting in retarded growth of cells in food compared to culture media [38,61]. Therefore, the secondary model developed in this study was validated using exclusive RTE meat matrices data collected from the literature (refer to Table 1, Table 2 and Table 3). The estimated gamma model’s parameters corresponding to L. monocytogenes (shown in Table 3) using Equations (6)–(12) were reused. The model’s prediction was evaluated by comparing the relative errors between observed and predicted growth rates using the acceptable simulation zone (ASZ, ±0.5 log CFU/g/h) approach. The correlation between the square root of observed and predicted growth rates is presented in Figure 4a; the root mean square error (RMSE) criteria was also computed to assess the average prediction error by the model. In the validation step, the model includes an RMSE of 0.076 μmax and a coefficient of determination (R2) = 0.87. For the model predictions, about 81.03% of relative errors were within the acceptable simulation zone (ASZ), which is above the minimum acceptable value of 70% (Figure 4b). The validation of the new secondary model in the present study provided an acceptable Listeria growth prediction.
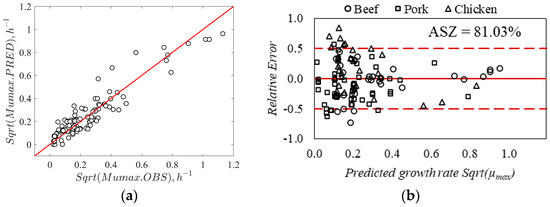
Figure 4.
(a) Correlation between observed data and simulated growth rates by developed model for L. monocytogenes. (b) Distribution of relative errors within acceptable simulation zone for the model predictions.
The model’s performance was also compared with and without an interaction effect. Excluding the interaction, the model overestimated the growth rate by 12% (Bf = 1.12) compared to the model with interaction (Bf = 0.96). The accuracy factor was 1.50 for the model with interaction compared to 1.48 for the model without interaction term, indicating no significant variation in prediction accuracy between the two models. However, the interaction effect is important for the robustness of the model as per previous studies. The Bf (0.96) and Af (1.5) recorded in this study were good and within the acceptable range as reported earlier [58]. For the Listeria growth model, a Bf of 0.97 for the model with interaction and 1.31 for the model without interaction was reported earlier [43]. This study also reported that inaccurate predictions always include both fail-safe and fail-dangerous predictions. However, when an equal proportion of over- and under-estimated growth rates tend to “cancel out”, results in an acceptable bias factor close to one. The Af and Bf values were estimated by replacing the zero-growth predicted (n = 2 at 4 °C) values by 0.0003 h−1, which demonstrated a significant effect on validation criteria (Af value). For example, excluding zero predicted μmax, the estimated Af and Bf values were 1.39 and 1.03, respectively. This demonstrates that these factors are extremely sensitive to small deviations in a few predicted growth rate values, resulting in poor validation criteria, though overall model predictions were good. It is not recommended to exclude fail-dangerous predictions by the model; therefore, the current study replaced the zero predicted values with a small growth rate of 0.0003 h−1 considering an average shelf life of 4.5 months. The percent bias (%B) of 12.7% for the model without interaction was reduced after including the interaction effect (−4.0%). However, the percentage discrepancy (%D) for both models ranged between 48.1 and 50.4% and did not vary significantly (Table 4). A percent discrepancy of 24.54% for sequential modeling and 29.03% for simultaneous modeling methods reported earlier [28] is close to the range observed in the present study. Similarly, the percentage discrepancy ranging from 48 to 72% was reported for predictions with and without acids and interaction effects [43]. The AIC values for the model with interaction were slightly smaller than the model without interaction, suggesting that the model predictions with interaction are better than the latter (Table 4). Similarly, it was evident from previous studies that considering the interaction effect between the factors improves the quality of fit and prediction accuracy. In addition, it is noted that with the exclusion of the interaction term, the ASZ score was reduced by 4.3%. The model with interaction produced an ASZ-score of 81.0%, and the incorrect predictions were fail-safe (8.6%) and fail-dangerous (10.3%) predictions. Typically, a model performance is accepted if at least 70% of its predictions fall within the acceptable simulation zone (ASZ). A study [25] first reported a no-interaction model, which had less prediction accuracy; later, the revised with-interaction model significantly reduced the fail-safe (13.5 to 12.1%) and fail-dangerous (16.1 to 7.1%) predictions [24]. Similarly, the inclusion of the interaction effect to model the correct predictions increased from 69 to 89% [62], and 62–81 to 85–87% [29]. Another gamma model without the interaction term overestimated the growth rate by 31–33% [43]. These studies indicate better prediction accuracy for models with interaction terms. In the present study, both the models with and without interaction effect offered an acceptable bias factor (1.12 and 0.96, respectively) and ASZ score (76.7 to 81%, respectively). In a study, the [62] model produced an overall prediction of 65% (ASZ) in broth data and 89% in meat, seafood, poultry, and dairy products [30].
Table 4.
Comparison of the model performance with and without interaction.
3.3. Validation of Predicted Lag Time in RTE Meats
A total of 596 growth and no growth data were collected in this study, out of which only 480 growth rate (μmax) data and their corresponding lag time (including lag = 0) qualified the first filter criteria (Table 5) to develop a secondary growth rate model. The second filter criteria were applied to exclude zero lag time and select good quality data for lag time modeling. Out of 480 training data, about 310 lag time values were used to estimate the parameter K. Similarly, out of 116 validation lag time values, about 80 lag time values (excluding R2 ≤ 0.9, Obs. lag < 1 h, Pred. μmax < 0.0001/h (n = 2)) were used to validate the lag time model. The logarithmic ratio of lag and generation time resulted in a median value of 1.31, and the exponential of the median value was estimated to be 3.72 (parameter K). During validation, the lag time was estimated using Equation (25) with the value of growth rate from the growth rate model with interaction and with the previously estimated physiological state of cells (K = 3.72). In a similar study, a median value = 1.128 and K = 3.09 were estimated (n = 1176) for Listeria, including culture broth, dairy, meats, eggs, and seafood as growth mediums [25]. The K value in the current study for RTE meat products is slightly higher (3.72) than the previous study (3.09), and it may be attributed to K estimated from a mixture of culture broth (shorter lag phase), dairy, and seafood. In this study, the estimated Bf was 1.07 for the lag time model, indicating that the predicted lag time was fail-dangerous by 7% for the validation dataset (Figure 5). The mean prediction error (MPE) for the lag time model estimated using Equation (26) was 137.3% for the training dataset, which was slightly less (128.8%) for the validation dataset. The RMSE value for the predicted lag time was 0.98 ln(h), and the correlation coefficient (r) was 0.71. The lower correlation coefficient indicates that the lag time model is less accurate than the growth rate model.
Table 5.
Listeria growth data in beef products, product characteristics, and storage conditions.
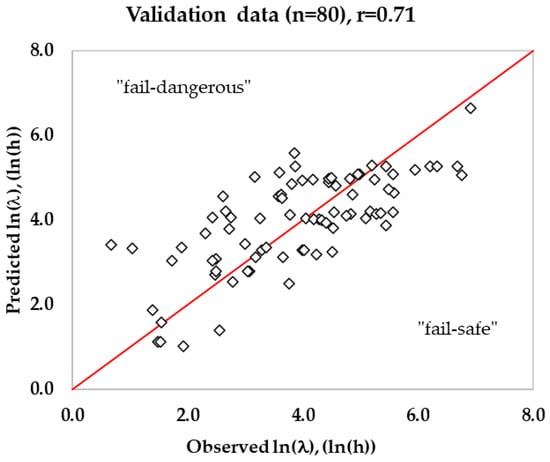
Figure 5.
Predicted lag time by the developed gamma model against observed lag time in RTE meats for the validation data set.
4. Discussion
In the current study, we demonstrated a method to develop and validate an improved secondary model using limited and disparate RTE meat matrix data from the literature. The model may be used to predict the growth of L. monocytogenes in ready-to-eat and processed meat and poultry products. To date, several models have been developed using culture media data; very few models are validated in the food matrices, and limited models have been developed and validated in exclusive food matrix data. In this context, this study demonstrated that the “simultaneous” modeling approach is an effective method to develop and validate new models for different pathogens using limited literature data in food matrices. In the validation step, the developed model prediction was evaluated across the different meat products. The validation data included 29 growth rates in beef products, 56 growth rates in pork products, and 31 growth rates in chicken products. The developed model growth rate predictions were fail-dangerous by 9% and 6% in beef and chicken, respectively, and fail-safe by 3% in pork products (Figure 7a–g). The under-prediction in beef meat was associated with the presence of multiple organic acids and nitrite in the product formulation, and most of these data were within the temperature range of 4 to 10 °C. The overestimation of the synergistic effect between multiple factors (low temperature and antimicrobials) resulted in the fail-dangerous predictions by the model. In contrast, the failure-dangerous prediction in chicken products was because the model underpredicted the growth rates at low pH (<5.6) conditions. The RMSE for beef products was found to be the highest (0.091, μmax) compared to beef (0.079, μmax) and pork (0.059, μmax) products. The interaction effect between environmental factors, as described by Psi (ψ) values, is shown in Figure 6. About 9.2% of Psi (ψ) values ranged between 0.5 and 1, indicating the interaction effect between the factors. The interaction effect was almost zero when the temperature was close to optimum, whereas it exponentially increased with a decrease in temperature. These observations indicate that the interaction between temperature and organic acids was significant. Particularly, the highest interaction effect was recorded under low-temperature conditions including a combination of multiple microbial inhibitors. The effect of antimicrobials and their synergistic effects may slightly subside when the temperature of growing conditions increases close to optimum value. However, the effect of temperature on the inhibitory potential of antimicrobials and the interaction between these factors could not be comprehensively assessed in high-temperature regions (20 to 37 °C) due to the lack of antimicrobial data at higher temperature conditions.
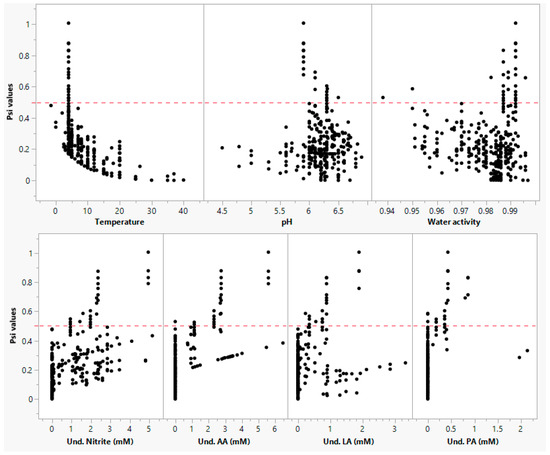
Figure 6.
Interaction effects under different environmental conditions. Note: AA, LA, and PA refer to milli molar concentration (mM) of undissociated acetic acid, lactic acid, and propionic acid, respectively.
During modeling, where there is limited data to estimate certain parameters, it is recommended to fix these cardinal parameters without estimating them. This approach can reduce variation, as suggested by [28]. In many studies, the Topt value was fixed at 37 °C during the fitting procedure, when the available growth data are limited above the temperature optimum. However, this is inappropriate when adequate data exists because it may result in over- or under-estimation of the growth rate. This is because a fixed Topt value may impact the smoothness of fit (skewed fit), leading to inaccurate growth rate prediction, as evident in this study. However, when modeling a single strain, the strain-specific parameters (Topt) may be fixed, as demonstrated by [32]. For example, in their study, Topt was fixed at 38.9 °C for L. monocytogenes ADQP105, and other parameters were estimated. Due to the lack of sufficient data for temperatures above the optimum range, the model’s applicability in some storage and processing scenarios is limited. Nevertheless, the cardinal parameters estimated in the present study are consistent with the literature values. In this study, the model slightly underestimated the growth rate at temperatures between 30 °C and 37 °C (n = 3) and −1.5 °C (n = 1). Conversely, at 4 °C, the model predicted zero growth in two conditions, including multiple antimicrobials (2.2 to 4.9 mM nitrite, 2.69 to 5.58 mM acetate, 0.88 to 1.88 mM lactate, and 0.39 to 0.42 mM propionate) in RTE ham [81]. This was because of the overestimation of interaction effects between factors by the model. In contrast, the model predictions were fail-safe, particularly at the lower temperature range between 4 and 6 °C due to the synergistic effect of multiple organic acids under these conditions (Figure 7a).
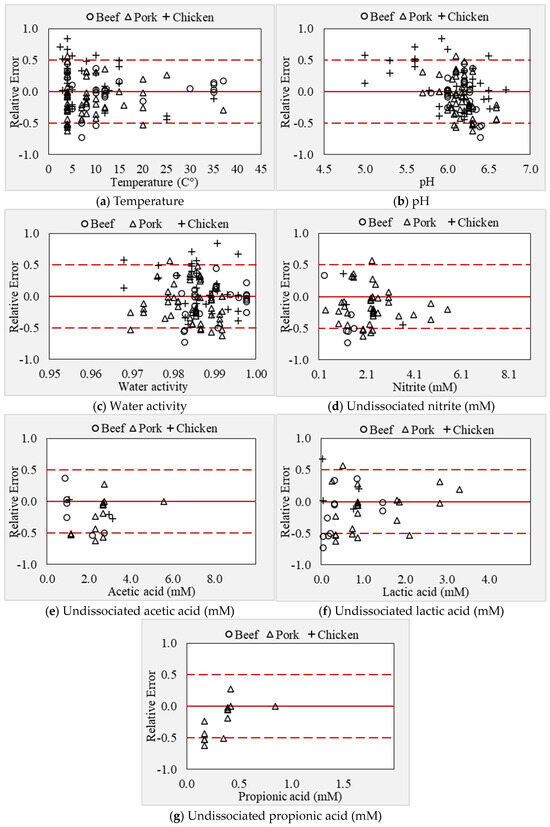
Figure 7.
(a–g) Relative error plots as a function of storage and inhibitory factors.
The MICs of undissociated nitrite and organic acids estimated in this study slightly varied from literature values (Table 3), and this could be due to variability in strains, food matrices, endogenous inhibitors (e.g., natural lactic acid), and their interactions with added acids, acid calculation method, modeling techniques, and experimental methods used [27]. For example, the MICs of lactic acid ranged from 3.6 to 5.7 mM across nine strains, MICs of acetic acid ranged from 6.2 to 18.9 mM across four strains, and MICs of propionic acid ranged from 4 to 8 mM across three strains [42]. Previous studies have reported a significant difference in growth parameters between strains of L. monocytogenes [43,82]. It is important to mention that the MIC estimated in culture media would be different from the MIC estimated in the meat matrix, including background microflora and growth inhibitors. A study by [83] recorded that the Listeria growth rate was different under different food matrices, and the exponential growth rate varied significantly among twenty Listeria strains. Therefore, establishing a universal MIC value for organic acids is challenging due to intra-species variation. Another study [48] reported the dependency of MICs of undissociated acids on pH and a significant variation in MICs of organic acids between the Listeria strains. This study also indicated that strain variation significantly influences the concentration of acids required to inhibit growth. For instance, in their study, the MICs for different strains for the pH range studied varied between 12.2 and 30.2 mM for acetic acid and 4.7 and 25.1 mM for propionic acid. The optimized MICs in the current study could be a universal MIC value for all inhibitory compounds in different meat products, including added acids and endogenous lactic acid. In addition, the wide confidence intervals for the MICs of inhibitory compounds could be either due to Listeria strain differences or limited data points in particular regions [42,48,84]. In the current study, the large confidence intervals of MIC of antimicrobials and curing agents were attributed to a lack of growth data, which is one of the limitations of this study. In addition, another study [48] reported that limited (2 to 46 data points per acid) MICs of undissociated acids for L. monocytogenes are available in the literature; such large intervals of undissociated acid values may result in the approximate estimation of the minimal acid concentration that prevents Listeria growth. Therefore, for accurate estimation of the MICs of antimicrobials, it is important to have adequate datasets with closer intervals of undissociated acids. In addition, the undissociated acid concentrations were calculated in this study based on the total volume of food (meat), while acid dissociates in the water phase of unknown volume. The concentration of acids in the water phase is more than the concentration in total meat, which certainly explains the differences in MICs estimated in different studies [27]. Another reason for MIC variations is the differences in the growth substrate, as most literature MICs were estimated in culture media, while the present study estimated MIC in meat matrix.
In this study, the model prediction was impacted by the presence of additional antimicrobial or additive compounds in meat formulations that were not considered in the modeling. For instance, in a few studies, the product formulation included one or more compounds such as sodium erythrobate, phosphate, sodium bicarbonate, sodium triphosphate, sodium ascorbate, and other seasoning blends [67,85,86,87,88,89]. Similarly, RTE products such as ham, frankfurters, smoked meat, and sausages included phenols generated from smoke components. These additives may have an indirect inhibitory effect; a study [49] demonstrated the effect of phenols (>10 ppm) in smoked meats on Listeria growth and on Af and Bf values. Similarly, in the present study, the model overpredicted growth rates in a few products containing the above additives. Therefore, to improve the accuracy of the model’s predictions, it is crucial to consider all the factors that have the potential to inhibit the growth of Listeria. At present, there is no single model that considers all factors that may be relevant to all types of food. Therefore, it is important to clearly state the limitations of predictive models to users, including the range of conditions, interpolation region, and the variables considered.
The validation of models in food matrices is important in predictive microbiology as it builds confidence for acceptance. Undoubtedly, listeria growth in culture media differs from food matrix as growth is slower in the latter. Model validation in culture media often overestimates the growth in the food matrix due to the complexity of food structure affecting the spatial distribution of bacteria [37]. In the present study, the model was validated in food matrices (n = 116) which include ready-to-eat products of beef, pork, and poultry (Table 5, Table 6 and Table 7). The developed secondary model can quantify Listeria growth as observed in naturally contaminated RTE food as a function of seven factors studied. The model is useful to simulate the inhibitory effect of antimicrobials and predict the growth of Listeria in the presence of nitrite, organic acids, or a combination of nitrite and organic acids in ready-to-eat meat products. The current study presents an improved model that is considered to predict the listeria growth that is observed in naturally contaminated food products. A model developed and validated in RTE meats may offer better prediction than the broth and generalized foods model. In comparison to the broth model, the meat matrix models may assist in avoiding overprocessing of food, significantly reducing the ingoing and cost of antimicrobials and reducing potential health risks of antimicrobials. The model may be helpful to food manufacturers to reduce the number of challenge studies, formulate or reformulate, and assess the microbial safety of food.
Based on the correlation coefficient, the developed lag time model was less accurate than the growth rate model in this study. To measure the accuracy of the lag time model, the mean and median errors were estimated following the method reported earlier [25]. The % mean error of the lag time model was found to be 128.8% and was slightly less than the 133% reported earlier [25]. If the observed lag phase was close to zero while the predicted lag was a small lag phase, the % mean error was extremely high, even though the actual error was relatively small. If the predicted lag phase is large, then the % mean error would be immensely high. Due to this reason, the median error was calculated, which would be a better representation. The % median error for the lag time was also still higher, 61.1% (validation dataset), indicating that the prediction of lag time is a big challenge. The estimated mean and median error in this study was close to 133% and 62% reported earlier [25] for lag prediction in a mixture of culture broth and RTE foods (eggs, dairy, seafood, and meat products). The Bf of 1.07 indicated that the predicted lag time was 7% biased in the current study compared to the 3% bias reported in the above study. The experimental variability and the unpredictable Listeria behavior result in lag phase variability, which is higher than that for the growth rate. The lag phase occurs at the extreme end of the microbial growth curves and therefore is highly susceptible to experimental error. In addition, large growth rate data are used to develop a valid model, while a limited number of lag data are generally available for lag time modeling. The longer lag phases are observed under extreme stress conditions such as low temperature and high concentration of antimicrobials, where the bacterial cells experience maximum stress, resulting in high variability. For example, a study reported a 0 h lag time at 5 °C, while at 8 °C a higher lag time of 231 h was recorded in comminuted beef [63]. Similarly, another study on cooked pork ham reported a lag time of 0 h at 4 °C and 94 h at 10 °C [90]. Due to this reason, the accuracy of the lag time model for Listeria will be poor. For example, an Af of 2.23 was recorded in the current study for the lag time prediction in validation data. The high variability of lag resulted in a large spread in the scatter plot (Figure 5) between ln(l) vs. ln(Tg.) and a large distribution of the ratio ln(l/Tg). This suggests that the initial assumption of negligible effect of stress conditions on the ratio for cells having similar preincubation history, may not be accurate. This is because there is sufficient evidence in the literature that the ratio ln(l/Tg.) decreases as temperature, pH, and aw approach the optimum values, indicating that the amount of work to be done may be reduced as growth conditions approach optimal [25,91]. The lag time estimated by the model under extreme stress conditions was less accurate compared to mild stress under optimal conditions. Similarly, pre-incubation temperature is also crucial, because a lower pre-incubation temperature could shorten the lag phase duration at low temperatures, while a higher pre-incubation temperature could extend the lag phase duration [92]. Furthermore, the initial inoculum levels, although they do not affect significantly on growth rate, affect the lag phase durations. The low inoculum levels would produce longer lag phases compared to shorter lag phases under high inoculum levels [93,94]. Another reason for the variability in lag time may be because of the strain difference that contributed to the variation in the ratio of lag and generation time [95]. Therefore, it is observed that accurate prediction of the lag phase is more challenging than growth rates. Due to this reason, there are limited studies published on the lag time model in the literature. Therefore, a combination of large datasets (lag time) along with advanced predictive modeling approaches, such as AI models that account for environment and physiological variability, seems to be promising for achieving better accuracy in lag time modeling.
Table 6.
Listeria growth data in pork products, product characteristics, and storage conditions.
Table 6.
Listeria growth data in pork products, product characteristics, and storage conditions.
| Products | No. of Strains | n | T (°C) | pH | NaCl | aw | Acetate (%) | Lactate (%) | Propionate (%) | Nitrite (ppm) | Data Source | Reference |
|---|---|---|---|---|---|---|---|---|---|---|---|---|
| Wiener pork and Bratwurst | 5 | 4 | 3–7 | 5.9–6.3 | 1.5–2 | 0.97–0.98 | 1–6 | 156 | Pub | [14] | ||
| Ground cooked ham | 5 | 36 | 4–10 | 5.7–6.1 | 2.4 | 0.986 | 1–2 | 1 | Cb | [90] | ||
| Cooked Pork liver sausage | 1 | 24 | 5–20 | 6.01–6.12 | 2–4 | 0.97–0.98 | 0–4 | 98.5 | Pub | [96] | ||
| Sliced cooked ham | 6 | 9 | 7 | 6.22 | 3 | 0.978 | 0–3 | Cb | [97] | |||
| RTE Products | 5 | 4 | 4 | 6.13–6.2 | 2 | 0.983–0.99 | 0–2.5 | 97 | Pub | [87] | ||
| Cooked Cured sliced ham | 3 | 18 | 4–12 | 6.2 | 2.8 | 0.979 | 0–2 | 190 | Pub | [86] | ||
| Ham | 8 | 3 | 4 | 6.27–6.42 | 2.2 | 0.984 | 0.108–0.12 | Pub | [65] | |||
| Pork-beef frankfurter | 3 | 18 | 4–12 | 6.02–6.17 | 2.2 | 0.979 | 0.2 | 156 | Pub | [98] | ||
| Pork-beef bologna | 5 | 1 | 4 | 6.07–6.14 | 2.13–2.16 | 0.979–0.98 | 0–0.05 | 156 | Pub | [88] | ||
| Cooked ham and Mortadella | 1 | 12 | 4–12 | 6.1–6.3 | 2.5–2.8 | 0.976–0.979 | 0.43–0.7 | 102 | Pub | [31] | ||
| Pork Bologna | 10 | 4 | 4–10 | 6.3–6.5 | 2 | 0.98 | 0–1.8 | 156 | Pub | [99] | ||
| Servelat sausage and cooked ham | 3 | 4 | 4–9 | 6–6.3 | 2–2.5 | 0.98 | 0–2.5 | Pub | [100] | |||
| Sliced Cooked Ham | 5 | 5 | 4 | 6.39 | 2.59 | 0.967 | 1.6 | 156 | Pub | [101] | ||
| RTE ham model | 5 | 90 | 4 | 5.5–6.6 | 0.5–2.5 | 0.98–0.99 | 0–0.74 | 0–3.06 | 0.05–0.3 | 0–200 | Pub | [81] |
| Sliced cooked Cured ham | 3 | 8 | 5–10 | 6.2 | 2 | 0.985 | 0-0.2 | 98.5 | Pub | [102] | ||
| Cooked sliced ham | 3 | 5 | 8 | 6.2 | 3 | 0.978 | Cb | [103] | ||||
| Pack Slice Cook Pork | 1 | 2 | 4 | 5.99–6.05 | 2 | 0.985 | Cb | [104] | ||||
| Ham | 1 | 14 | 0–15 | 6.1–6.4 | 2.2–2.4 | 0.982–0.984 | 84–110 | Cb | [105] | |||
| Pork ham | 1 | 8 | 0–15 | 6.6 | 2.7–4 | 0.97–0.98 | 11–170 | Cb | [73] | |||
| Ham | 1 | 10 | 47.2 | 6.4 | 2 | 0.985 | Cb | [106] | ||||
| Mortadella (bologna ham) | 2 | 10 | 8 | 6.19 | 2 | 0.981 | 60 | Cb | [107] | |||
| Cooked cured pork shoulder | 1 | 12 | 0–16 | 6.26 | 2 | 0.985 | 150 | Cb | [108] | |||
| RTE ham and sausages | 3 | 8 | 4–35 | 6.2 | 1.8–2.2 | 0.984–0.986 | Pub | [109] | ||||
| Cooked Cured Pork Sausage | 5 | 30 | 7 | 6.59 | 1.84 | 0.985 | 50–300 | Pub | [110] | |||
| Cooked ham | 1 | 2 | 7 | 6.1–6.2 | 2.2 | 0.984 | Cb | [71] | ||||
| Pork Live pate | 5 | 16 | 4–10 | 6–6.15 | 1–3 | 0973–0.991 | 0–200 | Pub | [111] | |||
| Sliced Cooked ham | 1 | 5 | 2–15 | 6.07 | 2.72 | 0.98 | 100 | Pub | [85] | |||
| Processed meats- bologna | 5 | 7 | 4.4 | 4.8–6.3 | 2.3–3 | 0.95–0.97 | 0–48 | Pub | [79] | |||
| Pork Chorizo | 1 | 13 | 5–30 | 4.79–6.5 | 1.84 | 0.984 | Pub | [112] | ||||
| Meatballs and Sundae | 7 | 10 | 5–37 | 5.6–6.9 | 0.5–2.1 | 0.997–0.989 | Pub | [113] |
Search criteria in ComBase: beef, poultry, turkey, chicken, pork, RTE meat products, except seafood, Listeria, static condition. n is the number of growth curves. Bold type: assumed values. The assumed nitrite value is the average nitrite concentration reported in other products. Data source: Pub—publications, Cb—ComBase, PC—personal communication.
Table 7.
Listeria growth data in poultry products, product characteristics, and storage conditions.
Table 7.
Listeria growth data in poultry products, product characteristics, and storage conditions.
| Products | No. of Strains | n | T (°C) | pH | NaCl (%) | aw | Acetate (%) | Lactate (%) | Propionate (%) | Nitrite (ppm) | Data Source | Reference |
|---|---|---|---|---|---|---|---|---|---|---|---|---|
| Turkey slurry | 4 | 6 | 4–25 | 5.2–6.2 | 1.3–2.1 | 0.98–0.99 | 0–2.5 | 200 | Pub | [114] | ||
| RTE sliced turkey breast | 3 | 18 | 4–12 | 6.2 | 2.2 | 0.98 | 0–2 | Pub | [86] | |||
| Uncured Turkey | 8 | 7 | 4 | 6.1–6.4 | 2 | 0.98 | 98.5 | Pub | [65] | |||
| Uncured turkey | 5 | 1 | 4 | 6.19 | 2 | 0.98 | 0.05 | Pub | [101] | |||
| Comminuted Chicken | 3 | 9 | 5–35 | 6.5 | 2 | 0.98 | 0–4 | Pub | [66] | |||
| Chicken salad | 5 | 5 | 4–12.8 | 5.6–6 | 0.61 | 0.99 | 0.045–0.051 | Cb | [115] | |||
| Sliced cooked Turkey bologna | 7 | 3 | 4 | 6.5–6.7 | 2 | 0.98 | 0–0.5 | 0–2 | 156 | Pub | [116] | |
| Sliced Cooked Ham | 5 | 5 | 4 | 6.42 | 1.7 | 0.972 | 3.2 | 0.05–0.3 | Pub | [88] | ||
| Cured Deli Style Turkey | 5 | 8 | 4–7 | 6.1–6.4 | 1.7–1.8 | 0.97 | 1.8 | 0.2–0.5 | Pub | [89] | ||
| Turkey bologna | 5 | 2 | 4–7 | 6.17 | 2.2 | 0.973 | 1.6 | 60 | Pub | [117] | ||
| RTE turkey meat | 1 | 2 | 10 | 6.2 | 2.5 | 0.98 | Pub | [118] | ||||
| Sliced roasted turkey | 3 | 3 | 5–10 | 6.2 | 2.5 | 0.98 | Pub | [102] | ||||
| Chicken liver pate or minced chicken breast | 1 | 2 | 6.8–30.4 | 5.6 | 0.8 | 0.99 | Cb | [119] | ||||
| Precooked chicken nuggets | 1 | 3 | 3–11 | 6.5 | 1.5 | 0.98 | Pub | [120] | ||||
| Chicken breast | 2 | 30 | 0–15 | 5.6 | 2–4 | 0.97–0.98 | Cb | [76] | ||||
| Dark-meat chicken nuggets | 1 | 3 | 3–11 | 6.5 | 1.5 | 0.98 | Cb | [121] | ||||
| Sliced Chicken Breast | 1 | 2 | 7 | 6.2 | 2.8 | 0.97 | Cb | [71] | ||||
| RTE chicken salad | 3 | 9 | 4–16 | 5.93 | 1.3 | 0.99 | Pub | [122] | ||||
| Chicken nuggets | 6 | 5 | 4–16 | 6.21 | 1.5 | 0.98 | Pub | [123] | ||||
| Chicken salad | 3 | 9 | 5–25 | 5.9 | 0.612 | 0.99 | Pub | [124] | ||||
| Processed meats- Sliced chicken | 5 | 3 | 4.4 | 6.3–6.5 | 1.7–2.7 | 0.97–0.98 | Pub | [79] | ||||
| Cooked deli turkey breast | 5 | 31 | 5 | 6.1–6.83 | 0.6–2.5 | 0.996–0.982 | 0–1.35 | Pub/PC | [125] |
Search criteria in ComBase: beef, poultry, turkey, chicken, pork, RTE meat products, except seafood, Listeria, static condition. n is the number of growth curves. Bold type: assumed values. The assumed nitrite value is the average nitrite concentration reported in other products. Data source: Pub—publications, Cb—ComBase, PC—personal communication.
5. Conclusions
The current study was conducted to develop and validate an improved prediction model to describe the effects of pH, temperature, aw, nitrite, and organic acids on the growth rate of Listeria in RTE meat matrices. The gamma model was used to quantify the behavior of listeria in ready-to-eat products. It was evident from the present study that better modeling and parameter estimation can be achieved through a simultaneous modeling approach. This approach would enable modelers to develop more robust models on limited and disparate data sets. The current study presents an improved Listeria growth prediction model developed and validated in food matrices data. The model performance included Bf = 0.96, Af = 1.5, and RMSE = 0.06 μmax, indicating the robustness of the model’s prediction. The developed model could offer predictions close to natural growth in meat products. The lag time model compared to the growth rate model is less accurate for lag time prediction. The growth rate model may find its application for microbiological food safety assessment and may be incorporated into a predictive toolbox for research and development purposes. One of the advantages of gamma models is that the impact of a change in the level of a single variable can be calculated without having to reassess the entire equation. This ability to determine the relative effects of different changes could be valuable in risk assessment, particularly when conducting sensitivity analyses aimed at assessing potential strategies for risk analysis.
Author Contributions
N.A.N.G.: Conceptualization, Data curation, Visualization, Formal analysis, Methodology, Investigation. M.S.: Data curation, Writing—review and editing. G.L.: Writing—review and editing. E.H.: Writing—review and editing. S.K.: Writing—review and editing. J.S.: Writing—review and editing, Project administration, Supervision. All authors have read and agreed to the published version of the manuscript.
Funding
This study was funded and supported by Kerry Inc., USA.
Institutional Review Board Statement
Not applicable.
Informed Consent Statement
Not applicable.
Data Availability Statement
The original contributions presented in the study are included in the article, further inquiries can be directed to the corresponding author.
Conflicts of Interest
Authors (Gijs Lommerse, Saurabh Kumar, Eelco Heintz) work for Kerry Inc. Kerry develops and sells innovative and science-led, antimicrobial solutions for the food industry to control Listeria monocytogenes outgrowth and enhance food safety. This study does not pertain to the efficacy of antimicrobials manufactured by Kerry Ingredients. Authors from Kerry helped in identifying the need for study and discussion on the application of models and industrial relevance. The remaining authors declare that the research was conducted in the absence of any commercial or financial relationships that could be construed as a potential conflict of interest.
References
- Buchanan, R.L.; Gorris, L.G.M.; Hayman, M.M.; Jackson, T.C.; Whiting, R.C. A Review of Listeria Monocytogenes: An Update on Outbreaks, Virulence, Dose-Response, Ecology, and Risk Assessments. Food Control 2017, 75, 1–13. [Google Scholar] [CrossRef]
- CDC Listeira (Listeriosis). Available online: https://www.cdc.gov/listeria/index.html (accessed on 10 October 2022).
- Hwang, C.-A.; Sheen, S. Growth Characteristics of Listeria Monocytogenes as Affected by a Native Microflora in Cooked Ham under Refrigerated and Temperature Abuse Conditions. Food Microbiol. 2011, 28, 350–355. [Google Scholar] [CrossRef] [PubMed]
- Zhang, X.; Wang, S.; Chen, X.; Qu, C. Review Controlling Listeria Monocytogenes in Ready-to-Eat Meat and Poultry Products: An Overview of Outbreaks, Current Legislations, Challenges, and Future Prospects. Trends Food Sci. Technol. 2021, 116, 24–35. [Google Scholar] [CrossRef]
- Potter, A.; Murray, J.; Lawson, B.; Graham, S. Trends in Product Recalls within the Agri-Food Industry: Empirical Evidence from the USA, UK and the Republic of Ireland. Trends Food Sci. Technol. 2012, 28, 77–86. [Google Scholar] [CrossRef]
- Paramithiotis, S.; Drosinos, E.H.; Skandamis, P.N. Food Recalls and Warnings Due to the Presence of Foodborne Pathogens—A Focus on Fresh Fruits, Vegetables, Dairy and Eggs. Curr. Opin. Food Sci. 2017, 18, 71–75. [Google Scholar] [CrossRef]
- Soon, J.M.; Brazier, A.K.M.; Wallace, C.A. Determining Common Contributory Factors in Food Safety Incidents—A Review of Global Outbreaks and Recalls 2008–2018. Trends Food Sci. Technol. 2020, 97, 76–87. [Google Scholar] [CrossRef]
- EFSA-ECDPC. The European Union One Health 2021 Zoonoses Report. EFSA J. 2022, 20, e7666. [Google Scholar] [CrossRef]
- FSIS-USDA. 9 CFR Part 430: Control of Listeria Monocytogenes in Ready-to-Eat Meat and Poultry Products. Food Saf. Insp. Serv. Fed. Regist. 2015, 80, 35178–35188. [Google Scholar]
- European Commission. Commission Regulation (EC) No 2073/2005 of 15 November 2005 on Microbiological Criteria for Foodstuffs; European Commission: Brussels, Belgium, 2005; pp. 1–26.
- Health-Canada Policy on Listeria Monocytogenes in Ready-to-Eat Foods. Available online: https://www.canada.ca/en/health-canada/services/food-nutrition/legislation-guidelines/policies/policy-listeria-monocytogenes-ready-eat-foods-2011.html (accessed on 10 October 2022).
- Australian-Government. Australia New Zealand Food Standards Code—Standard 1.6.1–Microbiological Limits in Food, Schedule 27; Australian-Government: Canberra, Australia, 2017.
- de Noordhout, C.M.; Devleesschauwer, B.; Angulo, F.J.; Verbeke, G.; Haagsma, J.; Kirk, M.; Havelaar, A.; Speybroeck, N. The Global Burden of Listeriosis: A Systematic Review and Meta-Analysis. Lancet Infect. Dis. 2014, 14, 1073–1082. [Google Scholar] [CrossRef]
- Glass, K.A.; Granberg, D.A.; Smith, A.L.; Mcnamara, A.M.; Hardin, M.; Mattias, J.; Ladwig, K.; Johnson, E.A. Inhibition of Listeria Monocytogenes by Sodium Diacetate and Sodium Lactate on Wieners and Cooked Bratwurst. J. Food Prot. 2002, 65, 116–123. [Google Scholar] [CrossRef]
- Lu, Z.; Sebranek, J.G.; Dickson, J.S.; Mendonca, A.F.; Bailey, T.B. Inhibitory Effects of Organic Acid Salts for Control of Listeria Monocytogenes on Frankfurters. J. Food Prot. 2005, 68, 499–506. [Google Scholar] [CrossRef]
- Sansawat, T.; Zhang, L.; Jeong, J.Y.; Xu, Y.; Hessell, G.; Ryser, E.T.; Harte, J.B.; Tempelman, R.; Kang, I. Inhibition of Listeria Monocytogenes in Full- and Low-Sodium Frankfurters at 4, 7, or 10°C Using Spray-Dried Mixtures of Organic Acid Salts. J. Food Prot. 2013, 76, 1557–1567. [Google Scholar] [CrossRef]
- European-Commission. Regulation (EC) No 1333/2008 of the European Parliament and of the Council on Food Additives. Off. J. Eur. Union 2008, 354, 16e33. [Google Scholar]
- FDA 21CFR172.135—Food Additives Permitted for Direct Addition to Food for Human Consumption; Food & Drug Administration: Silver Spring, MD, USA, 1994; p. 21.
- Samelis, J.; Sofos, J.N.; Kain, M.L.; Scanga, J.A.; Belk, K.E.; Smith, G.C. Organic Acids and Their Salts as Dipping Solutions to Control Listeria Monocytogenes Inoculated Following Processing of Sliced Pork Bologna Stored at 4 °C in Vacuum Packages. J. Food Prot. 2001, 64, 1722–1729. [Google Scholar] [CrossRef]
- Mani-López, E.; García, H.S.; López-Malo, A. Organic Acids as Antimicrobials to Control Salmonella in Meat and Poultry Products. Food Res. Int. 2012, 45, 713–721. [Google Scholar] [CrossRef]
- Skjerdal, T.; Gangsei, L.E.; Alvseike, O.; Kausrud, K.; De Cesare, A.; Alexa, E.-A.; Alvarez-Ordóñez, A.; Moen, L.H.; Osland, A.M.; From, C.; et al. Development and Validation of a Regression Model for Listeria Monocytogenes Growth in Roast Beefs. Food Microbiol. 2021, 98, 103770. [Google Scholar] [CrossRef]
- Giffel, M.C.; Zwietering, M.H. Validation of Predictive Models Describing the Growth of Listeria Monocytogenes. Int. J. Food Microbiol. 1999, 46, 135–149. [Google Scholar] [CrossRef]
- Silva, B.N.; Cadavez, V.; Teixeira, J.A.; Ellouze, M.; Gonzales-Barron, U. Cardinal Parameter Meta-Regression Models Describing Listeria Monocytogenes Growth in Broth. Food Res. Int. 2020, 136, 109476. [Google Scholar] [CrossRef]
- Augustin, J.-C.; Carlier, V. Modelling the Growth Rate of Listeria Monocytogenes with a Multiplicative Type Model Including Interactions between Environmental Factors. Int. J. Food Microbiol. 2000, 56, 53–70. [Google Scholar] [CrossRef]
- Augustin, J.-C.; Carlier, V. Mathematical Modelling of the Growth Rate and Lag Time for Listeria Monocytogenes. Int. J. Food Microbiol. 2000, 56, 29–51. [Google Scholar] [CrossRef]
- LeMarc, Y.; Pin, C.; Baranyi, J. Methods to Determine the Growth Domain in a Multidimensional Environmental Space. Int. J. Food Microbiol. 2005, 100, 3–12. [Google Scholar] [CrossRef]
- Zuliani, V.; Lebert, I.; Augustin, J.-C.; Garry, P.; Vendeuvre, J.-L.; Lebert, A. Modelling the Behaviour of Listeria Monocytogenes in Ground Pork as a Function of PH, Water Activity, Nature and Concentration of Organic Acid Salts. J. Appl. Microbiol. 2007, 103, 536–550. [Google Scholar] [CrossRef]
- Pujol, L.; Kan-King-Yu, D.; Le Marc, Y.; Johnston, M.D.; Rama-Heuzard, F.; Guillou, S.; McClure, P.; Membré, J.-M. Establishing Equivalence for Microbial-Growth-Inhibitory Effects (“Iso-Hurdle Rules”) by Analyzing Disparate Listeria Monocytogenes Data with a Gamma-Type Predictive Model. Appl. Environ. Microbiol. 2012, 78, 1069–1080. [Google Scholar] [CrossRef]
- Coroller, L.; Kan-King-Yu, D.; Leguerinel, I.; Mafart, P.; Membré, J.-M. Modelling of Growth, Growth/No-Growth Interface and Nonthermal Inactivation Areas of Listeria in Foods. Int. J. Food Microbiol. 2012, 152, 139–152. [Google Scholar] [CrossRef]
- Martinez-Rios, V.; Gkogka, E.; Dalgaard, P. New Term to Quantify the Effect of Temperature on PHmin-Values Used in Cardinal Parameter Growth Models for Listeria Monocytogenes. Front. Microbiol. 2019, 10, 1510. [Google Scholar] [CrossRef]
- Hereu, A.; Dalgaard, P.; Garriga, M.; Aymerich, T.; Bover-Cid, S. Analysing and Modelling the Growth Behaviour of Listeria Monocytogenes on RTE Cooked Meat Products after a High Pressure Treatment at 400 MPa. Int. J. Food Microbiol. 2014, 186, 84–94. [Google Scholar] [CrossRef]
- Couvert, O.; Guégan, S.; Hézard, B.; Huchet, V.; Lintz, A.; Thuault, D.; Stahl, V. Modeling Carbon Dioxide Effect in a Controlled Atmosphere and Its Interactions with Temperature and PH on the Growth of L. Monocytogenes and P. Fluorescens. Food Microbiol. 2017, 68, 89–96. [Google Scholar] [CrossRef]
- McClure, P.J.; Cole, M.B.; Davies, K.W. An Example of the Stages in the Development of a Predictive Mathematical Model for Microbial Growth: The Effects of NaCl, PH and Temperature on the Growth of Aeromonas Hydrophila. Int. J. Food Microbiol. 1994, 23, 359–375. [Google Scholar] [CrossRef]
- Oscar, T.E. Validation of Lag Time and Growth Rate Models for Salmonella Typhimurium: Acceptable Prediction Zone Method. J. Food Sci. 2005, 70, M129–M137. [Google Scholar] [CrossRef]
- Fakruddin, M.; Mazumdar, R.M.; Mannan, K.S. Bin Predictive Microbiology: Modeling Microbial Responses in Food. Ceylon J. Sci. Biol. Sci. 2011, 40, 121–131. [Google Scholar] [CrossRef]
- Koutsoumanis, K.P.; Kendall, P.A.; Sofos, J.N. A Comparative Study on Growth Limits of Listeria Monocytogenes as Affected by Temperature, PH and Aw When Grown in Suspension or on a Solid Surface. Food Microbiol. 2004, 21, 415–422. [Google Scholar] [CrossRef]
- Pérez-Rodríguez, F.; Valero, A. Predictive Microbiology in Foods; Springer: New York, NY, USA, 2013. [Google Scholar] [CrossRef]
- Skandamis, P.N.; Jeanson, S. Colonial vs. Planktonic Type of Growth: Mathematical Modeling of Microbial Dynamics on Surfaces and in Liquid, Semi-Liquid and Solid Foods. Front. Microbiol. 2015, 6, 1178. [Google Scholar] [CrossRef]
- McMeekin, T.A.; Baranyi, J.; Bowman, J.; Dalgaard, P.; Kirk, M.; Ross, T.; Schmid, S.; Zwietering, M.H. Information Systems in Food Safety Management. Int. J. Food Microbiol. 2006, 112, 181–194. [Google Scholar] [CrossRef]
- Gill, C.O.; Greer, G.G.; Dilts, B.D. The Aerobic Growth of Aeromonas Hydrophila and Listeria Monocytogenes in Broths and on Pork. Int. J. Food Microbiol. 1997, 35, 67–74. [Google Scholar] [CrossRef]
- Lobete, M.M.; Fernandez, E.N.; Impe, J.F.M. Van Recent Trends in Non-Invasive in Situ Techniques to Monitor Bacterial Colonies in Solid (Model) Food. Front. Microbiol. 2015, 6, 148. [Google Scholar] [CrossRef]
- Coroller, L.; Guerrot, V.; Huchet, V.; LeMarc, Y.; Mafart, P.; Sohier, D.; Thuault, D. Modelling the Influence of Single Acid and Mixture on Bacterial Growth. Int. J. Food Microbiol. 2005, 100, 167–178. [Google Scholar] [CrossRef]
- Nyhan, L.; Begley, M.; Mutel, A.; Qu, Y.; Johnson, N.; Callanan, M. Predicting the Combinatorial Effects of Water Activity, PH and Organic Acids on Listeria Growth in Media and Complex Food Matrices. Food Microbiol. 2018, 74, 75–85. [Google Scholar] [CrossRef]
- Martinez-Rios, V.; Gkogka, E.; Dalgaard, P. Predicting Growth of Listeria Monocytogenes at Dynamic Conditions during Manufacturing, Ripening and Storage of Cheeses—Evaluation and Application of Models. Food Microbiol. 2020, 92, 103578. [Google Scholar] [CrossRef]
- Rosso, L.; Bajard, S.; Flandrois, J.P.; Lahellec, C.; Fournaud, J.; Veit, P. Differential Growth of Listeria Monocytogenes at 4 and 8°C: Consequences for the Shelf Life of Chilled Products. J. Food Prot. 1996, 59, 944–949. [Google Scholar] [CrossRef]
- Augustin, J.-C.; Zuliani, V.; Cornu, M.; Guillier, L. Growth Rate and Growth Probability of Listeria Monocytogenes in Dairy, Meat and Seafood Products in Suboptimal Conditions. J. Appl. Microbiol. 2005, 99, 1019–1042. [Google Scholar] [CrossRef]
- Le Marc, Y.; Huchet, V.; Bourgeois, C.M.; Guyonnet, J.P.; Mafart, P.; Thuault, D. Modelling the Growth Kinetics of Listeria as a Function of Temperature, PH and Organic Acid Concentration. Int. J. Food Microbiol. 2002, 73, 219–237. [Google Scholar] [CrossRef]
- Wemmenhove, E.; van Valenberg, H.J.F.; Zwietering, M.H.; van Hooijdonk, T.C.M.; Wells-Bennik, M.H.J. Minimal Inhibitory Concentrations of Undissociated Lactic, Acetic, Citric and Propionic Acid for Listeria Monocytogenes under Conditions Relevant to Cheese. Food Microbiol. 2016, 58, 63–67. [Google Scholar] [CrossRef]
- Mejlholm, O.; Gunvig, A.; Borggaard, C.; Blom-Hanssen, J.; Mellefont, L.; Ross, T.; Leroi, F.; Else, T.; Visser, D.; Dalgaard, P. Predicting Growth Rates and Growth Boundary of Listeria Monocytogenes—An International Validation Study with Focus on Processed and Ready-to-Eat Meat and Seafood. Int. J. Food Microbiol. 2010, 141, 137–150. [Google Scholar] [CrossRef]
- Chirife, J.; Resnik, S.L. Unsaturated Solutions of Sodium Chloride as Reference Sources of Water Activity at Various Temperatures. J. Food Sci. 1984, 49, 1486–1488. [Google Scholar] [CrossRef]
- Frida.fooddata.dk Food Data. Available online: https://frida.fooddata.dk (accessed on 10 November 2022).
- USDA-ARS. FoodData Central. Available online: https://fdc.nal.usda.gov/ (accessed on 25 November 2022).
- Ross, T.; Dalgaard, P. Secondary Models. In Modeling Microbial Responses in Food; McKellar, R.C., Lu, X., Eds.; CRC Press: Mississauga, ON, Canada, 2004; p. 360. [Google Scholar]
- Lambert, R.J.; Stratford, M. Weak-Acid Preservatives: Modelling Microbial Inhibition and Response. J. Appl. Microbiol. 1999, 86, 157–164. [Google Scholar] [CrossRef]
- Garcia-Gutierrez, E.; Monteoliva García, G.; Bodea, I.; Cotter, P.D.; Iguaz, A.; Garre, A. A Secondary Model for the Effect of PH on the Variability in Growth Fitness of Listeria Innocua Strains. Food Res. Int. 2024, 186, 114314. [Google Scholar] [CrossRef]
- Cornu, M.; Beaufort, A.; Rudelle, S.; Laloux, L.; Bergis, H.; Miconnet, N.; Serot, T.; Delignette-Muller, M.L. Effect of Temperature, Water-Phase Salt and Phenolic Contents on Listeria Monocytogenes Growth Rates on Cold-Smoked Salmon and Evaluation of Secondary Models. Int. J. Food Microbiol. 2006, 106, 159–168. [Google Scholar] [CrossRef]
- Moller, C.O.A.O.A.; Ilg, Y.; Aabo, S.; Christensen, B.B.B.; Dalgaard, P.; Hansen, T.B.B. Effect of Natural Microbiota on Growth of Salmonella Spp. in Fresh Pork—A Predictive Microbiology Approach. Food Microbiol. 2013, 34, 284–295. [Google Scholar] [CrossRef]
- Ross, T.; Dalgaard, P.; Tienungoon, S. Predictive Modelling of the Growth and Survival of Listeria in Fishery Products. Int. J. Food Microbiol. 2000, 62, 231–245. [Google Scholar] [CrossRef]
- ICMSF. Microorganisms in Foods: Microbiological Specifications of Food Pathogens; Blackie Academic and Professional: London, UK, 1996. [Google Scholar]
- Anyasi, T.; Jideani, A.I.O.; Edokpayi, J.N.; Anokwuru, C.P. Application of Organic Acids in Food Preservation. In Organic Acids, Characteristics, Properties and Synthesis; Nova Science Publishers Inc.: Hauppauge, NY, USA, 2017; pp. 1–47. [Google Scholar]
- Hills, B.P.; Manning, C.E.; Ridge, Y.; Brocklehurst, T. Water Availability and the Survival of Salmonella Typhimurium in Porous Systems. Int. J. Food Microbiol. 1997, 36, 187–198. [Google Scholar] [CrossRef]
- Mejlholm, O.; Dalgaard, P. Development and Validation of an Extensive Growth and Growth Boundary Model for Listeria Monocytogenes in Lightly Preserved and Ready-to-Eat Shrimp. J. Food Prot. 2009, 72, 2132–2143. [Google Scholar] [CrossRef]
- Mbandi, E.; Shelef, L.A. Enhanced Inhibition of Listeria Monocytogenes and Salmonella Enteritidis in Meat by Combinations of Sodium Lactate and Diacetate. J. Food Prot. 2001, 64, 640–644. [Google Scholar] [CrossRef]
- Mbandi, E.; Shelef, L.A.A. Enhanced Antimicrobial Effects of Combination of Lactate and Diacetate on Listeria Monocytogenes and Salmonella Spp. in Beef Bologna. Int. J. Food Microbiol. 2002, 76, 191–198. [Google Scholar] [CrossRef] [PubMed]
- Zhang, L.E.I.; Moosekian, S.R.; Todd, E.C.D.; Ryser, E.T. Growth of Listeria Monocytogenes in Different Retail Delicatessen Meats during Simulated Home Storage. J. Food Prot. 2012, 75, 896–905. [Google Scholar] [CrossRef]
- Shelef, L.A.; Yang, Q. Growth Suppression of Listeria Monocytogenes by Lactates in Broth, Chicken, and Beef. J. Food Prot. 1991, 54, 283–287. [Google Scholar] [CrossRef]
- Stekelenburg, F.K. Enhanced Inhibition of Listeria Monocytogenes in Frankfurter Sausage by the Addition of Potassium Lactate and Sodium Diacetate Mixtures. Food Microbiol. 2003, 20, 133–137. [Google Scholar] [CrossRef]
- Porto, A.C.S.; Franco, B.D.G.M.; Sant’anna, E.S.; Call, J.E.; Piva, A.; Luchansky, J.B. Viability of a Five-Strain Mixture of Listeria Monocytogenes in Vacuum-Sealed Packages of Frankfurters, Commercially Prepared with and without 2.0 or 3.0% Added Potassium Lactate, during Extended Storage at 4 and 10 °C. J. Food Prot. 2002, 65, 308–316. [Google Scholar] [CrossRef]
- Morey, A.; Bowers, J.W.J.; Bauermeister, L.J.; Singh, M.; Huang, T.; McKee, S.R. Effect of Salts of Organic Acids on Listeria Monocytogene, Shelf Life, Meat Quality, and Consumer Acceptability of Beef Frankfurters. J. Food Sci. 2014, 79, M54–M60. [Google Scholar] [CrossRef] [PubMed]
- Grant, I.R.; Nixon, C.R.; Patterson, M.F. Comparison of the Growth of Listeria Monocytogenes in Unirradiated and Irradiated Cook-Chill Roast Beef and Gravy at Refrigeration Temperatures. Lett. Appl. Microbiol. 1993, 17, 55–57. [Google Scholar] [CrossRef]
- Beumer, R. Growth of Listeria Monocytogenes on Sliced Cooked Meat Products. Food Microbiol. 1996, 13, 333–340. [Google Scholar] [CrossRef]
- Huang, L. Growth Kinetics of Listeria Monocytogenes in Broth and Beef Frankfurters- Determination of Lag Phase Duration and Exponential Growth Rate under Isothermal Conditions. J. Food Sci. 2008, 73, E235–E242. [Google Scholar] [CrossRef]
- Grau, F.H.; Vanderlinde, P.B. Occurrence, Numbers, and Growth of Listeria Monocytogenes on Some Vacuum-Packaged Processed Meats. J. Food Prot. 1992, 55, 4–7. [Google Scholar] [CrossRef] [PubMed]
- Hudson, J.A.; Mott, S.J. Growth of Listeria Monocytogenes, Aeromonas Hydrophila and Yersinia Enterocolitica on Cooked Beef under Refrigeration and Mild Temperature Abuse. Food Microbiol. 1993, 10, 429–437. [Google Scholar] [CrossRef]
- Hudson, J.A.; Mott, S.J.; Penney, N. Growth of Listeria Monocytogenes, Aeromonas Hydrophila, and Yersinia Enterocolitica on Vacuum and Saturated Carbon Dioxide Controlled Atmosphere-Packaged Sliced Roast Beef. J. Food Prot. 1994, 57, 204–208. [Google Scholar] [CrossRef]
- Nyati, H. Survival Characteristics and the Applicability of Predictive Mathematical Modelling to Listeria Monocytogenes Growth in Sous Vide Products. Int. J. Food Microbiol. 2000, 56, 123–132. [Google Scholar] [CrossRef]
- Diez-Gonzalez, F.; Belina, D.; Labuza, T.P.; Pal, A. Modeling the Growth of Listeria Monocytogenes Based on a Time to Detect Model in Culture Media and Frankfurters. Int. J. Food Microbiol. 2007, 113, 277–283. [Google Scholar] [CrossRef]
- Liu, Y.; Wang, X.; Liu, B.; Dong, Q. One-Step Analysis for Listeria Monocytogenes Growth in Ready-to-Eat Braised Beef at Dynamic and Static Conditions. J. Food Prot. 2019, 82, 1820–1827. [Google Scholar] [CrossRef]
- Glass, K.A.; Doyle, M.P. Fate of Listeria Monocytogenes in Processed Meat Products during Refrigerated Storage. Appl. Environ. Microbiol. 1989, 55, 1565–1569. [Google Scholar] [CrossRef]
- Bucur, F.I.; Borda, D.; Neagu, C.; Grigore-Gurgu, L.; Nicolau, A.I. Deterministic Approach and Monte Carlo Simulation to Predict Listeria Monocytogenes Time to Grow on Refrigerated Ham: A Study Supporting Risk-Based Decisions for Consumers’ Health. J. Food Prot. 2023, 86, 100026. [Google Scholar] [CrossRef]
- Dussault, D.; Vu, K.D.; Lacroix, M. Development of a Model Describing the Inhibitory Effect of Selected Preservatives on the Growth of Listeria Monocytogenes in a Meat Model System. Food Microbiol. 2016, 53, 115–121. [Google Scholar] [CrossRef]
- Augustin, J.-C.; Bergis, H.; Midelet-Bourdin, G.; Cornu, M.; Couvert, O.; Denis, C.; Huchet, V.; Lemonnier, S.; Pinon, A.; Vialette, M.; et al. Design of Challenge Testing Experiments to Assess the Variability of Listeria Monocytogenes Growth in Foods. Food Microbiol. 2011, 28, 746–754. [Google Scholar] [CrossRef]
- Aryani, D.C.; den Besten, H.M.W.; Hazeleger, W.C.; Zwietering, M.H. Quantifying Strain Variability in Modeling Growth of Listeria Monocytogenes. Int. J. Food Microbiol. 2015, 208, 19–29. [Google Scholar] [CrossRef]
- van der Veen, S.; Moezelaar, R.; Abee, T.; Wells-Bennik, M.H.J. The Growth Limits of a Large Number of Listeria Monocytogenes Strains at Combinations of Stresses Show Serotype- and Niche-Specific Traits. J. Appl. Microbiol. 2008, 105, 1246–1258. [Google Scholar] [CrossRef]
- Serra-Castelló, C.; Costa, J.C.C.P.; Jofré, A.; Bolívar, A.; Pérez-Rodríguez, F.; Bover-Cid, S. A Mathematical Model to Predict the Antilisteria Bioprotective Effect of Latilactobacillus Sakei CTC494 in Vacuum Packaged Cooked Ham. Int. J. Food Microbiol. 2022, 363, 109491. [Google Scholar] [CrossRef]
- Pal, A.; Labuza, T.; Diezgonzalez, F. Shelf Life Evaluation for Ready-to-Eat Sliced Uncured Turkey Breast and Cured Ham under Probable Storage Conditions Based on Listeria Monocytogenes and Psychrotroph Growth. Int. J. Food Microbiol. 2008, 126, 49–56. [Google Scholar] [CrossRef]
- Seman, D.L.; Borger, A.C.; Meyer, J.D.; Hall, P.A.; Milkowski, A.L. Modeling the Growth of Listeria Monocytogenes in Cured Ready-to-Eat Processed Meat Products by Manipulation of Sodium Chloride, Sodium Diacetate, Potassium Lactate, and Product Moisture Content. J. Food Prot. 2002, 65, 651–658. [Google Scholar] [CrossRef]
- Glass, K.; Preston, D.; Veesenmeyer, J. Inhibition of Listeria Monocytogenes in Turkey and Pork-Beef Bologna by Combinations of Sorbate, Benzoate, and Propionate. J. Food Prot. 2007, 70, 214–217. [Google Scholar] [CrossRef]
- Glass, K.A.; Mcdonnell, L.M.; Vontayson, R.; Wanless, B.; Badvela, M. Inhibition of Listeria Monocytogenes by Propionic Acid–Based Ingredients in Cured Deli-Style Turkey. J. Food Prot. 2013, 76, 2074–2078. [Google Scholar] [CrossRef]
- Hwang, C.-A.; Sheen, S.; Juneja, V. Effects of Sodium Lactate on the Survival of Listeria Monocytogenes, Escherichia Coli O157:H7, and Salmonella Spp. in Cooked Ham at Refrigerated and Abuse Temperature. Food Nutr. Sci. 2011, 2, 464–470. [Google Scholar] [CrossRef][Green Version]
- Delignette-Muller, M.L. Relation between the Generation Time and the Lag Time of Bacterial Growth Kinetics. Int. J. Food Microbiol. 1998, 43, 97–104. [Google Scholar] [CrossRef]
- Buchanan, R.L.; Klawitter, L.A. Effect of Temperature History on the Growth of Listeria Monocytogenes Scott A at Refrigeration Temperatures. Int. J. Food Microbiol. 1991, 12, 235–245. [Google Scholar] [CrossRef]
- Pla, M.-L.; Oltra, S.; Esteban, M.-D.; Andreu, S.; Palop, A. Comparison of Primary Models to Predict Microbial Growth by the Plate Count and Absorbance Methods. BioMed Res. Int. 2015, 2015, 1–14. [Google Scholar] [CrossRef] [PubMed]
- Baka, M.; Noriega, E.; Stamati, I.; Logist, F.; Van Impe, J.F.M. Critical Assessment of the Time-to-Detection Method for Accurate Estimation of Microbial Growth Parameters. J. Food Saf. 2015, 35, 179–192. [Google Scholar] [CrossRef]
- Begot, C.; Lebert, I.; Lebert, A. Variability of the Response of 66Listeria MonocytogenesandListeria Innocuastrains to Different Growth Conditions. Food Microbiol. 1997, 14, 403–412. [Google Scholar] [CrossRef]
- Weaver, R.A.; Shelef, L.A.; Seman, D.L.; Borger, A.C.; Meyer, J.D.; Hall, P.A.; Milkowski, A.L.; Serra-Castelló, C.; Costa, J.C.C.P.; Jofré, A.; et al. Antilisterial Activity of Sodium, Potassium or Calcium Lactate in Pork Liver Sausage. J. Food Saf. 1993, 13, 133–146. [Google Scholar] [CrossRef]
- Uyttendaele, M.; Rajkovic, A.; Benos, G.; Franc ois, K.; Devlieghere, K.; Debevere, J. Evaluation of a Challenge Testing Protocol to Assess the Stability of Ready-to-Eat Cooked Meat Products against Growth of Listeria Monocytogenes. Int. J. Food Microbiol. 2004, 90, 219–236. [Google Scholar] [CrossRef]
- Pal, A.; Labuza, T.P.; Diez-Gonzalez, F. Evaluating the Growth of Listeria Monocytogenes in Refrigerated Ready-to-Eat Frankfurters: Influence of Strain, Temperature, Packaging, Lactate and Diacetate, and Background Microflora. J. Food Prot. 2008, 71, 1806–1816. [Google Scholar] [CrossRef]
- Barmpalia, I.M.; Koutsoumanis, K.P.; Geornaras, I.; Belk, K.E.; Scanga, J.A.; Kendall, P.A.; Smith, G.C.; Sofos, J.N. Effect of Antimicrobials as Ingredients of Pork Bologna for Listeria Monocytogenes Control during Storage at 4 or 10 °C. Food Microbiol. 2005, 22, 205–211. [Google Scholar] [CrossRef]
- Blom, H.; Nerbrink, E.; Dainty, R.; Hagtvedt, T.; Borch, E.; Nissen, H.; Nesbakken, T. Addition of 2.5% Lactate and 0.25% Acetate Controls Growth of Listeria Monocytogenes in Vacuum-Packed, Sensory-Acceptable Servelat Sausage and Cooked Ham Stored at 4 °C. Int. J. Food Microbiol. 1997, 38, 71–76. [Google Scholar] [CrossRef]
- Glass, K.A.; Mcdonnell, L.M.; Rassel, R.C.; Zierke, K.L. Controlling Listeria Monocytogenes on Sliced Ham and Turkey Products Using Benzoate, Propionate, and Sorbate. J. Food Prot. 2007, 70, 2306–2312. [Google Scholar] [CrossRef]
- Burnett, S.L.; Mertz, E.L.; Bennie, B.; Ford, T.; Starobin, A. Growth or Survival of Listeria Monocytogenes in Ready-to-Eat Meat Products and Combination Deli Salads During Refrigerated Storage. J. Food Sci. 2005, 70, m301–m304. [Google Scholar] [CrossRef]
- Bredholt, S.; Nesbakken, T.; Holck, A. Protective Cultures Inhibit Growth of Listeria Monocytogenes and Escherichia Coli O157:H7 in Cooked, Sliced, Vacuum- and Gas-Packaged Meat. Int. J. Food Microbiol. 1999, 53, 43–52. [Google Scholar] [CrossRef]
- Sym’Previus Ecole Nationale Vétérinaire d’Alfort, Maisons Alfort, France. Sym’Previus Partner. Available online: https://combase.errc.ars.usda.gov/ (accessed on 25 November 2022).
- Food Research Association (FRA), UK. FRA Food Standards Agency Funded Data Generated at Leatherhead. Available online: https://frida.fooddata.dk/food/lists/grouped/56/65?lang=en&#group65 (accessed on 25 November 2022).
- TIA Tasmanian Institute of Agriculture (TIA), University of Tasmania, Australia. Available online: https://combase.errc.ars.usda.gov/ (accessed on 25 November 2022).
- Daminelli, P.; Dalzini, E.; Cosciani-Cunico, E.; Finazzi, G.; D’Amico, S.; Losio, M.N. Prediction of the Maximal Growth Rate of Listeria Monocytogenes in Sliced Mortadella by the Square Root Type Model. Ital. J. Food Sci. 2014, 26, 261–267. [Google Scholar]
- Mataragas, M.; Drosinos, E.H.; Siana, P.; Skandamis, P.; Metaxopoulos, I. Determination of the Growth Limits and Kinetic Behavior of Listeria Monocytogenes in a Sliced Cooked Cured Meat Product: Validation of the Predictive Growth Model under Constant and Dynamic Temperature Storage Conditions. J. Food Prot. 2006, 69, 1312–1321. [Google Scholar] [CrossRef]
- Luo, K.; Hong, S.-S.; Oh, D.-H. Modeling the Effect of Storage Temperatures on the Growth of Listeria Monocytogenes on Ready-to-Eat Ham and Sausage. J. Food Prot. 2015, 78, 1675–1681. [Google Scholar] [CrossRef]
- King, A.M.; Glass, K.A.; Milkowski, A.L.; Seman, D.L.; Sindelar, J.J. Modeling the Impact of Ingoing Sodium Nitrite, Sodium Ascorbate, and Residual Nitrite Concentrations on Growth Parameters of Listeria Monocytogenes in Cooked, Cured Pork Sausage. J. Food Prot. 2016, 79, 184–193. [Google Scholar] [CrossRef]
- Farber, J.M.; McKellar, R.C.; Ross, W.H. Modelling the Effects of Various Parameters on the Growth of Listeria Monocytogenes on Liver Pâté. Food Microbiol. 1995, 12, 447–453. [Google Scholar] [CrossRef]
- Gutiérrez-Chocoza, M.A.; López-Romero, J.C.; García-Galaz, A.; González-Ríos, H.; Peña-Ramos, A.; Juneja, V.K.; Pérez-Báez, A.J.; Valenzuela-Melendres, M. Modeling the Effects of Temperature and PH on Listeria Monocytogenes Growth in Mexican-Style Pork Chorizo. Appl. Food Res. 2023, 3, 100336. [Google Scholar] [CrossRef]
- Park, J.H.; Kim, H.J. Modeling and Scenario-Based Risk Estimation of Listeria Monocytogenes in Meatballs and Sundae, a Korean Black Pudding, under Different Packaging Conditions. Food Control 2023, 152, 109886. [Google Scholar] [CrossRef]
- Schlyter, J.H.; Glass, K.A.; Loeffelholz, J.; Degnan, A.J.; Luchansky, J.B. The Effects of Diacetate with Nitrite, Lactate, or Pediocin on the Viability of Listeria Monocytegenes in Turkey Slurries. Int. J. Food Microbiol. 1993, 19, 271–281. [Google Scholar] [CrossRef]
- Erickson, J.P.; Mckenna, D.N.; Woodruff, M.A.; Bloom, J.S. Fate of Salmonella Spp., Listeria Monocytogenes, and Indigenous Spoilage Microorganisms in Home-Style Salads Prepared with Commercial Real Mayonnaise or Reduced Calorie Mayonnaise Dressings. J. Food Prot. 1993, 56, 1015–1021. [Google Scholar] [CrossRef]
- Wederquist, H.J.; Sofos, J.N.; Schmidt, G.R. Listeria Monocytogenes Inhibition in Refrigerated Vacuum Packaged Turkey Bologna by Chemical Additives. J. Food Sci. 1994, 59, 498–500. [Google Scholar] [CrossRef]
- Glass, K.; Lindsey, M.; Sawyer, C.; Claus, J. Minimum Nitrite Levels Required to Control Listeria Monocytogenes on Ready-to-Eat Poultry Products Manufactured with Lactate and Diacetate; University of Wisconsin-Madison: Madison, WI, USA, 2008. [Google Scholar]
- Peterson, L.; Faith, N.; Czuprynski, C. Growth of L. Monocytogenes Strain F2365 on Ready-to-Eat Turkey Meat Does Not Enhance Gastrointestinal Listeriosis in Intragastrically Inoculated A/J Mice. Int. J. Food Microbiol. 2008, 126, 112–115. [Google Scholar] [CrossRef]
- Bovill, R.; Bew, J.; Cook, N.; D’Agostino, M.; Wilkinson, N.; Baranyi, J. Predictions of Growth for Listeria Monocytogenes and Salmonella during Fluctuating Temperature. Int. J. Food Microbiol. 2000, 59, 157–165. [Google Scholar] [CrossRef]
- Marshall, D.L.; Wiese-Lehigh, P.L.; Wells, J.H.; Farr, A.J. Comparative Growth of Listeria Monocytogenes and Pseudomonas Fluorescens on Precooked Chicken Nuggets Stored under Modified Atmospheres. Food Prot. 1991, 54, 841–844. [Google Scholar] [CrossRef]
- Zhao, Y.; Wells, J.; Marshall, D.L. Description of Log Phase Growth for Selected Microorganisms during Modified Atmosphere Storage. J. Food Process Eng. 1992, 15, 299–317. [Google Scholar] [CrossRef]
- Bernardo, R.; Barreto, A.S.; Nunes, T.; Henriques, A.R. Estimating Listeria Monocytogenes Growth in Ready-to-Eat Chicken Salad Using a Challenge Test for Quantitative Microbial Risk Assessment. Risk Anal. 2020, 40, 2427–2441. [Google Scholar] [CrossRef]
- Lianou, A.; Raftopoulou, O.; Spyrelli, E.; Nychas, G.-J.E. Growth of Listeria Monocytogenes in Partially Cooked Battered Chicken Nuggets as a Function of Storage Temperature. Foods 2021, 10, 533. [Google Scholar] [CrossRef]
- Sahu, S.N.; Kim, B.; Ferguson, M.S.; Zink, D.L.; Datta, A.R. Growth Potential of Listeria Monocytogenes in Artificially Contaminated Celery and Chicken Salad. Food Control 2017, 73, 1229–1236. [Google Scholar] [CrossRef]
- Shrestha, S.; Erdmann, J.J.; Smith, S.A. Predicting the Growth of Listeria Monocytogenes in Cooked, Sliced Deli Turkey Breast as a Function of Clean-Label Antimicrobials, PH, Moisture, and Salt. J. Food Prot. 2022, 85, 945–955. [Google Scholar] [CrossRef]


Disclaimer/Publisher’s Note: The statements, opinions and data contained in all publications are solely those of the individual author(s) and contributor(s) and not of MDPI and/or the editor(s). MDPI and/or the editor(s) disclaim responsibility for any injury to people or property resulting from any ideas, methods, instructions or products referred to in the content. |
© 2024 by the authors. Licensee MDPI, Basel, Switzerland. This article is an open access article distributed under the terms and conditions of the Creative Commons Attribution (CC BY) license (https://creativecommons.org/licenses/by/4.0/).