Article

A Two-Stage Model for Factors Influencing Citation Counts

by
Pablo Dorta-González
* and
Emilio Gómez-Déniz
Department of Quantitative Methods in Economics and TIDES Institute, University of Las Palmas de Gran Canaria, 35017 Las Palmas de Gran Canaria, Spain
*
Author to whom correspondence should be addressed.
Publications 2025, 13(2), 29; https://doi.org/10.3390/publications13020029
Submission received: 19 April 2025 / Revised: 10 June 2025 / Accepted: 16 June 2025 / Published: 19 June 2025

Abstract

:
This work aims to use a suitable regression model to study a count response random variable, namely, the number of citations of a research paper, that is affected by some explanatory variables. The count variable exhibits substantial variation, as the sample variance is larger than the sample mean; thus, the classical Poisson regression model seems not to be appropriate. We concentrate our attention on the negative binomial regression model, which allows the variance of each measurement to be a function of its predicted value. Nevertheless, the process of citations of papers may be divided into two parts. In the first stage, the paper has no citations, while the second part provides the intensity of the citations. A hurdle model for separating documents with citations and those without citations is considered. The dataset for empirical application consisted of 43,190 research papers in the Economics and Business field from 2014–2021, which were obtained from The Lens database. Citation counts and social attention scores for each article were gathered from the Altmetric database. The main findings indicate that both collaboration and funding have positive impacts on citation counts and reduce the likelihood of receiving zero citations. Open access (OA) via repositories (green OA) correlates with higher citation counts and a lower probability of zero citations. In contrast, OA via the publisher’s website without an explicit open license (bronze OA) is associated with higher citation counts but also with a higher probability of zero citations. In addition, open access in subscription-based journals (hybrid OA) increases citation counts, although the effect is modest. There are clear disciplinary differences, with the prestige of the journal playing a significant role in citation counts. Articles with lower expert ratings tend to be cited less frequently and are more likely to be cited zero times. Meanwhile, news and blog mentions boost citations and reduce the likelihood of receiving no citations, while policy mentions also enhance citation counts and significantly lower the risk of being cited zero times. In contrast, patent mentions have a negative impact on citations. The influence of social media varies: X/Twitter and Wikipedia mentions increase citations and reduce the likelihood of being uncited, whereas Facebook and video mentions negatively impact citation counts.
MSC:
62J12; 62P25
JEL Classification:
C13

1. Introduction

Count data regression models arise in situations in which the variable of interest takes only non-negative integer values for each of the available observations. These values usually represent the number of times an event occurs in a fixed domain. Cameron and Trivedi (1998) and Winkelmann (2008) provide good overviews of standard count regression models. Typically, a Poisson distribution can be assumed when modeling the distribution of count citations. However, the Poisson model often underestimates the observed overdispersion (variance larger than the mean). This is because a single parameter is likely to be insufficient to describe the population under study, and because the population is usually heterogeneous. This population heterogeneity is unobserved, i.e., the population consists of several subpopulations; the general method to deal with this is to assume that the heterogeneity can be adequately described by some probability density function, say π , defined on the population of possible Poisson parameters λ > 0 , and to consider the marginal distribution of the number of citations provided by
f ( y ) = 0 exp ( λ ) λ y y ! π ( λ ) d λ , y = 0 , 1 , .
Mixed Poisson distributions are helpful in situations where count displays extra-Poisson variation. Applications of univariate models abound in areas such as insurance (Willmot, 1987; Gómez-Déniz & Calderín-Ojeda, 2018) and accident analysis (Arbous & Kerrich, 1951), where specific models such as the negative-binomial (mixed Poisson-gamma), Poisson-inverse-Gaussian, Poisson-reciprocal inverse-Gaussian, and Poisson-lognormal distributions have been used. On the other hand, mixed Poisson regression models have been employed in areas such as insurance (Dean et al., 1989), demography (Brillinger, 1986), medicine (Breslow, 1984; Campbell et al., 1991), and engineering (Engel, 1984). For a complete review of mixed Poisson distributions, see Karlis and Xekalaki (2005); for the Poisson and negative binomial regression models, see Cameron and Trivedi (1998), Winkelmann (2008) and Hilbe (2011), among others.
Nevertheless, the process be which papers accumulate citations may be divided into two parts: in the first stage, the paper has no citations, while the second part provides the intensity of the citations. After a paper has been cited for the first time, the contagious process of obtaining new citations is carried out, at most for the time following this first citation. Thus, a hurdle model for dealing separately with papers with citations and those with no citations is considered.
The hurdle model in bibliometrics and altmetrics represents a significant advance in understanding the citation process. Several studies and experts support this idea. For example, studies in biology, biochemistry, chemistry, and social sciences (Didegah & Thelwall, 2013) as well as a study of permanent Italian researchers from different scientific fields (Baccini et al., 2014) have found that the citation process can be modeled using a hurdle approach. In this model, the initial publication phase is characterized by low probability of citation, while the subsequent phase has higher probability.
The hurdle model has important implications for assessing research impact. It suggests that the initial publication phase is not necessarily indicative of the overall impact of a research paper; instead, the critical point at which citations begin can strongly influence the total number of citations. This is particularly relevant in the context of altmetrics, where initial engagement with a research paper can trigger subsequent mentions and other forms of online engagement (Hodas & Lerman, 2014).
It is important to note that human behavior when deciding which works to cite is complex. The aim of this study is not to predict such behavior or to estimate citation counts, but rather to contribute knowledge regarding some of the variables involved. Over the past two decades, there has been a paradigm shift in how scientists disseminate their research findings. On one hand, they tend to publish in journals with high impact factor rankings; on the other, they increasingly favor open access and dissemination through channels that are closer to society, in addition to traditional academic outlets. The goal of this study is to provide insights into the effects of these new forms of scientific communication on research impact.
The remainder of this paper is organized as follows: Section 2 focuses on reviewing the literature; Section 3 describes the dataset and variables used in this work; Section 4 is devoted to the specific distributional models employed to reach this work’s target; numerical results are provided in Section 5; and conclusions are presented in the last Section 6.

2. Literature Review: Factors Linked to More Citations or Better Quality

Evaluation of research is commonly based on citation metrics and expert evaluations. However, new research indicates that incorporating additional variables can enhance prediction accuracy. While previous research emphasizes citations as a measure of quality, not many studies have examined expert reviews, especially in areas such as humanities and certain of the social sciences, where quality may not be accurately represented by citations. This literature review aims to examine the consistency of factors influencing document impact across various contexts and to determine when these factors are dependent on the context.

2.1. Internal Factors Influencing Citation Counts and Quality

Scientists have thoroughly studied factors associated with increased citation numbers or projected citation counts over time using journal or article metadata. For example, research has indicated that papers with higher peer review ratings are more likely to be cited (Bornmann et al., 2012). Furthermore, Kousha and Thelwall (2024) conducted an extensive examination of different document-level characteristics and approaches employed in forecasting citation counts and quality assessments of scholarly articles.
The majority of research has studied document characteristics by evaluating how they are linked to the number of citations received. For example, one research study looked at various aspects of article texts (such as length of title and text in characters, and number of figures, tables, and equations), metadata (such as the number of authors and views), and citation numbers from two hundred papers published by MDPI in 2017 which were either highly cited or lowly cited. Elgendi (2019) discovered strong connections between citation counts and the number of views, tables, and authors, as well as a noticeable inverse relationship with title length. A study of 262 papers found weak correlation between “non-scientific features” and citation counts (Pearson’s |r| < 0.2), while the relationship between journal impact factor, number of authors, and citation counts grew stronger over time (Mammola et al., 2022). Furthermore, certain research studies have utilized regression models to examine numerous characteristics at the same time, enabling evaluation of their respective impacts (Alpay et al., 2022).
Articles with more authors could have better quality because they involve a wider range of expertise or deal with complex research that requires multiple contributors; on the other hand, a larger number of writers may also spark additional attention via wider social connections, leading to an audience impact. This makes it challenging to distinguish between cause and effect (Rousseau, 1992; Wagner et al., 2019). Although previous studies have found a connection between the number of citations and number of authors, there is no agreement on the specific type of relationship, such as linear or logarithmic. Larger groups of authors frequently involve a greater number of organizations and nations, which can impact the connection between the number of citations and team size. However, research that has taken these factors into consideration still shows that bigger teams have a citation advantage.
Many research studies in different disciplines have consistently shown that articles with a greater number of authors generally receive more citations. This pattern is commonly seen and is a strong one. Studies in prestigious interdisciplinary journals such as Nature, Science, and PNAS have brought attention to this trend, along with various biomedical and scientific journals (Hsu & Huang, 2011). Likewise, research in respected publications like Cell, Science, Nature, New England Journal of Medicine, The Lancet, and JAMA have verified this connection (Figg et al., 2006). Similar results have been observed in fields such as biology, biochemistry, chemistry, mathematics, physics (Vieira & Gomes, 2010), library and information science (Sin, 2011), computer science (Ibáñez et al., 2013), natural and medical sciences, social sciences, humanities (Larivière et al., 2015), management (Ronda-Pupo, 2017), and robotics and artificial intelligence (Kumari et al., 2020).
Valuable knowledge has been acquired from research that highlights specific countries or organizations, including Italy (Abramo & D’Angelo, 2015) as well as Belgium, Israel, and Iran (Chi & Glänzel, 2017). A thorough examination across ten countries focusing on 27 broad subjects and the highest volume of journal articles from 2008 to 2012 uncovered a strong connection between increased collaboration and higher citation rates in most subjects and countries. Nevertheless, China showed weaker correlations between the number of authors and citation counts in areas such as computer science, business, management, and accounting (Thelwall & Maflahi, 2020). Additionally, according to Shen et al. (2021), the connection between citations and collaboration in research could be stronger in developing countries than in developed ones.
Evidence from different areas broadly supports the contention that articles in journals with higher impact factors are cited more frequently. This pattern has been consistently noted in numerous studies, including research on biology, biochemistry, chemistry, mathematics, and physics articles (Vieira & Gomes, 2010), papers published in F1000 from 2000 to 2004 (Bornmann & Leydesdorff, 2015), and studies focusing on six different biomedical research topics from 1990 to 2018 (Urlings et al., 2021). These studies indicate that journal impact factor is frequently recognized as the most reliable bibliometric indicator of article citations.
Although many research studies have discovered a strong relationship between journal impact factor and the number of times articles are cited, there are cases where this is not the norm. Studies in ecology (Leimu & Koricheva, 2005) and gastroenterology and hepatology (Roldan-Valadez & Rios, 2015) failed to uncover enough statistical proof to back up the idea that papers in journals with high impact factors receive more citations. The absence of a connection in these instances could be due to limited sample sizes or to distortion of a journal’s overall impact factor caused by a few heavily referenced articles.
Experts are often considered the most appropriate evaluators of research quality, with citation counts being at most a potential indicator. According to Aksnes et al. (2019) and Langfeldt et al. (2020), the three main aspects of academic research are usually defined as rigor, originality, and importance to the scholarly and societal community. Importantly, each of these dimensions is subjective and shows substantial differences among various fields.
Different expert evaluations of the quality of academic research can occur because of the diverse viewpoints used to assess quality (Langfeldt et al., 2020). Additionally, high-quality research in a certain field that is in line with the field’s goals may not be recognized at the same level in national research assessments. This difference may arise when the objectives of the field are not clear or are ignored, especially if they are seen as too abstract or if they do not take into account societal viewpoints.

2.2. External Factors Influencing Citation Counts and Quality

Although various factors have been identified that can predict citation impact or quality scores, the connections between these factors and research quality are frequently dependent on the specific context. The extent to which these relationships are strong differs greatly among various academic disciplines. In the physical sciences, citation-related information is typically more predictive than in the humanities, as shown by Dorta-González and Gómez-Déniz (2022). Moreover, the way in which citations are used and the impact of specific factors may evolve with time, requiring regular adjustments to predictive models in order to account for these changes over time.
Open-access articles appear to receive more citations because they are more widely accessible; nevertheless, validating this benefit is made difficult by the diverse forms of open access and different journal characteristics, with both top-tier and lower-quality journals capable of being completely open-access or completely non-open access (Dorta-González et al., 2017; Dorta-González & Dorta-González, 2023a). Furthermore, it is difficult to consider author choices, for instance whether scholars tend to publish their top research in open-access journals. The intricate nature of these factors combined with possible variations across disciplines leads to the uncertainty surrounding the existence of a real advantage on the part of open-access journals (Langham-Putrow et al., 2021).
According to Thelwall et al. (2023), UK articles that disclose their funding source generally exhibit higher quality in all fields irrespective of research team size. This phenomenon is especially prominent in areas related to health. This study indicates that funding is important for quality research, as it typically involves scrutiny and validation which unfunded projects may lack.
Research articles in quickly growing research fields and around newly developing trends usually receive more citations than average for that field. The increase in citations in these fields is due to the rise in publications with limited existing literature to reference, resulting in a more concentrated number of citations (Sjögårde & Didegah, 2022).
Research has indicated that incorporating both early citation counts and internal/external factors can successfully forecast long-term citation counts. A neural network was used in a study to predict the five-year citation impact of articles in the library, information, and documentation field. This research included a variety of elements, such as metadata from article text, journals, authors, references, and citations. The characteristics included different factors leading to favorable outcomes, such as the type of document, length of the article, journal impact factor, number of authors, previous citations, and others (Ruan et al., 2020). Another study utilized both altmetric indicators and metadata to anticipate upcoming citations for a random selection of 12,000 articles released in 2015. Their study found that machine learning models that included variables such as Mendeley readership, highest number of Twitter followers, and academic standing were important indicators of citation impact in both the short and long term (Akella et al., 2021). This research emphasizes the significance of taking into account various factors when predicting long-term citation numbers.
Scientific research also has significance outside of academia, affecting society in fields such as education, culture, and the economy (Wilsdon et al., 2015). Altmetrics can quantitatively assess such broader societal impacts by using a complementary set of metrics known as altmetrics which differ from traditional citation analysis. The changing landscape of digital academic communication has changed the way in which we assess the societal influence of research, promoting a broader method that takes into account a variety of research outcomes and new communication methods (Bornmann, 2013; de Rijcke et al., 2016; Bornmann & Haunschild, 2019). An example is the UK’s Research Excellence Framework, which includes evaluations of research impact outside of academia, with 25% of the assessment focusing on areas such as impact on public policy, economic and social contributions, and advancements in health, environment, and overall wellbeing (Khazragui & Hudson, 2015).
Initial altmetrics studies concentrated on internet references and their connection to citations, suggesting uniform social influence for all references without a strong theoretical foundation (Ravenscroft et al., 2017). The academic evaluation literature differentiates between scientific impact in academia and wider societal impact (Spaapen & Van Drooge, 2011; Joly et al., 2015). While altmetrics initially gained traction as a measure of societal impact due to funding agencies’ interests, the field now stresses the importance of a more sophisticated approach. Recent research has suggested utilizing altmetrics instead of traditional impact metrics to assess science–society interactions and knowledge sharing (Haustein et al., 2016; Robinson-García et al., 2018; Wouters et al., 2019; Dorta-González & Dorta-González, 2023b; Alperin et al., 2024; Dorta-González et al., 2024).

3. Data

3.1. Data Sources and Sample Description

In our empirical application, we explore research trends in Economics and Business by examining scientific articles. This analysis focuses on the publication period 2014–2021 and citation period 2014–2023 using data from The Lens, Scimago Journal Rank (based on Scopus data), Altmetric, and the Australian Business Deans Council.
We used the Field of Research (FoR) classification provided by The Lens as a classification system for determining the discipline. This system is also used by other bibliographic databases and is generated automatically using artificial intelligence. It is important to note that this AI-based classification has not yet been thoroughly validated and that its accuracy and consistency across different fields of research are uncertain. Nevertheless, we consider it to be suitable for the purposes of this study.
The analysis focused on journal articles as the document type, and was limited to the years 2014 to 2021; however, citation data were collected up to 2023 in order to include the two years following publication, as this is typically the period when citation counts peak. We acknowledge that including publications from this period may introduce a citation lag, particularly for more recent articles; however, our model includes time as an explanatory variable, enabling us to isolate and compare the effects of other variables in relation to the passage of time. This approach enables us to explicitly account for delays in the accumulation of citations, thereby reducing potential bias associated with newer publications.
The search criteria in The Lens were the following: Field of Study (Business OR Economics); Publication Date (2014-01-01 TO 2021-12-31); Publication Type (journal article); and Institution Country (Australia, Brazil, Canada, China, France, Germany, India, Indonesia, Italy, Japan, Netherlands, Republic of Korea, Russia, Spain, United Kingdom, United States).
The analysis focused on the sixteen countries with the highest production of articles in Business and Economics over the analyzed period. This selection was made in order to ensure a representative sample of articles in Economics and Business from the past decade. To allow for the accumulation of citations, the search was limited to articles published up to 2021.
The following article-level variables were obtained from The Lens database: publication year, ISSN, number of authors, funding, DOI, number of citations, open access, and open access type.
Next, the ISSNs were searched in the Scimago Journal Rank database to obtain the following variables at the journal level: foundation year (proxy for the year of inception in Scopus), SJR, best SJR quartile, and citations per document (3-year period).
Using the ISSNs, the Australian Business Deans Council journal quality list (ABDC, 2022) was linked in order to obtain the expert rating and the Fields of Research (FoR) code at the journal level. In 2022, the expert rating process resulted in a total of 2680 journals receiving classifications, with the distribution from highest to lowest as follows: A* = 7% (199), A = 25% (653), B = 32% (855), and C = 36% (973). We required that every journal on the list fall within the relevant Australia and New Zealand Fields of Research (FoR) codes.
Aggregation into disciplines was carried out according to the following (code and FoR): Accounting and Finance (3501 accounting, auditing, and accountability; 3502 banking, finance, and investment), Applied Economics (3801 applied economics; 3802 econometrics), Business (3505 human resources and industrial relations; 3506 marketing; 3507 strategy, management, and organizational behaviour), Commercial (4801 commercial law; 3504 commercial services; 3599 other commerce, management, tourism, and services), Economic Theory (3803 economic theory; 3509 transportation, logistics, and supply chains), Statistics (4905 statistics), and Tourism (3508 tourism). The discipline of Statistics was used as a reference point for comparison within the regressions.
Finally, we queried the Altmetric.com database using the Digital Object Identifier (DOI) of each article to obtain a set of altmetric indicators at paper level. Specifically, we collected data on mentions in the news, on blogs, in policy documents and patents, on X (formerly Twitter) and Facebook, in Wikipedia citations, and on video platforms (e.g., YouTube), as well as the number of Mendeley readers. This information was retrieved using the Altmetric.com search interface, with the DOI serving as the primary search criterion to ensure precise matching between records. Using the DOI guarantees a high level of accuracy in data linkage, as it serves as a unique and persistent identifier for each publication. To enable disaggregated analysis of the effects of different types of online attention on citations, each altmetric variable was recorded as a raw count without weighting or composite scoring.
Data were downloaded and merged during the last two weeks of March 2024.

3.2. Variable Description

Table 1 describes the analyzed variables along with their coding in cases where it was necessary. In terms of access type definitions, closed access (also known as subscription access) refers to the traditional model in which scholarly articles are only available to readers through subscription or paywall barriers. Typically, articles are available only to subscribers or individuals affiliated with subscribing institutions, thereby limiting access to a wider audience. Gold OA, on the other hand, is the practice of publishing scholarly articles in fully open access journals where the articles are freely available to readers without subscription or paywall restrictions. These articles are usually published under a Creative Commons license, which allows them to be freely distributed. Authors may be charged an Article Processing Charge (APC) to cover publication costs.
Hybrid OA refers to the publication of individual articles in subscription-based journals, with the option for authors to pay a fee for open access to their articles. This model allows journals to retain subscription revenue while offering authors the choice of open access publication. Green OA involves the self-archiving or depositing of scholarly articles in repositories or platforms after publication in subscription-based journals. These articles become openly accessible through institutional repositories, subject-based repositories, or preprint servers, thereby extending access beyond the journal’s paywall. Finally, Bronze OA is the practice of making articles openly accessible on a publisher’s website without an explicit open license. Some publishers choose to make selected articles freely available within subscription-based journals or to designate specific journals or sections where articles are accessible without a subscription. In some cases, known as delayed open access, publishers may impose an embargo period during which articles remain behind a paywall, after which the articles become freely available.
Table 2 shows the descriptive statistics obtained for the dependent and explanatory variables associated with the filtered database. The large sample size of 43,190 observations provides a strong basis for regressions. In terms of the characteristics of the research articles in the sample, the average article has 27.3 citations with a median of 11, indicating a right-skewed distribution. The number of citations varies considerably, ranging from 0 to 2672. Over the analyzed period, closed access was predominant in Economics and Business, with 55% of the observations in the sample, compared to 45% of open access articles. Green OA is the most common type of open access (30%), followed by Hybrid (10%), Bronze (3%), and Gold (2%).
Regarding the author and disciplinary characteristics, articles have an average of 2.58 authors, with a median of 2 and a range of 1 to 47. Moreover, funding is reported in 21% of articles. Applied Economics (44%), Business (25%), Commerce (14%), and Accounting and Finance (10%) are the most common disciplines, while Economic Theory (3%), Tourism (2%), and Statistics (2%) are the least common.
In terms of the prestige and impact of the journal, the year of the journal’s foundation shows high diversity. The a median of 1985 along with a standard deviation of 22 years indicates high variability. The average Scimago Journal Rank (SJR) is 1.8, with a median of 1, showing that most journals have a relatively low score, although there are outliers with scores as high as 20. The median of the best SJR quartile is 1, which means that more than half of the analyzed articles were published in journals classified in the first quartile of one of the different subject categories assigned by the Scopus database. Furthermore, journals in the sample receive an average of 4.47 citations per article three years after publication, with a median of 3.38. Expert ratings vary in frequency, with the highest rating of level 4 occurring 17% of the time and serving as the base in the regressions. Among the other levels, level 1 (the lowest) is the least frequent at 10%, followed by level 2 at 30% and level 3 at 43%.
Regarding social impact and influence, mentions vary between sources; the number of news items per article has an average of 0.63, with a median of 0 and range of 319. Similar patterns are observed for the number of mentions in blogs (mean 0.18, median 0, range 37), policy documents (mean 0.44, median 0, range 104), and patents (mean 0.0025, median 0, range 12). The average number of social media mentions on X/Twitter is 8, with a median of 1 and a range of 16,317. Other social media sources are rare (Facebook: average 0.15, median 0, range 38; Wikipedia: average 0.07, median 0, range 30; videos: average 0.0046, median 0, range 25). However, readers of Mendeley, a scientific reference management software program, are more frequent (average 68, median 34, range 8668).

3.3. Associations Between Variables

Table 3 shows the Pearson correlation coefficients between the quantitative variables. The strongest positive correlation for the citation count is the dependent variable, which is observed with Mendeley readers (0.84). This indicates that papers with a higher number of Mendeley readers tend to have significantly more citations. Policy mentions also show a notable positive correlation (0.45), suggesting that research papers referenced in policy documents are more likely to be cited in academic papers. Blog mentions (0.30) and journal average citations (0.29) are moderately correlated with citation count, showing that papers in journals with a high average citation rate per document or mentioned in blogs receive more citations. Furthermore, the Scimago Journal Rank (SJR) has a positive correlation of 0.26 with the citation count, indicating that papers published in higher-ranked journals are more likely to be cited.
Other variables with notable positive correlations include news mentions (0.21), patent mentions (0.19), journal expert ratings (0.18), and Wikipedia mentions (0.18). Although these correlations are weaker compared to Mendeley readers or policy mentions, they still suggest some influence on citation counts. The year of publication shows a slight negative correlation with citation counts (−0.14), which is expected as older papers have more time to accumulate citations. In addition, the SJR best quartile has a negative correlation of −0.15, which is due to the coding, where quartile 1 corresponds to the top level and quartile 4 to the bottom level.
Several variables show little or no correlation with the citation count. These include funding (0.00), the foundation year of the journal (−0.01), video mentions (0.03), and number of authors (0.06).
Table 3 also shows several significant associations between the independent variables. The SJR is strongly correlated with the average citations in the journal (0.64), emphasizing that the most prestigious journals tend to publish articles that receive more citations in the three years after their publication. The other highest positive correlations are observed between expert rating and SJR (0.54) and between expert rating and journal average citations (0.41), reflecting that journals rated highly by experts are often highly positioned in the rankings of journals.
Another notable correlation is between news mentions and blog mentions (0.46), indicating that articles mentioned in the news are often discussed in blogs. Similarly, the correlation between blog mentions and policy mentions is notable (0.33), suggesting a link between online discussions and policies.
In addition, Mendeley readers show moderate positive correlations with several variables, including journal average citations (0.39), indicating that articles published in journals with higher citation rates tend to be saved by more readers. The correlation between Mendeley and peer review is weaker (0.16), but still suggests some relationship between peer review and the attention an article receives from the academic community.
The negative association between the best SJR quartile with expert rating and average citations is due to the coding, where quartile 1 corresponds to the top level and quartile 4 to the bottom level, as mentioned above.
In summary, the most influential factors associated with higher citation counts are Mendeley readers, policy mentions, blog mentions, journal average citations, and SJR. These variables should be included in any predictive model for research paper citations. On the other hand, the highest correlations among the independent variables highlight the interplay between peer review, journal rankings, and online mentions.

4. Specific Models

In (1), if we allow π to be the gamma distribution with shape parameter r 1 and scale parameter ( r θ ) 1 , r > 0 , and θ > 0 , then we have the following mixture (unconditional) distribution for the number of citations:
Pr ( Y = y | x ) = Γ ( r 1 + y ) Γ ( r 1 ) Γ ( y + 1 ) 1 1 + r θ ( x ) r 1 r θ ( x ) 1 + r θ ( x ) y , y = 0 , 1 ,
where r > 0 acts as a dispersion parameter and x as a k × 1 vector of exogenous or explanatory variables. Furthermore, Γ ( · ) represents the Euler Gamma function. In this case, the random variable Y has mean and variance provided by
μ x = E ( Y | x ) = θ ( x ) ,
σ x 2 = v a r ( Y | x ) = μ x + r μ x 2 ,
respectively. It is usual to take θ ( x ) = exp ( x T β ) , i.e., we are assuming a log-linear specification in which β is a vector of regression parameters which has to be estimated. This parameterization of the negative binomial regression model has been considered by Lawless (1987), Cameron and Trivedi (1998), and Hilbe (2011), among others.
This model reduces to the Poisson distribution when r 0 and to the geometric model when r = 1 . The log-likelihood function is shown in Appendix A. Details about the normal equations obtained from (A1) and second derivatives needed to obtain the variance–covariance matrix of the estimators can be found in Lawless (1987) and Cameron and Trivedi (1998).
Although in practice there are numerous statistical software programs that have implemented this model in their packages (R 4.4.0, Stata 18, Eviews 13, Matlab R2024a, and SAS 9.4M8), we have not made use of them but have instead programmed it in Mathematica, corroborating the results with additional programming in WinRats.
The normal equations obtained from (A1) require the use of the digamma function ψ ( z ) = d d z log ( Γ ( z ) ) , z > 0 to estimate all the model parameters. This problem can be overcome by using Mathematica routines (see Ruskeepaa, 2009) and RATS (see Brooks, 2009), which work well with this special function. Other software such as Matlab, Stata, Eviews, and R can also be useful thanks to the incorporation of special packages to work with this model. In practice, given the difficulty sometimes encountered when estimating the index of dispersion r, it is convenient to use the following approximation for the logarithm of the Euler gamma function:
log Γ ( z ) 1 2 log ( 2 π ) + z 1 2 log ( z ) z + 1 2 z log z sinh 1 z , z > 0 .
Furthermore, the gamma function can be avoided by taking into account that Γ ( a + b ) / Γ ( a ) = j = 1 b ( a + j 1 ) , and consequently log Γ ( a + b ) log Γ ( a ) = j = 1 b log ( a + j 1 ) .

Distinction Between Cited and Uncited Articles

As pointed out previously, the process of citations of papers may be divided into two parts; in the first stage, the paper has no citations, while the second part provides the intensity of the citations. After a paper is cited for the first time, it accumulates new citations for at most the time since this first citation. Formally, we consider a hurdle model in order to deal separately with papers without citations and those with at least one citation. Thus, we consider a dichotomic variable that first differentiates documents with and without citations. In the former case, a separate process generates the number of citations. The hurdle count model represents a suitable distribution implying the assumption that the data come from two separate processes, with the simplest hurdle model setting the hurdle at zero. Specifically, the model we consider now is the hurdle model which sets the hurdle at zero with geometric distribution and with success probability at zero ϕ [ 0 , 1 ] and a negative binomial (such as in (2)) for values larger than zero (see for instance Mullahy, 1986; Pohlmeier & Ulrich, 1995). Thus, we consider the model
Pr ( Y = y | x ) = ϕ ( x ) , y = 0 , ϕ ¯ ( x ) p ¯ ( 0 | x ) Γ ( r 1 + y ) Γ ( r 1 ) Γ ( y + 1 ) 1 1 + r θ ( x ) r 1 r θ ( x ) 1 + r θ ( x ) y , y > 0 ,
where p ¯ ( 0 | x ) = 1 p ( 0 | x ) , p ( 0 | x ) = Pr ( Y = 0 | x ) = 1 + r θ ( x ) r 1 (taken from (2)) and ϕ ¯ ( x ) = 1 ϕ ( x ) . As can be seen, we assume that the hurdle parameter is not constant for all observations but is modeled similarly to the mean parameter depending on the covariates. The first (hurdle) part of (5) provides the probability of zero citations, while the second part governs the process once the hurdle has been passed with a truncated-at-zero probability distribution, which includes the probability of citations conditional on one citation.
The mean and variance of this hurdle distribution are provided by
μ x = E ( Y | x ) = ϕ ¯ ( x ) θ ( x ) p ¯ ( 0 | x ) ,
σ x 2 = v a r ( Y | x ) = μ x ϕ ( x ) + p ¯ ( 0 | x ) + μ x ϕ ¯ r p ¯ ( 0 | x ) + ϕ p ( 0 | x ) ,
respectively, which are needed to compute the Pearson residuals, among other things.
A logit-link ϕ ( y ˜ ; r , β ) = exp ( x T δ ) / ( 1 + exp ( x T δ ) ) , is now assumed to connect the covariates with the parameter ϕ , where δ is a new vector of regression parameters to be estimated. Both θ and ϕ may be influenced by different characteristics and variables. For this reason, the explanatory variables used to model them may not be the same. Finally, the log-likelihood is shown in the Appendix A (see expression (A2)). Because the parameters for the two pieces are different (then separable), the maximization may be carried out separately for each part.
The marginal effect reflects the variation of the conditional mean of citations due to a one-unit change in the jth covariate, allowing us to obtain the mean of citations according to information contained in some explanatory variables. For the log-link, we have
E ( y i ) x i j 1 E ( y i ) = β j ,
meaning that we can interpret β j as the proportional change in the mean of citations per unit change in x i j . For a dummy variable taking 0 and 1 values, it is well known that the estimator exp ^ ( β j ) ( j = 1 , , k ) is the relative impact of the covariate j on the expected count. This is the same for the logit-link; nevertheless, for the logit-link and a continuous variable, the effect on the number of citations due to a one-unit change in the covariate is provided by ϕ i / x i j = β j ϕ ¯ ( 1 ϕ ¯ ) .

5. Results

5.1. Homogeneous Models

We begin by fitting the random variable number of citations using Poisson (P), Negative Binomial (NB), and Hurdle Negative Binomial (HNB) distributions without including covariates. The resulting Akaike Information Criterion (AIC) value ( A I C = 2 l + 2 p , where is the loglikelihood value and p is the number of parameters) is 2,297,340, 367,121 and 364,897 for P, NB, and HNB distributions, respectively. For this measure, the smaller the AIC, the better the model (see Akaike, 1974). The estimated λ and θ parameters for P and NB is the mean of the number of citations (27.3193), while the estimated index of dispersion r is 1.61933 for the NB distribution and 2.42694 for the HNB distribution. In this case, the θ parameter results in 23.4883 and the ϕ parameter results in 0.0552. The results were significant for all of these. As expected, the NB distribution provides a better fit than the P distribution, and the HNB is better than the NB distribution.
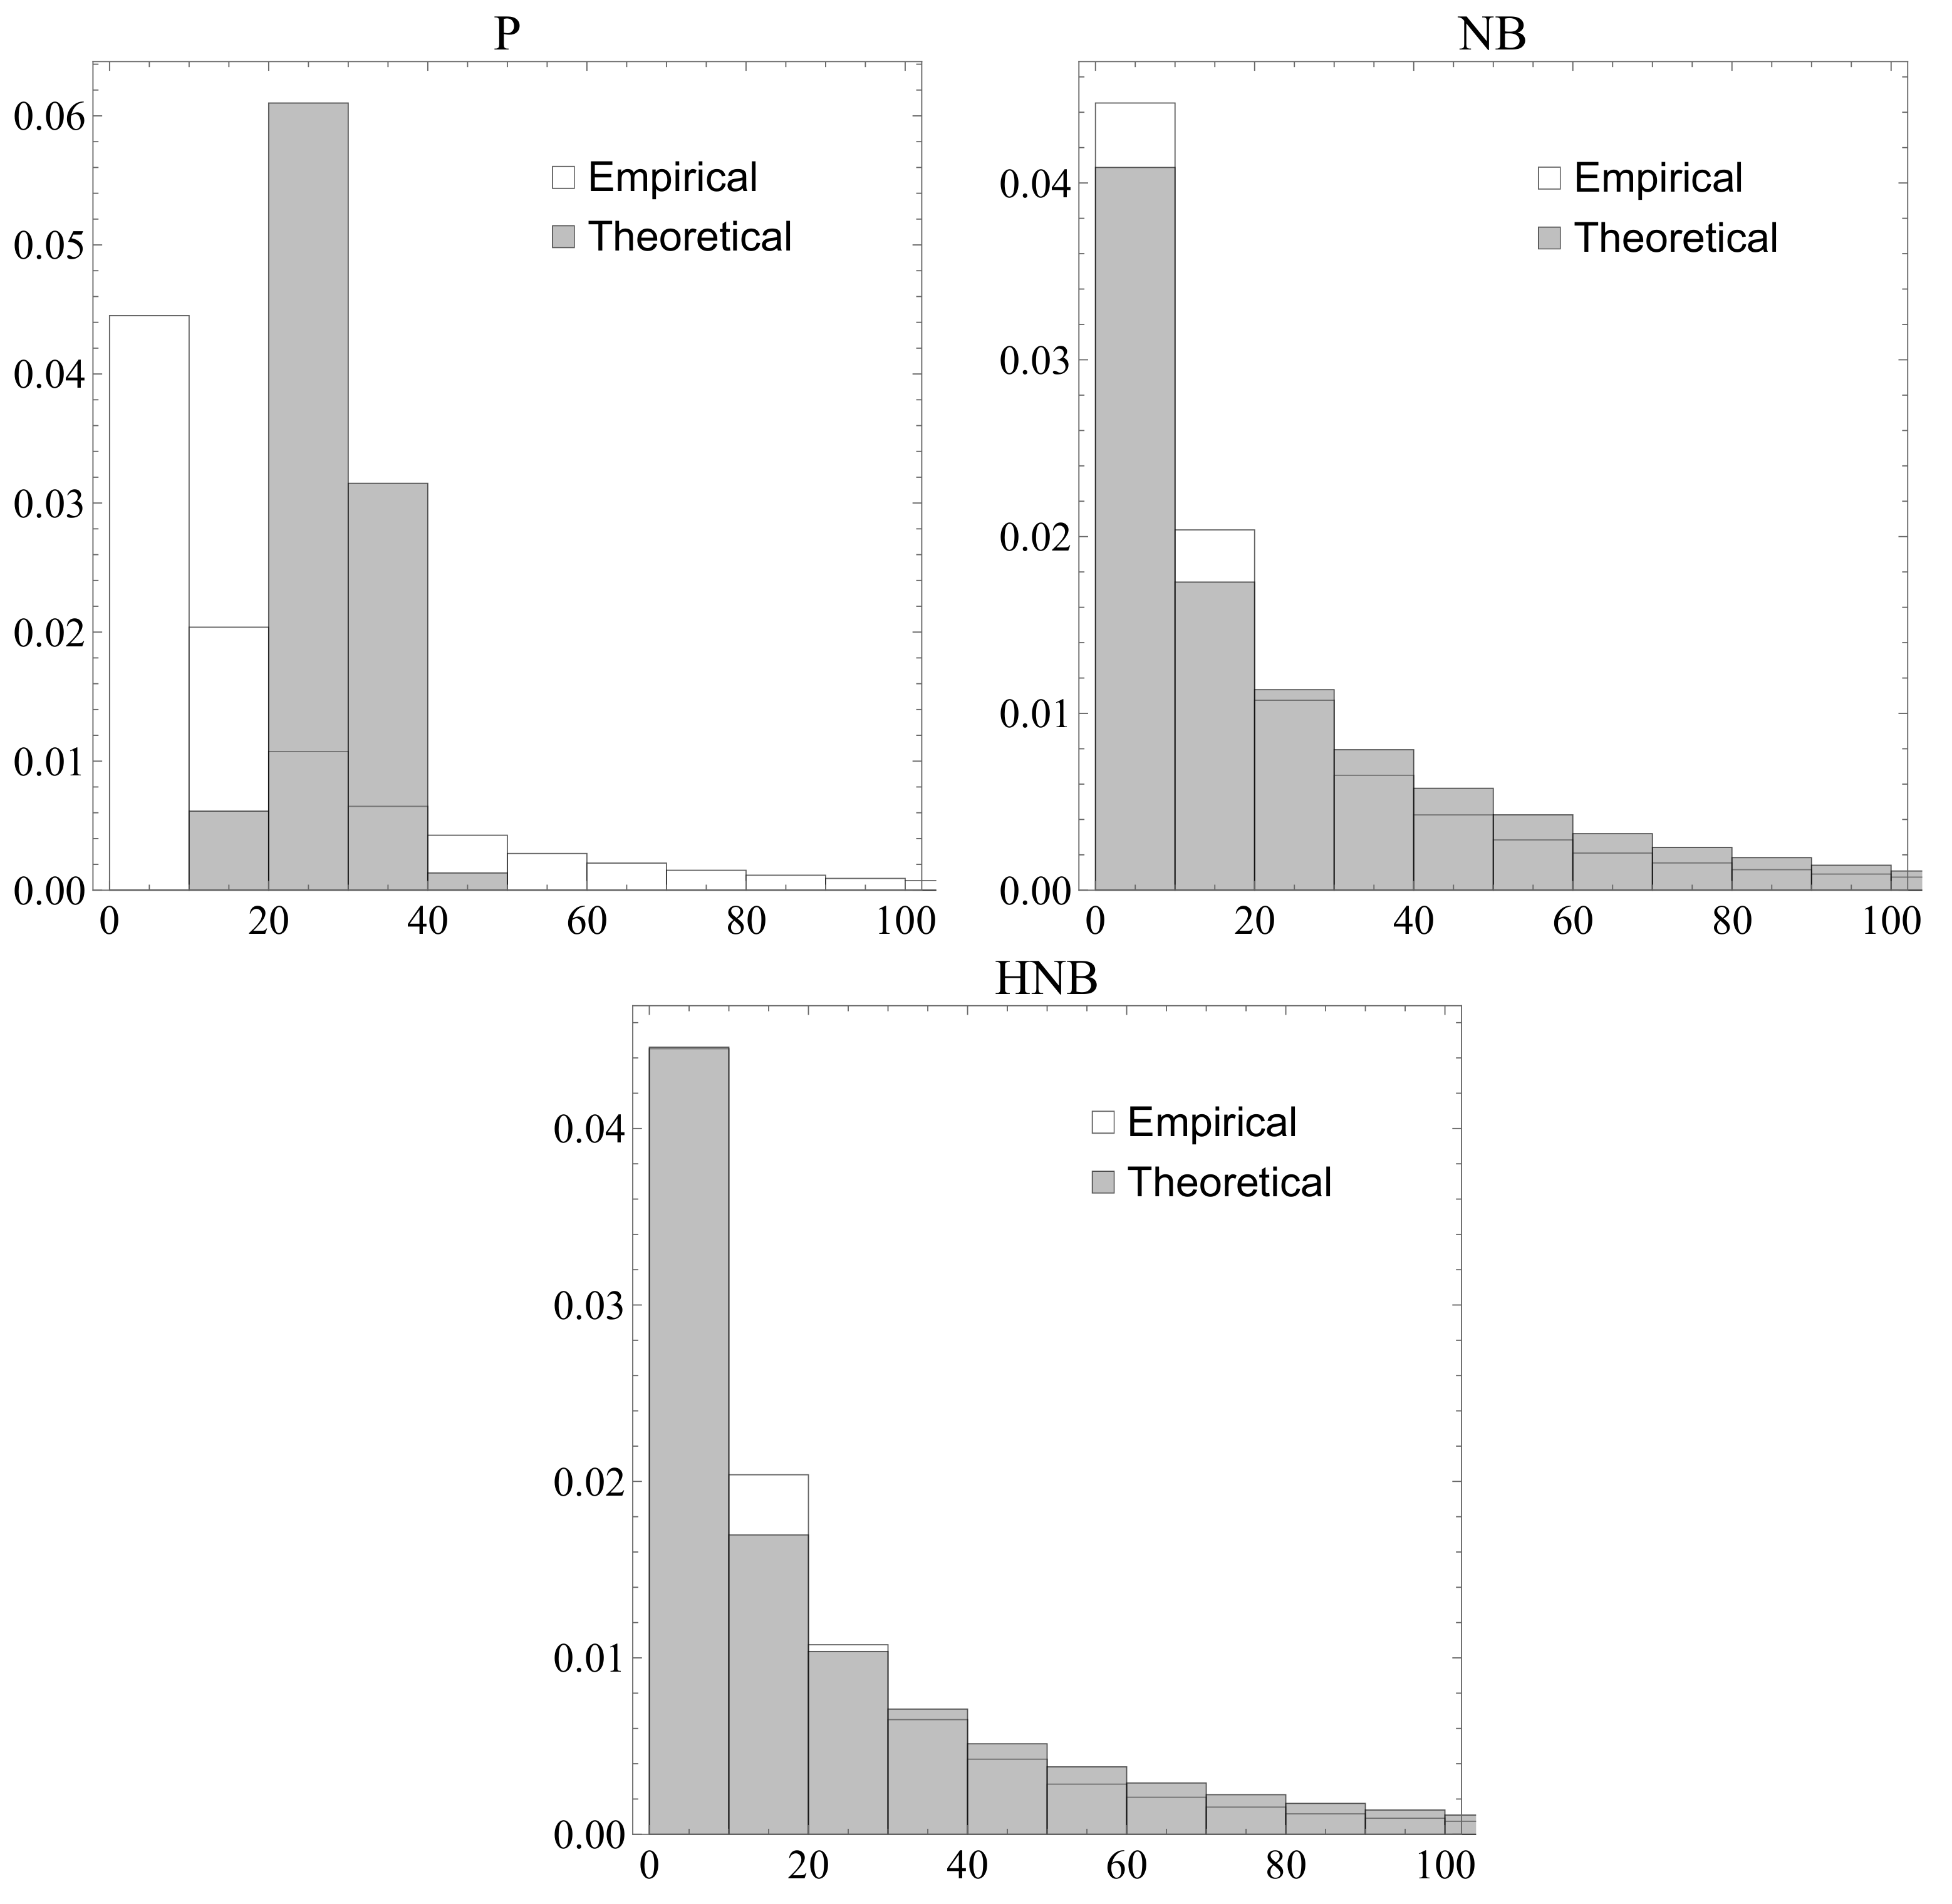
Figure 1 shows the empirical and fitted histograms of the number of citations obtained by the model based on the P, NB, and HNB distributions. From the graph shown in this figure, it is evident that the fit provided by the NB distribution is much better, especially for the tail of the data and for the zero value, which is particularly the case when the HNB distribution is considered.
Thus, in the following we concentrate our attention on the negative binomial model.

5.2. Models with Covariates

Table 4 summarizes the negative binomial regression model, for which it can be seen that many of the coefficients are statistically significant. After this, we estimate the hurdle model, for which the results are shown in Table 6. Not all covariates are statistically significant for the hurdle parameter, with different signs in many cases compared to the case in which the dependent variable takes a value larger than zero. Thus, including this model seems to significantly affect the dependent variable under investigation. TO make for a more parsimonious model, we have removed the variables that are not statistically significant; the new estimation results are shown in Table 7.
Table 5 shows the Incidence Rate Ratio (IRR) results along with their standard errors and confidence intervals for various categorical variables related to access type, discipline, and journal expert rating. These variables were analyzed to determine their impact on the likelihood of an article being cited. In terms of accessibility, the table shows that most open access modalities have a statistically significant higher incidence rate compared to closed articles, suggesting a citation advantage for open access. Concretely, Green OA articles have a 13.9% higher citation rate compared to closed articles, which is statistically significant. Hybrid OA articles have a 7.9% higher citation rate, also statistically significant. Bronze OA articles see a 5.9% higher citation rate, again statistically significant. Finally, Gold OA articles have a 6% higher citation rate; however, the confidence interval includes 1, suggesting that this result may not be statistically significant.
The table compares the incidence rates for different academic disciplines, using Statistics as the base category. All disciplines are statistically significant, indicating that they are more likely to be cited than Statistics. The disciplines with the highest positive effects are Accounting and Finance with a 42.5% higher incidence rate, followed by Applied Economics with a 36.8% higher incidence rate and Economic Theory with a 36% higher incidence rate. Tourism and Commerce also have higher incidence rates, with 28.4% and 28.3%, respectively. Articles in the Business category have a 24.9% higher incidence rate.
The table also examines the effect of journal prestige on the incidence rate using expert ratings from 1 to 4, with 4 being the highest tier. The results show that articles in journals with the lowest expert rating have a statistically significant 26.5% lower incidence rate compared to articles in the highest-rated journals. This suggests that high-impact journals are more selective and publish fewer but more impactful articles, potentially influencing citation practices. Intermediate expert ratings (2 and 3) also show lower incidence rates; however, the confidence intervals suggest potential problems with statistical significance.
In summary, Table 5 highlights the positive impact of open access on the likelihood of an article being cited. Certain disciplines have higher incidence rates, such as Accounting and Finance, Applied Economics, and Economic Theory, which may reflect their broader impact. These results also suggest that high-impact journals are more selective, publishing fewer but more impactful articles, which may influence citation practices.
The results of the hurdle negative binomial regression model are summarized in Table 6. This model is divided into two parts: the positive counts component (negative binomial part) and the zero counts component (hurdle part). The estimates provide insights into which factors are associated with higher or lower citation counts as well as the likelihood of an article having zero citations.
Younger publications tend to receive fewer citations (estimate = −0.14, p < 0.01 ) and are more likely to have zero citations (0.13, p < 0.01 ). Articles with Green OA are positively associated with citation counts (0.12, p < 0.01 ) and are less likely to have zero citations (−0.28, p < 0.01 ). Similarly, Hybrid OA is positively associated with citation counts (0.06, p < 0.01 ) Conversely, while Bronze OA is positively associated with citation counts (0.13, p < 0.01 ), it also increases the likelihood of zero citations (0.72, p < 0.01 ).
The number of authors positively influences the citation count (estimate = 0.04, p < 0.01 ) and reduces the likelihood of zero citations (−0.12, p < 0.01 ). Articles with funding also see a positive impact on citation count (0.08, p < 0.01 ) and a reduced likelihood of zero citations (−0.39, p < 0.01 ). Several disciplines show significant associations with citation counts. Business (−0.27, p < 0.05 ), Tourism (−0.20, p < 0.05 ), Commercial (−0.19, p < 0.10 ), and Applied Economics (−0.16, p < 0.10 ) are negatively associated with citation counts when compared with Statistics.
The journal prestige and impact categories include several variables indicating the journal’s reputation and the impact of an average article in that journal. Lower expert ratings are associated with fewer citations, with a rating of 1 showing the strongest negative association (estimate = −0.26, p < 0.01 ) and increasing the likelihood of zero citations (0.42, p < 0.05 ). SJR positively affects citation counts (0.006, p < 0.10 ). The SJR best quartile is negatively associated with citation counts (−0.25, p < 0.01 ) but positively influences the likelihood of zero citations (0.18, p < 0.01 ). Note that a higher quartile represents a worse position in the ranking, as the top quartile is coded as 1 while the bottom quartile is coded as 4. The journal’s average citations positively affects citation counts (0.03, p < 0.01 ) but also positively influences the likelihood of zero citations (0.05, p < 0.05 ).
In the influence and social impact categories, mentions in news items, blogs, policies, patents, and other platforms show mixed effects on citation counts. News mentions positively influence citation counts (estimate = 0.004, p < 0.01 ) and decrease the likelihood of zero citations (−0.15, p < 0.01 ). Blog mentions also positively influence citation counts (0.06, p < 0.01 ). Policy mentions significantly reduce the likelihood of zero citations (−0.96, p < 0.01 ) and positively influence citation counts (0.06, p < 0.01 ). However, patent mentions negatively influence citation counts (−0.11, p < 0.10 ).
Social media mentions have different effects on citation counts. Mentions on X/Twitter positively influence citation counts, although with a limited effect (estimate = 0.0001, p < 0.05 ), and decrease the likelihood of zero citations (−0.027, p < 0.01 ). On the other hand, Facebook and video mentions negatively influence citation counts (−0.015 and −0.047 respectively, p < 0.05 ). Wikipedia mentions also positively influence citation counts (0.027, p < 0.05 ). Finally, Mendeley readers have a positive association with citation counts (0.007, p < 0.01 ) and a significant negative association with the likelihood of zero citations (−0.117, p < 0.01 ).
Overall, these results highlight (Table 7) the complex factors that influence the citation patterns of academic articles. Access type, publication age, discipline, collaboration, journal prestige, and social impact metrics all play significant roles in determining the citation outcomes of scholarly work.

5.3. Model Assessment

Various model fit statistics and residuals are readily available in the statistical literature. In regression studies, it is common to examine the Pearson residuals. These are provided by r i = ( y i μ ^ x ) / σ ^ x , where μ x and σ x are respectively provided by (3) and (4) for the negative binomial model and (6) and (7) for the hurdle model, then comparing the regression coefficients to the estimated ones. The Pearson residuals can also be used to compute the Pearson goodness-of-fit statistic, provided by P S = i = 1 n r i 2 , which in our case results in 45,018.60 and 43,523 for the negative binomial and hurdle models, respectively. These value are near to n ( k + 1 ) = 43 , 158 ( k = 31 ) and 43,128 ( k = 61 ) for the two estimated models, where k is the number of parameters in the model. For the restricted model, the Pearson goodness-of-fit statistic is 43,543.80, which is close to n ( k + 1 ) = 43 , 149 , k = 40 . This indicates that the model is specified correctly, making it better than the hurdle model.
The Pearson residuals are often skewed for non-normal data, making the residual plots more challenging to interpret. Therefore, other quantifications of the discrepancy between observed and fitted values have been suggested in the literature. In this regard, another choice in residual analysis is to use the signed square root of the contribution to the deviance goodness-of-fit statistic (i.e., deviance residuals). This is provided by d i = sign ( y i θ ^ i ) 2 l ( y i ) l ( θ ^ i ) 1 / 2 , i = 1 , , n . (see Cameron & Trivedi, 1998, p. 141), where sgn is the function that returns the argument’s sign (plus or minus), the l ( y i ) term is the log-likelihood value when the mean of the conditional distribution for the i-th individual is the individual’s actual score of the response variable, and the l ( θ i ) term is the log-likelihood when the conditional mean is plugged into the log-likelihood. Usually, the deviance divided by its degree of freedom is examined by taking into account that a value much greater than 1 indicates a poorly fitting model. The deviance is provided by D = i = 1 n d i . The statistics D / d f = 0.2891 for the NB fitted model with covariates indicate a good result. Here, d f denotes the degree of freedom. Because the HNB model is not a generalized linear model, it is impossible to compute this statistic. The NB model’s expression for deviance is displayed in (A3) in the Appendix A.
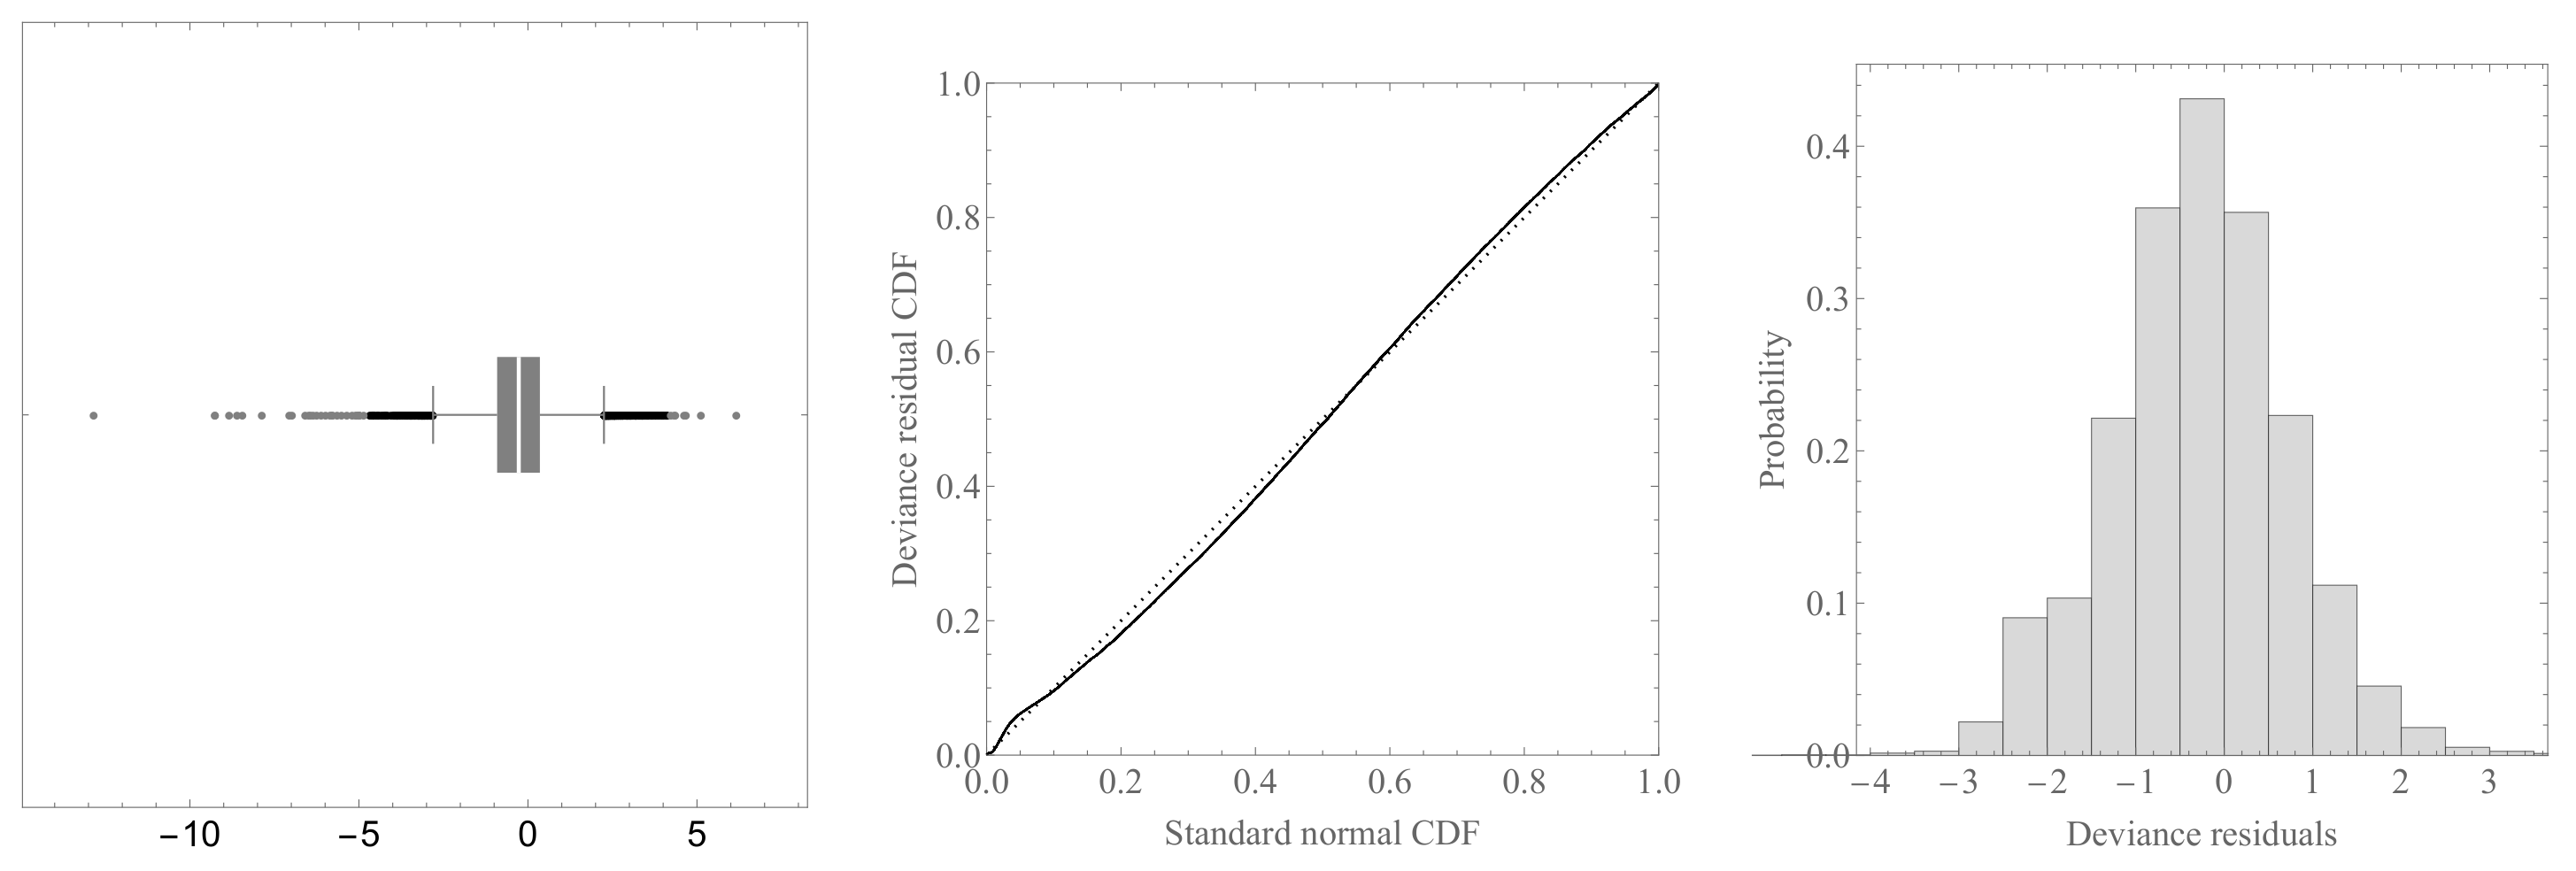
We now illustrate some diagnostic plots based on the Pearson residuals and deviance residuals. The box-and-whisker chart (left panel), probability plot, and histogram of the deviance residuals based on the NB regression model are shown in Figure 2. All of the plots indicate reasonable behavior of the residuals, indicating that the deviance residuals are normally distributed to a reasonable approximation, resulting in normal plots that are rather linear.
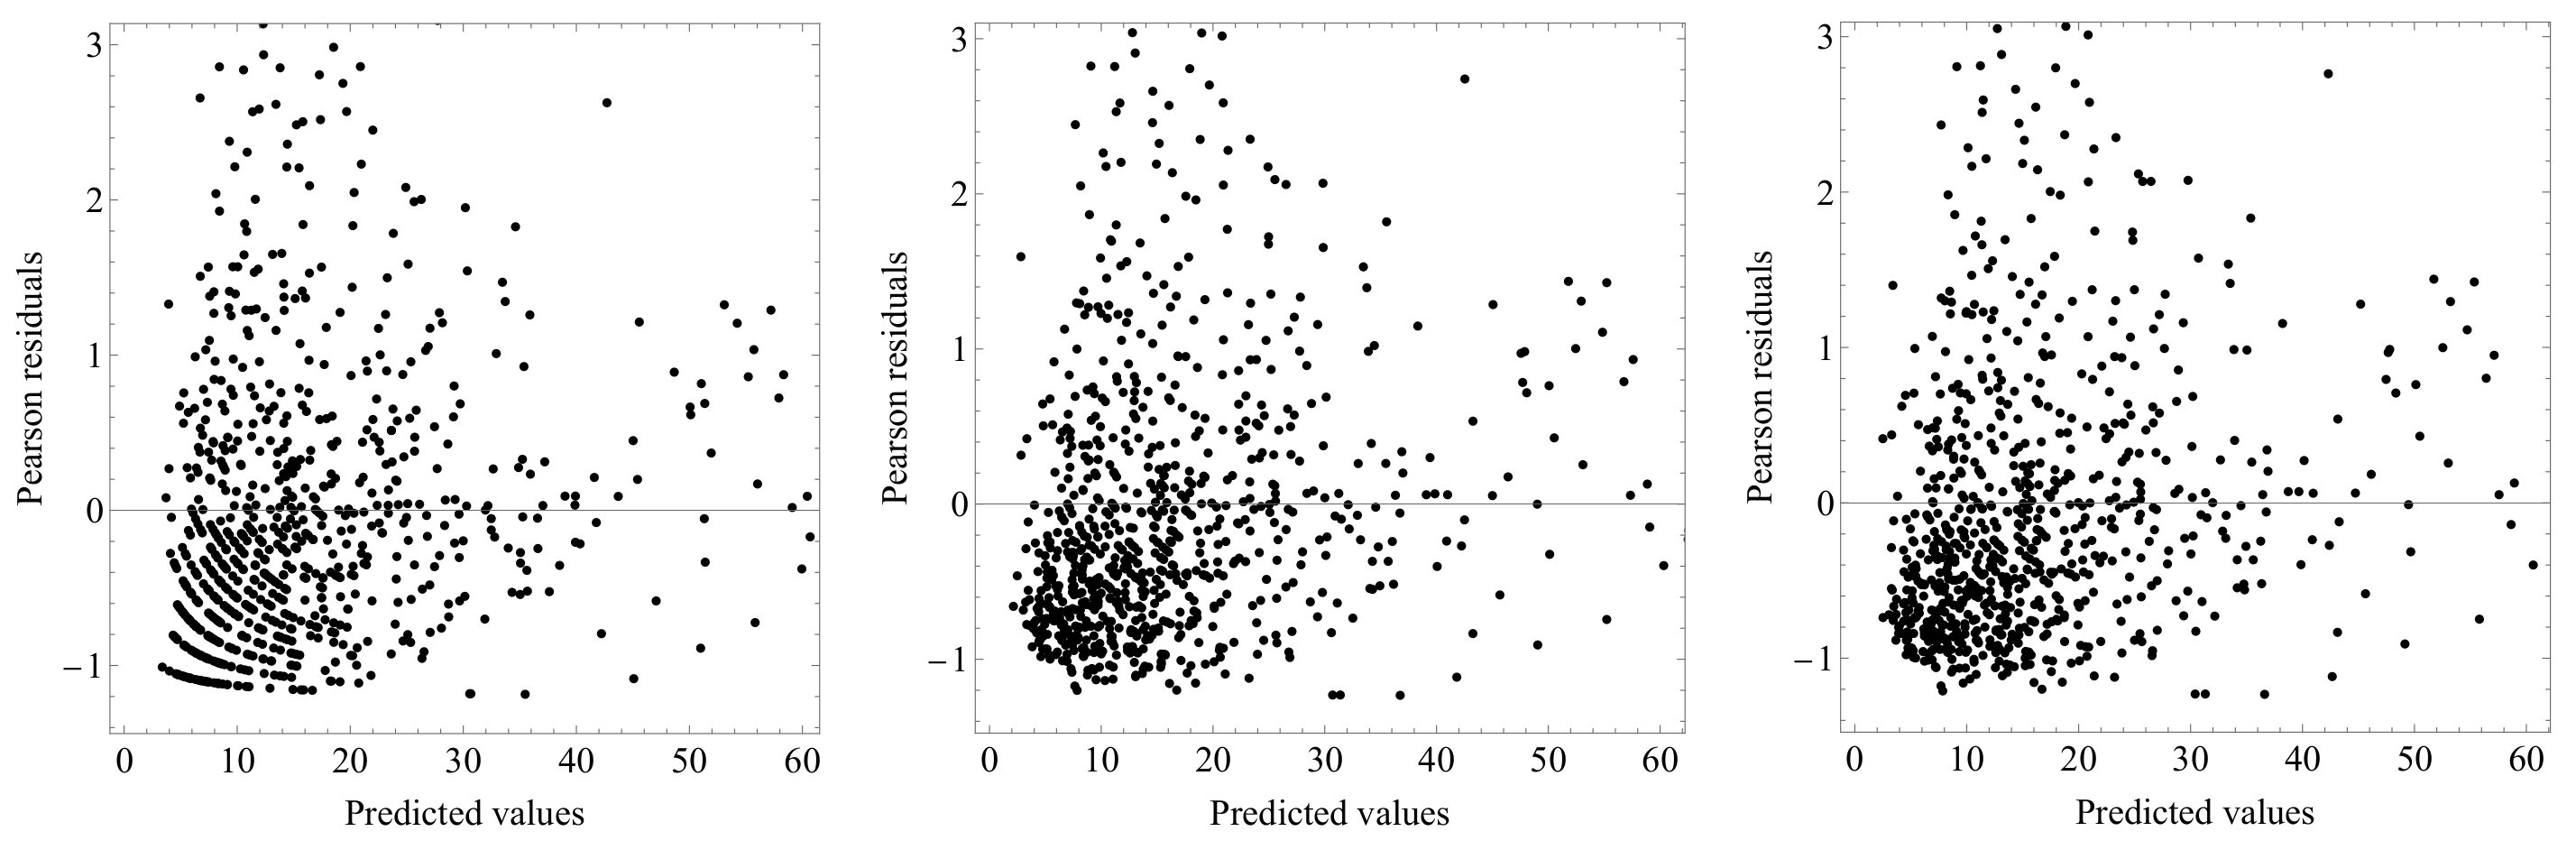
The standardized Pearson residuals plotted against the predicted values for the NB, HNB, and restricted HNB models are provided in Figure 3. These plots reveal that no suspicious patterns are apparent.

6. Conclusions

Forecasting future citations and evaluating the quality of an article can be a valuable tool for research assessment, particularly for nations and organizations seeking to gauge their research achievements. Traditional research assessments often rely on citation metrics, expert reviews, and journal-level data; however, recent studies suggest that incorporating a broader range of variables can enhance prediction accuracy. Identifying factors that predict the citation impact and quality of journal articles is crucial for improving scientific research and supporting research evaluation. This study aims to bridge the gap by examining the relationships between document features and extra-documentary factors such as altmetric attention scores and downloads to predict citation impact.
Unlike traditional approaches which rely solely on Poisson or negative binomial models to analyze citation data, our framework explicitly distinguishes between the probability of receiving no citations and the frequency with which citations occur. This enables a more nuanced understanding of the factors influencing the visibility and impact of academic publications. Furthermore, by integrating altmetric indicators and multiple forms of open access, our study sheds new light on how contemporary dissemination practices beyond conventional journal metrics can shape citation outcomes.
This study aims to understand the factors influencing the citation counts of research papers in Economics and Business using a suitable regression model. The substantial variation in citation counts, where the sample variance exceeds the sample mean, necessitates moving beyond the classical Poisson regression model to a negative binomial regression model. This approach allows the variance to be a function of its predicted value. Furthermore, the citation process can be divided into two stages: papers with no citations and those with citations. This can help to model the observed attraction effect in citation counts after the first citation occurs. To address this, we employ a hurdle model to separately analyze the likelihood of having zero citations and the intensity of citations for papers that have already been cited.
Our dataset comprised 43,190 research papers from 2014–2021 sourced from The Lens database, with citation counts and social attention scores obtained from the Altmetric database. The results of the hurdle negative binomial regression model reveal that Green OA articles are positively correlated with higher citation counts and a reduced likelihood of zero citations, highlighting a clear citation advantage for articles in open access repositories. Conversely, Bronze OA articles, while also positively associated with citation counts, exhibit an increased likelihood of zero citations, indicating some complexity in their citation dynamics. Hybrid OA articles similarly show a positive association with citation counts.
A paper’s number of authors positively influences citation counts and decreases the likelihood of zero citations, reflecting the collaborative nature of impactful research. Funded articles also see a positive impact on citation counts and are less likely to have zero citations, suggesting that funding may enhance research quality and visibility.
Disciplinary differences are evident as well, indicating varying citation practices across study areas. Journal prestige significantly impacts citation counts, with lower expert ratings linked to fewer citations and a higher likelihood of zero citations. Furthermore, articles in journals with a higher SJR score and better quartile position tend to have higher citation rates, although the effect varies across quartiles.
Social and influential metrics also play a role in citation counts. News mentions and blog mentions positively influence citation counts and decrease the likelihood of zero citations, underscoring the importance of public and scholarly dissemination. Moreover, policy mentions significantly reduce the likelihood of zero citations and positively influence citation counts, reflecting the impact of policy relevance on academic recognition. However, patent mentions negatively influence citation counts, suggesting a different focus or recognition pattern in patent-referenced work.
Social media mentions exhibit varied effects. While mentions on X/Twitter positively influence citation counts and decrease the likelihood of zero citations, Facebook and video mentions negatively affect citation counts. Wikipedia mentions positively influence citation counts, while the number of Mendeley readers is positively associated with citation counts and significantly reduces the likelihood of zero citations, emphasizing the role of academic and public knowledge sources.
Overall, these results highlight the complex factors influencing citation patterns. Access type, publication age, discipline, collaboration, journal prestige, and social impact metrics all significantly determine citation outcomes. Our findings advocate for the promotion of open access and collaborative efforts to enhance the visibility and impact of scholarly work. This research provides important knowledge for academics, organizations, and policy makers aiming to understand and improve citation counts in scholarly research.
However, there are some considerations about the results and their generalization to other fields of research which must also be addressed. First, the field of Economics and Business has specific characteristics compared to other disciplines, making generalization to other fields complex. As pointed out by Dorta-González and Gómez-Déniz (2022), this field faces notable challenges of obsolescence compared to other disciplines, mainly due to its conservative publication practices and slower adoption of open access. Unlike the rapidly evolving natural and health sciences, where cutting-edge research is widely and rapidly disseminated, Economics and Business publishing often relies on traditional slower-moving channels. This inertia can delay the adoption of new methodologies and the integration of innovative findings, potentially hindering progress.
Citation concentration within Economics and Business also varies significantly across subject categories. For example, higher citation concentration indices as measured by the Gini and Pietra indices are observed in Statistics than in Management (Gómez-Déniz & Dorta-González, 2024b). This disparity suggests that some disciplines receive disproportionately more citations than others. The elasticity, which measures the sensitivity of impact factors to changes in variables, further underlines the uniqueness of this field. The elasticity of impact factors with respect to the number of citations is higher in economics than in natural and health sciences such as biology and medicine. Conversely, the time elasticity of impact factors is lower in economics than in the hard sciences. This means that impact scores are more sensitive to changes in the number of citations but less sensitive to changes over time than those in natural and health sciences (Gómez-Déniz & Dorta-González, 2024a).
These peculiarities suggest that caution should be exercised when attempting to generalize findings from economics and business to other fields. The conservative nature of publication practices, low prevalence of open access, varying citation concentrations, and distinctive elasticity measures highlight the unique landscape of research in the Economics and Business category. Such considerations are essential for an accurate interpretation of the impact and quality of research in this field.
Furthermore, our findings reveal systemic biases in citation dynamics that have critical implications for research practices in economics and business. The prominence of Journal Impact Factors (JIFs) and peer review ratings in predicting citation success may encourage researchers to prioritize conservative methodologies or topics that are considered ‘safer’ for high-status journals, which could lead to the homogenization of scholarship. Similarly, the outsized influence of collaboration and funding on citations raises equity concerns, as teams with more resources gain disproportionate visibility, potentially marginalizing innovative but underfunded work. The limited impact of altmetric mentions (e.g., in the news or on social media) further highlights how traditional citation metrics undervalue public engagement, thereby discouraging broader societal impact. These dynamics highlight the tension between citation-driven evaluation frameworks and the intellectual diversity that is essential for advancing economic research.
The results of this study have significant implications for researchers, institutions, and policymakers in the field of Economics and Business. By identifying the key factors influencing the likelihood of being cited and the intensity of citations, our findings can inform strategic decision-making regarding research dissemination. For instance, fostering collaboration and securing funding can support research production and enhance both its visibility and scholarly impact. In addition, the differentiated effects of various open access models suggest that if researchers and institutions aiming to increase their citation performance should carefully consider their publication and archiving strategies. These insights are particularly relevant in a context where citation metrics continue to play a central role in research evaluation and academic career progression.
In addition to its practical relevance, this study opens up new avenues for future research. The application of a two-stage modeling approach enables a more detailed understanding of citation dynamics, which could be extended to other disciplines or more specific subfields within economics. Furthermore, integrating altmetric data emphasizes the increasing importance of examining how new forms of digital visibility intersect with traditional scholarly impact. Future studies could examine the temporal dimensions of citation accumulation, field-specific effects, or the role of additional dissemination platforms. Overall, our findings contribute to a broader understanding of how scholarly communication practices are evolving and how they shape the recognition of academic work in an increasingly data-driven research environment.
Future research could benefit from a more nuanced examination of author collaboration and its impact on citations. While we used the number of authors as an indicator of collaboration the present study, we acknowledge that this measure may oversimplify the complex dynamics of teams. As one reviewer noted, large collaborations may involve diminishing returns or free-riding behavior, and an economic perspective could offer valuable insights into how incentives within research teams influence productivity and scholarly impact. Furthermore, future studies could examine whether the impact of collaboration varies across different subfields of economics and business. While our current dataset lacks the detailed information necessary for investigating these aspects, we recognize the importance of these observations and encourage further research in this area.

Author Contributions

Conceptualization, P.D.-G. and E.G.-D.; methodology, P.D.-G. and E.G.-D.; software, E.G.-D.; validation, P.D.-G. and E.G.-D.; formal analysis, P.D.-G. and E.G.-D.; investigation, P.D.-G. and E.G.-D.; resources, P.D.-G. and E.G.-D.; data curation, P.D.-G. and E.G.-D.; writing—original draft preparation, P.D.-G. and E.G.-D.; writing—review and editing, P.D.-G. and E.G.-D.; supervision, P.D.-G. and E.G.-D.; project administration, P.D.-G. and E.G.-D.; funding acquisition, E.G.-D. All authors have read and agreed to the published version of the manuscript.

Funding

E.G.-D. was partially funded by Grant PID2021-127989OB-I00 (Ministerio de Economía y Competitividad, Spain) and Grant TUR-RETOS2022-075 (Ministerio de Industria, Comercio y Turismo).

Data Availability Statement

The data supporting the findings of this study are available from the corresponding author upon reasonable request.

Conflicts of Interest

The authors declare no conflicts of interest.

Appendix A

For a sample y ˜ = ( y 1 , , y n ) of size n, the log-likelihood function for the negative binomial regression model is proportional to
l ( y ˜ ; r , β ) i = 1 n log Γ ( r 1 + y i ) ( r 1 + y i ) log ( 1 + r θ i ( x ) ) + y i log r + log θ i ( x ) n log Γ ( r 1 ) .
For the hurdle model, the log-likelihood function is provided by
l ( y ˜ ; r , β , δ ) = i = 1 n I y i = 0 log ( ϕ ( x ) ) + I y i > 0 log ( 1 ϕ ( x ) ) I y i > 0 log ( 1 p ( 0 | x ) ) + i = 1 n I y i > 0 log Γ ( r 1 + y i ) ( r 1 + y i ) log ( 1 + r θ i ( x ) ) + y i log r + log θ i ( x ) ,
where I is the indicator function, with I A ( z ) = 1 if x A and 0 otherwise.
Finally, the NB model’s expression for deviance is provided by
d i 2 = 2 y i log y i θ i y i + r 1 log 1 + r y i 1 + r θ i , y i > 0 , 2 r 1 ln ( 1 + r θ i ) , y i = 0 .

References

  1. ABDC. (2022). Australian Business Deans Council (ABDC) journal quality list. Available online: https://abdc.edu.au/2022-abdc-journal-quality-list-released/ (accessed on 15 March 2024).
  2. Abramo, G., & D’Angelo, C. A. (2015). The relationship between the number of authors of a publication, its citations and the impact factor of the publishing journal: Evidence from Italy. Journal of Informetrics, 9(4), 746–761. [Google Scholar] [CrossRef]
  3. Akaike, H. (1974). A new look at the statistical model. IEEE Transactions on Automatic Control, 19(6), 716–723. [Google Scholar] [CrossRef]
  4. Akella, A. P., Alhoori, H., Kondamudi, P. R., Freeman, C., & Zhou, H. (2021). Early indicators of scientific impact: Predicting citations with altmetrics. Journal of Informetrics, 15(2), 101128. [Google Scholar] [CrossRef]
  5. Aksnes, D. W., Langfeldt, L., & Wouters, P. (2019). Citations, citation indicators, and research quality: An overview of basic concepts and theories. SAGE Open, 9(1), 2158244019829575. [Google Scholar] [CrossRef]
  6. Alpay, O., Danacioğlu, N., & Çankaya, E. (2022). Modelling of factors influencing the citation counts in statistics. Academic Platform Journal of Engineering and Smart Systems, 10(3), 157–167. [Google Scholar] [CrossRef]
  7. Alperin, J. P., Fleerackers, A., Riedlinger, M., & Haustein, S. (2024). Second-order citations in altmetrics: A case study analyzing the audiences of COVID-19 research in the news and on social media. Quantitative Science Studies, 5(2), 366–382. [Google Scholar] [CrossRef]
  8. Arbous, A. G., & Kerrich, J. E. (1951). Accident statistics and the concept of accident-proneness. Biometrics, 7(4), 340–432. [Google Scholar] [CrossRef]
  9. Baccini, A., Barabesi, L., Cioni, M., & Pisani, C. (2014). Crossing the hurdle: The determinants of individual scientific performance. Scientometrics, 101, 2035–2062. [Google Scholar] [CrossRef]
  10. Bornmann, L. (2013). What is societal impact of research and how can it be assessed? A literature survey. Journal of the American Society for Information Science and Technology, 64(2), 217–233. [Google Scholar] [CrossRef]
  11. Bornmann, L., & Haunschild, R. (2019). Societal impact measurement of research papers. In W. Glänzel, H. F. Moed, U. Schmoch, & M. Thelwall (Eds.), Springer handbook of science and technology indicators. Springer. [Google Scholar] [CrossRef]
  12. Bornmann, L., & Leydesdorff, L. (2015). Does quality and content matter for citedness? A comparison with para-textual factors and over time. Journal of Informetrics, 9(3), 419–429. [Google Scholar] [CrossRef]
  13. Bornmann, L., Schier, H., Marx, W., & Daniel, H.-D. (2012). What factors determine citation counts of publications in chemistry besides their quality? Journal of Informetrics, 6, 11–18. [Google Scholar] [CrossRef]
  14. Breslow, N. (1984). Extra-Poisson variation in log-linear models. Journal of the Royal Statistical Society. Series C (Applied Statistics), 33, 38–44. [Google Scholar] [CrossRef]
  15. Brillinger, D. R. (1986). The natural variability of vital rates and associated statistics (with Discussion). Biometrics, 42, 693–711. [Google Scholar] [CrossRef] [PubMed]
  16. Brooks, C. (2009). RATS handbook to accompany introductory econometrics for finance. Cambridge University Press. [Google Scholar]
  17. Cameron, A. C., & Trivedi, P. K. (1998). Regression analysis of count data. Econometric society monographs No. 30. Cambridge University Press. [Google Scholar]
  18. Campbell, M. J., Machin, D., & D’Arcangues, C. (1991). Coping with extra-Poisson variability in the analysis of factors influencing vaginal ring expulsions. Statistics in Medicine, 10, 241–251. [Google Scholar] [CrossRef]
  19. Chi, P. S., & Glänzel, W. (2017). An empirical investigation of the associations among usage, scientific collaboration and citation impact. Scientometrics, 112(1), 403–412. [Google Scholar] [CrossRef]
  20. Dean, C., Lawless, J. F., & Willmot, G. E. (1989). A mixed Poisson-inverse Gaussian regression model. The Canadian Journal of Statistics, 17(2), 171–181. [Google Scholar] [CrossRef]
  21. de Rijcke, S., Wouters, P. F., Rushforth, A. D., Franssen, T. P., & Hammarfelt, B. (2016). Evaluation practices and effects of indicator use—A literature review. Research Evaluation, 25(2), 161–169. [Google Scholar] [CrossRef]
  22. Didegah, F., & Thelwall, M. (2013). Which factors help authors produce the highest impact research? Collaboration, journal and document properties. Journal of Informetrics, 7(4), 861–873. [Google Scholar] [CrossRef]
  23. Dorta-González, P., & Dorta-González, M. I. (2023a). Citation differences across research funding and access modalities. The Journal of Academic Librarianship, 49(4), 102734. [Google Scholar] [CrossRef]
  24. Dorta-González, P., & Dorta-González, M. I. (2023b). The funding effect on citation and social attention: The UN Sustainable Development Goals (SDGs) as a case study. Online Information Review, 47(7), 1358–1376. [Google Scholar] [CrossRef]
  25. Dorta-González, P., & Gómez-Déniz, E. (2022). Modeling the obsolescence of research literature in disciplinary journals through the age of their cited references. Scientometrics, 127(6), 2901–2931. [Google Scholar] [CrossRef]
  26. Dorta-González, P., González-Betancor, S. M., & Dorta-González, M. I. (2017). Reconsidering the gold open access citation advantage postulate in a multidisciplinary context: An analysis of the subject categories in the Web of Science database 2009–2014. Scientometrics, 112, 877–901. [Google Scholar] [CrossRef]
  27. Dorta-González, P., Rodríguez-Caro, A., & Dorta-González, M. I. (2024). Societal and scientific impact of policy research: A large-scale empirical study of some explanatory factors using Altmetric and Overton. Journal of Informetrics, 18(3), 101530. [Google Scholar] [CrossRef]
  28. Elgendi, M. (2019). Characteristics of a highly cited article: A machine learning perspective. IEEE Access, 7, 87977–87986. [Google Scholar] [CrossRef]
  29. Engel, J. (1984). Models for response data showing extra-Poisson variation. Statistica Neerlandica, 38, 159–167. [Google Scholar] [CrossRef]
  30. Figg, W. D., Dunn, L., Liewehr, D. J., Steinberg, S. M., Thurman, P. W., Barrett, J. C., & Birkinshaw, J. (2006). Scientific collaboration results in higher citation rates of published articles. Pharmacotherapy, 26(6), 759–767. [Google Scholar] [CrossRef]
  31. Gómez-Déniz, E., & Calderín-Ojeda, E. (2018). Properties and applications of the Poisson-reciprocal inverse Gaussian distribution. Journal of Statistical Computation and Simulation, 88(2), 269–289. [Google Scholar] [CrossRef]
  32. Gómez-Déniz, E., & Dorta-González, P. (2024a). A field-and time-normalized Bayesian approach to measuring the impact of a publication. Scientometrics, 129, 2659–2676. [Google Scholar] [CrossRef]
  33. Gómez-Déniz, E., & Dorta-González, P. (2024b). Modeling citation concentration through a mixture of Leimkuhler curves. Journal of Informetrics, 18(2), 101519. [Google Scholar] [CrossRef]
  34. Haustein, S., Bowman, T. D., & Costas, R. (2016). Interpreting ‘altmetrics’: Viewing acts on social media through the lens of citation and social theories. In C. R. Sugimoto (Ed.), Theories of informetrics and scholarly communication (pp. 372–406). De Gruyter Saur. [Google Scholar] [CrossRef]
  35. Hilbe, J. (2011). Negative binomial regression (2nd ed.). Cambridge University Press. [Google Scholar]
  36. Hodas, N. O., & Lerman, K. (2014). The simple rules of social contagion. Scientific Reports, 4(1), 4343. [Google Scholar] [CrossRef]
  37. Hsu, J. W., & Huang, D. W. (2011). Correlation between impact and collaboration. Scientometrics, 86(2), 317–324. [Google Scholar] [CrossRef]
  38. Ibáñez, A., Bielza, C., & Larrañaga, P. (2013). Relationship among research collaboration, number of documents and number of citations: A case study in Spanish computer science production in 2000–2009. Scientometrics, 95(2), 689–716. [Google Scholar] [CrossRef]
  39. Joly, P.-B., Gaunand, A., Colinet, L., Larédo, P., Lemarié, S., & Matt, M. (2015). ASIRPA: A comprehensive theory-based approach to assessing the societal impacts of a research organization. Research Evaluation, 24(4), 440–453. [Google Scholar] [CrossRef]
  40. Karlis, D., & Xekalaki, E. (2005). Mixed Poisson distributions. International Statistical Review, 73, 35–58. [Google Scholar] [CrossRef]
  41. Khazragui, H., & Hudson, J. (2015). Measuring the benefits of university research: Impact and the REF in the UK. Research Evaluation, 24(1), 51–62. [Google Scholar] [CrossRef]
  42. Kousha, K., & Thelwall, M. (2024). Factors associating with or predicting more cited or higher quality journal articles: An Annual Review of Information Science and Technology (ARIST) paper. Journal of the Association for Information Science and Technology, 75(3), 215–244. [Google Scholar] [CrossRef]
  43. Kumari, R., Uddin, A., Lee, B. H., & Choi, K. (2020). Analyzing the factors influencing the waiting time to first citation and long-term impact of publications. Journal of Scientometric Research, 9(2), 127–135. [Google Scholar] [CrossRef]
  44. Langfeldt, L., Nedeva, M., Sörlin, S., & Thomas, D. A. (2020). Co-existing notions of research quality: A framework to study context-specific understandings of good research. Minerva, 58(1), 115–137. [Google Scholar] [CrossRef]
  45. Langham-Putrow, A., Bakker, C., & Riegelman, A. (2021). Is the open access citation advantage real? A systematic review of the citation of open access and subscription-based articles. PLoS ONE, 16(6), e0253129. [Google Scholar] [CrossRef]
  46. Larivière, V., Gingras, Y., Sugimoto, C. R., & Tsou, A. (2015). Team size matters: Collaboration and scientific impact since 1900. Journal of the Association for Information Science and Technology, 66(7), 1323–1332. [Google Scholar] [CrossRef]
  47. Lawless, J. F. (1987). Negative binomial and mixed Poisson regression. The Canadian Journal of Statistics, 15(3), 209–225. [Google Scholar] [CrossRef]
  48. Leimu, R., & Koricheva, J. (2005). What determines the citation frequency of ecological papers? Trends in Ecology & Evolution, 20(1), 28–32. [Google Scholar] [CrossRef]
  49. Mammola, S., Piano, E., Doretto, A., Caprio, E., & Chamberlain, D. (2022). Measuring the influence of non-scientific features on citations. Scientometrics, 127(7), 4123–4137. [Google Scholar] [CrossRef]
  50. Mullahy, J. (1986). Specification and testing of some modified count data models. Journal of Econometrics, 33, 341–365. [Google Scholar] [CrossRef]
  51. Pohlmeier, W., & Ulrich, V. (1995). An econometric model of the two-part decision making process in the demand for health care. The Journal of Human Resources, 30(2), 339–361. [Google Scholar] [CrossRef]
  52. Ravenscroft, J., Liakata, M., Clare, A., & Duma, D. (2017). Measuring scientific impact beyond academia: An assessment of existing impact metrics and proposed improvements. PLoS ONE, 12(3), e0173152. [Google Scholar] [CrossRef]
  53. Robinson-García, N., van Leeuwen, T. N., & Ràfols, I. (2018). Using altmetrics for contextualised mapping of societal impact: From hits to networks. Science and Public Policy, 45(6), 815–826. [Google Scholar] [CrossRef]
  54. Roldan-Valadez, E., & Rios, C. (2015). Alternative bibliometrics from impact factor improved the esteem of a journal in a 2-year-ahead annual-citation calculation: Multivariate analysis of gastroenterology and hepatology journals. European Journal of Gastroenterology & Hepatology, 27(2), 115–122. [Google Scholar] [CrossRef]
  55. Ronda-Pupo, G. A. (2017). The effect of document types and sizes on the scaling relationship between citations and co-authorship patterns in management journals. Scientometrics, 110(3), 1191–1207. [Google Scholar] [CrossRef]
  56. Rousseau, R. (1992). Why am I not cited or, why are multi-authored papers more cited than others? Journal of Documentation, 48(1), 79–80. [Google Scholar]
  57. Ruan, X., Zhu, Y., Li, J., & Cheng, Y. (2020). Predicting the citation counts of individual papers via a BP neural network. Journal of Informetrics, 14(3), 101039. [Google Scholar] [CrossRef]
  58. Ruskeepaa, H. (2009). Mathematica navigator. Mathematics, statistics, and graphics (3rd ed.). Academic Press. [Google Scholar]
  59. Shen, H., Xie, J., Li, J., & Cheng, Y. (2021). The correlation between scientific collaboration and citation count at the paper level: A meta-analysis. Scientometrics, 126(4), 3443–3470. [Google Scholar] [CrossRef]
  60. Sin, S. C. J. (2011). International coauthorship and citation impact: A bibliometric study of six LIS journals, 1980–2008. Journal of the American Society for Information Science and Technology, 62(9), 1770–1783. [Google Scholar] [CrossRef]
  61. Sjögårde, P., & Didegah, F. (2022). The association between topic growth and citation impact of research publications. Scientometrics, 127(4), 1903–1921. [Google Scholar] [CrossRef]
  62. Spaapen, J., & Van Drooge, L. (2011). Introducing ‘productive interactions’ in social impact assessment. Research Evaluation, 20(3), 211–218. [Google Scholar] [CrossRef]
  63. Thelwall, M., Kousha, K., Abdoli, M., Stuart, E., Makita, M., Font-Julián, C., Wilson, P., & Levitt, J. (2023). Is research funding always beneficial? A cross-disciplinary analysis of UK research 2014-20. Quantitative Science Studies, 4(2), 501–534. [Google Scholar] [CrossRef]
  64. Thelwall, M., & Maflahi, N. (2020). Academic collaboration rates and citation associations vary substantially between countries and fields. Journal of the Association for Information Science and Technology, 71(8), 968–978. [Google Scholar] [CrossRef]
  65. Urlings, M. J., Duyx, B., Swaen, G. M., Bouter, L. M., & Zeegers, M. P. (2021). Citation bias and other determinants of citation in biomedical research: Findings from six citation networks. Journal of Clinical Epidemiology, 132, 71–78. [Google Scholar] [CrossRef]
  66. Vieira, E. S., & Gomes, J. A. N. F. (2010). Citation to scientific articles: Its distribution and dependence on the article features. Journal of Informetrics, 4(1), 1–13. [Google Scholar] [CrossRef]
  67. Wagner, C. S., Whetsell, T. A., & Mukherjee, S. (2019). International research collaboration: Novelty, conventionality, and atypicality in knowledge recombination. Research Policy, 48(5), 1260–1270. [Google Scholar] [CrossRef]
  68. Willmot, G. (1987). The Poisson-inverse Gaussian distribution as an alternative to the negative binomial. Scandinavian Actuarial Journal, 3–4, 113–127. [Google Scholar] [CrossRef]
  69. Wilsdon, J., Allen, L., Belfiore, E., Campbell, P., Curry, S., Hill, S., Jones, R., Kain, R., Kerridge, S., Thelwall, M., Tinkler, J., Viney, I., Wouters, P., Hill, J., & Johnson, B. (2015). The metric Tide: Report of the independent review of the role of metrics in research assessment and management. Higher Education Funding Council for England (HEFCE). [Google Scholar] [CrossRef]
  70. Winkelmann, R. (2008). Econometric analysis of count data (5th ed.). Springer. [Google Scholar]
  71. Wouters, P., Zahedi, Z., & Costas, R. (2019). Social media metrics for new research evaluation. In W. Glänzel, H. F. Moed, U. Schmoch, & M. Thelwall (Eds.), Springer handbook of science and technology indicators. Springer. [Google Scholar] [CrossRef]
Figure 1. Empirical and fitted histogram of the number of citations obtained by the models based on the Poisson (P), Negative Binomial (NB), and Hurdle Negative Binomial (HNB) distributions.
Publications 13 00029 g001
Figure 2. Box-and-whisker chart (left panel), probability plot (center panel), and histogram (right panel) of the deviance residuals based on the NB regression model.
Publications 13 00029 g002
Figure 3. Scatter plot of the Pearson residuals against the predicted values: NB (left panel), HNB (center panel), and HNB of the restricted model (right panel) regression models.
Publications 13 00029 g003
Table 1. Description of factors possibly influencing the number of citations.
VariableDescription
Access typeClosed; Gold; Hybrid; Green; Bronze
Year of publicationTakes values from 2014 to 2021. Measures the age of the article
DisciplineAccounting and Finance; Applied Economics; Economic Theory;
Business; Commercial; Tourism; Statistics
Number of authorsTakes values from 1 to 47. Measures the collaboration
FundingTakes the value 0 if the paper has not been financed and 1 otherwise
Expert ratingTakes values 4 (top 7% of journals); 3 (next 25%); 2 (next 32%); 1 (bottom 36%).
Measures experts’ assessment of the journal
Foundation yearFirst year of indexing in the Scopus database. A proxy for the foundation year, measures
prestige by signaling history, credibility, and longevity
SJRThe Scimago Journal Rank measures the prestige of journals.
It takes into account both the quantity and quality of citations, with citations
weighted according to the influence of the citing journal
SJR best quartileTakes values from 1 (top) to 4 (bottom). Ranks journals into quartiles
according to their SJR scores
Cites per documentAverage number of citations per article in the journal over a three-year period
News mentionsTimes an article has been mentioned in news articles.
Measures the reach and influence beyond the academic sphere
Blog mentionsTimes an article has been referenced or discussed in blog posts.
Measures the impact on both academic and non-academic online discussions
Policy mentionsTimes an article is cited in policy documents.
Measures its importance in informing policy decisions and shaping public discourse
Patent mentionsFrequency with which an article is cited in patents. Measures the relevance and potential
application to innovation and technological advancement
X mentionsTimes an article was referenced, shared, or discussed on the leading social media
platform, X/Twitter. Measures visibility, impact, and engagement within the
X/Twitter community
FacebookTimes an article was mentioned or shared on Facebook.
Indicates its popularity and visibility on this widely used social media platform
WikipediaThe frequency with which an article is referenced on Wikipedia pages.
Measures its importance and impact in shaping knowledge and information on the web
Video mentionsThe times an article is referenced on YouTube, including
lectures, presentations, or online educational content.
Serves as a measure of its impact beyond traditional written media
MendeleyThe number of Mendeley users who have added the article to their library.
Measures the popularity and relevance of the article within the academic community
Table 2. Statistics of the variables.
VariableMeanMedianSDMinMaxRelative Frequency of 1 (Dichotomous Variables)
Variables associated with the article (access type and age)
Number of cites27.321161.0102672
OA green 0.30
OA bronze 0.03
OA gold 0.02
OA hybrid 0.10
Closed 0.55
Year of publication3.5532.4207
Variables associated with discipline and authors
Accounting and Finance 0.10
Applied Economics 0.44
Economic Theory 0.03
Business 0.25
Commercial 0.14
Tourism 0.02
Statistics 0.02
Number of authors2.5821.49147
Funding 0.21
Journal prestige and impact variables
Expert rating 1 0.10
Expert rating 2 0.30
Expert rating 3 0.43
Expert rating 4 0.17
Foundation year1981198522.0118522018
SJR1.801.032.12830.10320.643
SJR best quartile1.3410.5914
Cites per document4.473.383.510.062330.9186
Variables of influence and social impact
News mentions0.6304.890319
Blog mentions0.1800.82037
Policy mentions0.4402.113390104
Patent mentions2.5 × 10 3 00.09012
X mentions8.061108.72016,317
Facebook0.1500.75038
Wikipedia0.0700.51030
Video mentions4.6 × 10 3 00.14025
Mendeley68.8534131.3208668
Observations43,190
Table 3. Pearson’s correlations.
VariablesNumber of CitationsYear of PublicationNum of AuthorsFundingExpert RatingFoundation YearSJRSJR Best QuartileCites per DocumentNews MentionsBlog MentionsPolicy MentionsPatent MentionsX MentionsFacebookWikipediaVideo MentionsMendeley Readers
Number of citations1−0.140.060.000.18−0.010.26−0.150.290.210.300.450.190.050.080.180.030.84
Year of publication−0.1410.150.150.010.010.04−0.040.090.01−0.01−0.07−0.010.02−0.08−0.030.01−0.05
Num of authors0.060.1510.160.030.020.03−0.070.170.020.000.020.010.00−0.01−0.020.000.10
Funding0.000.150.1610.030.00−0.02−0.080.040.020.010.000.000.010.00−0.010.000.00
Expert rating0.180.010.030.031−0.190.54−0.440.410.060.090.090.020.010.050.020.030.16
Foundation year−0.010.010.020.00−0.191−0.040.05−0.03−0.03−0.040.030.00−0.01−0.01−0.01−0.010.00
SJR0.260.040.03−0.020.54−0.041−0.370.640.090.200.230.020.040.060.060.050.26
SJR best quartile−0.15−0.04−0.07−0.08−0.440.05−0.371−0.44−0.05−0.09−0.060.00−0.02−0.06−0.04−0.01−0.16
Cites per document0.290.090.170.040.41−0.030.64−0.4410.060.110.070.010.020.080.030.050.39
News mentions0.210.010.020.020.06−0.030.09−0.050.0610.460.230.160.140.100.190.120.17
Blog mentions0.30−0.010.000.010.09−0.040.20−0.090.110.4610.330.150.220.180.250.050.22
Policy mentions0.45−0.070.020.000.090.030.23−0.060.070.230.3310.070.050.060.140.010.29
Patent mentions0.19−0.010.010.000.020.000.020.000.010.160.150.0710.010.020.160.000.19
X mentions0.050.020.000.010.01−0.010.04−0.020.020.140.220.050.0110.240.270.010.05
Facebook0.08−0.08−0.010.000.05−0.010.06−0.060.080.100.180.060.020.2410.120.000.07
Wikipedia0.18−0.03−0.02−0.010.02−0.010.06−0.040.030.190.250.140.160.270.1210.010.16
Video mentions0.030.010.000.000.03−0.010.05−0.010.050.120.050.010.000.010.000.0110.03
Mendeley readers0.84−0.050.100.000.160.000.26−0.160.390.170.220.290.190.050.070.160.031
Table 4. Negative binomial regression results, including parameter estimates, standard errors, and confidence intervals.
CategoryVariableEstimateStd. Err.95% CI Lower95% CI Upper
OA green0.12990.0096 ***0.11090.1489
Access type and ageOA bronze0.05740.0248 **0.00870.1061
OA gold0.05850.0306 *−0.00150.1186
OA hybrid0.07490.0150 ***0.04540.1043
Year of publication−0.13910.0019 ***−0.1428−0.1353
Accounting and Finance0.35440.0816 ***0.19450.5143
Applied Economics0.31330.0806 ***0.15520.4712
Economic Theory0.30750.0846 ***0.14170.4733
Discipline and authorsBusiness0.22270.0810 **0.06400.3814
Commercial0.24900.0812 **0.08980.4080
Tourism0.25000.0859 **0.08150.4184
Number of authors0.04520.0032 ***−0.3490−0.2672
Funding0.09350.0107 ***−0.2573−0.1903
Expert rating 1−0.30810.0209 ***−0.1557−0.0966
Expert rating 2−0.22380.0171 ***0.03880.0515
Prestige and impactExpert rating 3−0.12620.0151 ***0.07260.1145
log(Foundation year)0.10970.3920−0.65850.8780
SJR0.00620.0034 *−0.00040.0128
SJR best quartile−0.26070.0088 ***−0.2780−0.2433
Cites per document0.02600.0020 ***0.02200.0299
News mentions0.00450.0011 ***0.00220.0067
Blog mentions0.05750.0069 ***0.04390.0709
Policy mentions0.06660.0033 ***0.06000.0730
Influence and social impactPatent mentions−0.12670.0667 *−0.25740.0039
X mentions0.00026.7 × 10 5 **5.4 × 10 5 0.0003
Facebook−0.01340.0058 **−0.0249−0.0019
Wikipedia0.02370.0087 **0.00670.0407
Video mentions−0.03950.0257−0.08980.0108
Mendeley0.00726.9 × 10 5 ***0.00700.0073
constant1.82082.9721−4.00467.64623
Index of dispersion, r ^ 0.68330.0051 ***0.67320.6933
AIC327,922
Observations43,190
*** indicates 1% significance level, ** indicates 5% significance level, * indicates 10% significance level.
Table 5. Marginal effect or Incidence Rate Ratio (IRR) for categorical variables.
VariableIRRStd. Err.CI LowerCI Upper
Variables associated with the article (access type and age)
OA green1.13870.0101.11721.1605
OA bronze1.05910.0261.00871.1119
OA gold1.06020.0320.99851.1259
OA hybrid1.07880.0161.04641.1099
Variables associated with discipline and authors
Accounting and Finance1.42530.11631.21471.6724
Applied Economics1.36790.11021.16781.6019
Economic Theory1.36000.11501.15221.6052
Business1.24940.10121.06601.4643
Commercial1.28270.10411.09391.5038
Tourism1.28400.11021.08491.5195
Journal prestige and impact variables
Expert rating 10.73480.01530.85580.9079
Expert rating 20.79950.01361.03951.0528
Expert rating 30.88140.01331.07531.1213
Table 6. Parameter estimates from the hurdle negative binomial regression model and standard errors.
Positives (NB Part)Zeros (Hurled Part)
CategoryVariableEstimateStd. Err.EstimateStd. Err.
OA green0.12320.0096 ***−0.28400.0624 ***
Access typeOA bronze0.13190.0258 ***0.72480.1003 ***
and ageOA gold−0.00420.03060.07440.1534
OA hybrid0.05890.0150 ***−0.12560.0951
Year of publication−0.13670.0019 ***0.13450.0107 ***
Accounting and Finance−0.12130.09790.20950.3461
Applied Economics−0.16000.0971 *−0.03440.3396
Economic Theory−0.11970.1006−0.21910.3588
DisciplineBusiness−0.26630.0974 **0.22870.3447
and authorsCommercial−0.19030.0976 *0.50280.3431
Tourism−0.20000.1016 **−0.37450.4417
Number of authors0.04050.0031 ***−0.12350.0209 ***
Funding0.07820.0106 ***−0.39270.0693 ***
Expert rating 1−0.26340.0209 ***0.42170.1440 **
Expert rating 2−0.21880.0169 ***0.20460.1321
PrestigeExpert rating 3−0.12570.0148 ***−0.02930.1251
and impactlog(Foundation year)0.62180.3931−0.09072.1396
SJR0.00580.0033 *0.00440.0364
SJR best quartile−0.24640.0091 ***0.18010.0384 ***
Cites per document0.02690.0019 ***0.04930.0177 **
News mentions0.00400.0010 ***−0.15120.0451 ***
Blog mentions0.05720.0067 ***−0.05030.0863
Policy mentions0.06400.0031 ***−0.95680.1251 ***
Influence andPatent mentions−0.11400.0654 *−14.4061388.5
social impactX mentions0.00016.1 × 10 5 **−0.02700.0045 ***
Facebook−0.01510.0057 **−0.00560.0505
Wikipedia0.02730.0086 **−0.00850.0798
Video mentions−0.04750.0234 **0.58890.4109
Mendeley0.00686.6 × 10 5 ***−0.11750.0031 ***
constant−1.57142.9816−0.609216.2303
Index of dispersion, r ^ 0.64250.0057 ***
AIC324,468
Observations43,190
*** indicates 1% significance level, ** indicates 5% significance level, * indicates 10% significance level.
Table 7. Parameter estimates from the hurdle negative binomial regression model and standard errors for the restricted model.
Positives (NB Part)Zeros (Hurled Part)
CategoryVariableEstimateStd. Err.EstimateStd. Err.
OA green0.12330.0096 ***−0.31440.0609 ***
Access typeOA bronze0.13290.0257 ***0.83890.0973 ***
and ageOA hybrid0.05930.0149 ***
Year of publication−0.13670.0019 ***0.13180.0104 ***
Applied Economics−0.04320.0139 **
DisciplineBusiness−0.14990.0154 ***
and authorsCommercial−0.07540.0169 ***
Tourism−0.08040.0324 **
Number of authors0.04060.0031 ***−0.11250.0206 ***
Funding0.07860.0106 ***−0.41250.0683 ***
Expert rating 1−0.25770.0205 ***0.34170.0676 ***
Expert rating 2−0.21430.0166 ***
PrestigeExpert rating 3−0.12420.0147 ***
and impactSJR0.00590.0033 *
SJR best quartile−0.24720.0091 ***0.20790.0356 ***
Cites per document0.02690.0019 ***0.05440.0132 ***
News mentions0.00400.0010 ***−0.14720.0448 **
Blog mentions0.05670.0067 ***
Policy mentions0.06420.0032 ***−0.98660.1250 ***
Influence andPatent mentions−0.11200.0655 *
social impactX mentions0.00016.1 × 10 5 **−0.02550.0043 ***
Facebook−0.01510.0057 **
Wikipedia0.02730.0086 **
Video mentions−0.04730.0234 **
Mendeley0.00686.6 × 10 5 ***−0.11630.0031 ***
constant3.03020.0249 ***−0.609216.2303
Index of dispersion, r ^ 0.64250.0057 ***
AIC324,539
Observations43,190
*** indicates 1% significance level, ** indicates 5% significance level, * indicates 10% significance level.
Disclaimer/Publisher’s Note: The statements, opinions and data contained in all publications are solely those of the individual author(s) and contributor(s) and not of MDPI and/or the editor(s). MDPI and/or the editor(s) disclaim responsibility for any injury to people or property resulting from any ideas, methods, instructions or products referred to in the content.

