Abstract
The objective of this study is to examine the relationship between publisher volume—the number of journals a publisher produces—and journal publishing patterns in Scopus, including various journal metrics such as the h-index, SCImago Journal Rank (SJR), and journal quartiles. The SCImago database, which is derived from Scopus data, serves as a proxy for journal impact and influence. The analysis also considered factors such as Open Access (OA) status, geographical location, and subject areas. Using the 2023 SJR dataset, publishers were classified into four categories: V1 (single journal), V2 (2–9 journals), V3 (10–99 journals), and V4 (100+ journals). The findings showed that V4 publishers accounted for 44.5% of Scopus-indexed journals despite comprising only 0.3% of all publishers, whereas V1 publishers represented 78.6% of all publishers but contributed only 21.3% of journals. High-volume publishers had more journals ranked in Q1 and Q2, while lower-volume publishers were more concentrated in Q3 and Q4. Results from the linear mixed-effects model indicated that publisher volume was associated with journal metrics, with higher-volume publishers generally achieving higher h-index and SJR scores. Western Europe and North America had the highest number of V4 publishers, whereas China, Spain, and Italy exhibited strong journal production but had fewer publishers in the highest-volume category. These results illustrate the dominance of a small group of high-volume (V4) publishers and the challenges smaller publishers face in gaining visibility and impact. They also underscore the need to consider policies that foster a more balanced and equitable scholarly publishing environment, particularly for underrepresented regions and subject areas.
1. Introduction
In the current academic publishing landscape, there is a notable variation in the number of journals produced by different publishers. This study examines “journal publishing patterns”, which refers to the systematic distribution of journals across different publisher volume categories and how these distributions relate to various metrics, geographic regions, subject areas, and publishing models. By analyzing these patterns, we can better understand how publisher scale influences journal visibility, impact metrics, and representation within the scholarly ecosystem.
Publisher volume, defined as the number of journals a publisher produces (e.g., in Walters, 2022), serves as a key variable in this analysis. While the “size” of a publisher is a common term to refer to the scale of a publisher’s operations, this study uses “volume” instead because “size” can be ambiguous, often referring to economic scale, which is difficult to measure accurately. By examining the relationship between publisher volume and journal metrics, we gain insight into broader trends in scholarly publishing, including how large publishers shape journal visibility and quality control, the role of publisher volume in open access (OA) models, and the relationship between publishing scale and journal impact.
Understanding publisher volume’s relationship with journal metrics helps contextualize scholarly publishing trends. First, analyzing how large publishers shape journal visibility and quality control provides insight into the power dynamics of academic publishing. Second, as OA continues to expand, examining publisher volume’s role in accessibility and transparency offers a deeper look into the evolving journal ecosystem. Finally, assessing how publisher volume relates to journal impact metrics sheds light on the extent to which a publisher’s scale influences scholarly influence and reputation.
Journal metrics, such as the h-index, citations, and rankings, are widely used as indicators of a journal’s impact and quality (K. Kim & Chung, 2018). However, these metrics are not without their limitations. Citation-based indicators do not directly measure research quality but rather reflect factors such as journal visibility, citation conventions, and disciplinary norms (Biagioli et al., 2019). Metrics like the h-index, for instance, tend to favor disciplines with higher citation activity, making cross-field comparisons problematic. Furthermore, journal rankings can reinforce publishing hierarchies as they are influenced by accumulated prestige and network effects rather than intrinsic scholarly value. Despite these concerns, journal metrics remain essential tools for assessing research influence, guiding publication decisions, and shaping institutional evaluations. Understanding how these metrics relate to publisher volume provides insights into broader trends in scholarly publishing and the role of publishing scale in shaping research dissemination.
Given these complexities, databases such as Scopus play a key role in structuring how journal metrics are applied in scholarly evaluations. Scopus serves as a major bibliometric database with extensive coverage across scientific disciplines, utilized by researchers worldwide to access scholarly publications. The SCImago Journal Rank (SJR) portal, operated by an independent research group that builds on Scopus data, enhances this functionality by providing an annual compilation of Scopus-indexed journals (SCImago, n.d.), complete with rankings and advanced journal metrics beyond standard Scopus listings (e.g., h-index). Such an analysis of journals within the SCImago database enables an examination of the complex relationships between publisher volume, journal metrics, and associated characteristics. Insights into these relationships, particularly within the OA publishing landscape, inform strategic decisions about manuscript submission, journal selection, and research assessment. Furthermore, exploring the disparities between low-volume and high-volume publishers across journal metrics, quartile rankings, subject area representation, and regional distribution reveals opportunities to foster a more equitable and inclusive scholarly publishing ecosystem.
The objective of this study is to elucidate the influence of publisher volume on journal performance and characteristics within scholarly publishing. It examines the relationship between publisher volume and journal metrics, including h-index, citations, and rankings, and explores variations across subject areas and OA status. Through rigorous statistical analysis and subgroup comparisons, this study provides empirical evidence on how publisher volume shapes journal performance metrics and characteristics, contributing to a deeper understanding of contemporary scholarly publishing dynamics.
The research questions that guided this research are the following:
- How is publisher volume related to the production of Scopus-indexed journals?
- To what extent is publisher volume associated with journal metrics and rankings?
- How does publisher volume relate to journal metrics across different subject areas?
- What is the relationship between publisher volume and the prevalence of OA versus non-OA publishing models in scholarly publishing?
2. Literature Review
This literature review examines research on publisher volume in scholarly communication, focusing on four key areas: empirical studies on publisher volume, the role of OA publishing, regional disparities in scholarly publishing, and theoretical frameworks explaining publisher dynamics. Although relatively few studies have explicitly analyzed publisher volume as a primary variable, related research offers meaningful perspectives on how publishing scale influences journal metrics, market concentration, and the broader scholarly ecosystem.
It is important to clarify several interrelated concepts used in the literature to describe the scale and impact of academic publishers. Publisher size typically refers to a publisher’s market share or economic scale, often measured by revenue, acquisitions, or the number of journals it owns (Gadd et al., 2018; Walters, 2022). Publisher influence is broader, reflecting a publisher’s role in shaping academic discourse, editorial policies, and research visibility (Larivière et al., 2015). This study focuses on publisher volume, defined as the number of journals a publisher produces (Walters, 2022). Unlike size or influence, publisher volume is a clear, quantifiable metric that avoids the ambiguities of financial data or subjective impact assessments. While size and influence often correlate with volume, they are not synonymous—some publishers exert significant influence despite a small journal portfolio, while others publish extensively without a corresponding academic impact (S. J. Kim & Park, 2022). By examining publisher volume, this study provides a data-driven perspective on how journal output relates to scholarly metrics and publishing patterns.
A few empirical studies have specifically examined publisher volume, measured in terms of published journal articles, and its impact on scholarly communication. E. Kim and Atteraya (2024) analyzed changes in indexed journals within the SCImago database, showing how high-volume publishers secure greater representation in Scopus, reinforcing their visibility and influence. E. Kim (2024a) further explored AI use policies, revealing how automation and editorial practices differ between large commercial publishers and smaller independent journals. Csomós and Farkas (2023) examined MDPI’s growing market share, particularly in Central and Eastern Europe, showing how large OA publishers expand their influence by increasing publication volume in specific regions. These findings illustrate how publisher volume shapes both journal visibility and global publishing dynamics. Notably, the expansion of large OA publishers, such as MDPI, demonstrates how high-output models influence both regional publishing patterns and the broader OA landscape. This is particularly evident in the OA sector, where commercial OA publishers and smaller independent journals follow distinct publishing models.
OA publishing is shaped by publisher volume, as both large commercial OA publishers and smaller independent journals contribute to the evolving academic landscape. Frantsvåg (2010) analyzed the size distribution of OA publishers, finding that a small number of high-output OA publishers, such as MDPI and Frontiers, dominate journal output, while many smaller OA journals struggle with visibility. Romero (2023) found that despite comprising only about 5% of total publications in Web of Science and Scopus, small OA journals contribute significantly to academic discourse through highly cited articles. Piwowar et al. (2018) observed that large OA publishers account for a disproportionate share of OA article output, reinforcing the connection between publisher scale and journal influence. Gadd et al. (2018) further noted that larger publishers tend to control OA policies, often imposing restrictions on self-archiving, which impacts accessibility across publishing models. These findings illustrate how publisher volume plays a critical role in shaping OA publishing dynamics, with large-scale OA publishers expanding their influence through high output and broad indexation in major bibliographic databases, which, in turn, enhances accessibility and visibility.
Beyond these patterns, previous studies reveal regional disparities in scholarly publishing. In Australia, most journals are affiliated with non-profits and universities (Jamali et al., 2022). Africa remains underrepresented in major databases, with South African journals faring better (Asubiaro & Onaolapo, 2023; Kanyika & Kim, 2025). In East Asia, top global publishers and regional players like Science Press and Techno-Press shape the landscape (E. Kim & Jeong, 2023). Teixeira da Silva et al. (2022) examined predatory publishing as a global issue, showing how commercial publisher dominance and weak regulations enable exploitative practices. Thi et al. (2021) analyzed Vietnam’s policies to strengthen its presence in international publishing amid structural challenges. Meanwhile, Laakso and Multas (2023) found that small and mid-sized publishers are essential to Europe’s publishing system. These findings underscore the diverse global publishing landscape and the need for tailored strategies to address regional disparities.
To explain these observations, several theoretical perspectives help explain the relationship between publisher volume and journal performance in the scholarly ecosystem. The oligopoly theory explains the dominance of power among major publishers (Larivière et al., 2015), whereas the evolution of digital publishing enables large publishers to expand rapidly, reshaping the academic landscape (Hyland, 2021). Larger publishers leverage economies of scale, potentially creating new barriers and perpetuating inequalities in scholarly communication (Tennant et al., 2019). This dynamic mirrors the coexistence of traditional producers and digital entrants in platform-based ecosystems (Cozzolino et al., 2021). Tötösy de Zepetnek and Jia (2014) described the oligopolistic nature of academic journal publishing and the ‘prestige multiplier effect’, where high-impact journals published by major publishers attract more submissions, accumulate more citations, and reinforce their ranking dominance, making it increasingly difficult for smaller publishers to compete. This dynamic remains relevant despite the rise of electronic journals, as large publishers continue to leverage reputation and impact metrics to maintain their influence.
The above-mentioned studies enhance the understanding of the publishing landscape, yet key questions remain about how publisher volume interacts with various journal attributes. Existing research has examined journal metrics, OA policies, and regional disparities, but a systematic analysis of how publisher volume relates to journal characteristics—including metrics, subject areas, and publishing models—remains limited. This study addresses this gap by analyzing the extent to which publisher volume is associated with journal metrics and other attributes in Scopus-indexed journals, providing a more comprehensive view of its role in scholarly publishing.
3. Methods
3.1. Data Collection
This study employed a cross-sectional quantitative approach to analyze scholarly journals indexed in Scopus for 2023, using the SJR portal as a proxy (SCImago, n.d.). A cross-sectional design was chosen to capture a snapshot of publisher volume and journal metrics at a specific point in time, allowing for an assessment of publishing patterns without tracking longitudinal changes. The SJR portal was selected for its public accessibility and comprehensive dataset, which includes journal rankings, h-index values, citation impact indicators, and quartile rankings, offering a more detailed representation of publisher activity and journal characteristics than the standard Scopus list. Publisher performance was assessed using multiple metrics, including h-index, two-year citation counts per document (CITES2YR), total documents published in 2023 (TDYEAR), SJR metric, quartile rankings, and open-access (OA) status. Scopus categorizes OA journals as either Gold OA or Subsidized OA based on their registration in DOAJ or ROAD, without further differentiation between funding models (Elsevier, 2015). This means that Gold OA journals may either be funded through subsidies or charge article processing charges (APCs); however, Scopus does not classify them separately based on these funding mechanisms. Data collection took place in the last week of January 2025 to ensure the most recent and complete dataset for analysis.
All journal metrics, including h-index, SJR, and citation-based indicators, were obtained directly from the SCImago database (SCImago, n.d.). The h-index quantifies journal productivity and impact by identifying the maximum number of articles (h) that have received at least h citations. The SJR metric accounts for both citation counts and the prestige of citing journals, offering a weighted measure of journal influence. CITES2YR captures short-term citation impact, while quartile rankings categorize journals within their subject areas based on SJR scores. These metrics collectively provide a comprehensive view of journal performance, allowing for a multidimensional analysis of publisher volume and its relationship to scholarly impact.
3.2. Publisher Volume Categorization
To analyze the relationship between publishing output and journal characteristics, publishers were classified into four categories based on the number of journals they published:
- V1: Publishers with only one journal.
- V2: Publishers with 2 to 9 journals.
- V3: Publishers with 10 to 99 journals.
- V4: Publishers with 100 or more journals.
This classification was designed to ensure a reasonable distribution of journals across categories, allowing for meaningful comparisons of publisher volume effects. Prior studies, such as that by Frantsvåg (2010), have examined the concentration of publishing activity, showing that a small number of large publishers dominate journal output. This categorization provides a practical framework for assessing publisher volume in relation to journal rankings, subject-area distributions, and impact metrics, leveraging journal-level data, which is more readily available than article-level data.
3.3. Data Processing and Normalization
All data processing and analysis were conducted using R. A small number of missing values were not imputed; instead, only complete records were used in the analysis to ensure that the results reflect reliable and available information. The SCImago dataset, containing both OA and non-OA journals, was imported, and column names were standardized for consistency. To isolate non-OA journals, an anti-join operation was performed, removing OA journals from the full dataset. The SJR metric, which accounts for both citation counts and the prestige of citing journals, was retained as a key indicator of journal impact.
A key part of the data processing involved normalizing publisher names to address variations in naming conventions across different sources. Since imprints often maintain separate branding and editorial policies, they were not merged under their parent publishers. These normalization procedures were critical for preventing duplicate entries and ensuring accurate publisher representation. The following standardization rules were applied:
- Removal of Business Suffixes: Common legal designations such as Ltd., Inc., GmbH, LLC, and S.A. were removed.
- Cleanup of Hyphens and Commas: Any text following hyphens (e.g., regional divisions) or commas (e.g., subsidiary information) was omitted.
- Standardization of Major Publishers: Variants of the same publisher name were unified. For instance, “Springer-Verlag” was replaced with “Springer”, and “John Wiley & Sons” was standardized as “Wiley”.
- Normalization of University Names: University-affiliated publishers were normalized by retaining the core university name. This process involved removing publishing-related suffixes and campus-specific qualifiers. For instance, ‘Warsaw University of Life Sciences Press’ was converted to ‘Warsaw University’, and ‘University of California—Berkeley Press’ was simplified to ‘University of California’.
- Removal of Redundant Elements: Unnecessary spacing and non-essential text were eliminated to enhance data consistency.
Journals in the SCImago database are assigned multiple subject areas based on Scopus classifications. For subject-level analysis, a whole counting method was used instead of fractional counting (Perianes-Rodriguez et al., 2016), as it provides a more straightforward representation of journal distributions across disciplines. Subject areas were separated into distinct rows, and datasets for OA and non-OA journals were merged to facilitate comparative analysis.
3.4. Statistical Analysis
Descriptive statistics were used to summarize journal distributions across publisher volume categories and OA types. Correlation analysis was conducted to assess relationships between publisher volume and journal impact metrics. The normality of journal metrics was assessed using the Shapiro–Wilk test, which indicated significant deviations from normality (p < 0.001), justifying the use of non-parametric methods. Fisher’s exact test was employed to analyze associations between categorical variables (e.g., publisher volume and journal type), as it provides more accurate results for small sample sizes compared to the chi-square test.
For comparisons across publisher volume categories, the Kruskal–Wallis test was applied, followed by Dunn’s post-hoc test (Dinno, 2015) to identify specific differences between groups. A linear mixed-effects model was used to analyze the relationship between publisher volume, OA status, and journal metrics, accounting for subject-area variability. The model was implemented using the lme4 package in R, following the methodology outlined by Brown (2021). Where necessary, logarithmic transformations were applied to address non-normality, ensuring that both continuous and categorical variables were appropriately analyzed.
Publisher volume was grouped into four discrete categories (V1 to V4) instead of being treated as a continuous variable to allow for a clearer comparison of trends across different scales of publishing activity. Given the highly skewed distribution of publisher volumes, with a small number of publishers managing a disproportionately large number of journals, treating publisher volume as a continuous variable would not have adequately captured the distinct characteristics of small, mid-sized, and large publishers. Categorization provided meaningful statistical comparisons across publisher groups and helped mitigate the effects of extreme values.
4. Results
4.1. Distribution of Journals by Publisher Volume
In this study, publishers are grouped into four categories based on the number of journals they publish, illustrating substantial disparities in journal output (Table 1). V1 publishers, each with a single journal, make up 78.6% of all publishers (5916 in total) but contribute only 21.3% of the total journals. In contrast, V4 publishers, which publish 100 or more journals, represent just 0.3% of publishers (25 in total) but account for 44.5% of all Scopus-indexed journals (12,363 journals). This distribution demonstrates the concentration of journal production among a small number of high-volume (V4) publishers. V2 publishers, with two to nine journals, comprise 18.4% of publishers (1386 in total) and contribute 15.8% of the total journals. Similarly, V3 publishers, which publish 10 to 99 journals, account for 2.6% of publishers (195 in total) and produce 18.5% of all indexed journals. The average number of journals per publisher increases sharply across categories, from 1.0 in V1 to 494.5 in V4. As shown in Table 1, these aggregated figures show how large publishers, though few in number, dominate journal production.

Table 1.
Publisher volume and their journal production.
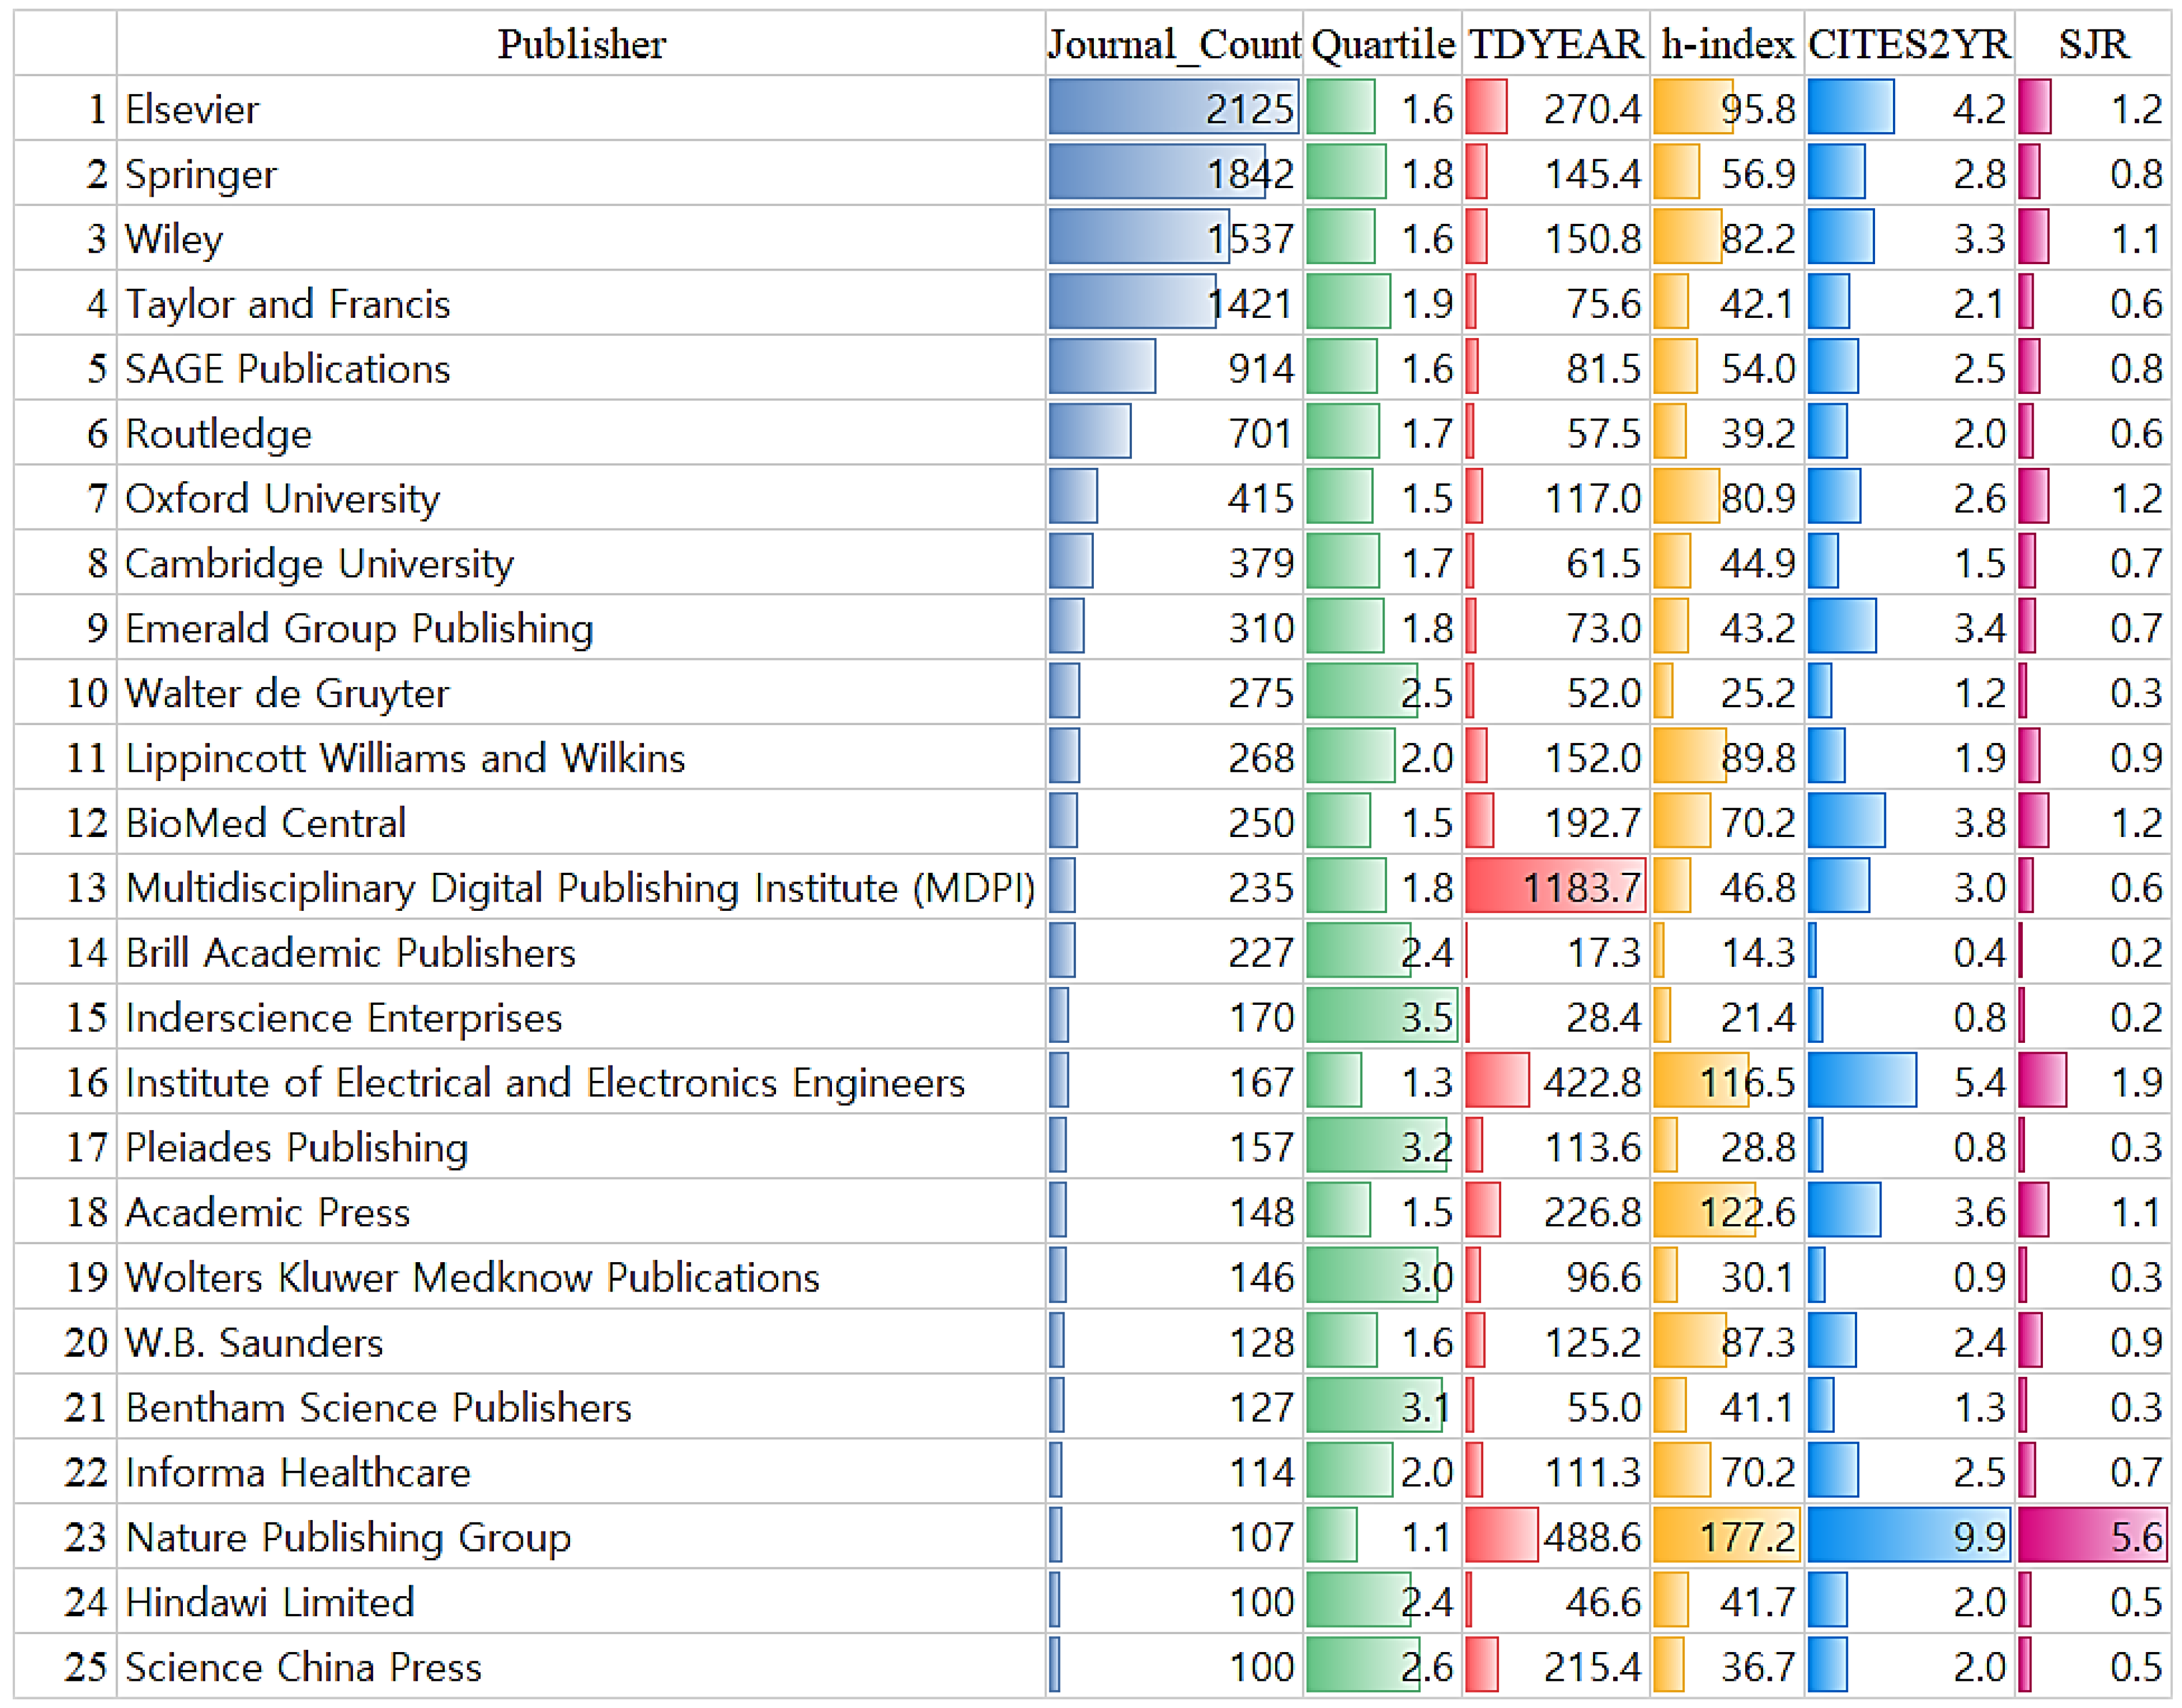
Figure 1 presents details of publishers in volume V4—those that publish 100 or more Scopus-indexed journals, with 25 publishers identified and all metrics except journal count shown as mean values. The “Big 5” publishers dominate this category: Elsevier (2125 journals), Springer (1842 journals), Wiley (1537 journals), Taylor & Francis (1421 journals), and SAGE Publications (914 journals). Notable publishers like Frontiers Media, ranked 28th with 96 journals, are not included in this figure as they fall into the V3 category (10–99 journals), just below the threshold for inclusion in the visualization that focuses exclusively on the largest publishers by volume.

Figure 1.
V4 Publishers and their journal metrics. Note: TDYEAR represents the total number of documents published in a given year, i.e., 2023. CITES2YR represents the mean number of citations per document received over a two-year period.
The figure includes mean metrics such as h-index, CITES2YR, and SJR, which indicate impact and prestige. Nature Publishing Group has the highest mean h-index (177.2) and SJR (5.6), suggesting strong citations and influence. Regarding TDYEAR, Brill Academic Publishers has the lowest mean h-index (14.3), suggesting that although they publish a large number of journals, their citations relative to published documents remain relatively low. The mean journal quartile ranges from 1.1 (Nature Publishing Group) to 2.8 (Wolters Kluwer Medknow Publications and Science China Press). On average, the journal quartile hovers around 2.0, indicating that these journals generally rank in the middle of their respective fields. Overall, these results reveal a highly concentrated publishing landscape where a small number of publishers disproportionately control scholarly communication, with significant variations in quality, impact, and journal performance.
4.2. Journal Metrics by Publisher Volume
Table 2 presents journal metrics across different publisher volume categories. As publisher volume increases from V1 to V4, there is a notable rise in the average total documents published per year (TDYEAR), increasing from 57.1 for V1 to 182.4 for V4. This trend suggests that larger publishers tend to manage journals with longer establishment periods and greater output. Similarly, the h-index metric follows a consistent upward path, rising from 19.6 for V1 to 62.4 for V4, indicating that journals affiliated with high-volume (V4) publishers tend to have greater academic influence.
Table 2.
Journal metrics by publisher volume category.
The CITES2YR and SJR metrics also increase with publisher volume, reflecting higher citation rates and journal rankings. The CITES2YR value rises from 0.8 for V1 to 2.7 for V4, while the SJR metric increases from 0.3 to 0.9. A strong relationship is observed between quartile rankings and publisher volume, where journals from larger publishers tend to be positioned in higher quartiles (Q1 and Q2). The average quartile ranking improves from 3.0 for V1 (mostly lower-ranked journals) to 2.0 for V4 (more highly ranked journals). A Kruskal–Wallis test confirmed statistically significant differences in TDYEAR, h-index, CITES2YR, and SJR across the four publisher volume categories (V1 to V4), with all p-values below 0.0001. These results indicate a strong association between publisher volume and journal performance. However, while larger publishers tend to have journals with higher impact metrics, this study does not establish a causal relationship between publisher volume and journal performance, warranting further investigation.
4.3. Correlation Between Publisher Volume and Journal Metrics
The correlation analysis (Figure 2) examines the relationship between publisher volume (Journal_Count) and journal impact metrics. Journal_Count exhibits weak positive correlations with h-index (0.24) and CITES2YR (0.11), indicating that while larger publishers tend to manage more journals, their direct influence on citation-based metrics is limited. TDYEAR (0.09) also has a weak correlation with publisher volume, suggesting that the number of journals a publisher produces is associated with variations in publication output rather than citation impact. Publisher volume has a moderate negative correlation with quartile (−0.37), meaning publishers with more journals tend to have a higher proportion of journals in top quartiles. Stronger correlations appear among citation-based metrics, with h-index and CITES2YR (0.86) and SJR (0.80) showing strong associations, reinforcing the interdependence of citation indicators. Quartile rankings also show negative correlations with h-index (−0.73), CITES2YR (−0.70), SJR (−0.58), and TDYEAR (−0.41), confirming that journals with higher impact metrics tend to be ranked in higher quartiles. These correlations highlight the interconnectedness of citation-based measures but provide a limited perspective on the broader factors influencing journal rankings. The weak association between citation-based metrics and publisher volume suggests that journal impact is shaped by additional structural factors beyond the scale of journal production. Further analyses, including categorical tests and mixed-effects modeling, offer a more comprehensive evaluation of the determinants of journal performance.
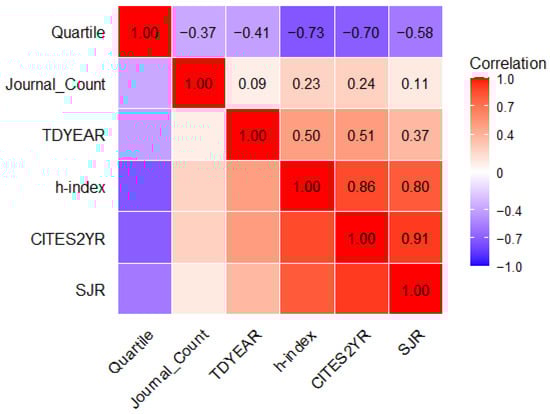
Figure 2.
Correlation analysis of publisher volume and journal metrics. Note. TDYEAR represents the total number of documents published in a given year (e.g., 2023). CITES2YR represents the mean number of citations per document received over a two-year period.
4.4. Publisher Volume Across Regions and Countries
The distribution of publishers across volume categories varies significantly by region, as shown in Table 3. Western Europe and Northern America have the strongest presence, particularly in higher volume categories (V3 and V4). Western Europe hosts 1475 V1 publishers (24.9%), 415 V2 publishers (29.9%), 63 V3 publishers (32.3%), and 15 V4 publishers (60%). Similarly, Northern America accounts for 930 V1 publishers (15.7%), 243 V2 publishers (17.5%), 65 V3 publishers (33.3%), and 6 V4 publishers (24%). Together, these two regions dominate high-volume publishing, accounting for 21 of the 25 V4 publishers globally.
Table 3.
Distribution of publishers across regions by volume category.
In contrast, Africa, Latin America, and the Pacific Region have no publishers in V4, with limited representation in V3. Africa has one V3 publisher, while Latin America has 11 (5.6%), and the Pacific Region has four (2.1%). The Asiatic Region, despite its strong presence in V1 (1395, 23.6%) and V2 (236, 17%), has 17 publishers in V3 (8.7%) and only 2 in V4 (8%). Eastern Europe also has a substantial presence in V1 (1054, 17.8%) and V2 (272, 19.6%) but lacks any V4 publishers. The Middle East has one V4 publisher (4%), while the Africa/Middle East category also has one (4%). These patterns show strong regional disparities in publisher volume, with V3 and V4 publishers primarily concentrated in regions with established publishing infrastructure, funding, and institutional support.
Table 4 presents the distribution of publishers across volume categories within the top 20 publishing countries. The United States leads with the highest number of publishers (1098, 14.6%), spanning all categories: 822 in low-volume V1 (13.9%), 209 in V2 (15.1%), 61 in V3 (31.3%), and 6 in high-volume V4 (24%). This reflects the U.S.’s strong presence across publishing scales. The United Kingdom stands out for its high concentration of publishers in high-volume V4, accounting for 10 (40% of all in this category), despite having fewer total publishers (341, 4.5%), indicating the dominance of major publishing houses. China, the second-ranked country with 411 publishers (5.5%), has only one in high-volume V4, with most in low-volume V1 (335, 5.7%). Spain, third with 378 publishers (5%), also has just one in high-volume V4, while Germany and India follow the same pattern. The Russian Federation (314 publishers), Japan (300), and South Korea (279) have no publishers in high-volume V4, with their publishing activity concentrated in low-volume categories. The U.S. and the U.K. alone account for 16 of the 25 in high-volume V4, reinforcing the concentration of large-scale publishing within a few countries. These leading publishing nations are primarily in Northern America, Western Europe, and the Asiatic Region, while Eastern Europe, Latin America, and the Pacific have fewer publishers in the higher-volume categories.
Table 4.
Distribution of publishers by volume category across the top 20 countries.
4.5. Publisher Volume Across Subject Areas
Table 5 presents the aggregated number of Scopus-indexed journals across subject areas and publisher volume categories (V1 to V4). Social Sciences has the highest number of journals (7837), followed closely by Medicine (7296). Neuroscience has the highest percentage of high-volume (V4) publishers (61.5%) but the lowest V1 representation (9.8%). Agricultural and Biological Sciences shows a relatively balanced distribution between low-volume (V1) and high-volume (V4) publishers (both 30.7%). Arts and Humanities also exhibits a more even spread across categories, with V1 at 26.1% and V4 at 29.7%. Multidisciplinary fields have the highest V1 representation (35.1%), indicating greater participation by low-volume publishers.
Table 5.
Aggregated number of journals published in subject areas across publisher volume.
In most subject areas, high-volume (V4) publishers account for more than half of the journals, particularly in fields such as Biochemistry, Genetics, and Molecular Biology (57.6%), Business, Management, and Accounting (56%), and Psychology (56.1%). Notably, life science and health-related fields (Medicine, Neuroscience, Immunology, and Microbiology) consistently have a strong high-volume (V4) publisher presence (over 50%), whereas humanities and social sciences display a more even distribution across publisher volumes. These patterns indicate that high-volume (V4) publishers are well-represented across most disciplines in Scopus-indexed journals, particularly in the life sciences, whereas some fields reflect a more diverse mix of publisher volumes.
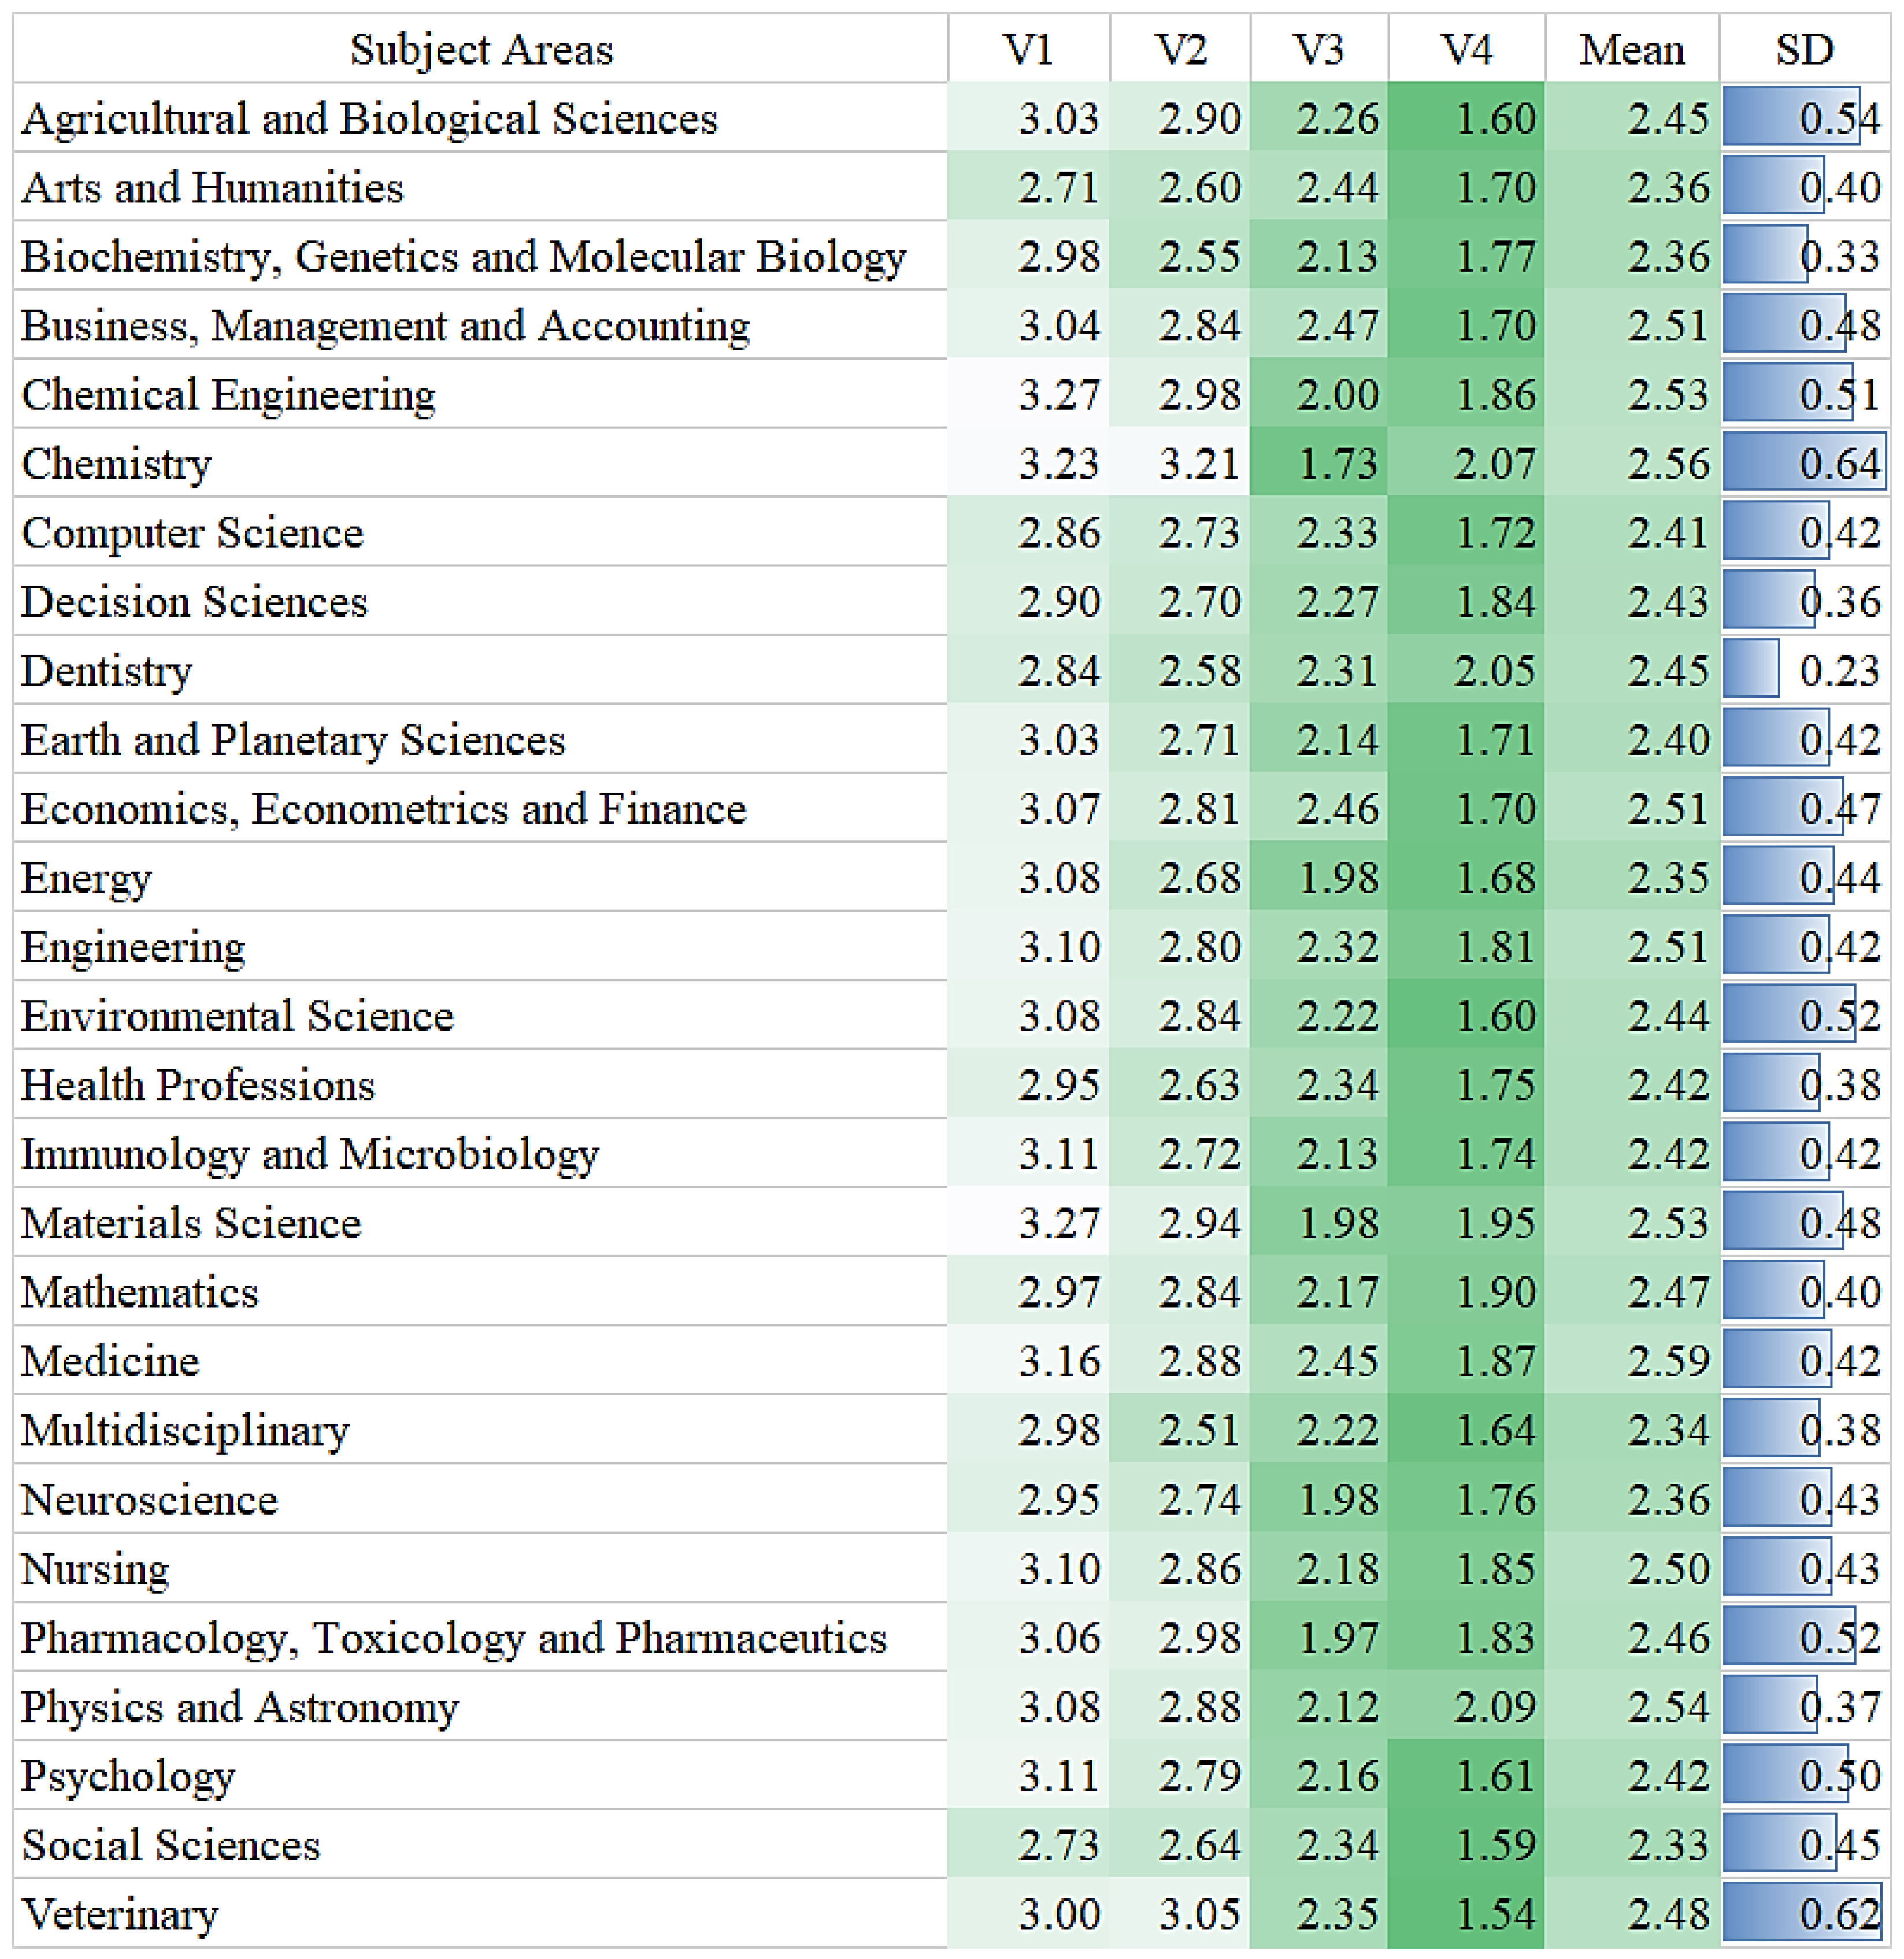
Figure 3 presents the mean quartile ranks of journals across subject areas by publisher volume (V1 to V4). A consistent trend shows that higher-volume publishers (V4) are associated with better-ranked journals (lower quartile values). For example, in Agricultural and Biological Sciences, the mean quartile rank improves from 3.03 (V1) to 1.60 (V4). Health-related fields like Medicine (1.87), Nursing (1.85), and Health Professions (1.75) tend to have higher V4 quartile values than pure sciences like Physics and Astronomy (2.09) and Mathematics (1.90), suggesting differences in how publisher volume influences rankings across disciplines. Standard deviation values indicate ranking stability, with Biochemistry (SD = 0.33) showing more consistency than broader fields like Agricultural and Biological Sciences (SD = 0.54) and Environmental Science (SD = 0.52). Some fields start with high V1 quartile ranks, such as Immunology and Microbiology (3.11) and Psychology (3.11), while others, like Veterinary (1.54) and Social Sciences (1.59), have the best-ranked V4 journals. Overall, publisher volume appears to be linked to journal rankings, though the relationship varies by field type and specialization level.

Figure 3.
Journal quartiles across subject areas by publisher volume.
4.6. Publisher Volume Across OA Journal Types
The results of the analysis of publisher volume across OA and non-OA journals (with hybrid journals classified as non-OA) are presented in Table 6. Among non-OA journals, V4 publishers dominate, accounting for 52.9% (9837 journals), while V1, V2, and V3 contribute 17.0%, 12.0%, and 18.1%, respectively. In contrast, OA journals show a more balanced distribution, with V1 publishers representing 30.0% (2758 journals), V2 23.3% (2142 journals), V3 19.1% (1756 journals), and V4 27.5% (2526 journals). This indicates that smaller publishers (V1 and V2) play a more prominent role in OA publishing compared to non-OA, where high-volume publishers (V4) dominate (Asai, 2022; S. J. Kim & Park, 2022). Pearson’s chi-square test confirmed that these differences are statistically significant, χ2(3) = 1881.2, p < 0.0001, suggesting a distinct pattern in how OA and non-OA journals are distributed across publisher volume categories.
Table 6.
Distribution of publisher volume by journal type (OA vs. non-OA).
Table 7 presents the mean quartiles of journals categorized by publisher volume (V1 to V4) and OA type (non-OA and OA). For non-OA journals, there is a noticeable trend wherein the mean quartiles gradually decrease as publisher volume increases, suggesting a potential association between higher publisher volume and higher journal rankings. Specifically, the mean quartile for non-OA journals improves from 3.16 in V1 to 1.80 in V4. OA journals exhibit a similar but slightly less pronounced decline, with mean quartiles decreasing from 2.84 in V1 to 1.82 in V4. Notably, OA journals consistently have better (lower) mean quartiles in V1 and V2 compared to non-OA journals. However, the quartiles for both types become similar in V4, indicating that the traditional prestige gap between OA and non-OA journals diminishes among high-volume publishers.
Table 7.
Mean quartiles of journals by publisher volume and OA status.
Kruskal–Wallis tests were conducted to compare the distributions of mean quartile ranks across different volume categories and types of journals. As shown, the tests yielded highly significant results for both non-OA (χ2 = 4188.8, df = 3, p < 0.0001) and OA journals (χ2 = 1383.2, df = 3, p < 0.0001), indicating significant differences in journal quartile ranks across publisher volumes regardless of OA status. These findings suggest that journal quartile rankings differ significantly across publisher volume categories in both OA and non-OA models. The Kruskal–Wallis test confirms that these differences are statistically significant (p < 0.0001), and the observed quartile values indicate that as publisher volume increases, journals tend to have lower (better) mean quartile rankings.
To further evaluate differences in mean quartile ranks across publisher volume categories, Dunn’s post-hoc tests were conducted for pairwise comparisons. The results, presented in Table 8, indicate statistically significant differences across all volume pairs for both OA and non-OA journals (adjusted p-values < 0.001). The Z-values show that differences become more pronounced as publisher volume increases, with the strongest contrasts observed between V1 and V4 (Z = 57.18 for non-OA, Z = 34.46 for OA) and between V2 and V4 (Z = 40.98 for non-OA, Z = 28.43 for OA). The smallest differences, though still significant, were found between V1 and V2 (Z = 7.58 for non-OA, Z = 3.98 for OA). These results confirm that publisher volume categories differ significantly in their mean quartile ranks, with the gap widening as publisher volume increases. The effect is more pronounced in non-OA journals, where the differences between categories are larger than in OA journals.
Table 8.
Dunn’s post-hoc test results for OA and non_OA types.
4.7. Linear Mixed-Effects Model Analysis on Journal Metrics
To assess the association of publisher volume and OA status with various journal metrics, a linear mixed-effects model was employed, incorporating subject areas as a random effect to account for disciplinary differences. The model outputs for log-transformed CITES2YR, SJR, and journal quartile are summarized in Table 9. Due to deviations from normality, log transformations were applied where necessary to meet model assumptions. The regression formula for the journal metrics (CITES2YR, SJR, quartile) is as follows:
where represents the respective journal metric, is the intercept, are the effects of publisher volumes (V1 to V4), is the effect of OA status, is the random effect for subject areas, and is the error term.
Table 9.
Linear mixed-effects model results for journal metrics by publisher volume and OA status.
For log-transformed CITES2YR, high-volume publishers (V4) demonstrate significantly higher citation rates compared to low-volume publishers (V1), with an estimate of 0.617 (t = 76.767, p < 0.001). OA journals also show a positive association (estimate = 0.086, t = 13.250, p < 0.001).
For log-transformed SJR, high-volume publishers (V4) have a strong positive association (estimate = 0.282, t = 54.821, p < 0.001), while OA status does not show a statistically significant effect (estimate = −0.003, t = −0.720, p > 0.05). For log-transformed journal quartile rankings, high-volume publishers (V4) are associated with higher prestige (lower quartile values), as indicated by a significant negative estimate (β = −0.375, t = −72.773, p < 0.001). OA journals also trend toward more prestigious quartiles (estimate = −0.034, t = −8.116, p < 0.001).
The random effects show moderate variance due to subject areas (0.126 for quartiles, 0.064 for citations, 0.013 for SJR); however, substantial residual variance remains. Across all models, publisher volume categories (V2, V3, V4) exhibit progressively stronger effects compared to V1 (reference category), reinforcing a clear relationship between publisher volume and journal performance metrics.
5. Discussion
Building on previous research on the consolidation of the publishing industry, such as that by S. J. Kim and Park (2020, 2022), this study reveals significant disparities in how journals are distributed across publishers. Although many publishers contribute only a handful of Scopus-indexed journals, a small group of high-volume publishers dominates the landscape. This imbalance in publishing activity reflects the broader reality of academic publishing, where a few major players exert considerable influence over scholarly communication. These findings contribute to ongoing discussions about market consolidation, accessibility, and the implications for knowledge dissemination. As large publishers continue to shape editorial policies, pricing structures, and research visibility, concerns about fairness, representation, and the diversity of voices in academia become more pressing.
The entrenchment of publishing power is not merely a contemporary phenomenon but aligns with established theoretical frameworks on academic capital and prestige accumulation. The consolidation of influence among a handful of high-volume publishers—evident in the 25 V4 publishers controlling 44.5% of all Scopus-indexed journals—reflects an oligarchic structure in academic publishing. This publishing oligarchy, dominated by large commercial entities, exemplifies Bourdieu’s (1986) theory of academic capital, where established publishers leverage their prestige to maintain dominance, securing high-impact metrics and quartile rankings in a self-reinforcing cycle. This mechanism mirrors Merton’s (1968) ‘Matthew Effect’, in which accumulated advantage perpetuates systemic inequality.
Journal rankings are determined not only by Scopus selection criteria but also by publisher business models, ownership structures, and institutional affiliations (E. S. Kim & Kim, 2022; Rotolo et al., 2022). Scopus applies a structured selection process that evaluates journal policy, content quality, editorial standards, peer review type, geographic diversity, academic contributions, citation impact, and publishing consistency (Scopus, 2023). However, there is no clear evidence that this process systematically favors OA over non-OA journals. Instead, publisher volume remains the strongest predictor of journal rankings, even after controlling for OA status and subject-area differences in a linear mixed-effects model. While selection effects influence journal distribution patterns, they do not appear to drive quartile ranking disparities. Large commercial publishers benefit from economies of scale, branding, and established distribution networks, whereas university presses and scholarly societies operate under distinct financial models and editorial priorities (E. S. Kim & Kim, 2022; Rotolo et al., 2022). These structural differences shape access models, funding mechanisms, citation rates, and editorial policies, ultimately affecting journal rankings. The nearly identical mean quartiles of OA and non-OA journals within high-volume publishers (V4) suggest that systemic advantages—rather than selection bias alone—reinforce ranking patterns, with publisher scale and ownership models playing a central role in shaping visibility and impact.
Against this backdrop, this study examines how publisher volume correlates with journal impact metrics. The correlation analysis revealed that publisher volume exhibits only weak-to-moderate correlations with journal impact metrics. For instance, Journal_Count showed a correlation of 0.11 with CITES2YR, indicating that while larger publishers tend to have higher citation counts, the relationship is relatively modest. Similarly, correlations with h-index (0.24) and TDYEAR (0.09) suggest that publisher volume is just one of many factors influencing journal performance. These findings align with previous studies (Larivière et al., 2015; S. J. Kim & Park, 2020), which acknowledge the role of publisher volume in shaping journal impact but emphasize the multifaceted nature of academic visibility and influence. While high-volume publishers benefit from economies of scale (Hyland, 2021) and branding advantages (Tötösy de Zepetnek & Jia, 2014), journal performance remains shaped by multiple variables, including subject area, editorial policies, and institutional support (Klus & Dilger, 2020). These findings reinforce the hierarchical structure of academic publishing while pointing out the need for further research on factors beyond publisher volume that contribute to journal impact.
Although OA was initially heralded as a democratizing force (Salager-Meyer, 2012), this study’s findings indicate that it has not fundamentally disrupted this imbalance. Instead, major publishers have strategically adapted to and co-opted the OA model (Wakeling et al., 2017), extending their influence across both OA and non-OA journals. The results show that OA journals from lower-volume publishers (V1 and V2) tended to have better quartile rankings than their non-OA counterparts. This aligns with previous research indicating that smaller OA publishers can achieve high impact despite resource limitations (Romero, 2023). However, in V4, the quartile rankings of OA and non-OA journals were nearly identical (mean quartiles of 1.82 vs. 1.80, respectively), indicating that at the highest publisher volume level, the traditional prestige gap between OA and non-OA journals disappears. This suggests that while OA provides a relative advantage for smaller publishers, larger publishers maintain strong influence regardless of the access model used (S. J. Kim & Park, 2022).
The empirical analysis of publisher volume and OA status reveals a nuanced dynamic. High-volume publishers consistently outperform smaller publishers across impact metrics, yet the role of OA status is less straightforward. Some studies suggest that OA increases citation rates (Piwowar et al., 2018), while others find no significant correlation between OA status and journal performance at the journal level (Klus & Dilger, 2020). This study’s results support the notion that while OA may enhance visibility, it does not necessarily lead to higher impact in V4 publishers, where other systemic advantages play a greater role. These conclusions, supported by Dunn’s post-hoc test and the linear mixed-effects model, demonstrate the complex interactions between publisher scale, visibility, and impact. Furthermore, the strong presence of low-volume publishers (V1 and V2) in both OA and non-OA categories affirms their essential role in fostering diversity within academic research dissemination, even if they lack the same level of institutional prestige as larger publishers.
The geographical analysis reinforced these systemic patterns. The results confirm that high-volume publishers are predominantly based in Western Europe and North America, a trend consistent with prior research on publisher dominance and market share evolution (S. J. Kim & Park, 2020, 2022). These publishers also produce journals with significantly higher quartile rankings, demonstrating a direct link between geographic concentration and journal impact. In contrast, Africa, Latin America, and the Pacific regions exhibit a clear predominance of low-volume (V1) publishers, with limited representation in high-impact categories. This distribution pattern is also reflected in measurable disparities in h-index values and SJR scores, reinforcing the role of regional publishing infrastructure in shaping journal performance.
The subject-area analysis uncovered clear trends in publisher volume and journal performance. The results indicate that V4 publishers maintain a dominant presence in disciplines such as Medicine, where they demonstrate significantly higher impact metrics. In contrast, low-volume publishers (V1) are more prevalent in Multidisciplinary research, potentially due to the fragmentation of publishing in this field. Veterinary sciences stand out as an exception, displaying a relatively balanced distribution across publisher volumes. The quartile ranking analysis further confirms consistent advantages for high-volume publishers, with their journals achieving lower mean quartile ranks (indicating higher prestige). These relationships persist even when controlling for subject-area variations through the linear mixed-effects model.
The mixed-effects model quantified these relationships, showing that high-volume publishers (V4) consistently achieve higher h-index scores, CITES2YR, SJR, and quartile rankings compared to low-volume publishers (V1). These findings suggest that visibility, resources, and systemic advantages continue to shape disparities in scholarly publishing, reinforcing broader structural forces that govern knowledge dissemination.
6. Limitations
This study examined publisher volume and its relationship to journal publishing patterns in Scopus; however, several limitations should be considered, particularly regarding data selection, classification methods, and unaccounted factors that may have influenced the results. The following key limitations point to areas where further research could refine the analysis and enhance our understanding of scholarly publishing dynamics.
First, focusing exclusively on Scopus-indexed journals using SJR for the year 2023 restricts our ability to capture long-term trends or variations in publisher volume over time. Moreover, relying solely on journals within the Scopus database may exclude relevant journals published by the same publishers but not indexed in Scopus, potentially limiting the comprehensiveness of the findings.
Second, this study uses data from the SJR portal to determine the country of publication for journals. However, this information is not always accurate, as journals may be published in multiple locations or have affiliations with international publishers. Alternative sources, such as Ulrich’s Web, have been used in similar studies and may offer different classifications, potentially affecting the interpretation of journal distribution across countries.
Third, defining publisher volume solely by the number of Scopus-indexed journals may introduce bias by excluding journals that are not indexed in Scopus, potentially affecting the comprehensiveness of the analysis. The grouping of journals into V1–V4 categories was somewhat arbitrary, and alternative subgrouping methods could yield different distributions. The regression model used in this study controls for subject-area differences; however, editorial policies, funding structures, and institutional support may also influence journal rankings and impact metrics. These factors were not explicitly accounted for and could introduce additional variability. Future research could further refine the analysis by incorporating these dimensions.
Fourth, a significant limitation is the potential bias introduced by the duration of journal indexing in Scopus. Journals indexed for longer periods may have accumulated more citations, resulting in higher h-index values compared to newly indexed journals. Recent research by E. Kim (2024b) has similarly shown that indexing duration significantly influences bibliometric indicators such as citations and the h-index. Publishers with a high volume of journals, such as Brill Academic Publishers, may show lower h-index values due to shorter indexing periods. This discrepancy suggests that indexing duration, combined with publisher volume, plays an important role in assessing journal impact. Thus, future studies should further investigate these relationships to provide a more accurate assessment of journal metrics.
Fifth, the influence of OA status on journal metrics is analyzed using Scopus’s binary classification in SJR, which primarily reflects Gold OA journals, as it relies on sources like DOAJ (Elsevier, 2015). Since Scopus does not explicitly label non-OA journals, they were derived programmatically via an anti-join operation. This binary approach excludes distinctions between OA models (e.g., Green, Hybrid), limiting a more nuanced analysis of their effects on journal performance.
Lastly, the study categorizes journals under major publishers but does not explicitly detail how imprints and subsidiary publishing companies were assigned. In previous studies, such as Butler et al. (2023), imprints were manually assigned to their parent companies, which could affect journal counts per publisher. Future research could further refine this classification method to ensure consistency and accuracy.
7. Conclusions
This study found substantial disparities in the publishing industry, with high-volume publishers consistently achieving stronger bibliometric performance across key indicators. Larger publishers benefit from structural advantages that enhance visibility and impact, which are reflected in journal rankings. This advantage likely stems from their resources, networks, and economies of scale. However, journal metrics themselves are not neutral indicators of quality, as they often reinforce existing disparities by favoring well-established publishers with higher citation flows and greater indexing coverage. The dominance of a few major publishers creates a hierarchical structure where they control a disproportionate share of scholarly communication, while smaller publishers and journals from underrepresented regions face systemic barriers. Differences in quartile rankings, citation impact (CITES2YR), and SJR scores illustrate how these structural advantages contribute to persistent inequalities in academic publishing. Addressing these imbalances is essential for fostering a more equitable scholarly communication landscape.
To address disparities in journal rankings and publishing volume, several policy interventions could be explored. Increased funding for non-commercial publishers may enhance their ability to compete by strengthening editorial operations, infrastructure, and visibility. Expanding regional indexing initiatives could improve recognition and accessibility for journals from underrepresented regions, offering greater opportunities for inclusion in global scholarly communication. Furthermore, institutional support—through collaborative publishing networks, editorial training programs, and investments in digital infrastructure—could help smaller publishers build long-term sustainability. These measures may contribute to a more inclusive and balanced publishing landscape, fostering broader participation across diverse regions and publishing models. Future research should examine the long-term effects of these interventions on journal performance, particularly in addressing regional and economic disparities in scholarly publishing.
Funding
No funding was received for this study.
Data Availability Statement
The data used in this study (SJR 2023 data for journals in Ireland) are publicly available and can be downloaded from the SCImago Journal Rank website: https://www.scimagojr.com (15 February 2025). The code used for data analysis is available on GitHub at: https://github.com/egkim68/publisher_vol (accessed on 15 February 2025).
Conflicts of Interest
The author declares no competing interests.
References
- Asai, S. (2022). Strategies to increase the number of open access journals: The cases of elsevier and springer nature. Journal of Scholarly Publishing, 53(2), 75–84. [Google Scholar] [CrossRef]
- Asubiaro, T. V., & Onaolapo, S. (2023). A comparative study of the coverage of African journals in web of science, scopus, and CrossRef. Journal of the Association for Information Science and Technology, 74(7), 745–758. [Google Scholar] [CrossRef]
- Biagioli, M., Lippman, A., Csiszar, A., Gingras, Y., Power, M., Wouters, P., Griesemer, J. R., Kehm, B. M., de Rijcke, S., Stöckelová, T., Fanelli, D., Sismondo, S., Oransky, I., Barbour, B., Stell, B., Guaspare, C., Didier, E., Brookes, P. S., Antkare, I., … Lippman, A. (2019). 4 The mismeasurement of quality and impact. In Gaming the metrics: Misconduct and manipulation in academic research (pp. 67–75). MIT Press. [Google Scholar]
- Bourdieu, P. (1986). The forms of capital. In J. Richardson (Ed.), Handbook of theory and research for the sociology of education (pp. 241–258). Greenwood Press. [Google Scholar] [CrossRef]
- Brown, V. A. (2021). An introduction to linear mixed-effects modeling in R. Advances in Methods and Practices in Psychological Science, 4(1), 2515245920960351. [Google Scholar] [CrossRef]
- Butler, L.-A., Matthias, L., Simard, M.-A., Mongeon, P., & Haustein, S. (2023). The oligopoly’s shift to open access: How the big five academic publishers profit from article processing charges. Quantitative Science Studies, 4(4), 778–799. [Google Scholar] [CrossRef]
- Cozzolino, A., Corbo, L., & Aversa, P. (2021). Digital platform-based ecosystems: The evolution of collaboration and competition between incumbent producers and entrant platforms. Journal of Business Research, 126, 385–400. [Google Scholar] [CrossRef]
- Csomós, G., & Farkas, J. Z. (2023). Understanding the increasing market share of the academic publisher “Multidisciplinary Digital Publishing Institute” in the publication output of Central and Eastern European countries: A case study of Hungary. Scientometrics, 128(1), 803–824. [Google Scholar] [CrossRef]
- Dinno, A. (2015). Nonparametric pairwise multiple comparisons in independent groups using Dunn’s test. Journal of Statistical Software, 15(1), 292–300. [Google Scholar] [CrossRef]
- Elsevier. (2015). Scopus to launch Open Access indicator for journals on July 29. Elsevier. Available online: https://blog.scopus.com/posts/scopus-to-launch-open-access-indicator-for-journals-on-july-29 (accessed on 15 February 2025).
- Frantsvåg, J. E. (2010). The size distribution of open access publishers: A problem for open access? First Monday, 15(12). [Google Scholar] [CrossRef]
- Gadd, E., Fry, J., & Creaser, C. (2018). The influence of journal publisher characteristics on open access policy trends. Scientometrics, 115(3), 1371–1393. [Google Scholar] [CrossRef]
- Hyland, K. (2021). The scholarly publishing landscape. In The routledge handbook of scientific communication (pp. 15–25). Routledge. [Google Scholar]
- Jamali, H. R., Wakeling, S., & Abbasi, A. (2022). The landscape of scholarly journal publishing in Australia. Learned Publishing, 35(2), 130–139. [Google Scholar] [CrossRef]
- Kanyika, M. E., & Kim, E. (2025). Continued struggle: The growth of Scopus-indexed journals in Africa over the last decade. Journal of Librarianship and Information Science, 09610006251319546. [Google Scholar] [CrossRef]
- Kim, E. (2024a). Analyzing AI use policy in LIS: Association with journal metrics and publisher volume. Scientometrics, 129, 7623–7644. [Google Scholar] [CrossRef]
- Kim, E. (2024b). In-depth examination of coverage duration: Analyzing years covered and skipped in journal indexing. Publications, 12(2), 10. [Google Scholar] [CrossRef]
- Kim, E., & Atteraya, M. S. (2024). A decade of changes in OA and non-OA journal publication and production. Journal of Librarianship and Information Science, 56(4), 978–987. [Google Scholar] [CrossRef]
- Kim, E., & Jeong, D. Y. (2023). Comparison of the open access status and metrics of Scopus journals published in East Asian countries: A descriptive study. Science Editing, 10(1), 57–63. [Google Scholar] [CrossRef]
- Kim, E. S., & Kim, E. (2022). A comparison of asian law journals published in asian and western countries. Publications, 10(3), 23. [Google Scholar] [CrossRef]
- Kim, K., & Chung, Y. (2018). Overview of journal metrics. Science Editing, 5(1), 16–20. [Google Scholar] [CrossRef]
- Kim, S. J., & Park, K. S. (2020). Influence of the top 10 journal publishers listed in journal citation reports based on six indicators. Science Editing, 7(2), 142–148. [Google Scholar] [CrossRef]
- Kim, S. J., & Park, K. S. (2022). Changes in article share and growth by publisher and access type in journal citation reports 2016, 2018, and 2020. Science Editing, 9(1), 30–36. [Google Scholar] [CrossRef]
- Klus, M. F., & Dilger, A. (2020). Success factors of academic journals in the digital age. Business Research, 13, 1115–1143. [Google Scholar] [CrossRef]
- Laakso, M., & Multas, A. M. (2023). European scholarly journals from small-and mid-size publishers: Mapping journals and public funding mechanisms. Science and Public Policy, 50(3), 445–456. [Google Scholar] [CrossRef]
- Larivière, V., Haustein, S., & Mongeon, P. (2015). The oligopoly of academic publishers in the digital era. PLoS ONE, 10(6), e0127502. [Google Scholar] [CrossRef]
- Merton, R. K. (1968). The Matthew effect in science. Science, 159(3810), 56–63. [Google Scholar] [CrossRef] [PubMed]
- Perianes-Rodriguez, A., Waltman, L., & Van Eck, N. J. (2016). Constructing bibliometric networks: A comparison between full and fractional counting. Journal of informetrics, 10(4), 1178–1195. [Google Scholar] [CrossRef]
- Piwowar, H., Priem, J., Larivière, V., Alperin, J. P., Matthias, L., Norlander, B., Farley, A., West, J., & Haustein, S. (2018). The state of OA: A large-scale analysis of the prevalence and impact of Open Access articles. PeerJ, 6, e4375. [Google Scholar] [CrossRef]
- Romero, C. R. (2023, September 27–29). A matter of size? Visibility and impact of small open access journals in two large databases [preprint]. 27th International Conference on Science, Technology and Innovation Indicators (STI 2023), Leiden, The Netherlands. [Google Scholar] [CrossRef]
- Rotolo, D., Camerani, R., Grassano, N., & Martin, B. R. (2022). Why do firms publish? A systematic literature review and a conceptual framework. Research Policy, 51(10), 104606. [Google Scholar] [CrossRef]
- Salager-Meyer, F. (2012). The open access movement or “edemocracy”: Its birth, rise, problems and solutions. Ibérica, Revista de la Asociación Europea de Lenguas para Fines Específicos, 24, 55–73. Available online: https://www.redalyc.org/articulo.oa?id=287024476006 (accessed on 15 February 2025).
- SCImago. (n.d.). SCImago journal & country rank. Available online: https://www.scimagojr.com (accessed on 15 February 2025).
- Scopus. (2023). Scopus content coverage guide. Elsevier. Available online: https://www.elsevier.com/products/scopus/content/content-policy-and-selection (accessed on 15 February 2025).
- Teixeira da Silva, J. A., Moradzadeh, M., Adjei, K. O. K., Owusu-Ansah, C. M., Balehegn, M., Faúndez, E. I., Janodia, M. D., & Al-Khatib, A. (2022). An integrated paradigm shift to deal with ‘predatory publishing’. Journal of Academic Librarianship, 48(1), 102481. [Google Scholar] [CrossRef]
- Tennant, J. P., Crane, H., Crick, T., Davila, J., Enkhbayar, A., Havemann, J., Kramer, B., Martin, R., Masuzzo, P., Nobes, A., Rice, C., Rivera-López, B., Ross-Hellauer, T., Sattler, S., Thacker, P. D., & Vanholsbeeck, M. (2019). Ten hot topics around scholarly publishing. Publications, 7(2), 34. [Google Scholar] [CrossRef]
- Thi, T. T. P., Pham, H. H., Nguyen, H. L., & Nguyen, L. C. (2021). International academic publishing in Vietnam: Policy efficiency and room for development. Science Editing, 8(2), 162–165. [Google Scholar] [CrossRef]
- Tötösy de Zepetnek, S., & Jia, J. (2014). Electronic journals, prestige, and the economics of academic journal publishing. CLCWeb: Comparative Literature and Culture, 16(1), 12. [Google Scholar] [CrossRef]
- Wakeling, S., Spezi, V., Fry, J., Creaser, C., Pinfield, S., & Willett, P. (2017). Open access megajournals: The publisher perspective (Part 1: Motivations). Learned Publishing, 30(4), 301–311. [Google Scholar] [CrossRef]
- Walters, W. H. (2022). Can differences in publisher size account for the relatively low prices of the journals available to master’s universities through commercial publishers’ databases? The importance of price discrimination and substitution effects. Scientometrics, 127, 1065–1097. [Google Scholar] [CrossRef]
Disclaimer/Publisher’s Note: The statements, opinions and data contained in all publications are solely those of the individual author(s) and contributor(s) and not of MDPI and/or the editor(s). MDPI and/or the editor(s) disclaim responsibility for any injury to people or property resulting from any ideas, methods, instructions or products referred to in the content. |
© 2025 by the author. Licensee MDPI, Basel, Switzerland. This article is an open access article distributed under the terms and conditions of the Creative Commons Attribution (CC BY) license (https://creativecommons.org/licenses/by/4.0/).