Abstract
In this paper, we report the effect of the Cr/Mn ratio on the thermodynamic properties of Ti30V60Mn(10−x)Crx (x = 0, 3.3, 6.6 and 10) + 4 wt.% Zr alloys. It was found that the enthalpy and entropy change with the Cr/MN ratio and that the entropy and entropy variation is coupled in an enthalpy-entropy compensation fashion. Using a compensation quality factor, it was established that the enthalpy-entropy compensation is not due to a statistical origin, with a confidence of more than 95%.
1. Introduction
With increased interest in renewable energies, hydrogen has gained significant attention as a clean energy vector. Therefore, the development of a safe and efficient hydrogen storage method is of paramount importance. Metal hydrides have emerged as one of the most promising hydrogen storage materials due to their high volumetric capacity.
Amongst the many types of metal hydrides, Ti-V-based Body Centered Cubic (BCC) solid solution alloys stand out, featuring a hydrogen storage capacity of over 3.8 wt.% at room temperature and moderate pressure [1]. However, a major challenge associated with this system is the poor hydrogen desorption performance at room temperature, limiting its practical use [2,3].
It has been shown that Ti-V alloys exhibit two distinct plateaus in the pressure-composition isotherms (PCI), leading to the formation of two distinct hydrides [4,5]. At room temperature, the first plateau is usually situated far below atmospheric pressure (around 0.1 Pa) and is the transformation of the BCC solid solution into a monohydride. The second plateau emerges at higher pressures (around 0.1 MPa), leading to the transformation of the monohydride into a dihydride [6]. Notably, in hydrogen storage applications, only the dihydride contributes to the reversible hydrogen storage capacity, while the monohydride remains too stable and necessitates high temperatures for hydrogen release. This is the reason why the reversible hydrogen storage capacity of BCC solid solutions is smaller than their total hydrogen storage capacity.
To overcome this issue and enhance hydrogen storage capacities, researchers have explored the addition of 3d elements with similar radii to vanadium, such as Mn, Cr, Fe, Co, and Ni [7,8]. Mn addition to Ti-V alloys alters the microstructure of the alloy, leading to improved PCI properties [9,10,11,12,13,14]. The Ti-V-Mn alloy consisting of BCC and C14 laves phase was first reported by Akiba and Iba [15]. In this paper, they showed that the hydrogen capacity is a linear combination of capacities of individual phases.
Another important finding in Ti-V-M alloys was that varying Ti, V and M content had a significant effect on the lattice parameter of the as-cast alloys, which leads to an increased or decreased equilibrium plateau pressure due to the different sizes of constituent elements [16,17,18]. Nakamura and Akiba reported that the plateau pressure of TixV1.0Mn(2−x) (x = 1.0, 1.1 and 1.2) alloys decreased with increasing lattice parameters [19]. Okada et al. found that an increase in the Cr content in Ti-V-Cr alloys leads to a shift of the equilibrium plateau pressure to higher values due to a decrease in the lattice parameter [20].
Ternary and quaternary Ti-V-M samples have been extensively studied, with Ti-V-M (M = Mn, Cr, Fe, Co) [9,21,22,23] and Ti-V-Cr-M (M = Mn, Fe) [17,24] alloys exhibiting favorable hydrogen storage properties. Bibienne and Huot studied the effect of the alloy composition on the hydrogen storage properties of TiV2−xMnx [25]. Their study showed that the plateau pressure in desorption increases when decreasing the lattice parameter associated with a higher Mn content. The composition TiV1.8Mn0.2 shows a maximum hydrogen storage capacity of 3.4 wt.% of hydrogen at 373 K.
Modifications in plateau pressures imply a change in the enthalpy (ΔH) and entropy (ΔS) of the hydrogenation/dehydrogenation reaction. Entropy (ΔS) is generally considered relatively constant among different metal hydrides (−130 J·(mol H2)−1·K−1) and is mainly due to the entropy loss of hydrogen from a gaseous state to a metal hydride state. A simultaneous linear decrease or increase of ΔH and ΔS may be an indication of an enthalpy-entropy compensation effect (EEC) [26], also called isokinetic relationship according to IUPAC nomenclature [27]. This compensation effect has been reported in various systems in biology with protein ligand–receptor interactions [28,29,30] and in chemistry with the adsorption of molecules into microporous materials [31,32]. This phenomenon was also observed in various metal hydride systems as MSi/α-MSiH3 (M = K, Rb, and Cs) [33], in the hydrogenation/dehydrogenation properties of Mg-Ti nanocomposites [34,35] and Pd-H nanocubes [35,36], and for H2 permeation kinetics in PdAg membranes [37]. Anastasopol et al. did not identify an exact mechanism for their results on Mg-Ti nanocomposites but tentatively explained it as being possibly due to lattice strains, the presence of interfaces between coherent Mg and TiH2 nanodomains, the presence of hydrogen vacancies, and the formation of excess free volume due to local deformations of the material [34]. For isokinetics reactions, it has been related to the Meyer–Neldel rule [38,39,40].
This compensation effect has never been reported in metal hydrides having Ti-V-based BCC structures. In an investigation of the BCC alloy Ti52V12Cr36 with the addition of Zr7Ni10, Bibienne and Huot reported a formation enthalpy (ΔH) of −60.6 kJ·(mol H2)−1 and entropy (ΔS) of =−169 J·(mol H2)−1·K−1 [41]. In a subsequent study, the same authors investigated the thermodynamic parameters of Ti42V21Cr37 doped with Zr7Ni10 and found the values ΔH = −38 kJ·(mol H2)−1 and ΔS = −130 J·(mol H2)−1·K−1 [42]. These preliminary results indicate that BCC Ti-V alloys may exhibit a linear dependence between entropy and enthalpy.
In a subsequent investigation, the effect of Ni and Zr elements as additives was investigated, and it was found that Zr is the most effective element for enhancing the first hydrogenation of Ti-V-Cr BCC alloy [43,44]. In these alloys, a Zr-rich secondary phase is considered to be responsible for the fast kinetics.
The primary objective of this study was to further investigate the thermodynamic properties of Ti30V60Mn(10−x)Crx (x = 0, 3.3, 6.6, and 10) + 4 wt.% Zr BCC alloys. Specifically, the objective was to explore the influence of varying Cr/Mn contents on hydrogen desorption properties and to examine the relationship between the entropy and enthalpy of the hydride formation in these BCC alloys.
2. Results and Discussion
To investigate the desorption thermodynamics of the Ti30V60Mn(10−x) Crx (x = 0, 3.3, 6.6 and 10) + 4 wt.% Zr alloy, we conducted PCI measurements at different temperatures. It is important to note that we could only record the plateau between the dihydride and monohydride phases, as the desorption plateau of the monohydride was too low (lower than 10 kPa) to be measured with our apparatus.
Figure 1a shows the PCI desorption curves of Ti30V60Mn10 + 4 wt.% Zr alloy at 423, 448, 473 and 498 K. As our study focused solely on desorption, all curves share the same high-pressure origin, as shown in the Supplementary Document. To better compare the plateaus, in this figure and all subsequent ones, the curves are vertically aligned at their inflection point (i.e., middle of the plateau). As the temperature increases, we observed a rise in the plateau pressure, and simultaneously, the width of the higher desorption plateau decreased. This reduction in width indicates a corresponding decrease in the storage capacity. The sample desorbed 1.4 wt.% of hydrogen, which corresponds to only 41% of its total absorption after activation (3.4 wt.%), indicating the dihydride–monohydride transition.
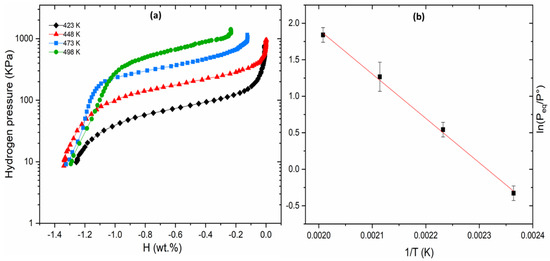
Figure 1.
PCI desorption curves at 423, 448, 473 and 498 K (a) and Van’t plot of Ti30V60Mn10 + 4 wt.% Zr alloy (b).
We considered the inflection points (midpoint) of each plateau as the equilibrium pressure (Peq). From these pressures, a Van’t Hoff plot was obtained and is shown in Figure 1b.
In the case of Ti30V60Mn6.6Cr3.3 + 4 wt.% Zr alloy, Figure 2 illustrates the PCI desorption curves and the corresponding Van’t Hoff plot. A comparison with the ternary alloy Ti30V6.0Mn10 reveals that the addition of 3.3 at % Cr results in a drop in plateau pressure, although the sample desorbed 1.6 wt.% of hydrogen. It should be noted that some plateaus are broader than others. The reason for this is that there is some drop of capacity with cycling and that the isotherms were taken on the same sample.
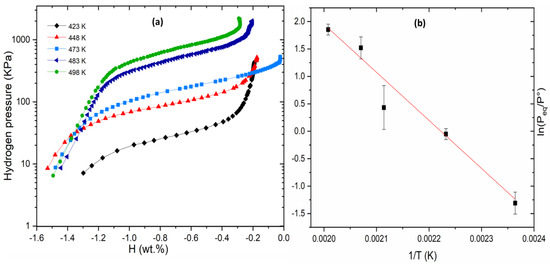
Figure 2.
PCI desorption curves at 423, 448, 473, 483 and 498 K (a) and Van’t Hoff plot of Ti30V60Mn6.6Cr3.3 + 4 wt.% Zr alloy (b).
At 473 K, the first isotherm displayed a wider plateau pressure, as observed in Figure 2a. This was due to the lattice strain inherent to the material at its initial state, which slightly affected the plateau pressure. As the material underwent cycling, the lattice strain was relieved, resulting in subsequent isotherms with narrower plateau pressures. As seen in Figure 2b, the data point corresponding to the 473 K isotherm is somewhat off from the Van’t Hoff line. This indicate that cycling has a minimal effect on the plateau pressure and also that the effect is concentrated on the first cycle.
Similarly, Figure 3 represents the PCI desorption curves of Ti30V60Mn3.3Cr6.6 + 4 wt.% Zr and its Van’t Hoff plot. Here, a further replacement of Mn by Cr (6.6 at % Cr) leads to a rise in desorption plateau pressure, while the desorption capacity remains unchanged.
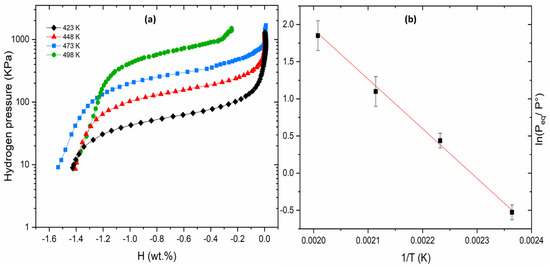
Figure 3.
PCI desorption at 423, 448, 473 and 498 K (a) and Van’t Hoff plot of Ti30V60Mn3.3Cr6.6 + 4 wt.% Zr alloy (b).
Figure 4 presents the PCI desorption curves of Ti30V60Cr10 + 4 wt.% Zr alloy and the corresponding Van’t Hoff plot. Even with a total substitution of Mn by Cr, the dehydrogenation plateau pressure continues to increase.
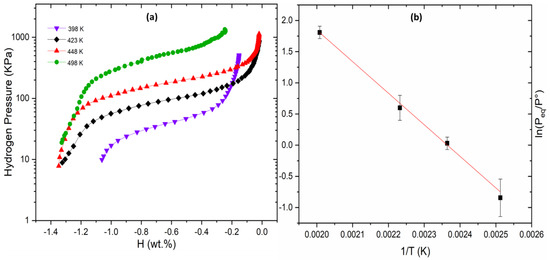
Figure 4.
PCI desorption at 398, 423, 448 and 498 K (a) and Van’t plot of Ti30V60Cr10 + 4 wt.% Zr alloy (b).
Notably, the plateau pressure of alloys (with x from 3.3 to 10) increases with an increasing Cr/Mn ratio. Table 1 shows that the equilibrium pressure (Peq) values are significantly influenced by the chromium proportion. As observed in our previous work, XRD analyses confirmed that Ti30V60Mn(10−x) Crx (x = 3.3, 6.6 and 10) + 4 wt.% Zr alloys exhibit a BCC crystal structure, with their lattice parameters decreasing as the Cr content increases [45]. This is because the atomic radius of Cr (1.25 Å) is smaller than that of Mn (1.35 Å). This result confirms that the plateau pressure can indeed be controlled by adjusting the Cr/Mn ratio.

Table 1.
The equilibrium pressure (Peq) data given at different temperatures of PCI curves. Thermodynamic parameters of Ti30V60Mn(10−x)Crx (x = 0, 3.3, 6.6 and 10) + 4 wt.% Zr alloy determined from Van’t Hoff plots.
The ∆Hdes and ∆Sdes values calculated from the slope and intercept of the Van’t Hoff equation [ln(Peq/P°) = (ΔH/RT) − (ΔS/R)] are reported in Table 1. The ∆Hdes of Ti30V60Cr10 is significantly lower than the ∆Hdes of Ti30V60Mn10. Therefore, the stability of the dihydride phase is reduced with a higher Cr content.
Figure 5 illustrates the correlation between the enthalpy and entropy values and the Cr proportion. Notably, our observations indicate the absence of a linear relationship between these thermodynamic parameters and the variation in x. However, there seems to be a correlation between the thermodynamic parameters themselves.
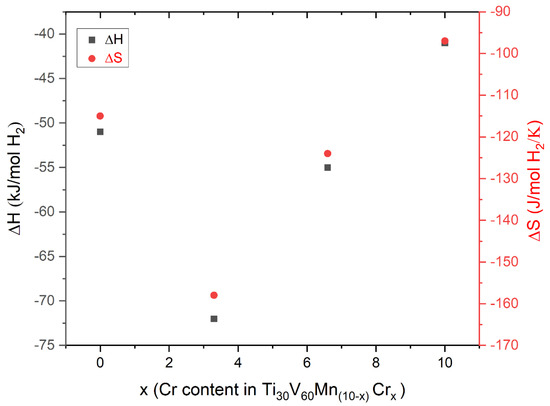
Figure 5.
The variation of ∆H and ∆S as a function of x.
The Van’t Hoff plots for the four alloys are displayed in Figure 6. Notably, the lines of ln(Peq/P°) as a function of the inverse of the temperature demonstrate a convergence at around 500 K. Therefore, an entropy-enthalpy compensation (EEC) may be expected.
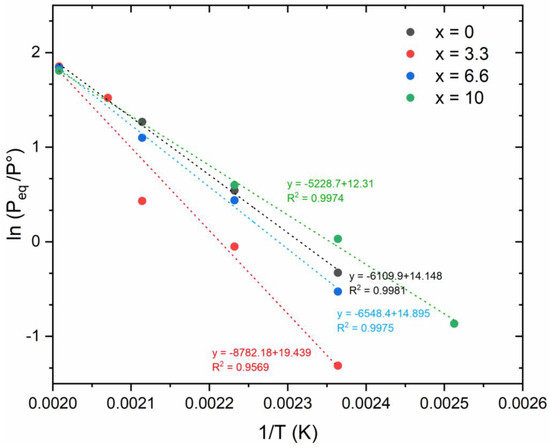
Figure 6.
Van’t Hoff plot of Ti30V60Mn(10−x)Crx (x = 0, 3.3, 6.6 and 10) + 4 wt.% Zr alloy.
Figure 7 shows the plot of ∆H versus ∆S, revealing a clear linear relationship between these two parameters, indicative of EEC behavior. The linear regression line has a high R square value of 0.99989. The slope of this line defines the so-called compensation temperature Tc = ∆H/∆S = 499.9 K, where all compositions have the same equilibrium pressure. This is very close to the convergence temperature seen in Figure 6.
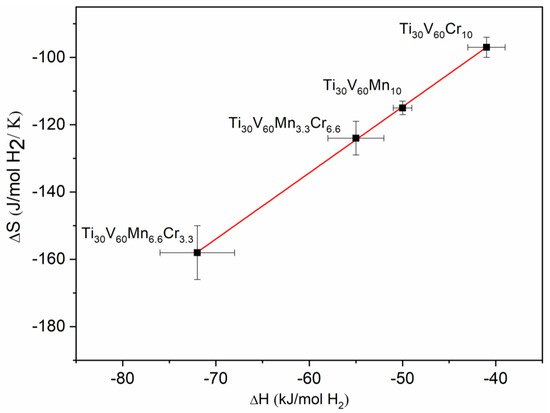
Figure 7.
∆H variation as a function of ∆S.
To confirm the reality of the enthalpy-entropy compensation, we applied the Combined K-CQF test designed by Griessen and Dam to verify if the enthalpy-entropy compensation had a statistical origin [36]. In this context, K denotes the position of the coalescence region within the Van’t Hoff plots, while CQF quantifies the smallest dispersion among these plots. To apply this method to the Ti30V60Mn(10−x)Crx (x = 0, 3.3, 6.6 and 10) + 4 wt.% Zr alloy, we followed these steps:
- Temperature Calculations: Initially, we calculated essential temperatures for our analysis:
- Thm, the harmonic mean of experimental temperatures, calculated as Thm = 458.80 K using Equation (1).
- ii.
- T*, the temperature at which the largest LnP spread is measured is chosen so that T* = Tlow if 1/Tmin closer to 1/Thigh or T* = Thigh if 1/Tmin is closer to 1/Tlow.Given our experimental temperature range of (423–498) K, we have T* = Tlow = 423 K.
- 2.
- Key Parameter Calculation: We proceeded to calculate the key parameters K and CQF using Equations (3) and (4), respectively:
- 3.
- Position Verification:
Figure 8, taken from Griessen and Dam’s research, shows the universal confidence contours derived through extensive simulations of random Van‘t Hoff plots [36]. These contours serve to determine the statistical origin of the EEC at a specific confidence level (CL%). The term “universal” stems from the fact that the confidence contours depend only on the number of samples N and the chosen CL%, which makes this method easily applicable. Thus, if the (K, CQF) couple lies outside the designated CL% contour, this indicates that the EEC is probably not of statistical origin at that level of confidence.
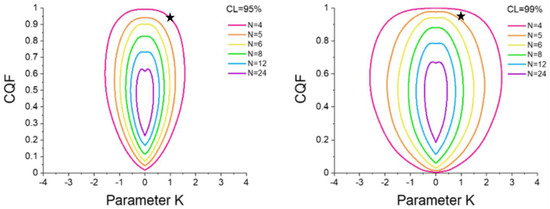
Figure 8.
95% (left panel) and 99% (right panel) confidence contours for N = 4 up to N = 15 determined from 2D-probability density surfaces. Adapted from ref. [35] with permission.
In our study, the precise position of the (K, CQF) couple (1.008679, 0.942542), characteristic of Ti30V60Mn(10−x)Crx (x = 0, 3.3, 6.6 and 10) + 4 wt.% Zr, has been distinctly marked as a star within Figure 8. However, this star lies on the border of the 95% and inside the 99% confidence contour for N = 4 samples. This outcome leads us to conclude that the enthalpy-entropy compensation observed in the Ti30V60Mn(10−x)Crx (x = 0, 3.3, 6.6 and 10) + 4 wt.% Zr BCC alloys is not a statistical artifact at a confidence level higher than 95% but lower than 99%.
3. Materials and Methods
3.1. Alloy Synthesis
Alloys with the nominal compositions Ti30V60Mn(10−x)Crx (x = 0, 3.3, 6.6 and 10) + 4 wt.% Zr were prepared using the arc melting method under argon atmosphere. The raw materials, vanadium (irregular pieces, 99.7%), titanium (sponge, 3–19 mm, 99.95%), manganese (irregular pieces, 99.5%), chromium (irregular pieces, 99.0%) and zirconium (sponge 0.8–25.4 mm, 99.95%), were purchased from Alfa-Aesar (Ward Hill, MA, USA). Each ingot (~3 g) was remelted and turned over three times to ensure homogeneity. The obtained as-cast alloys in button shape were mechanically crushed using a mortar and pestle in an argon-filled glovebox.
3.2. Structure Analysis
The phase composition and crystal structure of the alloys were investigated by X-ray diffraction (XRD) technique using a Bruker D8 powder diffractometer (Madison, WI, USA) having Cu Kα radiation. The XRD patterns were analyzed by Rietveld’s method using Topas software (V6) to determine the lattice parameters, crystallite size and phase abundance [46].
3.3. Pressure-Composition-Isotherms (PCIs) Measurements
The PCI desorption curves at various temperatures were measured using a home-made Sievert-type apparatus [47]. Prior to each PCI experiment, the following sequence was repeated:
The sample was activated at 298 K under 2 MPa of hydrogen. Once complete absorption was achieved, the sample was heated up to the desired temperature under hydrogen pressure to prevent its desorption. Once the first desorption isotherm was recorded, the sample was kept under a dynamic vacuum at 573 K for 2 h to ensure complete desorption. After this process, the sample was considered fully desorbed. Subsequently, the temperature was lowered back to room temperature for the absorption process. The same process was repeated to register the PCI desorption at different temperatures. After each PCI measurement, the sample was pumped again at 573 K for one hour to ensure complete dehydrogenation. This specific temperature was chosen based on X-ray diffraction analysis performed after a similar desorption step; the recovery of the Body Centered Cubic (BCC) structure, initially present after synthesis, confirms the complete desorption of the material.
4. Conclusions
In this study, we investigated the desorption thermodynamics of Ti30V60Mn(10−x)Crx (x = 0, 3.3, 6.6 and 10) + 4 wt.% Zr alloy, building on our previous investigation of the microstructure, crystal structure, and hydrogen absorption properties of these materials.
We found that the isotherms are strongly dependent on the compositions, with a higher Cr content resulting in increased pressures.
The reversible capacities of Ti30V60Mn(10−x)Crx (x = 0, 3.3, 6.6 and 10) + 4 wt.% Zr alloy measured using PCI (between 1.4 and 1.6 wt.%) did not account for the desorption capacity of the monohydride at a very low pressure. This means that only the dihydride reaction is practically reversible.
Through Van’t Hoff plots, the desorption enthalpy (∆Hdes) and entropy (∆Sdes) were obtained. A plot of the entropy vs. enthalpy shows a straight line that indicates an entropy-enthalpy compensation. The compensation temperature of 499.93 K is in agreement with the temperature where all Van’t Hoff plots converge (500 K), providing crucial insights, as it represents the temperature at which all compositions exhibit the same equilibrium pressure.
The degree of confidence of the entropy-enthalpy compensation was checked using the combined K-CQF test designed by Griessen and Dam [35]. We found that the enthalpy-entropy compensation is not due to statistical origin, with a confidence of more than 95%.
Supplementary Materials
The following supporting information can be downloaded at: https://www.mdpi.com/article/10.3390/inorganics11120479/s1, Figure S1: PCI desorption curves at 423, 448, 473 and 498 K (a) and Van’t plot of Ti30V60Mn10 + 4 wt.% Zr alloy (b). Figure S2: PCI desorption curves at 423, 448, 473, 483 and 498 K (a) and Van’t Hoff plot of Ti30V60Mn6.6Cr3.3 + 4 wt.% Zr alloy (b). Figure S3: PCI desorption at 423, 448, 473 and 498 K (a) and Van’t Hoff plot of Ti30V60Mn3.3Cr6.6 + 4 wt.% Zr alloy (b). Figure S4: PCI desorption at 398, 423, 448 and 498 K (a) and Van’t plot of Ti30V60Cr10 + 4 wt.% Zr alloy (b).
Author Contributions
Conceptualization, C.K. and J.H.; methodology, J.H.; validation, C.K. and J.H.; formal analysis, C.K. and J.H.; investigation, C.K.; writing—original draft preparation, C.K.; writing—review and editing, C.K. and J.H.; visualization,.; supervision, J.H. All authors have read and agreed to the published version of the manuscript.
Funding
This research was funded in part by a Natural Sciences and Engineering Research Council of Canada discovery grant.
Data Availability Statement
The data presented in this study are available on request from the corresponding author.
Acknowledgments
The authors would like to thank Ronald Griessen of VU University Amsterdam for a useful discussion.
Conflicts of Interest
The authors declare no conflict of interest.
References
- Yu, X.; Wu, Z.; Xia, B.; Huang, T.; Chen, J.; Wang, Z.; Xu, N. Hydrogen storage in Ti–V-based body-centered-cubic phase alloys. J. Mater. Res. 2003, 18, 2533–2536. [Google Scholar] [CrossRef]
- Pickering, L.; Li, J.; Reed, D.; Bevan, A.I.; Book, D. Ti–V–Mn based metal hydrides for hydrogen storage. J. Alloys Compd. 2013, 580, S233–S237. [Google Scholar] [CrossRef]
- Pickering, L.; Reed, D.; Bevan, A.I.; Book, D. Ti–V–Mn based metal hydrides for hydrogen compression applications. J. Alloys Compd. 2015, 645, S400–S403. [Google Scholar] [CrossRef]
- Nakamura, Y.; Akiba, E. New hydride phase with a deformed FCC structure in the Ti–V–Mn solid solution–hydrogen system. J. Alloys Compd. 2000, 311, 317–321. [Google Scholar] [CrossRef]
- Akiba, E.; Iba, H. Hydrogen absorption by Laves phase related BCC solid solution. Intermetallics 1998, 6, 461–470. [Google Scholar] [CrossRef]
- Akiba, E.; Okada, M. Metallic Hydrides III: Body-Centered-Cubic Solid-Solution Alloys. MRS Bull. 2002, 27, 699–703. [Google Scholar] [CrossRef]
- Ruz, P.; Banerjee, S.; Halder, R.; Kumar, A.; Sudarsan, V. Thermodynamics, kinetics and microstructural evolution of Ti0.43Zr0.07Cr0.25V0.25 alloy upon hydrogenation. Int. J. Hydrogen Energy 2017, 42, 11482–11492. [Google Scholar] [CrossRef]
- Yukawa, H.; Teshima, A.; Yamashita, D.; Ito, S.; Yamaguchi, S.; Morinaga, M. Alloying effects on the hydriding properties of vanadium at low hydrogen pressures. J. Alloys Compd. 2002, 337, 264–268. [Google Scholar] [CrossRef]
- Balcerzak, M. Hydrogenation properties of nanocrystalline TiVMn body-centered-cubic alloys. Int. J. Hydrogen Energy 2020, 45, 15521–15529. [Google Scholar] [CrossRef]
- Chen, R.; Chen, X.; Ding, X.; Li, X.; Guo, J.; Ding, H.; Su, Y.; Fu, H. Effects of Ti/Mn ratio on microstructure and hydrogen storage properties of Ti-V-Mn alloys. J. Alloys Compd. 2018, 748, 171–178. [Google Scholar] [CrossRef]
- Chen, X.Y.; Chen, R.R.; Ding, X.; Fang, H.Z.; Guo, J.J.; Ding, H.S.; Su, Y.Q.; Fu, H.Z. Crystal structure and hydrogen storage properties of Ti-V-Mn alloys. Int. J. Hydrogen Energy 2018, 43, 6210–6218. [Google Scholar] [CrossRef]
- Iba, H.; Akiba, E. Hydrogen absorption and modulated structure in Ti–V–Mn alloys. J. Alloys Compd. 1997, 253–254, 21–24. [Google Scholar] [CrossRef]
- Matsuda, J.; Nakamura, Y.; Akiba, E. Microstructure of Ti–V–Mn BCC alloys before and after hydrogen absorption–desorption. J. Alloys Compd. 2011, 509, 4352–4356. [Google Scholar] [CrossRef]
- Shibuya, M.; Nakamura, J.; Enoki, H.; Akiba, E. High-pressure hydrogenation properties of Ti–V–Mn alloy for hybrid hydrogen storage vessel. J. Alloys Compd. 2009, 475, 543–545. [Google Scholar] [CrossRef]
- Iba, H.; Akiba, E. The relation between microstructure and hydrogen absorbing property in Laves phase-solid solution multiphase alloys. J. Alloys Compd. 1995, 231, 508–512. [Google Scholar] [CrossRef]
- Tamura, T.; Kazumi, T.; Kamegawa, A.; Takamura, H.; Okada, M. Effects of Protide Structures on Hysteresis in Ti-Cr-V Protium Absorption Alloys. Mater. Trans. 2002, 43, 2753–2756. [Google Scholar] [CrossRef]
- Wang, Q.; Dai, X.; Wu, C.; Mao, Y.; Chen, Y.; Cao, X.; Yan, Y.; Wang, Y.; Zhang, H. Lattice defects and micro-strains in V60Ti25Cr3Fe12 alloy and influence on the ab/desorption of hydrogen. J. Alloys Compd. 2020, 830, 154675. [Google Scholar] [CrossRef]
- Wu, C.; Wang, Q.; Mao, Y.; Huang, L.; Chen, Y.; Dai, X. Relationship between lattice defects and phase transformation in hydrogenation/dehydrogenation process of the V60Ti25Cr3Fe12 alloy. Int. J. Hydrogen Energy 2019, 44, 9368–9377. [Google Scholar] [CrossRef]
- Nakamura, Y.; Akiba, E. Hydriding properties and crystal structure of NaCl-type mono-hydrides formed from Ti–V–Mn BCC solid solutions. J. Alloys Compd. 2002, 345, 175–182. [Google Scholar] [CrossRef]
- Okada, M.; Kuriiwa, T.; Tamura, T.; Takamura, H.; Kamegawa, A. Ti–V–Cr b.c.c. alloys with high protium content. J. Alloys Compd. 2002, 330–332, 511–516. [Google Scholar] [CrossRef]
- Suwarno, S.; Solberg, J.; Maehlen, J.; Krogh, B.; Yartys, V. Influence of Cr on the hydrogen storage properties of Ti-rich Ti–V–Cr alloys. Int. J. Hydrogen Energy 2012, 37, 7624–7628. [Google Scholar] [CrossRef]
- Young, K.; Ouchi, T.; Nei, J.; Meng, T. Effects of Cr, Zr, V, Mn, Fe, and Co to the hydride properties of Laves phase-related body-centered-cubic solid solution alloys. J. Power Sources 2015, 281, 164–172. [Google Scholar] [CrossRef]
- Nygård, M.M.; Sørby, M.H.; Grimenes, A.A.; Hauback, B.C. The Influence of Fe on the Structure and Hydrogen Sorption Properties of Ti-V-Based Metal Hydrides. Energies 2020, 13, 2874. [Google Scholar] [CrossRef]
- Yu, X.; Wu, Z.; Xia, B.; Xu, N. Enhancement of hydrogen storage capacity of Ti–V–Cr–Mn BCC phase alloys. J. Alloys Compd. 2004, 372, 272–277. [Google Scholar] [CrossRef]
- Bibienne, T.; Tousignant, M.; Bobet, J.-L.; Huot, J. Synthesis and hydrogen sorption properties of TiV(2−x)Mnx BCC alloys. J. Alloys Compd. 2015, 624, 247–250. [Google Scholar] [CrossRef]
- Boots, H.M.J.; De Bokx, P.K. Theory of enthalpy-entropy compensation. J. Phys. Chem. 1989, 93, 8240–8243. [Google Scholar] [CrossRef]
- McNaught, A.D.; Wilkinson, A. Compendium of Chemical Terminology: IUPAC Recommendations; Blackwell Science: Oxford, UK, 1997; Volume 1669. [Google Scholar]
- Fenley, A.T.; Muddana, H.S.; Gilson, M.K. Entropy–enthalpy transduction caused by conformational shifts can obscure the forces driving protein–ligand binding. Proc. Natl. Acad. Sci. USA 2012, 109, 20006–20011. [Google Scholar] [CrossRef]
- Gilli, P.; Ferretti, V.; Gilli, G.; Borea, P.A. Enthalpy-entropy compensation in drug-receptor binding. J. Phys. Chem. 1994, 98, 1515–1518. [Google Scholar] [CrossRef]
- Mellot-Draznieks, C.; Valayannopoulos, V.; Chrétien, D.; Munnich, A.; de Lonlay, P.; Toulhoat, H. Relative Enzymatic Activity Levels from In Silico Mutagenesis. ACS Catal. 2012, 2, 2673–2686. [Google Scholar] [CrossRef]
- Eder, F.; Lercher, J.A. Alkane sorption in molecular sieves: The contribution of ordering, intermolecular interactions, and sorption on Brønsted acid sites. Zeolites 1997, 18, 75–81. [Google Scholar] [CrossRef]
- Toulhoat, H.; Lontsi Fomena, M.; de Bruin, T. Computational Study of the Effect of Confinement within Microporous Structures on the Activity and Selectivity of Metallocene Catalysts for Ethylene Oligomerization. J. Am. Chem. Soc. 2011, 133, 2481–2491. [Google Scholar] [CrossRef]
- Tang, W.S.; Chotard, J.-N.; Raybaud, P.; Janot, R. Enthalpy–Entropy Compensation Effect in Hydrogen Storage Materials: Striking Example of Alkali Silanides MSiH3 (M = K, Rb, Cs). J. Phys. Chem. C 2014, 118, 3409–3419. [Google Scholar] [CrossRef]
- Anastasopol, A.; Pfeiffer, T.V.; Middelkoop, J.; Lafont, U.; Canales-Perez, R.J.; Schmidt-Ott, A.; Mulder, F.M.; Eijt, S.W.H. Reduced Enthalpy of Metal Hydride Formation for Mg–Ti Nanocomposites Produced by Spark Discharge Generation. J. Am. Chem. Soc. 2013, 135, 7891–7900. [Google Scholar] [CrossRef]
- Griessen, R.; Boelsma, C.; Schreuders, H.; Broedersz, C.P.; Gremaud, R.; Dam, B. Single Quality Factor for Enthalpy-Entropy Compensation, Isoequilibrium and Isokinetic Relationships. ChemPhysChem 2020, 21, 1632–1643. [Google Scholar] [CrossRef]
- Griessen, R.; Dam, B. Simple Accurate Verification of Enthalpy-Entropy Compensation and Isoequilibrium Relationship. ChemPhysChem 2021, 22, 1774–1784. [Google Scholar] [CrossRef]
- Zeng, G.; Goldbach, A.; Shi, L.; Xu, H. Compensation Effect in H2 Permeation Kinetics of PdAg Membranes. J. Phys. Chem. C 2012, 116, 18101–18107. [Google Scholar] [CrossRef]
- Lubianiker, Y.; Balberg, I. Two Meyer-Neldel rules in porous silicon. Phys. Rev. Lett. 1997, 78, 2433–2436. [Google Scholar] [CrossRef]
- Ullah, M.; Singh, T.B.; Sitter, H.; Sariciftci, N. Meyer–Neldel rule in fullerene field-effect transistors. Appl. Phys. A 2009, 97, 521–526. [Google Scholar] [CrossRef]
- Widenhorn, R.; Mündermann, L.; Rest, A.; Bodegom, E. Meyer–Neldel rule for dark current in charge-coupled devices. J. Appl. Phys. 2001, 89, 8179–8182. [Google Scholar] [CrossRef][Green Version]
- Bibienne, T.; Bobet, J.-L.; Huot, J. Crystal structure and hydrogen storage properties of body centered cubic 52Ti–12V–36Cr alloy doped with Zr7Ni10. J. Alloys Compd. 2014, 607, 251–257. [Google Scholar] [CrossRef]
- Bibienne, T.; Razafindramanana, V.; Bobet, J.-L.; Huot, J. Synthesis, characterization and hydrogen sorption properties of a Body Centered Cubic 42Ti–21V–37Cr alloy doped with Zr7Ni10. J. Alloys Compd. 2015, 620, 101–108. [Google Scholar] [CrossRef]
- Dixit, V.; Huot, J. Investigation of the microstructure, crystal structure and hydrogenation kinetics of Ti-V-Cr alloy with Zr addition. J. Alloys Compd. 2019, 785, 1115–1120. [Google Scholar] [CrossRef]
- Kamble, A.; Sharma, P.; Huot, J. Effect of addition of Zr, Ni, and Zr-Ni alloy on the hydrogen absorption of Body Centred Cubic 52Ti-12V-36Cr alloy. Int. J. Hydrogen Energy 2018, 43, 7424–7429. [Google Scholar] [CrossRef]
- Kefi, C.; Huot, J. Microstructure and First Hydrogenation Properties of Ti30V60Mn(10−x)Crx (x = 0, 3.3, 6.6, 10) + 4 wt.% Zr. Metals 2023, 13, 1119. [Google Scholar] [CrossRef]
- Evans, J.S.O. Advanced input files & parametric quantitative analysis using topas. Mater. Sci. Forum 2010, 1–9. [Google Scholar] [CrossRef]
- Schulz, R.; Boily, S.; Huot, J. Apparatus for Titration and Circulation of Gases and Circulation of an Absorbent or Adsorbent Substance. U.S. Patent No. 6,582,663, 24 June 2003. [Google Scholar]
Disclaimer/Publisher’s Note: The statements, opinions and data contained in all publications are solely those of the individual author(s) and contributor(s) and not of MDPI and/or the editor(s). MDPI and/or the editor(s) disclaim responsibility for any injury to people or property resulting from any ideas, methods, instructions or products referred to in the content. |
© 2023 by the authors. Licensee MDPI, Basel, Switzerland. This article is an open access article distributed under the terms and conditions of the Creative Commons Attribution (CC BY) license (https://creativecommons.org/licenses/by/4.0/).