Abstract
Photodynamic therapy (PDT) is an effective technique for cancer treatment based on photoactivation of photosensitizer accumulated in pathological tissues resulting in singlet oxygen production. Employment of red (660 nm) or blue (405 nm) light differing in typical penetration depth within the tissue for PDT performance provides wide opportunities for improving PDT protocols. Oxygenation dynamics in the treated area can be monitored using diffuse optical spectroscopy (DOS) which allows evaluating tumor response to treatment. In this study, we report on monitoring oxygenation dynamics in experimental tumors after PDT treatment with chlorin-based photosensitizers using red or blue light. The untreated and red light PDT groups demonstrate a gradual decrease in tumor oxygen saturation during the 7-day observation period, however, the reason is different: in the untreated group, the effect is explained by the excessive tumor growth, while in the PDT group, the effect is caused by the blood flow arrest preventing delivery of oxygenated blood to the tumor. The blue light PDT procedure, on the contrary, demonstrates the preservation of the blood oxygen saturation in the tumor during the entire observation period due to superficial action of the blue-light PDT and weaker tumor growth inhibition. Irradiation-only regimes show a primarily insignificant decrease in tumor oxygen saturation owing to partial inhibition of tumor growth. The DOS observations are interpreted based on histology analysis.
1. Introduction
Photodynamic therapy (PDT) is one of the promising methods for cancer treatment consisting in the use of photoactive drugs—photosensitizers (PS)—that are accumulated in tumor tissue and after light irradiation induce photochemical reactions with the formation of reactive oxygen species destructing the cells []. The main mechanisms for the implementation of PDT therapeutic action are direct toxic effects on cancer cells, damage to the tumor-supplying vascular system and initiation of immune responses [].
The effectiveness of PDT treatment largely depends on the initial oxygen content in a tumor, and alterations of tumor oxygenation are considered as one of the key indicators of PDT efficacy. First of all, in the case of successful PDT performance, oxygen is rapidly consumed during the PDT procedure in order to supply photodynamic reactions progress [,]. Later changes in oxygen concentration may occur due to vascular reactions to PDT since the vascular collapse and blood flow stasis caused by the destruction of the endothelial cells of vessel walls [] result in a local drop of tissue oxygenation. It has been reported that prolonged hypoxia and blood flow arrest occurring as a result of PDT may be considered as markers of effective treatment [,,]. Complete tumor response to PDT treatment was demonstrated to be accompanied by a decrease or even a full interruption in the tumor blood flow and an oxygenation drop that persist for several days after irradiation. In tumors with partial response to treatment, only a temporary blood flow arrest together with a decrease in oxygenation was observed [].
Measurement of the tumor oxygenation level after PDT has potential as a predictive criterion for tumor response to different PDT regimens. In particular, this approach can serve as an additional monitoring modality in comparative analysis of PDT regimens with different PS administration and irradiation schemes, including different activation wavelengths in the case of more than one absorption band []. Chlorin e6 is a modern, widely employed photosensitizer with several absorption bands and high singlet oxygen quantum yield ranging from 0.61 to 0.75 measured by different groups at wavelengths from 347 to 660 nm []. The absorption spectrum of chlorin e6 in the visible region of the spectrum is characterized by the presence of a high-intensity Soret band at a wavelength of 403 nm, the presence of a plateau in the wavelength range of 450–615 nm, as well as a pronounced peak at a wavelength of 653 nm (Figure 1) [,].
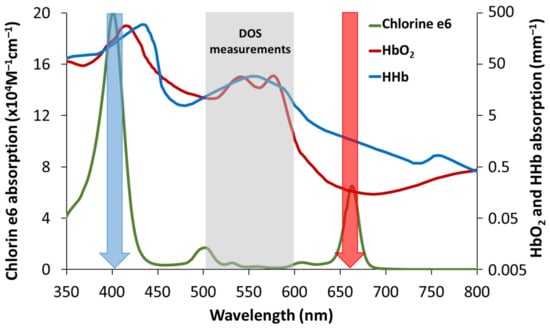
Figure 1.
Typical absorption spectra of the chlorin e6 photosensitizer [,] and oxy- and deoxyhemoglobin. Blue and red arrows indicate wavelengths for PDT light irradiation corresponding to local peaks of absorption 403 and 653 nm. High absorption of hemoglobin in the vicinity of 400 nm compared to 660 nm provides lower light penetration depth. The wavelength range for DOS evaluation is marked with grey. It corresponds to strong relative variations in HbO2 and HHb spectra and rather low chlorine e6 absorption.
Different techniques for tissue oxygenation monitoring are employed to investigate the effect of PDT on the tumor. The most common in vivo techniques include polarography, electron paramagnetic resonance imaging, optoacoustic imaging, and diffuse optical spectroscopy [,,,].
Diffuse optical spectroscopy (DOS) allows estimating the concentrations of main tissue chromophores (oxyhemoglobin (HbO2), deoxyhemoglobin (HHb), lipids, and water) in vivo [,,]. The difference in oxy- and deoxyhemoglobin absorption in visible and near-infrared bands allow us to evaluate their partial contribution based on DOS measurements. With the known oxyhemoglobin/deoxyhemoglobin ratio, one can calculate the blood oxygen tissue saturation (StO2), which is an indirect oxygenation indicator []. Moreover, direct calculation of the concentration of each hemoglobin form which reflects either the delivery of oxygen to tissues (oxyhemoglobin) or its consumption or outflow (deoxyhemoglobin) allows revealing the mechanisms of changes in tissue oxygenation [,]. Total hemoglobin (tHb) concentration is generally considered as a measure of tissue blood content: tHb = HbO2 + HHb.
Currently, DOS is applied in clinical oncology for diagnosing neoplasms of various localizations, monitoring tumor reactions to therapy, and predicting its efficacy [,,,,,]. In experimental oncology, this technique is promising for studies of tumor models' oxygenation levels during growth and after various therapeutic treatments [,,,].
DOS has previously demonstrated its feasibility in studying tumor response to photodynamic treatment [,]. The dynamics of experimental tumor oxygenation have been studied using DOS after red light PDT with chlorin–e6 PS [,]. However, this method has not been used to date to compare the tumor reaction on different PDT regimens. In this work for the first time, we compared experimental tumor oxygenation dynamics registered with DOS as a response to PDT treatment with chlorin-based photosensitizers performed with red (660 nm) and blue (405 nm) light.
2. Materials and Methods
2.1. PDT Protocols in Animal Study
The animal studies were approved by the Ethics Committee of Privolzhsky Research Medical University (Protocol #7, 03.07.2017). The experiments were carried out on a model of murine colon carcinoma CT26 (ATCC No CRL-2638) in 2-months-old female Balb/c mice weighing 20–25 g (n 18). Cells were injected subcutaneously in the amount of 5 × 10⁵ in 100 μL of PBS into the outer side of the left shin of an experimental animal. Experiments were started from the 7th day after tumor inoculation when its linear size reached 3–5 mm. Irradiation of tumors was applied only once, on day 0 while measurements of the tumor size and DOS measurements were performed also on days 1, 3, and 7 after PDT. Prior to the PDT procedure, irradiation and measurements the mice were anesthetized with the intramuscular injection of the mixture of 40 mg/kg Zoletil (Valdepharm, France) and 10 mg/kg XylaVet (Alpha-Vet Veterinary Ltd., Hungary) and the tumor region was depilated.
The animals were divided into five groups: untreated animals (n 5), PDT at the wavelength of 660 nm (n 3), PDT at the wavelength of 405 nm (n 3), irradiation only at 660 nm (n 3), irradiation only at 405 nm (n 3). For PDT the chlorin e6-based photosensitizer Photolon (Vetagrand, Russia) was used. The drug was injected into the tail vein at a dose of 5 mg/kg, irradiation was performed 2 hours after drug administration. Untreated animals received saline instead of the Photolon solution. For irradiation, the PDT device “Harmonia” (Laser MedCenter Ltd., Russia) equipped with LED arrays at the wavelengths of 405 and 660 nm was used. Irradiation was carried out at doses of 250 and 200 J/cm2 for red and blue light, respectively.
2.2. DOS Measurements
DOS measurements were performed with a setup (Figure 2a) equipped with a fiber-optic contact probe (Figure 2b) in reflectance mode (IAP RAS, Russia) []. This method is also known as Diffuse Reflectance Spectroscopy. The setup employs a broadband 430–675 nm (at the level of 0.1 from the maximum) LED MCWHF2 (Thorlabs Inc., Newton, NJ, USA) with fiber output as a source of optical radiation, and a cooled QE65000 spectrometer (Ocean Optics Inc., Largo, FL, USA) as a detector. The probe includes three optical fibers of 400 μm in diameter (Polironik LLC, Moscow, Russia) located in a line at a fixed distance of d = 1.75 mm from each other. The central and the neighboring fibers served for delivery of probing radiation, while the last fiber was used for detection of radiation backscattered by a tissue, resulting in the two source-detector separation distances of 1.75 and 3.5 mm. A fiber-optic switch F-104-03 (Piezosystem Jena, Jena, Germany) allows to switch the illumination channels. The backscattered light is collected within 1 s (10 averaged spectrometer acquisitions, each has 100 ms integration time) for each source position. The background light caused by ambient illumination is collected with the same acquisition parameters when the LED source is switched off and subtracted from the backscattered measured spectrum. The switching time between the two illumination channels is rather low and takes about 100 ms. The data acquisition process is fully automated, and a single DOS measurement takes about 3 s.
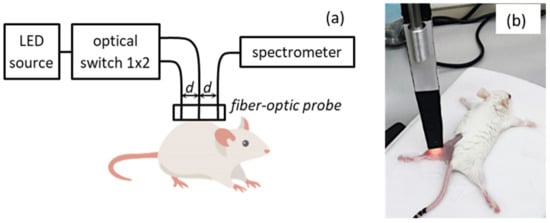
Figure 2.
Schematic of the DOS setup (a) and a photo of DOS measurement procedure (b).
The position of the DOS probe on the animal’s skin surface was selected avoiding areas with PDT-induced scabs. The registration of DOS intensity spectra from tumor tissue was performed prior to treatment (day 0), and on days 1, 3, and 7 after PDT. For each tumor, 3–5 spectral measurements with varying positions of a probe were performed and all spectra without artifacts were averaged.
Before each DOS measurement, the linear dimensions of the tumor were measured with a caliper in three mutually perpendicular directions. The tumor volume was calculated using the formula:
where a, b, and c are tumor length, width, and height, respectively.
V = (4/3) × π × (a/2) × (b/2) × (c/2)
2.3. Evaluation of Blood Oxygenation Characteristics from DOS Measurements
DOS measurements are generally aimed at the evaluation of the biotissue absorption spectrum from the measured spectrum of backscattered intensity with further extraction of blood oxygenation characteristics []. According to the diffusion approximation of radiative transfer equation (RTE) [], the ratio between spectral intensities I1(λ) and I2(λ) of the backscattered light detected at two source-detector separations and , correspondingly, is related to a combination of tissue optical properties at a given wavelength:
where and are the transient characteristics of the first and the second channels, correspondingly, and are the spectra of biotissue absorption coefficient and reduced scattering, respectively. As one can see from Equation (2), both source spectral intensity and detector spectral sensitivity are compensated in the ratiometric approach provided that the illumination intensities are equal.
To estimate the ratio between transient characteristics of the DOS setup, we applied the calibration procedure by measuring the intensities and from a tissue-like silicone phantom with known spectra of absorption () and reduced scattering (). These spectra were evaluated from the spectrophotometry measurements using spectrophotometer Specord 250 Plus (Analytik Jena, Germany) equipped with an integrating sphere. By using Equation(2), the ratio can be evaluated as:
Since the separate reconstruction of and from Equation (2) solely is not possible, one should decrease the dimension of the problem by employing particular assumptions. Typically, a standard approximation by a power function of the wavelength λ is assumed for the reduced scattering coefficient, while the absorption coefficient is presented as the weighted sum of spectra of all the tissue chromophores []:
where α and β are the fitting parameters, StO2 is tissue oxygenation, tHb is a total hemoglobin concentration, and , , and are, respectively, the table normalized absorption spectra of oxy-, deoxyhemoglobin and other chromophores (water, lipids, melanin) taken from []. The abovementioned unknown values can be determined by the numerical solution of the following optimization problem
using the measured spectral ratio , calibration result on , and the analytical model (4) for and . The problem (5) was solved by the pretrained artificial neural network described in [], which provides better accuracy in comparison to standard optimization methods. The values of tHb and StO2 are used for subsequent calculations of oxy- and deoxyhemoglobin concentrations as and correspondingly, and the absorption spectra using the Equation (4).
It should be noted that the optimization problem (4) is solved using a narrower wavelength range of 520–590 nm compared to the detection range of the DOS setup (430–675 nm). The range of 520–590 nm is wide enough to take into account the oscillations in and spectral shapes (Figure 1), while it is narrow enough for the consistency of the analytical approximation for the tissue chromophores absorption and the reduced scattering coefficient in Equation (4), which are responsible for the accuracy in the assessment of StO2 and tHb values. Besides, the absorption of chlorin–e6 in this spectral range is rather weak and the spectral shape is flat (Figure 1), thus it should not affect the DOS measurements results.
2.4. Histology Studies
Seven days after PDT, tumors with underlying muscle tissues were taken for histopathological analysis. Histological images were acquired using a Panoramic MIDI scanning microscope (3DHISTECH, Hungary) after standard H&E staining of tissue samples. Since the microcirculatory system supplying a tumor with oxygen is located in the surrounding normal tissues, we analyzed their morphology based on the alterations typical for local hypoxia. The state of the vessels located in the peripheral tissues and the state of myocytes were assessed. The morphological characteristics of the vessels, such as the atrophy or destruction of vessels endothelium, presence of stasis, sludge, or thrombosis are direct indicators of microcirculatory disorders. Fragmentation of myocytes occurring as a result of the systemic shortage of oxygen supply in the peripheral tissue may serve as an additional indicator of prolonged local tissue hypoxia. The study included quantification of peripheral tissues microcirculatory system disorders and myocyte fragmentation. A qualified histologist has evaluated each alteration in accordance with a 5–grade score (Table 1) in the frames of the blind recognition test.

Table 1.
Score system for evaluation of alterations in myocytes and microcirculatory system in peripheral tissues.
2.5. Statistical Analysis
Data on tumor growth are presented as normalized to the baseline mean values (M) of tumor volume prior to treatment and standard deviations (SD). Data on levels of HHb, HbO2, tHb, StO2 are presented as averaged values and standard errors of means (SEM).
Scores for myocyte fragmentation and microcirculatory system disorders are presented as averaged values and standard deviations.
One-way ANOVA with Duncan’s test for multiple comparisons was used to determine the statistical significance of differences between treatment groups. The differences were considered statistically significant at p < 0.05. The statistical data were processed in MS Excel 2010 and STATISTICA.10 (StatSoft Inc., Tulsa, OK, USA).
3. Results
3.1. Tumor Growth Dynamics
Figure 3 shows the dynamics of CT26-tumor growth after PDT treatment with chlorin e6-based photosensitizer Photolon. During the monitoring period, the average normalized volume of the untreated tumors increased approximately ten times. Irradiation of tumors without a photosensitizer with red light (λ = 660 nm) did not cause inhibition of tumor growth at the end of the experiment. For blue light irradiation (λ = 405 nm), the average tumor volume in 7 days after treatment was only about 30% smaller compared to the untreated group, which indicated insufficient tumor growth inhibition. Both PDT groups show high treatment efficacy: blue-light PDT induced reduction of the average tumor volume of more than 60% compared to the untreated group, however, the difference in volume values with the untreated group is not statistically significant. Statistically significant difference in tumor volumes was found on day 7 between groups subjected to PDT at λ = 660 nm and both untreated (p = 0.02) and red-light irradiated (p = 0.03) groups. For the red-light PDT group on day 7 after treatment tumor nodes were not palpated.
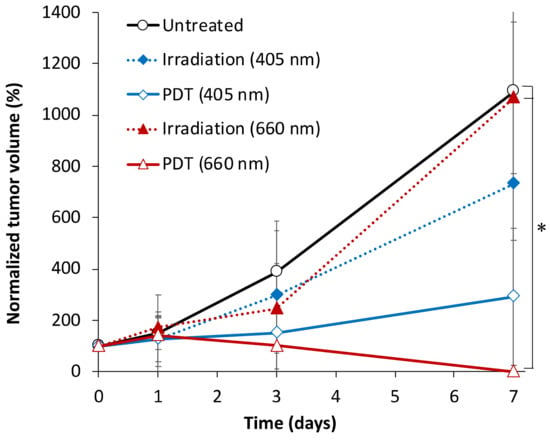
Figure 3.
CT26 tumor volume dynamics after red- and blue-light PDT with Photolon and red- and blue-light irradiation only treatment. The data presented as M±SD, asterisk (*) shows statistically significant difference between the treatment groups (p < 0.05, one-way ANOVA with Duncan test).
3.2. Tumor Oxygenation Dynamics Evaluated from DOS Measurements
Figure 4 shows the examples of the reconstructed absorption spectra obtained for tumor tissue before the PDT procedure and on day 3 and day 7 after it. Before treatment, the tumor absorption spectra shapes were similar for all animal groups, suggesting similar relative content of chromophores in the tumors. The spectra demonstrate a relatively high level of blood oxygen saturation prior to the experiment represented by two pronounced maxima around 540 and 570 nm with a subsequent oxygen saturation decrease in the untreated and red-light PDT groups on days 3 and 7 manifested by the absorption spectrum shape with a single-maximum at 550 nm corresponding to the local peak of HHb absorption. At the end of monitoring the predominance of oxyhemoglobin by the two-peaked spectrum shape is observed for blue-light PDT group only.
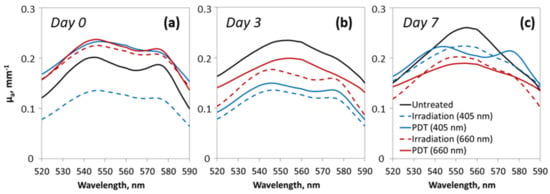
Figure 4.
Typical reconstructed absorption spectra of tumor tissue before the experiment on day 0 (a), and on day 3 (b) and day 7 (c) after the irradiation procedure.
The averaged values of StO2, HHb, HbO2, tHb calculated from the absorption spectra are shown in Figure 5. At the beginning of the monitoring period, the StO2 values of CT26 tissue were in the range of 20–30%. These values are in agreement with the results of other researchers obtained by diffuse reflectance spectroscopy using a probe with 2–4 mm source-detector separation []. In the untreated group, the level of StO2 gradually decreased with the tumor growth from 27.5 ± 3.6% to 3.4 ± 1.5% on day 7. A similar decrease was observed for the PDT group with red light; however, this group demonstrates a more rapid decrease in the oxygen saturation level in 1 day after the procedure. Tumors irradiated at 660 nm and 405 nm without photosensitizer showed the highest StO2 level on day 3 after the treatment (26.0 ± 7.1% and 32.8 ± 8.4% respectively) with statistically significant differences from the untreated and the red-light PDT treated groups (p < 0.05), although in 1 day after the treatment both irradiation only groups demonstrated an insignificant decrease in StO2. The level of StO2 in the blue-light (405 nm) PDT group remained elevated throughout the whole observation period (Figure 5a) (statistically significant differences from the untreated group on day 3 and day 7) indicating improved oxygenation in the tumor tissue.
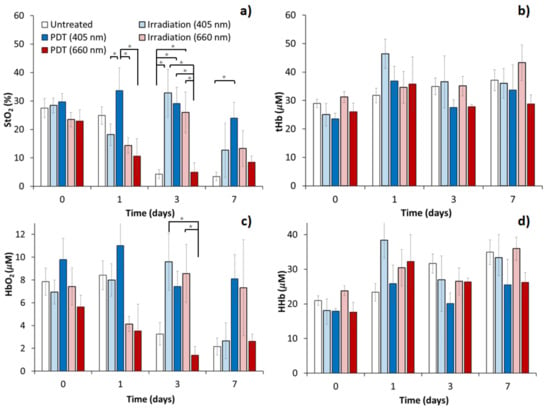
Figure 5.
Blood oxygen saturation level (a), total hemoglobin (b), oxyhemoglobin (c) and deoxyhemoglobin (d) content in CT26 tumor estimated by DOS after red- and blue-light PDT with Photolon and red- and blue-light irradiation only treatment. The data presented as M±SEM, asterisk (*) shows statistically significant differences between the treatment groups (p < 0.05, one-way ANOVA with Duncan test).
The concentration of oxyhemoglobin in the CT26 tumor (Figure 5c) prior to treatment was in the range of 5–10 μM across all considered groups. A gradual decrease in the concentration of HbO2 was observed for the untreated (to 2.2 ± 0.7 μM on day 7) and the red-light PDT treated (to 2.6 ± 0.6 μM on day 7) groups of animals indicating that the variations in StO2 are primarily governed by variations in HbO2. A temporary insignificant decrease was observed for the red-light irradiation group, which is in line with StO2 observations. Both the blue-light (405 nm) PDT and the irradiation only groups demonstrated a high level of HbO2 during all the monitoring periods, except day 7 for the blue-light irradiation group. On day 3 after the treatment statistically significant differences were detected between the red-light PDT and both the red-light (p = 0.03) and the blue-light (p = 0.01) irradiation groups. This may indicate the differences in the delivery of oxygen to tumor tissue as a response to different PDT regimens in different groups.
The average total hemoglobin concentration in CT26 tumors (Figure 5b) on the initial day of monitoring amounted to 20–35 μM. For deoxyhemoglobin (Figure 5d) it was in the range of 17–25 μM on average. No statistically significant differences in the content of tHb and HHb were detected between tumors of different groups after treatment. After the red light, PDT concentrations of HHb and tHb exceeded that with blue light only slightly. This may reflect the absence of significant changes in blood content and oxygen consumption/outflow in CT26 tumors in response to both PDT and irradiation without photosensitizer at any wavelength.
In the contralateral zone of healthy muscle tissue of animals, the StO2 level measured by DOS remained unchanged and ranged within 30 ± 8% during the entire period of the experiment (data not shown).
Note that we did not encounter any significant effect of the PS on the registered spectra – neither chlorin e6 absorption with a spectral peak at 660 nm nor PS fluorescence with an emission peak at 670 nm. It follows from the ratio of the spectra taken before and after PS injection at the maximum source-detector separation of 3.5 mm (Appendix A, Figure A1). This ratio shows no visible peaks in the range of 600–700 nm. Both peaks on the ratio around 535 and 570 nm are reflecting HbO2 concentration changes.
3.3. Histological Analysis of Hypoxia Associated Alterations
The histological analysis allows for additional assessment of tumor hypoxia associated with either its natural growth or treatment. Figure 6 shows typical histology images of the peripheral tissue vessels for all the considered treatment regimes. The untreated group demonstrates moderate alterations in the microcirculatory system of peripheral tissues manifested by atrophy and destruction of vessel wall endothelium (Figure 6a,b), presence of stasis and/or sludges in the vessels. These alterations are presumably associated with excessive tumor growth resulting in oxygen shortage. Insufficient oxygen supply of tumor is additionally confirmed by a formation of necrotic core observed in the tumors from the untreated group.
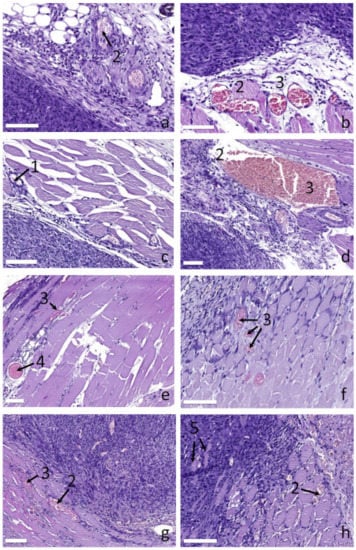
Figure 6.
Histological images of blood vessels in peripheral tissues supplying tumor for different groups: (a,b) untreated, (c) irradiation only at 660 nm, (d) irradiation only at 405 nm, (e,f) PDT at 660 nm, (g,h) PDT at 405 nm. Numbers show: (1) normal vessels, (2) destruction of vessels endothelium, (3) stasis/sludges, (4) thrombosis, (5) myocytes within tumor tissue. The bar size is 100 μm.
The red light irradiation only group demonstrates primarily unaltered vessels (Figure 6c) indicating no disorders in tumor oxygen supply. Due to an inhibition of tumor growth by the treatment, the tumor does not reach the excessive growth stage by day 7, revealing no signs of tissue hypoxia. The blue light irradiation only group (Figure 6d) shows moderate changes in the microcirculatory system of peripheral tissues comparable to those observed for the control group: stasis and sludges are detected together with atrophy and destruction of vessel wall endothelium. This is presumably associated with the stronger impact of the treatment confirmed by stronger tumor growth inhibition compared to the red light irradiation group.
The red light PDT group shows the entire spectrum of microcirculatory disorders including stasis, sludged and formation of thrombosis (Figure 6e,f). A stronger response could be explained by PDT action which has an additional vascular mechanism owing to the accumulation of PS in vessels endothelium followed by vessel wall destruction as a result of a PDT procedure. The blue light PDT group (Figure 6g,h) shows similar features of the microcirculatory system response to treatment with, however, weaker manifestation. In particular, the number of detected thromboses is lower. This is owing to a lower penetration depth of blue light as compared to red light resulting in a smaller impact to the peripheral tissues located under the tumor. It is worth noting that in the blue light PDT group the myocytes are revealed within the tumor tissue (Figure 6h), which is not observed for other groups.
Figure 7 demonstrates typical histological images of myocytes in peripheral normal tissues for different treatment regimes. The fragmentation of myocytes is manifested by the interruption of the myocyte fibrils structure in the direction perpendicular to their orientation. The analysis revealed that the control tumors are characterized by moderately fragmented myocytes (Figure 7a). Those changes presumably originate from the excessive tumor growth resulting in the insufficient oxygen supply accompanied by hypoxia of the peripheral tissues. The irradiation only regimes (Figure 7b,c for 405 and 660 nm, respectively) demonstrate unaltered or slightly altered myocytes, which is in line with the observed tumor growth dynamics for these groups and confirms slower tumor development compared to the control group. Owing to the tumor growth inhibition, the tumor does not reach the excessive growth stage in 7 days after the treatment for the irradiation only regimes, and the myocytes do not suffer from systemic hypoxia. The blue light PDT group (Figure 7d) demonstrates the presence of moderately altered myocytes as a result of the PDT procedure. The red light PDT group (Figure 7e) demonstrates primarily fragmented myocytes indicating strong tissue hypoxia. A pronounced difference in myocytes fragmentation between the red and the blue light PDT groups is governed by the fact that deeper penetration of red light compared to blue one provides stronger PDT action to the peripheral tissues underlying tumor thus resulting in stronger alterations. This is confirmed by stronger inhibition of tumor growth in the case of red light PDT (Figure 3).
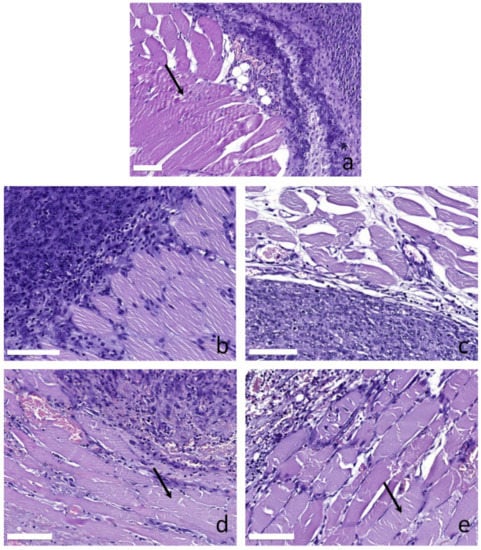
Figure 7.
Histological images of myocytes in peripheral tissues supplying tumor for different groups: (a) untreated, (b) irradiation only at 405 nm, (c) irradiation only at 660 nm, (d) PDT at 405 nm, (e) PDT at 660 nm. Arrows show fragmentation of myocytes. The bar size is 100 μm.
The results of quantitative evaluation of myocytes fragmentation and microcirculatory system disorders are shown in Figure 8. The scores are in good agreement with the qualitative analysis performed above and show that the untreated group is characterized by moderate values for both myocytes fragmentation and microcirculation disorders which could be explained by the excessive tumor growth. This is in line with DOS measurements showing a low level of blood oxygen saturation in the untreated group. Red light irradiation only regime demonstrates low values for both scores, while blue light irradiation only regime shows a pronounces level of microcirculation interruption, although myocytes fragmentation is at a lower level since the process of myocyte fragmentation requires prolonged local tissue hypoxia. Both PDT regimes show higher scores in both considered parameters compared to irradiation-only regimes indicating the high role of PDT in oxygen shortage. However, it is worth mentioning that for both scores blue light PDT shows a lower level of response. This is in agreement with DOS observations showing higher oxygen saturation levels in the blue light PDT group compared to the red light PDT group.
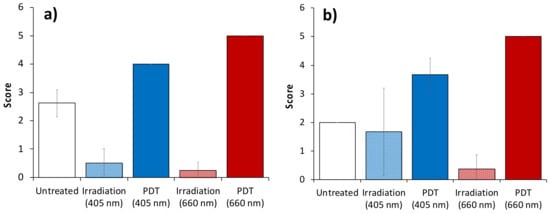
Figure 8.
Scores for myocyte fragmentation (a) and microcirculatory system disorders (b) in peripheral normal tissues calculated from histology. The data presented as M±SD.
4. Discussion
The study of the effect of different irradiation regimens on the tumor blood flow parameters after PDT allows understanding the mechanisms of neoplasm response to treatment. In this work, the difference in the tumor oxygenation level change was revealed between animals subjected to PDT with chlorin e6-based PS using red and blue light. The red light PDT procedure resulted in a decrease in StO2, while the blue light treatment demonstrated long-term preservation of oxygenation at the initial level.
A drop in the tumor oxygenation level caused by blood flow arrest upon red-light PDT is a typical response to PDT and can serve as a criterion of response to the treatment [,]. It originates, in particular, due to vessel endothelium destruction preventing the normal blood supply of a tumor. The influence of blue-light PDT on blood flow parameters has not been studied previously. The revealed differences may be associated with the difference in penetration depths of radiation at different wavelengths and, accordingly, the difference in tissue damage, including, probably, vessels at different depths of the tumor node [,]. This conclusion is in line with the tumor growth inhibition results revealing weaker effect for the blue light PDT procedures: thrombosis occurrences were detected in the red-light PDT group only. It is worth noting that histology analysis revealed significant alterations in the microcirculatory system of peripheral tissues for the blue-light PDT, however, the damage to tumor cells was partial, and no complete response was observed for this group. Moreover, myocytes were revealed within the tumor for all the animals from the blue light PDT group, which may serve as an additional reason for the increased level of StO2 and HbO2 observed in this group.
In the groups of animals irradiated with blue and red light in the absence of PS, a DOS parameters dynamics similar to the case of blue-light PDT was observed: a prolonged increase in the StO2 level as compared to the control group with, however, smaller values as compared to the blue-light PDT on day 1 after the treatment. There is evidence that visible and infrared light promotes the enhancement of blood flow and, accordingly, oxygen delivery []. This is in agreement with an increase in StO2 in the discussed groups on day 3 after the treatment allowing to suggest activation of tumor development followed by a partial inhibition due to the treatment. In addition, normalization of the vascular bed of experimental tumors induced by laser radiation of the red spectral range was reported to be manifested by regularization of its structure and a decrease in vascular permeability [] which may improve tissue oxygenation.
Note that the effect of tissue hyperthermia on the oxygenation of tumors in the course of laser irradiation should be taken into account. To date, it has been proven that tissue heating to 42– 43 °C causes an increase in the oxygen content in tissues for a period of up to several days [,,]. In [] it was shown that in normal tissues, irradiation with red light in presence of PS causes a less pronounced increase in tissue temperature as compared to blue light. When exposed to blue light, an increase in tissue temperature was a characteristic for both regimens with the use of PS and without it. In [] it was shown that in tumor tissues blue light treatment induced a 5 °C higher increase of temperature as compared to red light resulting in reaching a temperature of 42 °C. This is due to the presence of various endogenous chromophores in tissues that absorb radiation in the blue region of the spectrum [].
Tissue oxygenation is the balance between oxygen consumption and supply. Monitoring of concentration of oxy- and deoxy- forms of hemoglobin allows revealing the mechanisms governing changes of tissues oxygenation status []. In our present work, DOS revealed that in untreated tumors the drop in oxygen saturation is primarily determined by a drop in oxyhemoglobin content rather than an increase in deoxyhemoglobin, which leads to the decrease in oxygen supply to the tumor as it grows. After blue-light PDT there were no significant changes in the concentration of both oxy- and deoxyhemoglobin, which determines the absence of changes in blood oxygen saturation throughout the monitoring period. Therefore, an increased level of StO2 in the case of blue-light PDT is determined by the long-term maintenance of high oxygen supply in the tumor, and by the prevention of an increase in oxygen consumption typical for a growing tumor as a result of PDT. Conversely, red light causes a decrease in the flow of oxygen-rich blood, which causes a rapid decrease in tumor oxygen saturation. The absence of pronounced changes in blood content in the case of red-light PDT may also be associated with impaired blood flow and inhibition of both blood supply and outflow. This observation is in good agreement with several works demonstrating red-light PDT-induced stasis and blood flow arrest [,,].
The results of the morphological study are in good agreement with the results of DOS. The absence of pathological changes in the peripheral tissues for the red-light irradiation only group agrees with the observed relatively high oxygenation, while untreated and red-light PDT groups showing pronounced hypoxia reveal pathological alterations in both myocytes and microcirculatory system of peripheral tissues. The differences are explained by the unequal degree of vascular disorders: high one for the untreated and the red-light PDT groups and a low one for the red-light irradiation group. In the groups exposed to blue light, more complex relationships were discovered. Although both PDT and irradiation-only groups revealed strong vascular damage, the score was higher for the PDT group, which also demonstrated significant myocyte fragmentation indicating a more prolonged effect. However, the grade of the observed changes is smaller than that for the red light PDT, since the latter demonstrated full tumor response to treatment (Figure 3). Partial response to the treatment by blue light PDT together with observed myocytes within tumor corresponds to higher oxygenation of the tumor detected by DOS.
The observed difference in the tumor reaction to red and blue light PDT presumably originates from the difference of light penetration depth at these wavelengths. Blue light provides primarily superficial action, while red light acts deeper. OCT angiography provides the mapping of blood circulation at relatively small depths (below 0.5 mm), demonstrating the arrest of blood circulation for both considered PDT regimes [], while diffusion-based DOS technique reveals difference consisting in higher content of oxygenated blood for blue-light PDT regime in deeper tissue layers in 1 day after the treatment indicating that this technique can non-invasively provide additional information on tumor response to treatment. Moreover, this observation is in line with the fact that red light PDT provides higher tumor growth inhibition as compared to blue light. A decrease in blood oxygen saturation level observed in both irradiation only modes 1 day after the treatment followed by its increase in 3 days after the treatment indicates that DOS measurements provide reliable information on tumor response in the days following the procedure. On the other hand, evaluation of blood oxygen saturation level with higher temporal resolution allows for more accurate evaluations of tumor metabolism as a result of a response to the treatment.
Although a relatively small number of animals were included in each group, the main conclusions of the study were based on statistically significant differences of StO2 values measured by DOS between different groups (p < 0.05) additionally supported by the histological data findings. The reported results can be treated as a pilot study, while further investigations on tumors with a slower growth rate could be beneficial allowing to fully separate the treatment effects from the natural growth changes.
Thus, the results of the in vivo experiment showed that the most pronounced effect on tumor growth was caused by photodynamic therapy using a wavelength of 660 nm which induces the complete inhibition of tumor growth by the 7th day after treatment. After red-light PDT, a rapid decrease in blood oxygen saturation is observed, while after PDT at a wavelength of 405 nm, its long-term preservation at the initial level is shown. The main reason for the increase in the level of oxygenation during PDT at a wavelength of 405 nm is an increase in the concentration of oxyhemoglobin reflecting the flow of oxygen to the tissues, while the decrease in the level of oxygenation during PDT at a wavelength of 660 nm is caused by both a decrease in the content of oxyhemoglobin and a slight increase in its deoxy-form.
5. Conclusions
In this paper, we report on the results of monitoring the oxygen status of tumors treated by PDT with chlorin-based PS employing red and blue light. It was shown that the red light PDT procedure induced a gradual decrease in the tumor oxygen saturation during the 7-day observation period caused by a decrease in the amount of local oxyhemoglobin concentration, while deoxyhemoglobin concentration did not demonstrate any significant variation. This observation is explained by the blood flow arrest typical for PDT with red light preventing delivery of oxygenated blood to the tumor region. The untreated tumor group demonstrated similar dynamics; however, the mechanism is different: tumor oxygenation inhibition is explained by the excessive consumption of blood oxygen due to tumor growth and/or excessive tumor development resulting in a formation of a necrotic core. The blue light PDT procedure, on the contrary, demonstrated the preservation of the blood oxygen saturation in the tumor during the entire observation period, which is explained by superficial action of the blue-light PDT, weaker tumor growth inhibition and the effect of hyperthermia. Red and blue light irradiation only regimes with no PS injected also demonstrate weak alterations of tumor blood oxygen saturation. The observations are in good agreement with the results of the histological study analyzing the hypoxia-associated alterations in the peripheral tissues. The observed differences in the tumor oxygen status change as a response to different treatment regimens indicate the high potential of the DOS technique in the development of novel treatment protocols and in the prognosis of the tumor response to treatment in a non-invasive way.
Author Contributions
Conceptualization, A.O., I.T. and M.K. (Mikhail Kirillin); Data curation, E.S.; Formal analysis, Y.P., K.P., N.O., A.K., D.K., M.S. and E.S.; Funding acquisition, I.T. and M.K. (Mikhail Kirillin); Investigation, A.O., Y.P., K.P., N.O., A.K., D.K., M.S. and M.K. (Mikhail Kirillin); Methodology, N.O., M.K. (Mikhail Kleshnin), E.S., I.T. and M.K. (Mikhail Kirillin); Software, M.K. (Mikhail Kleshnin) and I.T.; Supervision, M.K. (Mikhail Kirillin); Writing—original draft, A.O.; Writing—review & editing, I.T., E.S. and M.K. (Mikhail Kirillin). All authors have read and agreed to the published version of the manuscript.
Funding
The work was supported by the Centre of Excellence “Center of Photonics” funded by the Ministry of Science and High Education of the Russian Federation (Agreement No. 075-15-2020-906).
Institutional Review Board Statement
The animal studies were approved by the Ethics Committee of Privolzhsky Research Medical University (Protocol #7, 03.07.2017).
Data Availability Statement
The data used in this research is available from the corresponding author upon reasonable request.
Acknowledgments
The authors are grateful to Vladimir Vodeneev and Anna Brilkina for valuable contribution to the discussions; to Artur Volovetsky and Lyubov Krylova for providing tumor models.
Conflicts of Interest
The authors declare no conflict of interest.
Appendix A
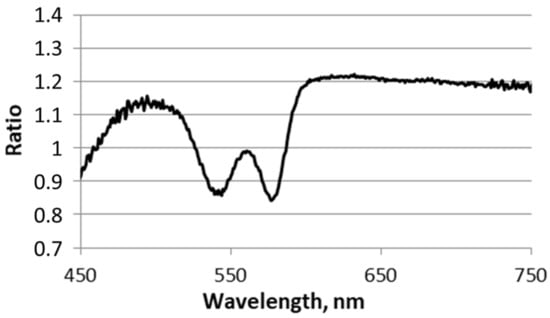
Figure A1.
The ratio of the spectra taken before and after PS injection measured at the 3.5 mm source-detector separation. The graph shows no chlorin e6 absorption and emission peaks in the range 600–700 nm.
References
- Agostinis, P.; Berg, K.; Cengel, K.A.; Foster, T.H.; Girotti, A.W.; Gollnick, S.O.; Hahn, S.M.; Hamblin, M.R.; Juzeniene, A.; Kessel, D. Photodynamic therapy of cancer: An update. CA Cancer J. Clin. 2011, 61, 250–281. [Google Scholar] [CrossRef]
- Dolmans, D.E.; Fukumura, D.; Jain, R.K. Photodynamic therapy for cancer. Nat. Rev. Cancer 2003, 3, 380–387. [Google Scholar] [CrossRef] [PubMed]
- Woodhams, J.H.; MacRobert, A.J.; Bown, S.G. The role of oxygen monitoring during photodynamic therapy and its potential for treatment dosimetry. Photochem. Photobiol. Sci. 2007, 6, 1246–1256. [Google Scholar] [CrossRef] [PubMed]
- Ahn, P.H.; Finlay, J.C.; Gallagher-Colombo, S.M.; Quon, H.; O’Malley, B.W., Jr.; Weinstein, G.S.; Chalian, A.; Malloy, K.; Sollecito, T.; Greenberg, M. Lesion oxygenation associates with clinical outcomes in premalignant and early stage head and neck tumors treated on a phase 1 trial of photodynamic therapy. Photodiagnosis Photodyn. Ther. 2018, 21, 28–35. [Google Scholar] [CrossRef] [PubMed]
- Krammer, B. Vascular effects of photodynamic therapy. Anticancer Res. 2001, 21, 4271–4277. [Google Scholar]
- Krzykawska-Serda, M.; Dąbrowski, J.M.; Arnaut, L.G.; Szczygieł, M.; Urbańska, K.; Stochel, G.; Elas, M. The role of strong hypoxia in tumors after treatment in the outcome of bacteriochlorin–based photodynamic therapy. Free Radic. Biol. Med. 2014, 73, 239–251. [Google Scholar] [CrossRef] [PubMed]
- Sirotkina, M.; Matveev, L.; Shirmanova, M.; Zaitsev, V.; Buyanova, N.; Elagin, V.; Gelikonov, G.; Kuznetsov, S.; Kiseleva, E.; Moiseev, A. Photodynamic therapy monitoring with optical coherence angiography. Sci. Rep. 2017, 7, 1–11. [Google Scholar] [CrossRef]
- Kirillin, M.; Kurakina, D.; Khilov, A.; Orlova, A.; Shakhova, M.; Orlinskaya, N.; Sergeeva, E. Red and blue light in antitumor photodynamic therapy with chlorin–based photosensitizers: A comparative animal study assisted by optical imaging modalities. Biomed. Opt. Express 2021, 12, 872–892. [Google Scholar] [CrossRef]
- Thong, P.; Lee, K.; Toh, H.-J.; Dong, J.; Tee, C.-S.; Low, K.-P.; Chang, P.-H.; Bhuvaneswari, R.; Tan, N.-C.; Soo, K.-C. Early assessment of tumor response to photodynamic therapy using combined diffuse optical and diffuse correlation spectroscopy to predict treatment outcome. Oncotarget 2017, 8, 19902. [Google Scholar] [CrossRef]
- Redmond, R.W.; Gamlin, J.N. A compilation of singlet oxygen yields from biologically relevant molecules. Photochem. Photobiol. 1999, 70, 391–475. [Google Scholar] [CrossRef]
- Losev, A.P.; Nichiporovich, I.N.; Zhuravkin, I.N.; Zhavrid, E.I. Energetics of chlorins as potent photosensitizers of PDT. In Proceedings of the SPIE European Conference on Biomedical Optics, Photochemotherapy: Photodynamic Therapy and Other Modalities II, Vienna, Austria, 4 December 1996; Volume 2924, pp. 40–48. [Google Scholar] [CrossRef]
- Kirillin, M.; Khilov, A.; Kurakina, D.; Orlova, A.; Perekatova, V.; Shishkova, V.; Malygina, A.; Mironycheva, A.; Shlivko, I.; Gamayunov, S.; et al. Dual–wavelength fluorescence monitoring of photodynamic therapy: From analytical models to clinical studies. Cancers 2021, 13, 5807. [Google Scholar] [CrossRef] [PubMed]
- Schouwink, H.; Oppelaar, H.; Ruevekamp, M.; van der Valk, M.; Hart, G.; Rijken, P.; Baas, P.; Stewart, F.A. Oxygen depletion during and after mthpc–mediated photodynamic therapy in rif1 and h–meso1 tumors. Radiat. Res. 2003, 159, 190–198. [Google Scholar] [CrossRef]
- Mallidi, S.; Watanabe, K.; Timerman, D.; Schoenfeld, D.; Hasan, T. Prediction of tumor recurrence and therapy monitoring using ultrasound–guided photoacoustic imaging. Theranostics 2015, 5, 289. [Google Scholar] [CrossRef]
- Karwicka, M.; Pucelik, B.; Gonet, M.; Elas, M.; Dąbrowski, J.M. Effects of photodynamic therapy with redaporfin on tumor oxygenation and blood flow in a lung cancer mouse model. Sci. Rep. 2019, 9, 1–15. [Google Scholar] [CrossRef] [PubMed]
- Torricelli, A.; Spinelli, L.; Pifferi, A.; Taroni, P.; Cubeddu, R.; Danesini, G.M. Use of a nonlinear perturbation approach for in vivo breast lesion characterization by multiwavelength time–resolved optical mammography. Opt. Express 2003, 11, 853–867. [Google Scholar] [CrossRef] [PubMed]
- Ntziachristos, V.; Chance, B. Breast imaging technology: Probing physiology and molecular function using optical imaging–applications to breast cancer. Breast Cancer Res. 2000, 3, 1–6. [Google Scholar] [CrossRef]
- Tromberg, B.J.; Cerussi, A.; Shah, N.; Compton, M.; Durkin, A.; Hsiang, D.; Butler, J.; Mehta, R. Imaging in breast cancer: Diffuse optics in breast cancer: Detecting tumors in pre–menopausal women and monitoring neoadjuvant chemotherapy. Breast Cancer Res. 2005, 7, 1–7. [Google Scholar] [CrossRef]
- Durduran, T.; Choe, R.; Baker, W.B.; Yodh, A.G. Diffuse optics for tissue monitoring and tomography. Rep. Prog. Phys. 2010, 73, 076701. [Google Scholar] [CrossRef] [PubMed]
- De Blasi, R.A.; Cope, M.; Elwell, C.; Safoue, F.; Ferrari, M. Noninvasive measurement of human forearm oxygen consumption by near infrared spectroscopy. Eur. J. Appl. Physiol. Occup. Physiol. 1993, 67, 20–25. [Google Scholar] [CrossRef]
- Lu, H.; Golay, X.; Pekar, J.J.; Van Zijl, P.C. Sustained poststimulus elevation in cerebral oxygen utilization after vascular recovery. J. Cereb. Blood Flow Metab. 2004, 24, 764–770. [Google Scholar] [CrossRef]
- Gibson, A.P.; Hebden, J.C.; Arridge, S.R. Recent advances in diffuse optical imaging. Phys. Med. Biol. 2005, 50, R1. [Google Scholar] [CrossRef]
- Zhou, C.; Choe, R.; Shah, N.S.; Durduran, T.; Yu, G.; Durkin, A.; Hsiang, D.; Mehta, R.; Butler, J.A.; Cerussi, A.E. Diffuse optical monitoring of blood flow and oxygenation in human breast cancer during early stages of neoadjuvant chemotherapy. J. Biomed. Opt. 2007, 12, 051903. [Google Scholar] [CrossRef] [PubMed]
- Cochran, J.M.; Busch, D.R.; Leproux, A.; Zhang, Z.; O’Sullivan, T.D.; Cerussi, A.E.; Carpenter, P.M.; Mehta, R.S.; Roblyer, D.; Yang, W. Tissue oxygen saturation predicts response to breast cancer neoadjuvant chemotherapy within 10 days of treatment. J. Biomed. Opt. 2018, 24, 021202. [Google Scholar] [CrossRef] [PubMed]
- Pavlov, M.V.; Kalganova, T.I.; Lyubimtseva, Y.S.; Plekhanov, V.I.; Golubyatnikov, G.Y.; Ilyinskaya, O.Y.; Orlova, A.G.; Subochev, P.V.; Safonov, D.V.; Shakhova, N.M. Multimodal approach in assessment of the response of breast cancer to neoadjuvant chemotherapy. J. Biomed. Opt. 2018, 23, 091410. [Google Scholar] [CrossRef]
- Zhang, Y.; Moy, A.J.; Feng, X.; Nguyen, H.T.; Reichenberg, J.S.; Markey, M.K.; Tunnell, J.W. Physiological model using diffuse reflectance spectroscopy for nonmelanoma skin cancer diagnosis. J. Biophotonics 2019, 12, e201900154. [Google Scholar] [CrossRef]
- Blondel, W.; Delconte, A.; Khairallah, G.; Marchal, F.; Gavoille, A.; Amouroux, M. Spatially–Resolved Multiply–Excited Autofluorescence and Diffuse Reflectance Spectroscopy: SpectroLive Medical Device for Skin In Vivo Optical Biopsy. Electronics 2021, 10, 243. [Google Scholar] [CrossRef]
- Vishwanath, K.; Yuan, H.; Barry, W.T.; Dewhirst, M.W.; Ramanujam, N. Using optical spectroscopy to longitudinally monitor physiological changes within solid tumors. Neoplasia 2009, 11, 889–900. [Google Scholar] [CrossRef][Green Version]
- Spliethoff, J.W.; Evers, D.J.; Jaspers, J.E.; Hendriks, B.H.; Rottenberg, S.; Ruers, T.J. Monitoring of tumor response to cisplatin using optical spectroscopy. Transl. Oncol. 2014, 7, 230–239. [Google Scholar] [CrossRef] [PubMed][Green Version]
- Orlova, A.; Kirillin, M.Y.; Volovetsky, A.; Shilyagina, N.Y.; Sergeeva, E.; Golubiatnikov, G.Y.; Turchin, I. Diffuse optical spectroscopy monitoring of oxygen state and hemoglobin concentration during skbr–3 tumor model growth. Laser Phys. Lett. 2016, 14, 015601. [Google Scholar] [CrossRef]
- Orlova, A.; Maslennikova, A.; Golubiatnikov, G.Y.; Suryakova, A.; Kirillin, M.Y.; Kurakina, D.; Kalganova, T.; Volovetsky, A.; Turchin, I. Diffuse optical spectroscopy assessment of rodent tumor model oxygen state after single–dose irradiation. Biomed. Phys. Eng. Express 2019, 5, 035010. [Google Scholar] [CrossRef] [PubMed]
- Pham, T.H.; Hornung, R.; Berns, M.W.; Tadir, Y.; Tromberg, B.J. Monitoring tumor response during photodynamic therapy using near-infrared photon-migration spectroscopy. Photochem. Photobiol. 2001, 73, 669–677. [Google Scholar] [CrossRef]
- Wang, H.W.; Putt, M.E.; Emanuele, M.J.; Shin, D.B.; Glatstein, E.; Yodh, A.G.; Busch, T.M. Treatment–induced changes in tumor oxygenation predict photodynamic therapy outcome. Cancer Res. 2004, 64, 7553–7561. [Google Scholar] [CrossRef]
- Dong, J.; Toh, H.J.; Thong, P.S.; Tee, C.S.; Bi, R.; Soo, K.C.; Lee, K. Hemodynamic monitoring of chlorin e6–mediated photodynamic therapy using diffuse optical measurements. J. Photochem. Photobiol. B Biol. 2014, 140, 163–172. [Google Scholar] [CrossRef]
- Kleshnin, M.S.; Turchin, I.V. Evaluation of oxygenation in the surface layers of biological tissues based on diffuse optical spectroscopy with automated calibration of measurements. Quantum Electron. 2019, 49, 628. [Google Scholar] [CrossRef]
- Farrell, T.J.; Patterson, M.S.; Wilson, B. A diffusion theory model of spatially resolved, steady–state diffuse reflectance for the noninvasive determination of tissue optical properties in vivo. Med. Phys. 1992, 19, 879–888. [Google Scholar] [CrossRef]
- Turchin, I.V. Methods of biomedical optical imaging: From subcellular structures to tissues and organs. Phys.–Uspekhi 2016, 59, 487. [Google Scholar] [CrossRef]
- Kleshnin, M.S. Deep learning neural network estimation of tissue oxygenation based on diffuse optical spectroscopy. Laser Phys. 2019, 29, 085603. [Google Scholar] [CrossRef]
- Greening, G.; Mundo, A.; Rajaram, N.; Muldoon, T.J. Sampling depth of a diffuse reflectance spectroscopy probe for in–vivo physiological quantification of murine subcutaneous tumor allografts. J. Biomed. Opt. 2018, 23, 085006. [Google Scholar] [CrossRef] [PubMed]
- Kurakina, D.; Khilov, A.; Shakhova, M.; Orlinskaya, N.; Sergeeva, E.; Meller, A.; Turchin, I.; Kirillin, M. Comparative analysis of single–and dual–wavelength photodynamic therapy regimes with chlorin–based photosensitizers: Animal study. J. Biomed. Opt. 2019, 25, 063804. [Google Scholar] [CrossRef]
- Hino, H.; Murayama, Y.; Nakanishi, M.; Inoue, K.; Nakajima, M.; Otsuji, E. 5–aminolevulinic acid–mediated photodynamic therapy using light–emitting diodes of different wavelengths in a mouse model of peritoneally disseminated gastric cancer. J. Surg. Res. 2013, 185, 119–126. [Google Scholar] [CrossRef]
- Calderhead, R.G. The photobiological basics behind light-emitting diode (led) phototherapy. Laser Ther. 2007, 16, 97–108. [Google Scholar] [CrossRef][Green Version]
- Ottaviani, G.; Martinelli, V.; Rupel, K.; Caronni, N.; Naseem, A.; Zandonà, L.; Perinetti, G.; Gobbo, M.; Di Lenarda, R.; Bussani, R. Laser therapy inhibits tumor growth in mice by promoting immune surveillance and vessel normalization. EBioMedicine 2016, 11, 165–172. [Google Scholar] [CrossRef] [PubMed]
- Song, C.W.; Park, H.; Griffin, R.J. Improvement of tumor oxygenation by mild hyperthermia. Radiat. Res. 2001, 155, 515–528. [Google Scholar] [CrossRef]
- Sun, X.; Xing, L.; Clifton Ling, C.; Li, G.C. The effect of mild temperature hyperthermia on tumour hypoxia and blood perfusion: Relevance for radiotherapy, vascular targeting and imaging. Int. J. Hyperth. 2010, 26, 224–231. [Google Scholar] [CrossRef]
- Griffin, R.J.; Dings, R.P.; Jamshidi–Parsian, A.; Song, C.W. Mild temperature hyperthermia and radiation therapy: Role of tumour vascular thermotolerance and relevant physiological factors. Int. J. Hyperth. 2010, 26, 256–263. [Google Scholar] [CrossRef] [PubMed]
- DaCosta, R.S.; Andersson, H.; Wilson, B.C. Molecular fluorescence excitation–emission matrices relevant to tissue spectroscopy. Photochem. Photobiol. 2003, 78, 384–392. [Google Scholar] [CrossRef]
- Maslennikova, A.V.; Orlova, A.G.; Golubiatnikov, G.Y.; Kamensky, V.A.; Shakhova, N.M.; Babaev, A.A.; Snopova, L.B.; Ivanova, I.P.; Plekhanov, V.I.; Prianikova, T.I.; et al. Comparative study of tumor hypoxia by diffuse optical spectroscopy and immunohistochemistry in two tumor models. J. Biophotonics 2010, 3, 743–751. [Google Scholar] [CrossRef]
Publisher’s Note: MDPI stays neutral with regard to jurisdictional claims in published maps and institutional affiliations. |
© 2021 by the authors. Licensee MDPI, Basel, Switzerland. This article is an open access article distributed under the terms and conditions of the Creative Commons Attribution (CC BY) license (https://creativecommons.org/licenses/by/4.0/).