Article

Impact of Sn Particle-Induced Mask Diffraction on EUV Lithography Performance Across Different Pattern Types

by
Seungchan Moon
1,2,
Dong Gi Lee
2,3,
Jinhyuk Choi
1,2,
Junho Hong
2,3,
Taeho Lee
2,
Yasin Ekinci
4 and
Jinho Ahn
1,2,3,*
1
Division of Nanoscale Semiconductor Engineering, Hanyang University, Seoul 04763, Republic of Korea
2
Center for Hyperscale, Hyperfunction, Heterogeneous Integration Pioneering Semiconductor Technology, Hanyang University, Seoul 04763, Republic of Korea
3
Division of Materials Science and Engineering, Hanyang University, Seoul 04763, Republic of Korea
4
Laboratory for X-Ray Nanoscience and Technologies, Paul Scherrer Institute, 5232 Villigen, Switzerland
*
Author to whom correspondence should be addressed.
Photonics 2025, 12(3), 266; https://doi.org/10.3390/photonics12030266
Submission received: 25 February 2025 / Revised: 10 March 2025 / Accepted: 13 March 2025 / Published: 14 March 2025

Abstract

:
This study investigates the differences in the lithographic impact of particles on the pellicle surface depending on the type of extreme ultraviolet (EUV) mask pattern. Using an EUV ptychography microscope, we analyzed how mask imaging performance is affected by locally obstructed mask diffraction caused by a 10 μm × 10 μm patterned tin particle intentionally fabricated on the pellicle surface. The resulting critical dimension variations were found to be approximately three times greater in line-and-space patterns than in contact hole patterns. Based on these findings, we recommend defining the critical size of particles according to the mask pattern type to optimize lithographic quality.

Graphical Abstract

1. Introduction

Chip manufacturers are adopting extreme ultraviolet (EUV) pellicles positioned 2.5 mm above the EUV mask to protect it from contamination during EUV lithography [1,2,3,4,5]. These pellicles act as barriers, capturing particles that may originate from substantial debris generated by tin (Sn) droplets before reaching the mask surface [6,7,8,9,10,11]. By collecting these particles, the pellicle defocuses its image on the wafer plane, reducing its impact on the wafer and significantly preventing pattern defects [12]. However, particles on the pellicle surface that exceed a critical size can reportedly cause severe defects on the printed wafer, thereby adversely affecting the yield [5,13]. This critical size is known to be approximately 10 μm; however, owing to the reflective nature of EUV masks, such particles can disrupt the propagation of incident or mask-diffracted light, inducing complex interactions with various mask patterns. These intricate effects underscore the necessity for further investigation.
Several simulation-based studies have explored the imaging impacts of particles on the pellicle surface exceeding the critical size. However, simulations are limited by computational complexity and cannot fully account for the random nature of these events (i.e., the position of the particle on the pellicle and the random scattering induced by the particle). To address these limitations, we conducted experimental research to validate the comprehensive lithographic effects of particle-induced scattering, including localized intensity reductions, distribution variations, and random phase alterations in mask-diffracted light, by varying the position of a particle along each mask diffraction order—a factor that had not been explored in prior research. Furthermore, to assess the lithographic impact of a particle on the pellicle surface based on the mask pattern type, we investigated the effect of a patterned Sn particle on mask image transfer characteristics via through-pellicle mask imaging using an EUV ptychography microscope, which is an actinic patterned mask metrology tool.

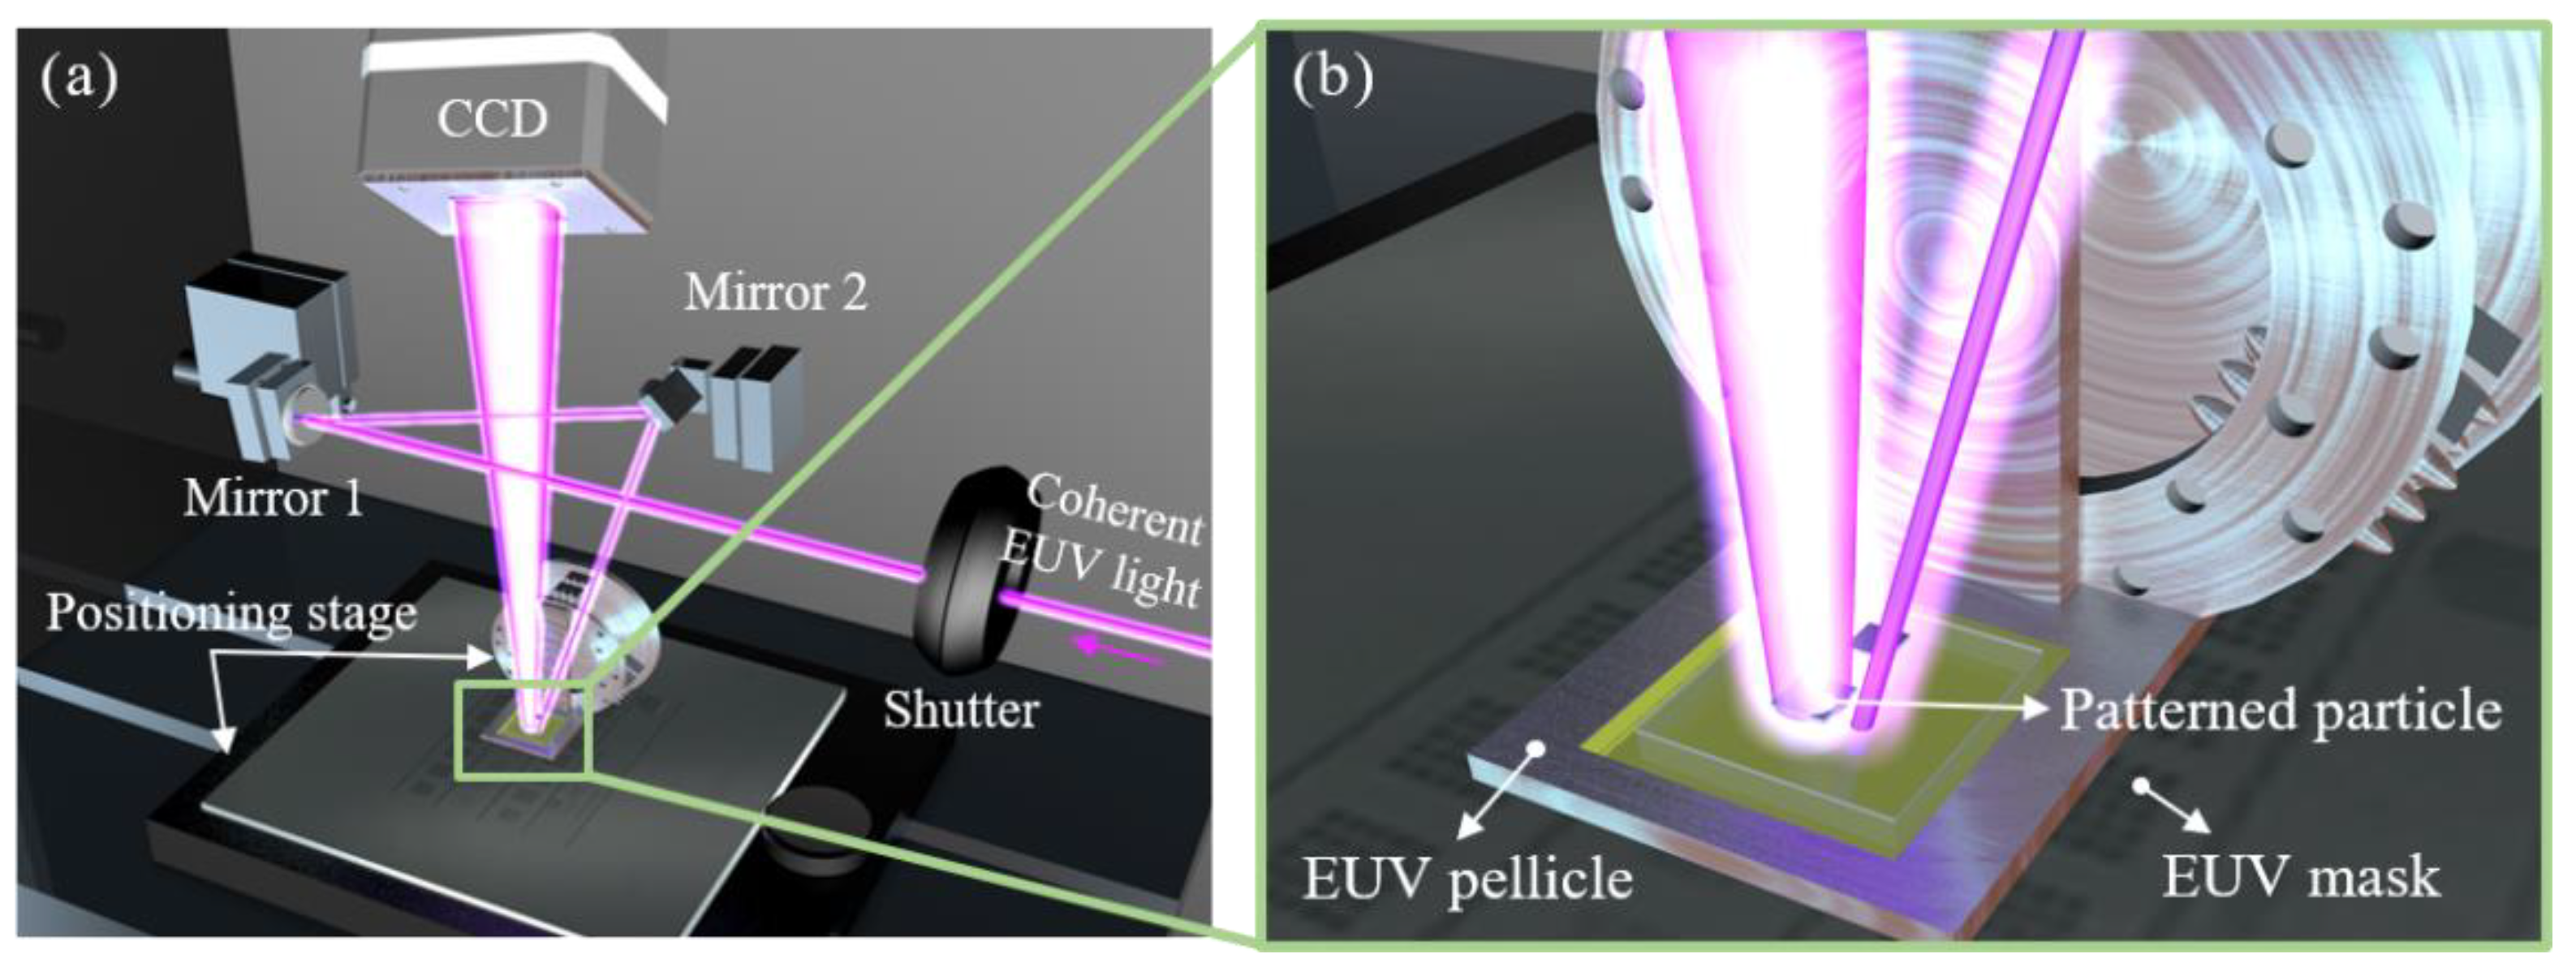
2. Experimental Details

To clearly understand the changes in diffracted light and their lithographic effects caused by the local obstruction of mask-diffracted light by an Sn particle on the pellicle surface, we employed an EUV ptychography microscope utilizing a coherent EUV source and coherent diffraction imaging methods [14]. The setup for through-pellicle mask imaging in the EUV ptychography microscope is illustrated in Figure 1.
Coherent EUV light was generated using the high harmonic generation method, filtering only the 59th harmonic wave of an 800 nm Ti: sapphire laser with a ZrSi2 spectral filter. Coherent EUV light with a wavelength of 13.56 nm and a λ / Δ λ of 280 passed through a shutter and was sequentially reflected by spherical and flat mirrors before being incident on the EUV mask and pellicle at an angle of 6 ° , as shown in Figure 1a. More detailed specifications for the setup and properties of the EUV light were reported in our previous study [14,15]. In this experimental setup, the spot sizes of EUV light at the mask and the pellicle were full width at half maximum of 13.4 μm and 16.6 μm, respectively. The far-field diffraction patterns of mask patterns were captured by a charge-coupled device (CCD) positioned 96 mm from the mask. The numerical aperture (NA) at the mask for the optical system was 0.142, with a resolution of 47.5 nm corresponding to the diffraction limit.
A through-pellicle mask imaging configuration featuring an Sn particle-patterned pellicle and two different EUV mask patterns is shown in Figure 2. The pellicle with patterned Sn particles was positioned 2.5 mm above the EUV mask, and diffraction patterns were obtained for the vertical line-and-space (V-L/S) pattern (Figure 2d) and the contact hole (C/H) pattern (Figure 2e). The mask was provided by the Laboratory for X-ray Nanoscience and Technologies, Paul Scherrer Institute. Both patterns were fabricated with a 140 nm thick hydrogen silsesquioxane absorber on a Mo/Si multilayer using electron beam lithography and had a critical dimension (CD) of 200 nm.
The lower limit for the printability of particle sizes on pellicle surfaces has been reported as 10 μm in EUV scanners [5,14,16]. Consequently, the smallest reported particle size affecting imaging was selected to examine its impact on different mask patterns and to verify that the critical size should be defined depending on the mask pattern type. We fabricated artificial Sn particles with a 10 μm × 10 μm square shape and 500 nm thickness on the 40 nm thickness SiNx pellicle, as shown in Figure 2b. The Sn particles were patterned using a lift-off process after sequentially depositing 40 nm of SiNx and 500 nm of Sn on a Si wafer via low-pressure chemical vapor deposition and e-beam evaporation, respectively. The SiNx single-layer structure was then fabricated through a Si wet etch process. To assess the light-blocking effect of the particle, an EUV intensity loss map around the patterned Sn particle (Figure 2c) was measured using an EUV ptychography microscope. The measurement was conducted by comparing the intensity of EUV multilayer reflection between the particle and particle-free regions, revealing EUV intensity losses of 85% and 23%, respectively. The pellicles do not cause additional scattering as a single-layer structure, while the patterned Sn particles effectively suppress the mask-diffracted light locally. Therefore, the setup is well-suited for observing the changes in mask-diffracted light caused by a particle.
Initially, diffraction patterns were captured without particle obstruction in the particle-free region of the pellicle. Subsequently, diffraction patterns were obtained with locally obstructed diffraction order caused by the patterned Sn particle. To investigate the imaging impact of the particle based on different types of mask patterns, specific mask diffraction orders were selectively obstructed to simulate the worst-case imaging scenarios. Ptychographic datasets were acquired by sequentially illuminating the mask pattern with approximately 70% of the probe overlapped area, enabled by a mask stage with 1 nm positional accuracy. Ultimately, datasets covering a 20 μm × 20 μm window were obtained. The through-pellicle mask pattern images were then reconstructed using a position correction ptychographic iterative engine (PIE) and regularized PIE with modulus-enforced probe (MEP) constraints based on the through-pellicle diffraction datasets with and without particle obstruction [14,17]. To emulate the wafer patterning in a 0.33 NA EUV scanner with 4× magnification projection optics, only the diffracted light within a 0.0825 NA at the mask (corresponding to 0.33 NA with 4× magnification) was utilized from the captured diffraction patterns. Finally, the normalized intensity profiles of the reconstructed pattern images were extracted to validate the lithographic effect of the patterned Sn particle by mask pattern type.

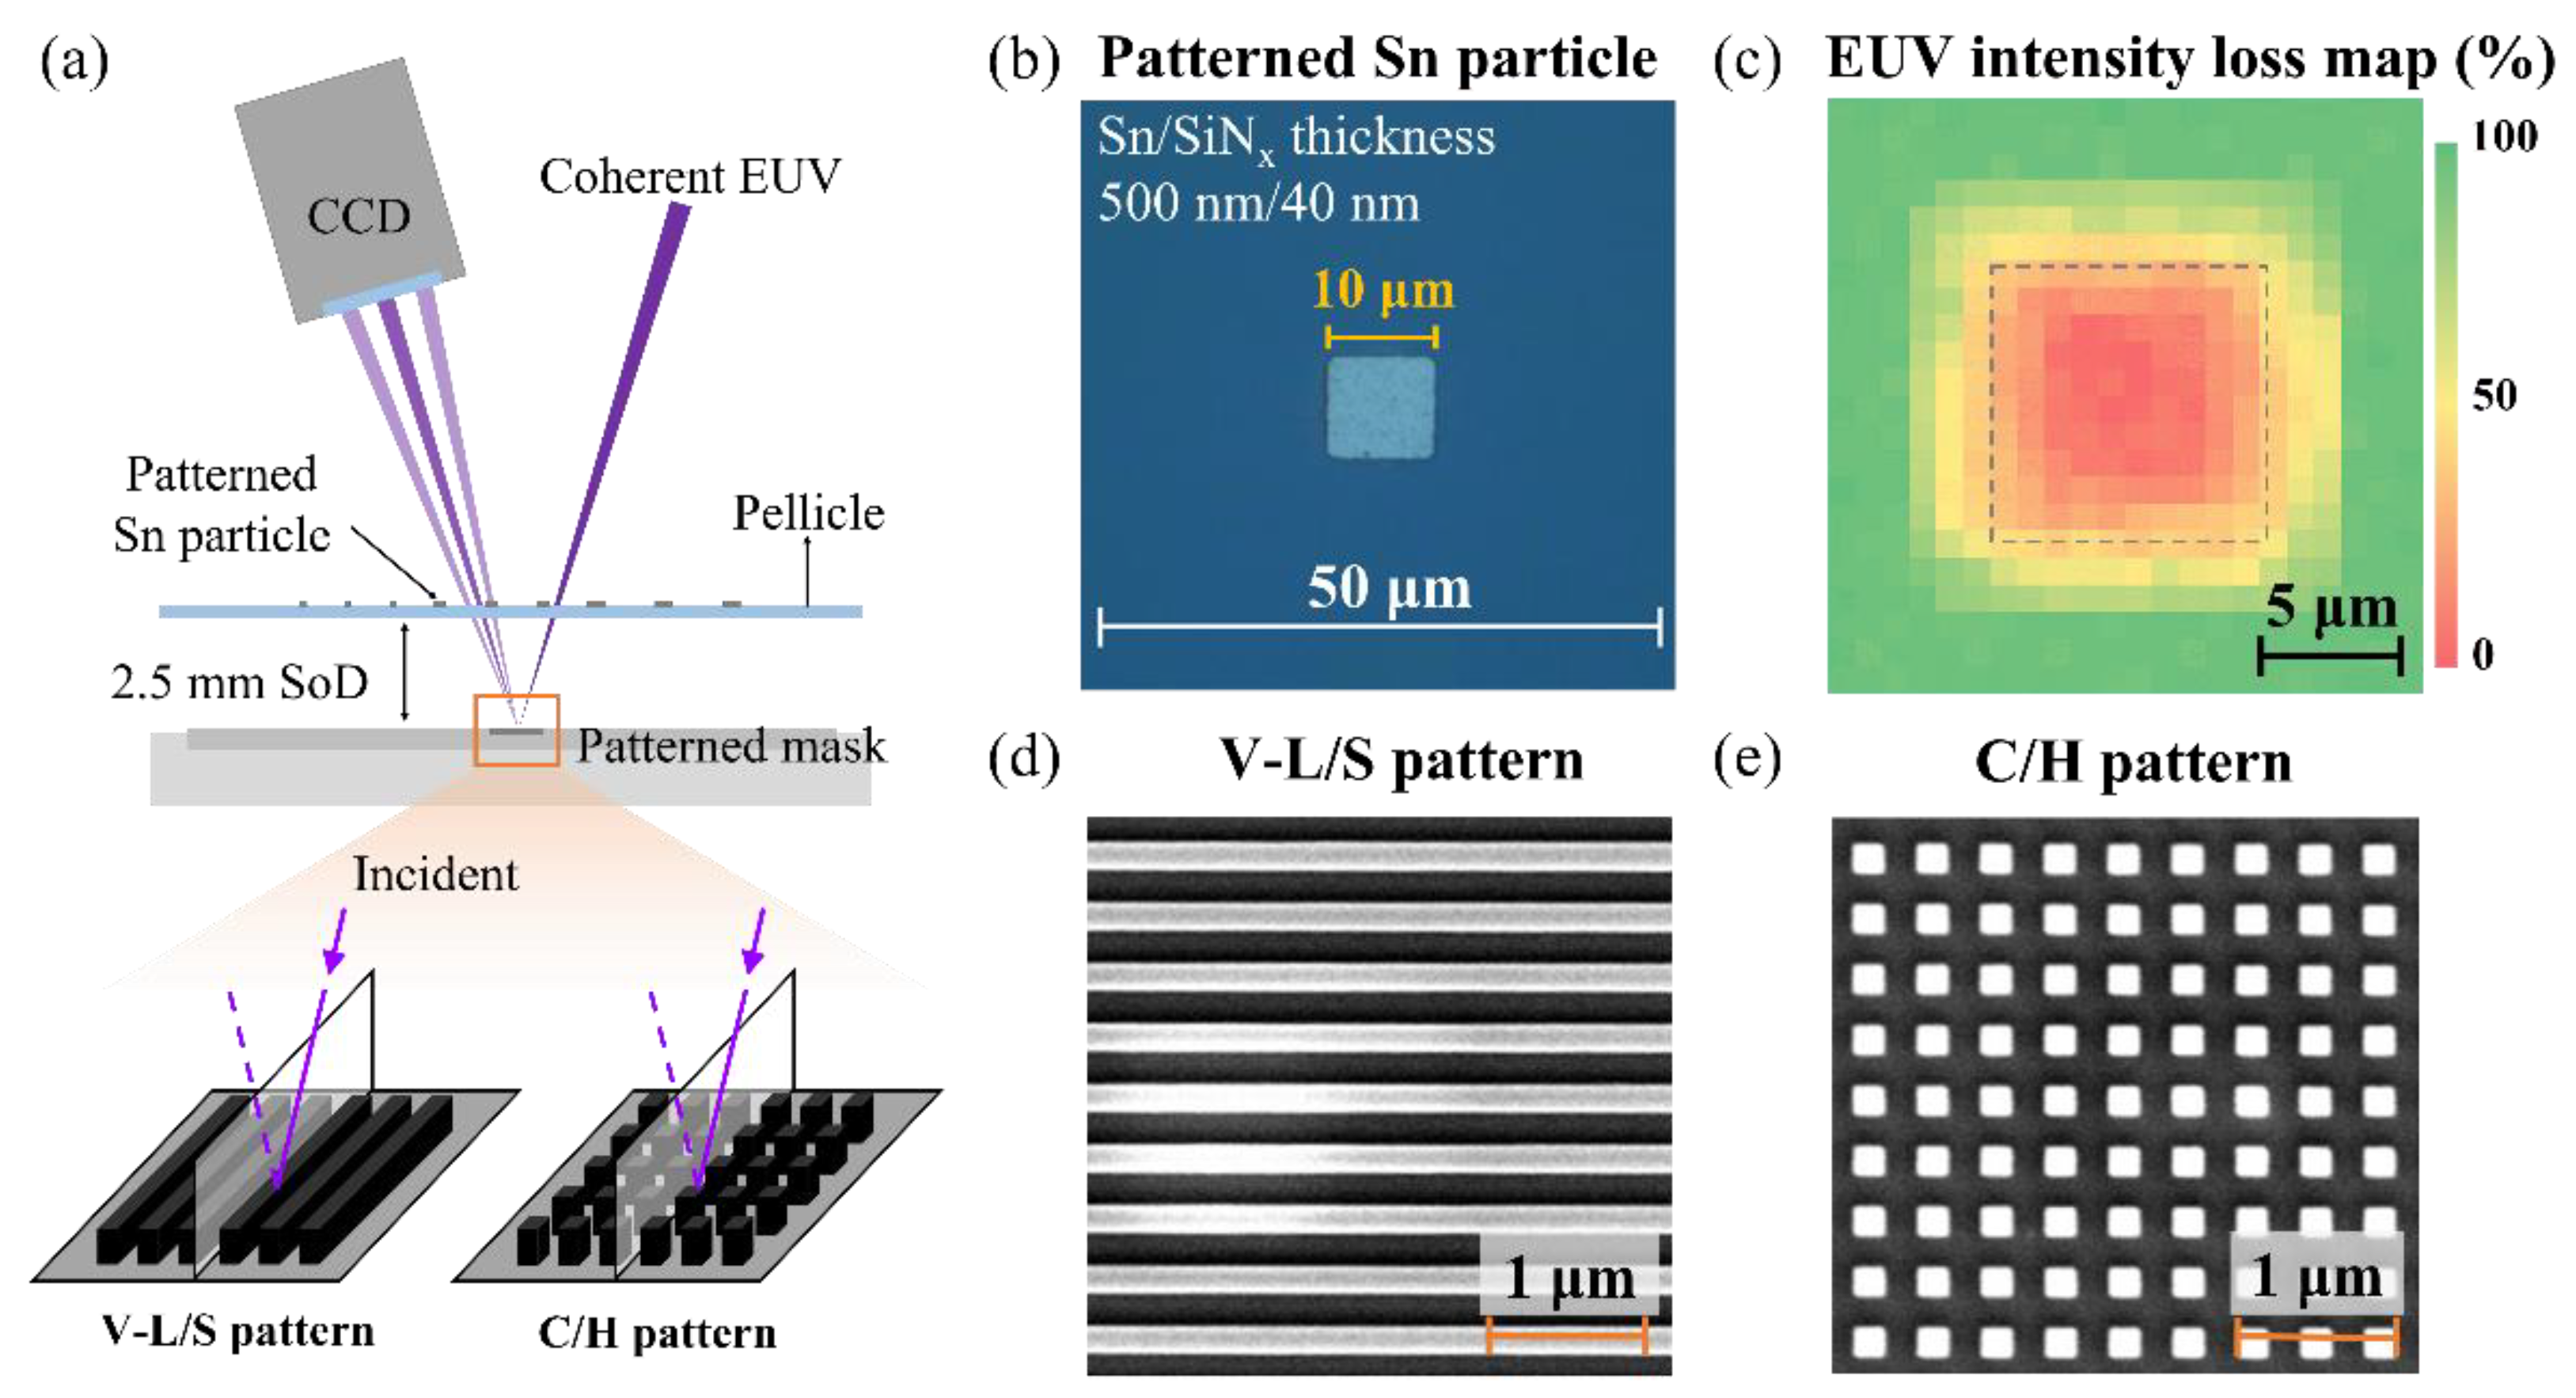
3. Results and Discussion

3.1. Deformation of Mask Diffraction Pattern Due to Particle-Induced Scattering

The diffraction patterns of V-L/S and C/H, obtained from the particle-free region of the pellicle, were cropped to the region corresponding to 0.0825 NA at the mask, as shown in Figure 3. Changes in mask diffraction light caused by a particle were validated by comparing the diffraction patterns acquired without (Figure 3) and with (Figure 4) particle obstruction for each mask pattern. The diffraction patterns were recorded on a CCD sensor with 16-bit grayscale counts, representing the detected light intensity. The grayscale range was adjusted from the background noise level to the maximum intensity of the first-order diffracted light to clearly highlight changes caused by the particle. For the V-L/S pattern, the grayscale range of the diffraction patterns was 50 to 2500 counts, as shown in Figure 4a,b. For the C/H pattern, the range was 50 to 1200 counts, as shown in Figure 4c–e. The positions of the zeroth- and first-order diffracted light in the Fourier domain of the V-L/S and C/H diffraction patterns were identical, as both patterns had an identical pitch of 400 nm [18].
For the periodic V-L/S pattern, the first-order diffracted light was captured above and below the zeroth-order diffracted light with an intensity of 33,000 counts, as shown in Figure 3a. Conversely, for the horizontal (H) and vertical (V) periodic C/H patterns, the irradiated light generated diffracted light in the H, V, and diagonal directions, with the zeroth-order diffracted light exhibiting an intensity of 43,000 counts, as shown in Figure 3b. The differences in mask diffraction efficiency between the patterns resulted in varying intensities of diffracted light despite their identical diffraction angles.
The scattering induced by the particle obstructing the mask-diffracted light was influenced by the particle’s relative size compared to the light wavelength, as described by the Lorenz–Mie solution to Maxwell’s equations [19]. The scattering phase function for particles with sizes of 1 nm, 10 nm, and 10 μm under an S-polarized coherent EUV wave is shown in Figure 5a [20,21]. When a 10 μm sized particle—103 times larger than the 13.5 nm EUV wavelength—obstructs the mask-diffracted light, it results in Mie scattering, predominantly characterized by forward scattering [19,21,22]. The resulting changes in intensity and distribution of the mask-diffracted light in the Fourier domain owing to Mie scattering are shown in Figure 6. Mie scattering decreased the intensity of the zeroth- and first-order diffracted light and caused a broader distribution in the Fourier domain.
The decrease in the intensity of diffracted light caused by the particle on the pellicle surface was attributed to the reduction in the amount of EUV light transmitted through the particle. This reduction occurred due to absorption and reflection within the SiNx membrane and Sn particle, as shown in Figure 5b. The absorption of EUV light followed an exponential decay relative to the optical path length (OPL) through the membrane and particle, expressed using Equation (1).
I I 0 = e 4 π λ β 1 r 1 + β 2 r 2
where I 0 is the intensity of incident light, I is the intensity of light transmitted through the particle, λ is the wavelength of the incident light, β 1 and β 2 are the absorption coefficients of SiNx and particle, respectively, and r 1 and r 2 are the OPLs through the membrane and particle, respectively. The resulting decrease in pellicle transmittance owing to the particle is summarized in Table 1. As each diffracted light path was obstructed by the particle, their maximum intensities decreased significantly, exceeding 85%, consistent with the EUV intensity loss map in Figure 2c. The intensity loss caused by particle obstruction was more pronounced for the first-order diffracted light compared with the zeroth-order and for the diagonal first (D-1st)-order compared with the horizontal first (H-1st)-order diffracted light. This difference primarily resulted from the larger mask-diffraction angle, which increased the OPL through the membrane and particle, as shown in Figure 7. The longest obstructed diffracted light path experienced a substantial intensity loss of 88.2%, reducing its intensity to the level of background noise. This path had OPLs of 36.6 and 508.6 nm through the membrane and particle, respectively.
The broadening of the distribution of diffracted light by the particle in the Fourier domain resulted from the light path modification caused by refraction and particle-induced diffraction, as shown in Figure 7. In the case of refraction, the angle difference ( θ S n , r e f r a c t i o n in Figure 7), which occurred when mask diffraction traversed the particle, depended on the incident mask diffraction angle ( θ i n c i d e n t in Figure 7) and could reach up to 10.82 mrad, as determined using Snell’s law [23]. The resulting position shift of the diffracted light at the CCD plane due to the angle difference was negligible, measuring only 5.6 nm compared with a pixel size of 27 μm. By contrast, the diffracted light from the mask that traversed the particle edge could undergo additional diffraction, as described by Equation (2), primarily contributing to the broadening of diffracted light distribution in the Fourier domain.
s i n θ m = s i n θ i + m λ p
Here, θ i is the incidence angle on the particle, m is the diffraction order, θ m is the mth-order diffraction angle, and p is the width of the region perpendicular to the incident light that is obstructed by the particle. As the intensity of the diffracted light from the particle edge over the second order was far below the background noise, only the first-order particle diffraction was considered [24]. The first-order particle diffraction angle of the diffracted light from the L/S and C/H patterns was approximately 1.38 mrad. This resulted in a position difference of up to 67.7 μm between the zeroth- and first-order particle diffraction at the CCD plane, given a particle-to-CCD distance of 93.5 mm. These particle-induced diffractions originated from the four edges of the particle, extending the diffracted light distribution up to 135.3 μm in the Fourier domain, as shown in the lower row of Figure 6.

3.2. Comparison of Reconstructed Images with and Without Particle Obstruction

The CCD plane corresponding to the Fourier domain can be expressed in the frequency coordinate system, where each mask diffraction order is represented as a spatial frequency based on its position, as defined using Equation (3).
f n s = s i n θ n λ
Here, f n s and θ n are the spatial frequency and diffraction angle corresponding to the nth-order mask diffraction light, respectively. Based on Equation (3), the zeroth-order diffracted light, incident perpendicular to the CCD plane, exhibited a very small spatial frequency and contributed to the background noise at the image plane. By contrast, the first-order diffracted light, captured around the zeroth-order diffracted light, had a spatial frequency of 5.05 μ m 1 . Furthermore, the D-1st-order diffracted light, observable only in the C/H pattern, had a spatial frequency of 7.02 μ m 1 . Both spatial frequencies contributed significantly to the pattern formation in the image plane. Particle-induced scattering altered both the amplitude and spatial frequency of each diffracted light, as shown in Figure 6. To analyze the impact of this scattering on mask image transfer characteristics, images were reconstructed using ptychography. The reconstructed images from mask diffraction patterns with and without particle obstruction are shown in Figure 8 and Figure 9. The phase retrieval transfer functions (PRTFs), a quantitative metric for evaluating reconstruction quality by comparing the amplitude values of spatial frequency components in the diffraction pattern and the reconstructed image, are shown in Figure 8b and Figure 9b [15]. As PRTFs represent the frequency components contributing to image formation, they demonstrate that when a certain mask diffraction order is obstructed, the spatial frequency distribution in the reconstructed image is altered compared to the unobstructed case. This confirms that each reconstructed image reflects the influence of particle-induced scattering.
The reconstructed pattern images from the V-L/S diffraction patterns with and without particle obstruction are shown in Figure 8a. The impact of the deformed spatial frequency component of obstructed diffracted light on mask image transfer characteristics was assessed by comparing the normalized intensity profiles at the same position in the reconstructed image, as shown in Figure 8c. The degree of alteration in image transfer characteristics was quantified using a normalized threshold intensity of 0.358, corresponding to the reconstructed image without particle obstruction for the 200 nm CD. CD variation and pattern shift were measured based on the change in pattern size and the displacement of the center position in the pattern formation region exceeding the threshold intensity, respectively. Compared with the data in Figure 8(a1,a2), the results show a 6.5% reduction in image contrast, an 8.4 nm CD variation, and a 5.6 nm pattern shift. Additionally, small peaks were detected in the valley region of the yellow profile shown in Figure 8c. This phenomenon is attributed to the significant intensity loss of the zeroth-order diffracted light obstructed by the particle, reducing its amplitude below that of the ±first-order diffracted light. The ±first-order diffracted light, which formed the L/S pattern with a spatial frequency of 5.05 μ m 1 , interfered more prominently, leading to intensity oscillations that manifest as secondary peaks in the spatial domain [25]. Figure 8(a3) shows a 12.7% reduction in image contrast, a 51.1 nm CD variation, and a 48.6 nm pattern shift caused by the scattering of the first-order diffracted light. These results validate that CD variation was more pronounced compared with Figure 8(a2), as it resulted from the deformation of diffracted light possessing spatial frequency essential for pattern formation in the image plane.
The reconstructed pattern images from the C/H diffraction patterns with and without particle obstruction are shown in Figure 9a. Unlike the V-L/S pattern, the C/H pattern generated diffracted light in two dimensions. The effects of the particle on mask image transfer characteristics in the horizontal (H) and vertical (V) directions are shown in Figure 9c and Figure 9d, respectively. The normalized threshold intensities were 0.369 for the H direction and 0.389 for the V direction.
As shown in Figure 9(a3), the obstruction of the H-1st-order diffracted light, which contributes to pattern formation with a spatial frequency in the H direction of the image plane, resulted in a CD variation of 17.7 nm and a pattern shift of 13.7 nm. These effects are more pronounced than those observed in the V direction, which exhibited a CD variation of 3.8 nm and a pattern shift of 5.9 nm. By contrast, the obstruction of the zeroth-order diffracted light, with negligible spatial frequency, and the D-1st-order diffracted light, which contributes to pattern formation with equivalent spatial frequencies in both H and V directions, resulted in similar changes in mask image transfer characteristics in both directions. These findings confirmed that changes in mask image transfer characteristics caused by particle-induced diffracted light obstruction depended on the spatial frequency direction of the diffracted light at the image plane.
The mask pattern image was formed by the superposition of sinusoidal waves corresponding to the mask diffraction in the Fourier domain, each composed of a specific amplitude and spatial frequency [26]. The contribution of a sinusoidal wave to the mask image formation is proportional to its amplitude, indicating that waves with higher amplitudes have a greater impact on mask image transfer characteristics when distorted by a particle on the pellicle surface. As demonstrated in this experiment, for V-L/S and C/H mask patterns fabricated through the identical manufacturing process with 200 nm CD, the diffraction efficiency was higher in the V-L/S pattern owing to the presence of fewer diffracted light components under the same incident photon flux [27]. Additionally, the spatial frequency components contributing to pattern formation in the V-L/S pattern are highly concentrated in only two dominant diffracted light orders. Consequently, when a specific diffracted light component is obstructed, the degradation in image transfer characteristics becomes more pronounced. Conversely, the C/H pattern distributes its spatial frequency components across multiple diffracted light orders, enabling a compensatory effect from the remaining diffracted light components when a particular diffraction order is obstructed. Consequently, the first-order diffracted light of the V-L/S pattern contributed more significantly to image formation compared to that of the C/H pattern. This is evident from Figure 8 and Figure 9, where the obstruction of the first-order diffracted light in the V-L/S pattern resulted in a greater CD variation compared with the C/H pattern. Based on these findings, the lithographic effect of the particle on the pellicle surface varies depending on the mask pattern type, with more pronounced effects observed in L/S patterns compared with C/H patterns under identical incident photon flux conditions. This phenomenon originates from the diffraction characteristics unique to each mask pattern type and is not limited to the specific material of the mask absorber or pellicle used in this study. The results were obtained using an EUV ptychography microscope with coherent EUV light, which represents the central ray within the partially coherent light used in the EUV scanner. Coherent light effectively amplifies the effect of particle-induced distortions, enabling a more detailed analysis of their impact on partially coherent light. Even with partially coherent EUV light, mask diffraction can still be locally obstructed by randomly positioned particles on the pellicle surface, leading to scattering influenced by both the light wavelength and particle size. These experimental findings can help predict how locally distorted diffraction light caused by a particle on the pellicle surface influences imaging based on mask pattern types under EUV scanner conditions. We expect that the imaging changes observed with coherent light may be reflected in the results obtained from the EUV scanner. Additionally, the trends in particle-induced imaging impact across different mask patterns are anticipated to align with our experimental findings. In summary, the lithographic effect of a particle on the pellicle in the EUV lithography varies depending on the specific mask patterns employed. Our results suggest that the critical size of a particle on the pellicle should be determined based on the mask pattern type.

4. Conclusions

Through-pellicle mask imaging experiments were conducted using a EUV ptychography microscope to validate the imaging impact of a particle on the pellicle surface obstructing mask-diffracted light. These experiments revealed that the lithographic effect of the particle varied depending on the type of EUV mask pattern.
The scattering induced by a particle obstructing mask-diffracted light resulted in an intensity reduction of up to 88.2% and a 166.2% broadening of the diffracted light distribution in the Fourier domain. These deformations in mask diffraction significantly impacted mask image transfer characteristics, leading to image contrast loss, CD variation, and pattern shifts. To quantify these changes, images were reconstructed using the deformed mask diffraction patterns and PIE algorithms with MEP constraints. The observed changes in image transfer characteristics were linked to the spatial frequencies of the diffracted light contributing to the image plane. Since the contribution of diffracted light to pattern image formation is governed by the mask diffraction efficiency, CD variation was more pronounced in the V-L/S pattern compared with the C/H pattern. This study experimentally demonstrated that the particle-induced changes in mask image transfer characteristics vary depending on the type of mask pattern. The trends observed using the EUV ptychography microscope are expected to be consistent with the results from the EUV scanner. Therefore, we propose that the critical size of a particle on the pellicle surface—potentially generated by the Sn droplet source within the EUV scanner—should be determined differently depending on the mask pattern type.

Author Contributions

Conceptualization, S.M. and J.A.; methodology, S.M. and D.G.L.; software, S.M., D.G.L. and J.C.; validation, S.M., D.G.L. and J.C.; investigation, S.M., D.G.L., J.C. and J.H.; writing—original draft preparation, S.M.; writing—review and editing, J.A., T.L. and Y.E.; supervision, J.A.; funding acquisition, J.A. All authors have read and agreed to the published version of the manuscript.

Funding

This work was supported by the National Research Foundation of Korea (NRF) grant funded by the Korean government (Ministry of Science and ICT) (No. RS-2023-00260527).

Institutional Review Board Statement

Not applicable.

Informed Consent Statement

Not applicable.

Data Availability Statement

Data underlying the results presented in this paper are not publicly available at this time but may be obtained from the authors upon reasonable request.

Acknowledgments

We wish to acknowledge the support of the Laboratory for X-ray Nanoscience and Technologies (LXN), Paul Scherrer Institute. This article is a revised and expanded version of a paper entitled “Experimental investigation of the mask diffraction light blocking with critical-sized Sn particles on the EUV pellicle”, which was presented at the International Conference on Extreme Ultraviolet Lithography, SPIE 2023.

Conflicts of Interest

The authors declare no conflicts of interest. The funders had no role in the design of the study; in the collection, analyses, or interpretation of data; in the writing of the manuscript; or in the decision to publish the results.

Abbreviations

The following abbreviations are used in this manuscript:
EUVExtreme ultraviolet
CCDCharge-coupled device
NANumerical aperture
V-L/SVertical line-and-space
C/HContact hole
OPLOptical path length
CDCritical dimension
PRTFPhase retrieval transfer function

References

  1. van de Kerkhof, M.; Klein, A.; Vermeulen, P.; van der Woord, T.; Donmez, I.; Salmaso, G.; Maas, R. High-transmission EUV pellicles supporting >400 W source power. In Proceedings of the SPIE Optical EUV Nanolithography, San Jose, CA, USA, 27 February–3 March 2022; Volume 12051, p. 120510B. [Google Scholar] [CrossRef]
  2. Kupers, M.; Rispens, G.; Devaraj, L.; Bottiglieri, G.; van den Hoogenhoff, T.; Broman, P.; Erdmann, A.; Wahlisch, F. Particle on EUV pellicles, impact on LWR. In Proceedings of the SPIE International Conference on Extreme Ultraviolet Lithography, Monterey, CA, USA, 15–19 September 2019; Volume 11147, pp. 102–115. [Google Scholar] [CrossRef]
  3. Brouns, D.; Bendiksen, A.; Broman, P.; Casimiri, E.; Colsters, P.; Delmastro, P.; de Graaf, D.; Janssen, P.; van de Kerkhof, M.; Kramer, R.; et al. NXE pellicle: Offering a EUV pellicle solution to the industry. Proc. SPIE 2016, 9776, 97761Y. [Google Scholar] [CrossRef]
  4. van de Kerkhof, M.; Klein, A.; Seoane, B.; Vermeulen, P.; Gallagher, E.; Timmermans, M.Y.; Pollentier, I.; Bekaert, J. EUV pellicle scanner integration for N2 nodes and beyond. In Proceedings of the SPIE Optical EUV Nanolithography, San Jose, CA, USA, 26 February–2 March 2023; Volume 12494, p. 124940D. [Google Scholar] [CrossRef]
  5. Licheri, S. Offline Study of Next Generation EUV Pellicle Materials and Performances: From Experimental Design to Material Characterization. 2019. Available online: https://www.diva-portal.org/smash/record.jsf?pid=diva2%3A1333546&dswid=3338 (accessed on 15 January 2025).
  6. Devaraj, L.; Bottiglieri, G.; Erdmann, A.; Wählisch, F.; Kupers, M.; van Setten, E.; Fliervoet, T. Lithographic effects due to particles on high-NA EUV mask pellicle. In Proceedings of the SPIE 35th European Mask and Lithography Conference (EMLC 2019), Dresden, Germany, 17–19 June 2019; Volume 11177, pp. 119–132. [Google Scholar] [CrossRef]
  7. Fomenkov, I.; Brandt, D.; Ershov, A.; Schafgans, A.; Tao, Y.; Vaschenko, G.; Rokitski, S.; Kats, M.; Vargas, M.; Purvis, M.; et al. Light sources for high-volume manufacturing EUV lithography: Technology, performance, and power scaling. Adv. Opt. Technol. 2017, 6, 173–186. [Google Scholar] [CrossRef]
  8. van de Kerkhof, M.A.; van Empel, T.; Lercel, M. Advanced particle contamination control in EUV scanners. In Proceedings of the SPIE International Conference on Extreme Ultraviolet Lithography, Monterey, CA, USA, 15–19 September 2019; Volume 10957, pp. 191–203. [Google Scholar] [CrossRef]
  9. Pollentier, I.; Timmermans, M.Y.; Huyghebaert, C.; Brems, S.; Gallagher, E.E. The EUV CNT pellicle: Balancing material properties to optimize performance. Proc. SPIE 2020, 11323, 113231G. [Google Scholar] [CrossRef]
  10. Scholze, F.; Laubis, C.; Krumrey, M.; Timmermans, M.Y.; Pollentier, I.; Gallagher, E.E. EUV optical characterization of alternative membrane materials for EUV pellicles. Proc. SPIE 2017, 10451, 104510R. [Google Scholar] [CrossRef]
  11. Brouns, D. Development and performance of EUV pellicles. Adv. Opt. Technol. 2017, 6, 221–227. [Google Scholar] [CrossRef]
  12. Pollentier, I.; Vanpaemel, J.; Lee, J.U.; Adelmann, C.; Zahedmanesh, H.; Huyghebaert, C.; Gallagher, E.E. EUV lithography imaging using novel pellicle membranes. In Proceedings of the SPIE Extreme Ultraviolet (EUV) Lithography VII, San Jose, CA, USA, 21–25 February 2016; Volume 9776, pp. 587–600. [Google Scholar] [CrossRef]
  13. Salmaso, G.; Maas, R. A new generation EUV pellicle to enable future EUV lithographic nodes at enhanced productivity. In Proceedings of the SPIE International Conference on Extreme Ultraviolet Lithography, Online, 27 September–1 October 2021; Volume 11854, p. 118540R. [Google Scholar] [CrossRef]
  14. Woo, D.G.; Kim, Y.W.; Jang, Y.J.; Wi, S.J.; Ahn, J. Through-pellicle imaging of extreme ultraviolet mask with extreme ultraviolet ptychography microscope. J. Micro Nanolithogr. MEMS MOEMS 2019, 18, 034005. [Google Scholar] [CrossRef]
  15. Kim, Y.W.; Lee, D.G.; Moon, S.; Ku, C.M.; Cho, J.H.; Ahn, J. Actinic patterned mask imaging using extreme ultraviolet ptychography microscope with high harmonic generation source. Appl. Phys. Express 2022, 15, 076505. [Google Scholar] [CrossRef]
  16. Levinson, H.J. High-NA EUV lithography: Current status and outlook for the future. Jpn. J. Appl. Phys. 2022, 61, SD0803. [Google Scholar] [CrossRef]
  17. Gardner, D.F.; Tanksalvala, M.; Shanblatt, E.R.; Zhang, X.; Galloway, B.R.; Porter, C.L.; Karl, R.; Bevis, C.; Adams, D.E.; Kapteyn, H.C.; et al. Subwavelength coherent imaging of periodic samples using a 13.5 nm tabletop high-harmonic light source. Nat. Photonics 2017, 11, 259–263. [Google Scholar] [CrossRef]
  18. Levinson, H.J. Principles of Lithography; SPIE Press: Bellingham, WA, USA, 2005. [Google Scholar] [CrossRef]
  19. Gouesbet, G.; Gréhan, G. Generalized Lorenz-Mie Theories; Springer: Berlin/Heidelberg, Germany, 2011. [Google Scholar] [CrossRef]
  20. Frisvad, J.R. Phase function of a spherical particle when scattering an inhomogeneous electromagnetic plane wave. J. Opt. Soc. Am. A Opt. 2018, 35, 669–680. [Google Scholar] [CrossRef] [PubMed]
  21. Frisvad, J.R.; Revall, J.; Christensen, N.J. Computing the scattering properties of participating media using Lorenz-Mie theory. In Proceedings of the ACM SIGGRAPH, San Diego, CA, USA, 5–9 August 2007; p. 60. [Google Scholar] [CrossRef]
  22. Nieto-Vesperinas, M. Fundamentals of Mie scattering. In Dielectric Metamaterials; Woodhead Publishing: Sawston, UK, 2020. [Google Scholar] [CrossRef]
  23. Cserti, J.; Áron, H.; László, O. Snell’s law in multirefringent systems. Phys. Rev. B 2025, 111, L041110. [Google Scholar] [CrossRef]
  24. Ziwei, L.; Lina, S.; Tanchao, P.; Hailiang, L.; Jiebin, N.; Guanya, W.; Changqing, X. Two-dimensional gratings of hexagonal holes for high-order diffraction suppression. Opt. Express 2017, 25, 1339–1349. [Google Scholar]
  25. van Setten, E.; Bottiglieri, G.; McNamara, J.; van Schoot, J.; Troost, K.; Zekry, J.; Fliervoet, T.; Hsu, S.; Zimmermann, J.; Roesch, M.; et al. High NA EUV lithography: Next step in EUV imaging. Proc. SPIE 2019, 10957, 1095709. [Google Scholar] [CrossRef]
  26. Goodman, J.W. Introduction to Fourier Optics; Roberts and Company Publishers: Greenwood Village, CO, USA, 2005. [Google Scholar]
  27. Naulleau, P.; Anderson, C.N.; Chao, W.; Goldberg, K.A.; Gullikson, E.; Salmassi, F.; Wojdyla, A. Ultrahigh efficiency EUV contact-hole printing with chromeless phase shift mask. In Proceedings of the SPIE Photomask Japan, Yokohama, Japan, 6–8 April 2016; Volume 9984, p. 99840P. [Google Scholar]
Figure 1. Schematic of the through-pellicle mask imaging setup in the EUV ptychography microscope: (a) The optical system consists of two mirrors, a CCD, an EUV mask with various patterns of identical pitch sizes, and a pellicle with patterned Sn particles. Mask patterns were illuminated by adjusting the mask positioning stage, and a piezoelectric stage positioned the pellicle to selectively obstruct mask diffraction or allow transmission through particle-free regions. (b) Illumination of the EUV mask at a 6° angle, with diffraction by mask patterns followed by selective obstruction of specific mask diffraction orders by the patterned Sn particle.
Photonics 12 00266 g001
Figure 2. Setup for mask imaging through a pellicle with patterned Sn particles and mask patterns: (a) Schematic of the EUV ptychography microscope in a through-pellicle imaging setup. The orientations of the mask patterns are depicted with respect to the direction of the incident EUV light. (b) Optical microscopy image of 10 μm × 10 μm patterned Sn particle on the pellicle surface after Si wet etch process. (c) EUV intensity loss map around a patterned Sn particle, with gray dashed lines indicating the particle edges. Scanning electron microscopy images show (d) V-L/S pattern and (e) C/H pattern, both with a critical dimension of 200 nm.
Photonics 12 00266 g002
Figure 3. Through-pellicle diffraction patterns for (a) V-L/S and (b) C/H masks without particle obstruction. Patterns were cropped to show only the 0.0825 NA (gray dashed line) region at the mask, corresponding to an EUV scanner with 4× magnification. ‘I’ indicates the maximum intensity (in counts) of each diffraction order.
Photonics 12 00266 g003
Figure 4. Through-pellicle diffraction patterns within 0.0825 NA (gray dashed line) region for (a,b) V-L/S and (ce) C/H patterns obstructed by a 10 μm × 10 μm patterned Sn particle: (a,b) Diffraction patterns with zeroth- and first-order-diffracted light obstructed, respectively. (ce) Diffraction patterns with zeroth-, horizontal first (H-1st)-, and diagonal first (D-1st)-order diffracted light obstructed, respectively.
Photonics 12 00266 g004
Figure 5. (a) Schematic of Lorenz–Mie phase function for a homogeneous incident wave, visualized using an open-source tool (https://people.compute.dtu.dk/jerf/code/phase/ (accessed on 15 Janunary 2025)) based on the complex refractive index of Sn from the Center for X-ray Optics database. The figure represents S-polarized 13.5 nm waves scattered by Sn particles sized 1 nm (top), 10 nm (middle), and 10 μm (bottom). (b) Schematic of scattering interactions between a 10 μm × 10 μm patterned particle and coherent EUV light. The thickness of the Sn particle was exaggerated for visualization.
Photonics 12 00266 g005
Figure 6. Validation of diffraction orders with and without particle obstruction using diffraction patterns: (a,b) Zeroth- and first-order diffracted light of V-L/S patterns with and without particle obstruction, respectively. (ce) Zeroth-, H-1st-, and D-1st-order diffracted light of C/H patterns with and without particle obstruction, respectively. ‘I’ denotes the maximum intensity of each diffraction order. Small insets show the shapes and sizes ( p i x e l s x × p i x e l s y ) of each diffracted light with and without obstruction at the CCD.
Photonics 12 00266 g006
Figure 7. (a) Schematic of mask diffraction position shift induced by refraction. The refraction angles at SiNx and Sn were determined based on the incident mask diffraction angle and Snell’s law. Green and orange lines represent the optical paths through the membrane and Sn particle, respectively, while the gray dashed line indicates the path without the Sn particle. (b) Schematic of mask diffraction position shift resulting from particle-induced diffraction. The diffraction angle was determined by the incident mask diffraction angle, as defined using Equation (2). The thicknesses of Sn and SiNx were exaggerated for visualization purposes.
Photonics 12 00266 g007
Figure 8. Comparison of mask pattern image data reconstructed from V-L/S diffraction patterns with and without particle obstruction: (a) Reconstructed mask pattern image. (b) Phase retrieval transfer function. Indices 1, 2, and 3 correspond to results from unobstructed, zeroth-, and first-order obstructed diffraction patterns, respectively. (c) Comparison of normalized intensity profiles along the colored lines in the reconstructed images, representing the associated variations in imaging performance.
Photonics 12 00266 g008
Figure 9. Comparison of mask pattern image data reconstructed from C/H diffraction patterns with and without particle obstruction: (a) Reconstructed mask pattern image. (b) Phase retrieval transfer function. Indices 1, 2, 3, and 4 correspond to results from unobstructed, zeroth-, H-1st-, and D-1st-order obstructed diffraction patterns, respectively. Normalized intensity profiles of reconstructed images compared for (c) H and (d) V directions, with extracted CD variation, image contrast, and pattern shift.
Photonics 12 00266 g009
Table 1. Maximum intensity loss of mask diffraction orders obstructed by an Sn particle with a 10 μm × 10 μm square shape and 500 nm thickness.
Mask PatternObstructed Diffraction OrderMaximum Intensity Loss
V-L/SZeroth-order85.4%
First-order86.4%
C/HZeroth-order85.9%
Horizontal first-order87.9%
Diagonal first-order88.2%
Disclaimer/Publisher’s Note: The statements, opinions and data contained in all publications are solely those of the individual author(s) and contributor(s) and not of MDPI and/or the editor(s). MDPI and/or the editor(s) disclaim responsibility for any injury to people or property resulting from any ideas, methods, instructions or products referred to in the content.

