Article

Resolution Enhancement in Extreme Ultraviolet Ptychography Using a Refined Illumination Probe and Small-Etendue Source

1
Division of Nanoscale Semiconductor Engineering, Hanyang University, Seoul 04763, Republic of Korea
2
Center for Hyperscale, Hyperfunction, Heterogeneous Integration Pioneering Semiconductor Technology, Hanyang University, Seoul 04763, Republic of Korea
3
Division of Materials Science and Engineering, Hanyang University, Seoul 04763, Republic of Korea
*
Authors to whom correspondence should be addressed.
Photonics 2025, 12(8), 831; https://doi.org/10.3390/photonics12080831 (registering DOI)
Submission received: 28 July 2025 / Revised: 15 August 2025 / Accepted: 20 August 2025 / Published: 21 August 2025

Abstract

Extreme ultraviolet (EUV) ptychography is a promising actinic mask metrology technique capable of providing aberration-free images with subwavelength resolution. However, its performance is fundamentally constrained by the strong absorption of EUV light and the limited detection of high-frequency diffraction signals, which are critical for resolving fine structural details. In this study, we demonstrate significant improvements in EUV ptychographic imaging by implementing an upgraded EUV source system with reduced source etendue and applying an illumination aperture to spatially refine the probe. This approach effectively enhances the photon flux and spatial coherence, resulting in an increased signal-to-noise ratio of the high-frequency diffraction components and an extended maximum detected spatial frequency. Simulations and experimental measurements using a Siemens star pattern confirmed that the refined probe enabled more robust phase retrieval and higher-resolution image reconstruction. Consequently, we achieved a half-pitch resolution of 46 nm, corresponding to a critical dimension of 11.5 nm at the wafer plane. These findings demonstrate the enhanced capability of EUV ptychography as a high-fidelity actinic metrology tool for next-generation EUV mask characterization.

1. Introduction

With the continued downscaling of semiconductor devices, extreme ultraviolet (EUV) lithography is expected to be applied to sub-3 nm technology nodes in the near future [1,2,3,4]. Therefore, mask manufacturers are actively exploring new absorber materials and structural designs to enable finer pattern critical dimensions (CDs) in next-generation EUV masks. To accurately evaluate their performance, actinic patterned mask metrology techniques capable of nanometer-scale spatial resolution are essential. Such techniques must operate at a wavelength identical to that of EUV lithography and adopt a 6° mask illumination angle, consistent with that adopted in EUV scanners [5,6,7].
Coherent diffractive imaging (CDI) has emerged as a potential technique for characterizing structural and material properties using short-wavelength radiation, such as EUV and X-rays. Its lensless architecture enables aberration-free imaging with a subwavelength spatial resolution, rendering it suitable for high-resolution analysis in nanoscale metrology [8,9,10,11,12,13,14]. Among the various CDI techniques, ptychography, a multi-shot approach, reconstructs complex-valued object and phase images based on far-field diffraction patterns captured with overlapping probe areas. This method offers a large field of view beyond the limitation of a single probe area and provides robust and accurate phase retrieval, making it particularly effective for analyzing both the amplitude and phase of fine structures, such as those found in semiconductor devices [15,16,17,18,19]. However, because of its fundamental reliance on the diffraction signals of the object, the reconstruction of high-resolution and high-fidelity images in CDI critically depends on the availability of high-frequency (HF) diffraction components that encode fine structural information. In the EUV regime, this poses a significant challenge because of strong absorption and limited diffraction efficiency, both of which impede the acquisition of sufficient HF diffraction signals and diffraction diversity [16,20,21].
Our previous studies have demonstrated the feasibility of using an EUV ptychography microscope as an actinic metrology tool by reliably reconstructing the amplitude and phase maps of periodic patterns, including those relevant to phase-shift mask designs for next-generation EUV lithography [22,23]. Building on this foundation, this study investigated improvements in the imaging performance of the EUV ptychography microscope through both simulations and experimental analyses. We observed that the increased photon flux and probe refinement significantly enhanced the signal-to-noise ratio (SNR) of the diffraction signals and extended the maximum detected spatial frequency. Furthermore, by comparing the reconstructed complex-valued images obtained before and after the probe improvement, we validated the enhanced capability of EUV ptychography as an actinic patterned mask metrology tool.

2. Experimental Details

2.1. Probe Refinement Using Small-Etendue EUV Source and Illumination Aperture

Figure 1 shows a schematic of the source-upgraded EUV ptychography microscope. The system consists of a coherent EUV source and an imaging chamber with a 6° oblique incidence illumination geometry.
Coherent EUV radiation was produced via a high-harmonic generation (HHG) process. Among the generated harmonic waves, only the 13.5 nm wavelength was spectrally filtered for use. The EUV source system employed in our previous studies [22,24] was upgraded to reduce the source etendue, thereby enhancing the photon flux and coherence. This modification enables an efficient concentration of photons in the locally illuminated region of the mask pattern, thereby enhancing the diffraction signals and improving the performance of ptychographic imaging.
To initiate the HHG process, a new infrared (IR) driving laser (Astrella-USP-1k, Coherent) with an output power of 7 W, which is three times greater than that of the previous system, was introduced. Compared with a conventional laser, it provides a narrower spectral bandwidth, improving the temporal coherence of the generated EUV radiation and thus contributing to resolution enhancement [25]. To further improve photon flux and spatial coherence, a high-vacuum gas-cell chamber (<10−8 torr) was installed, replacing the conventional configuration in which the gas cell was located within the source chamber. The enhanced vacuum enabled a higher Ne gas flow rate (up to 600 sccm) and increased the harmonic interactions. Additionally, by extending the focal length by a factor of 1.67 using an IR spherical mirror with a 2000 mm radius of curvature (ROC), the divergence angle of the EUV emission was reduced and the source etendue effectively decreased. The upgraded EUV source system generates 13.5 nm of EUV radiation with a spectral bandwidth of λ / λ = 315 and an output power of 40 nW. The radiation subsequently propagates into the CDI optical system in the imaging chamber. To reliably assess the impact of increased photon flux and probe refinement on the diffraction signal acquisition and ptychographic imaging, a constant EUV photon flux was maintained using a closed-loop stabilizer system that continuously regulated the driving laser power in real time.
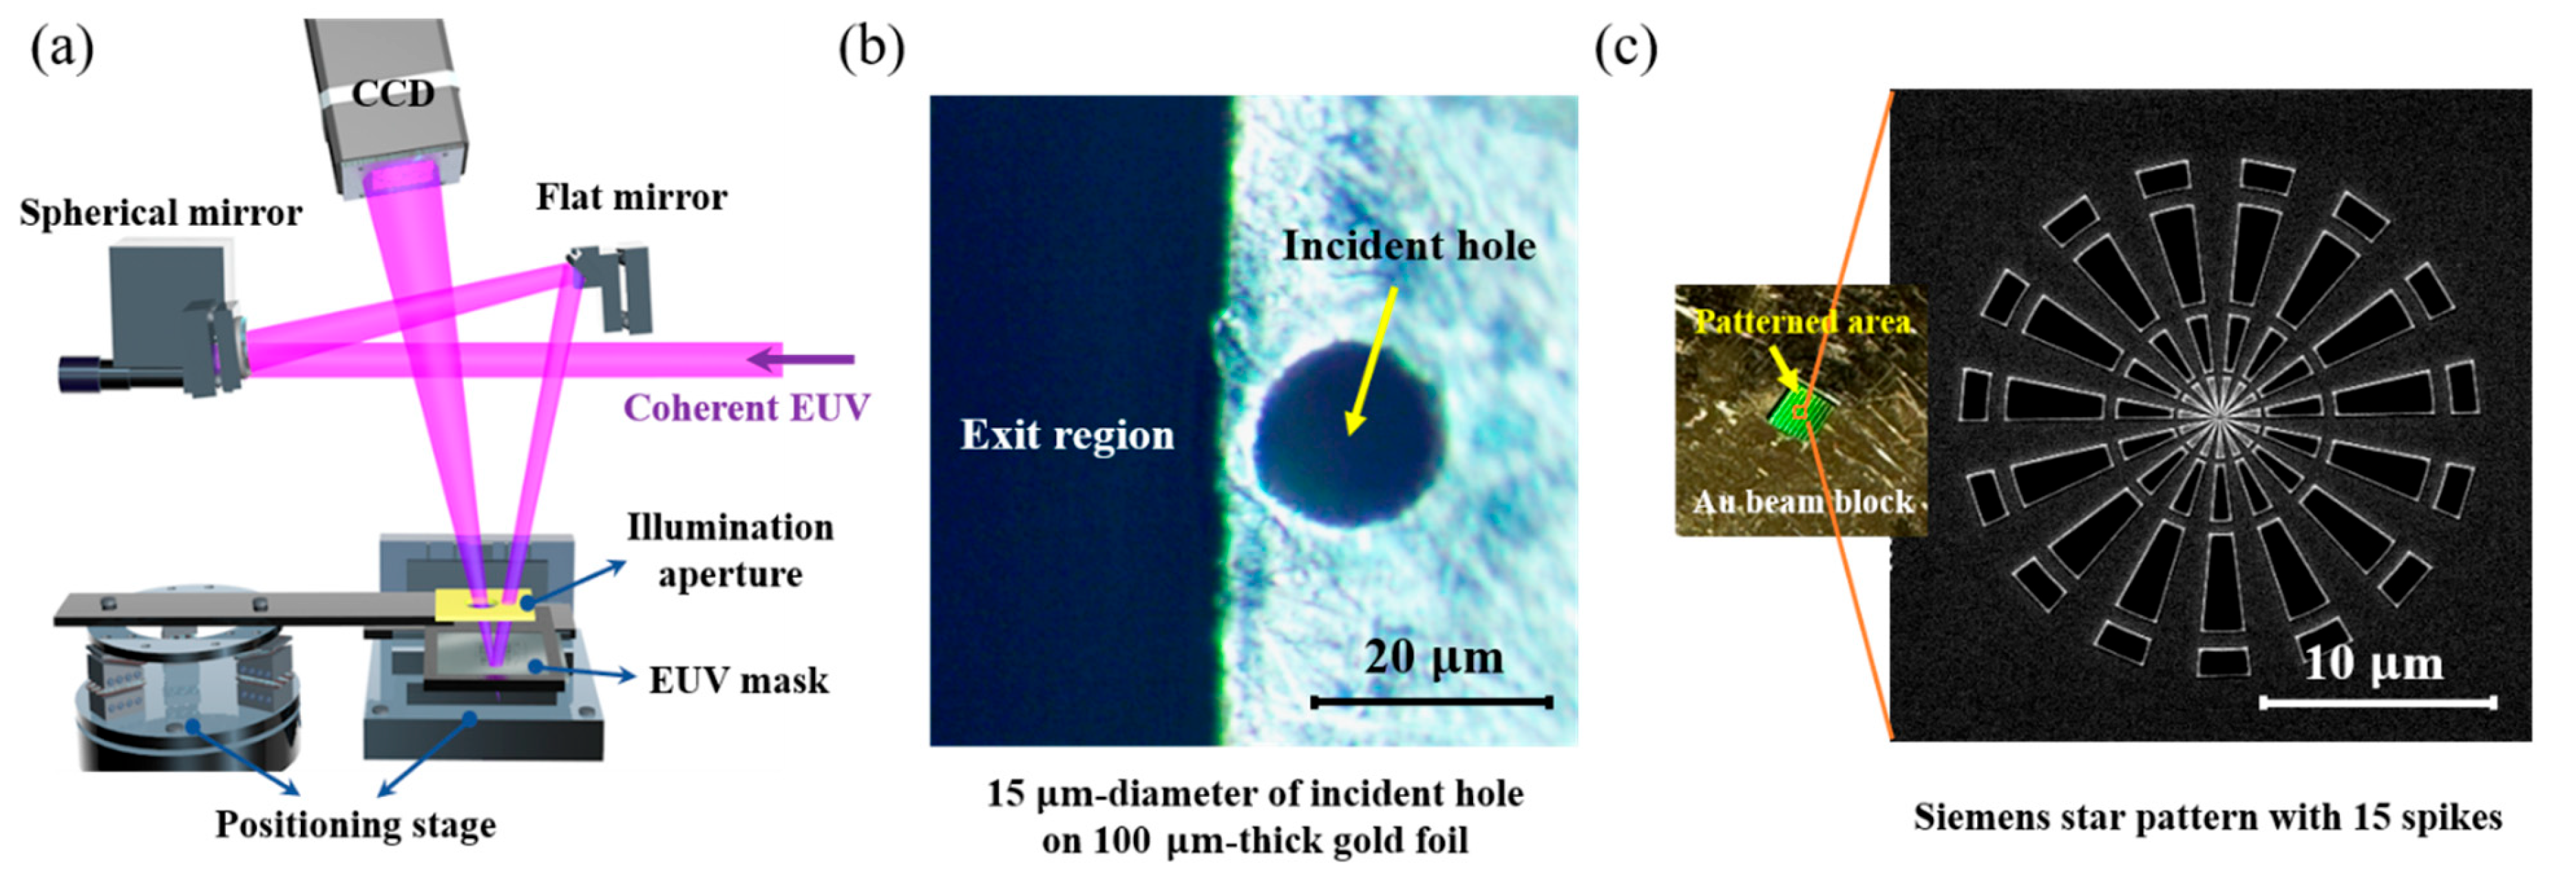
The CDI optical system, shown in Figure 2a, comprises a spherical mirror with a ROC of 330 mm for focusing the EUV beam onto the mask and a flat mirror to achieve a 6° oblique incidence angle, generating a focused beam with a full width at half maximum (FWHM) of 10 μ m at the mask plane. Figure 2b shows the illumination aperture, fabricated by laser-drilling a 15 μ m diameter incident hole into a 100 μ m -thick gold foil, with an open exit region behind. The aperture, positioned just above the mask using a piezoelectric stage with 1 nm precision, blocked stray light outside the incident hole, thereby forming a spatially refined probe. The focused beam was diffracted by mask patterns, and the resulting diffraction patterns were collected using a charge-coupled device (CCD) detector (PI-MTE3) placed 100 mm downstream, satisfying the far-field diffraction condition. The detection area of dimension 30.7 × 30.7 m m 2 corresponds to a numerical aperture (NA) of 0.152 at the mask, determining a theoretical half-pitch resolution of 44.5 nm.
To evaluate the impact of increased photon flux and probe refinement on the HF diffraction signal acquisition and reconstructed image quality, we employed a Siemens star pattern that is highly sensitive to both positional errors and phase-retrieval fidelity [26]. As shown in Figure 2c, the pattern features radially decreasing CDs toward the center, reaching a minimum CD of 10 nm, making it suitable for evaluating the resolution enhancement. The mask was fabricated at the Laboratory for X-ray Nanoscience and Technologies at the Paul Scherrer Institute via electron beam lithography using a 140 nm-thick hydrogen silsesquioxane absorber on a Mo/Si multilayer. Ptychographic datasets were acquired by raster-scanning 121 positions with approximately 80% probe overlap across the central region of the pattern using a 3-axis stage with 1 nm positioning accuracy [27]. At this time, to suppress background noise originating from reflections from the multilayer region of the mask, a 100 μ m thick gold foil-based beam blocker was mounted on the EUV mask, allowing only the patterned area to be exposed. Subsequently, image reconstruction was performed using 2000 iterations of the regularized ptychographical iterative engine algorithm, incorporating modulus-enforced probe (MEP) constraints to mitigate crosstalk errors between the probe and object [18,28,29]. The total acquisition time for the datasets was less than 2.5 min, and the subsequent phase retrieval process required approximately 1.5 h. Finally, the spatial resolution of the reconstructed images was quantified using a Fourier ring correlation (FRC) analysis based on the half-bit threshold criterion [16,30].

2.2. Simulation-Driven Diffraction Signal Analysis in the Fourier Domain

To investigate the contribution of the spatial frequency components in the diffraction signal of the object to image formation and predict the impact of probe refinement on the HF diffraction signal acquisition, a Fourier transform-based simulation study was conducted using MATLAB (Version R2020a, MathWorks). First, a mask pattern image was Fourier-transformed, and a series of high-pass filters with varying cutoff sizes was applied. Then, each filtered diffraction signal was inverse Fourier transformed to analyze the contribution of specific frequency regions to the image formation. In addition, the SNR enhancement of the HF diffraction signals owing to probe refinement was simulated based on the diffraction pattern computation process within a ptychographic framework. In this context, the probe and mask patterns are represented by a complex-valued probe function P r and object function O r , respectively, where r denotes the real-space coordinate. The exit wave function, ψ r , can be described as a convolution of the probe and object functions and is typically approximated as a simple multiplication for thin samples such as EUV masks [19]. The position of the object relative to the probe is defined by the step vector R j , and the exit wave function at the jth scan position is given by Equation (1).
ψ j r = P j r O j r R j .
The corresponding wave function in the frequency domain, Ψ j u , was obtained by the Fourier transformation of the exit wave function (Equation (2)), where u denotes the Fourier-space coordinate. The intensity distribution of the far-field diffraction pattern can be represented by the squared modulus of the wave function in the frequency domain (Equation (3)) [31].
Ψ j u = F ψ j r ,
I j u = F P j r O j r R j 2
The simulation assumes a Gaussian-shaped probe and sets the object as the corresponding region of the mask pattern image. The resulting diffraction patterns were modeled within the maximum spatial frequency range determined by the NA of the optical system. The NA and corresponding maximum spatial frequency are defined by Equations (4) and (5), respectively.
NA = s i n t a n 1 D 2 L ,
Maximum spatial frequency = N A λ ,
where D is the width of the detector window, L is the mask-to-detector distance, and λ is the wavelength of light. The simulated diffraction patterns were scaled such that their maximum intensities matched the dynamic range (DR) of the CCD detector. We analyzed the changes in the SNR of the HF diffraction components using an identical probe overlapping ratio for both the conventional and source-upgraded systems. Furthermore, common and difference maps were extracted from simulated diffraction patterns of 1024 × 1024 pixels—matching the CCD detector used in the imaging system—at adjacent scan positions. The common map was generated by selecting the smaller intensity value at each corresponding pixel, while the difference map was obtained from the pixel-wise intensity difference. These maps were then compared to evaluate the phase continuity and diffraction diversity.

3. Result and Discussion

3.1. Simulation Study of HF Diffraction Signal Improvement for Ptychographic Imaging

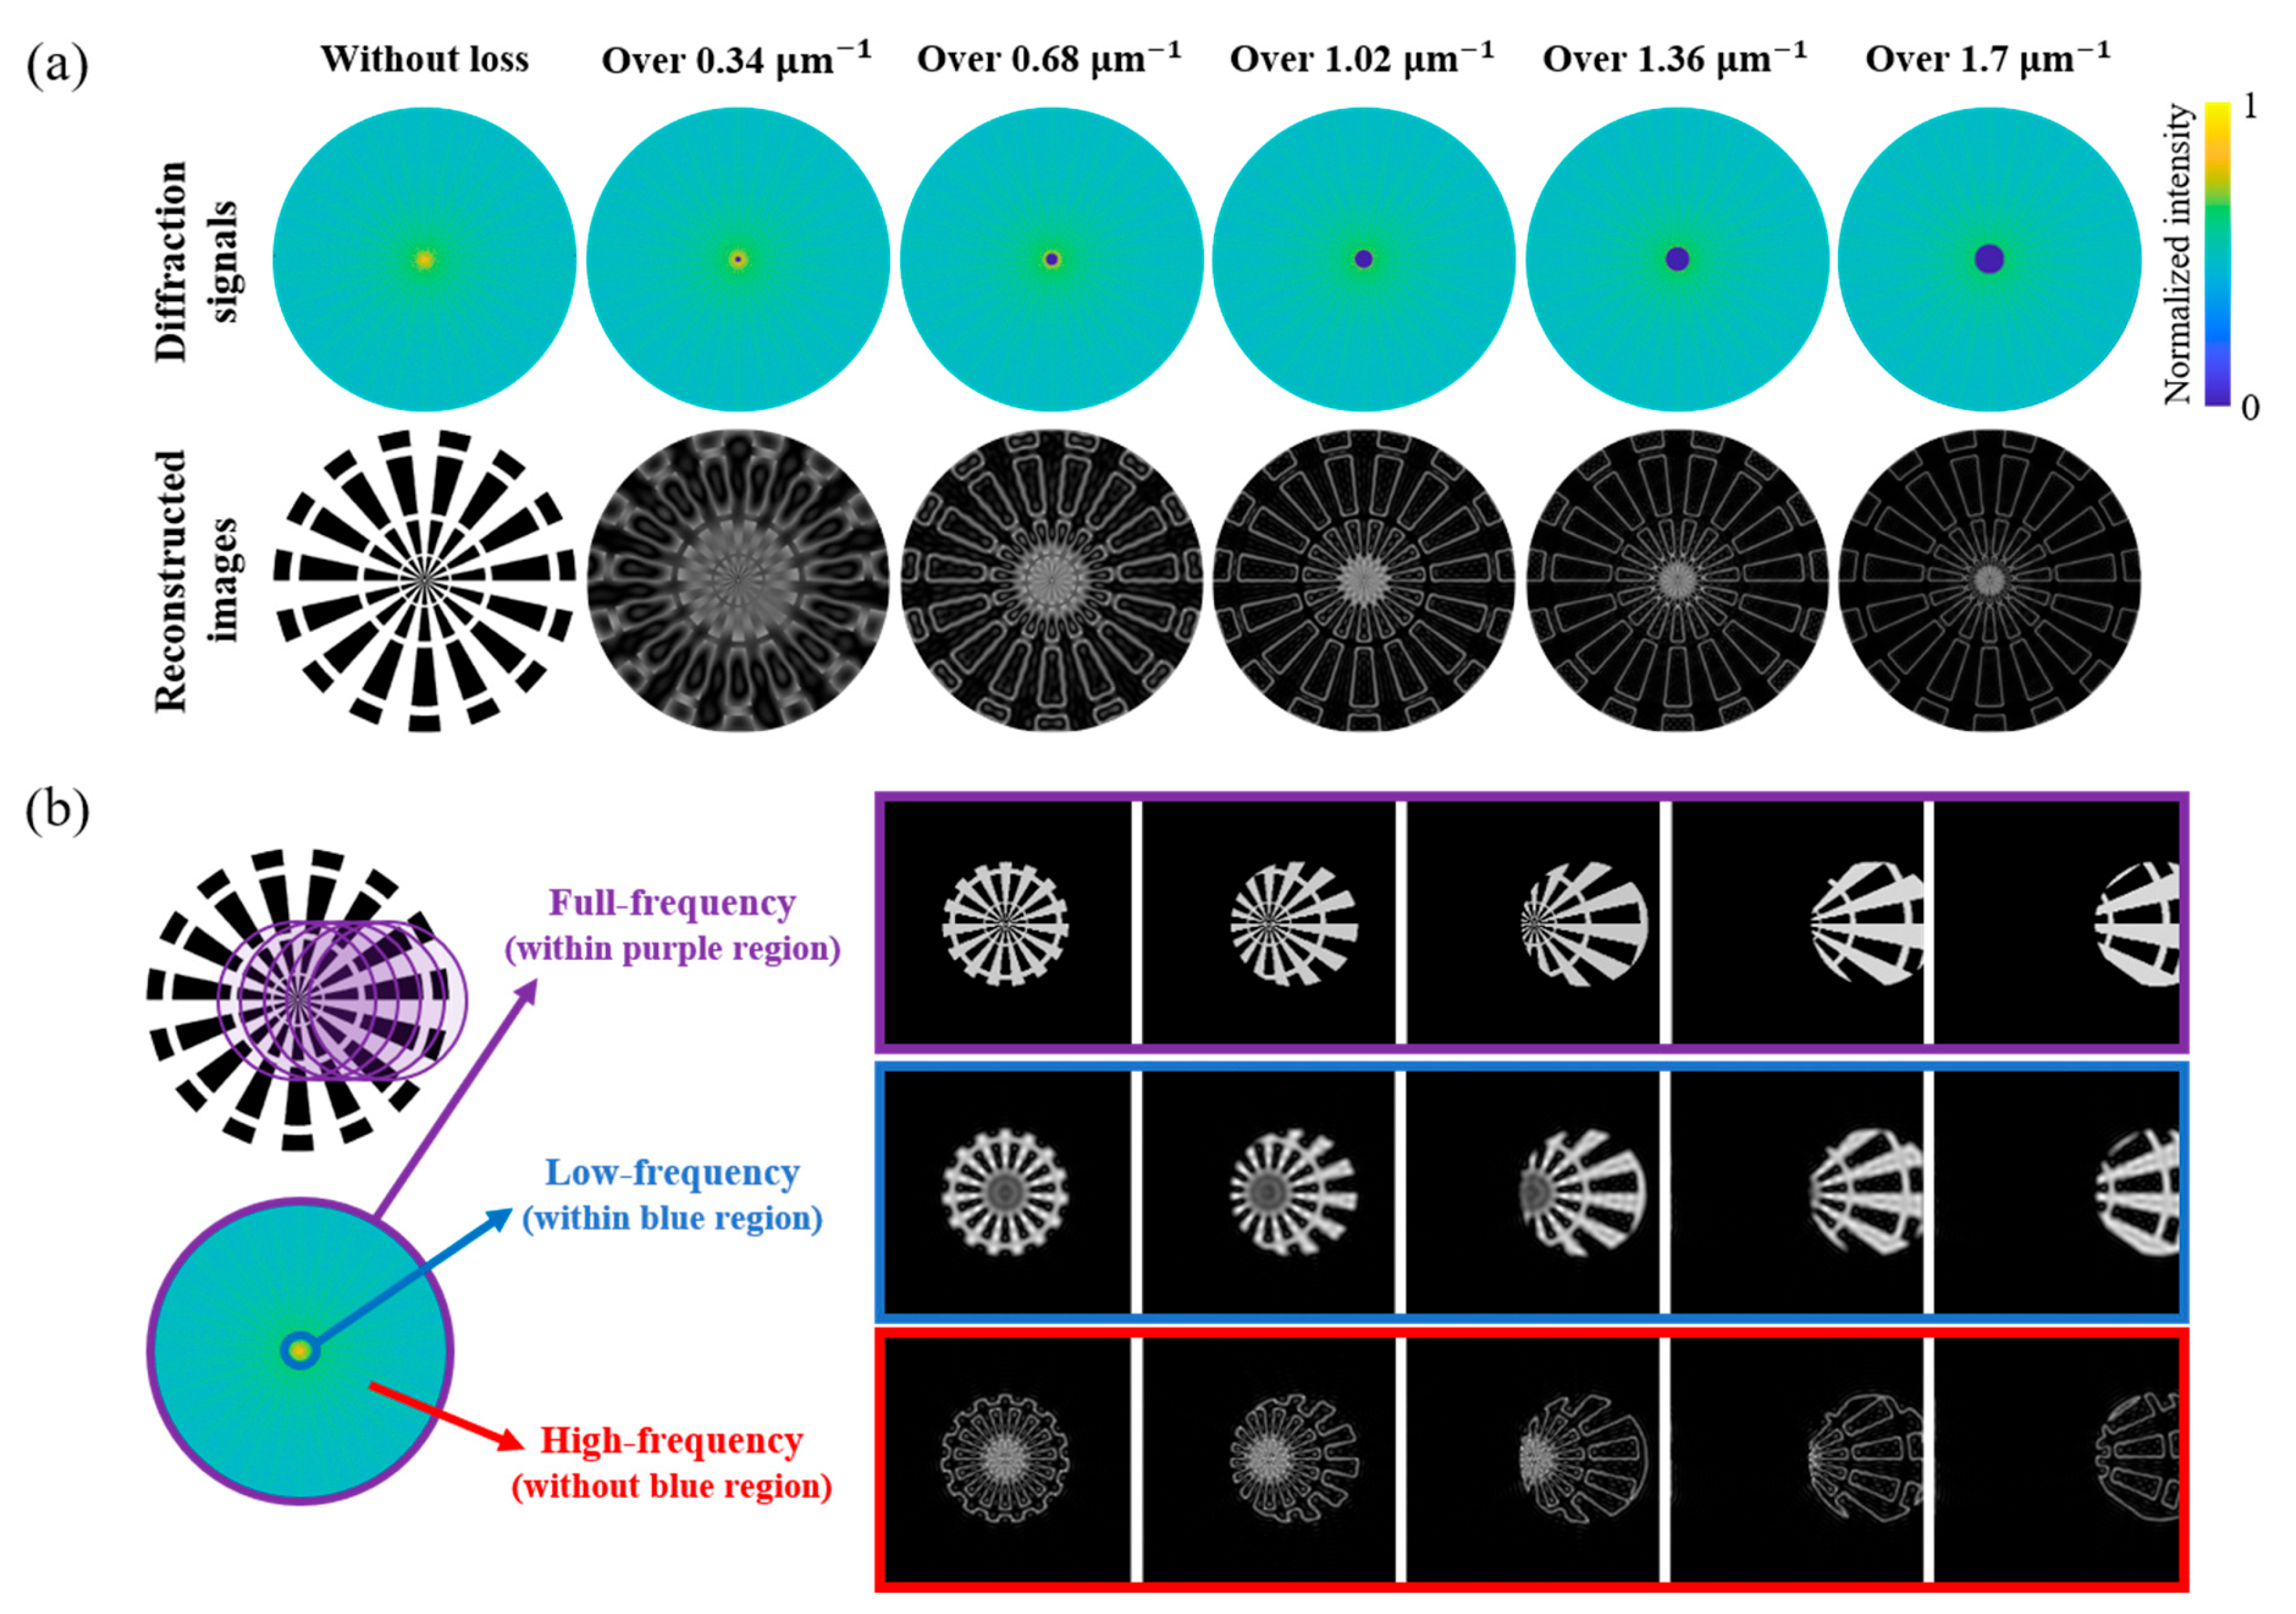
Figure 3 shows the simulation results of the impact of HF diffraction signals on image formation. As shown in Figure 3a, a series of high-pass filters with varying cutoff frequencies was applied to the diffraction signal of the Siemens star pattern. Then, each filtered diffraction signal was inverse Fourier transformed to visualize the corresponding real-space image. The results indicate that as the low-frequency components are increasingly eliminated, only the edge of the pattern remains visible. This observation confirms that the HF diffraction components predominantly encode the fine structural features of the object. Figure 3b compares the reconstructed images obtained under three different conditions: full diffraction signal, only low-frequency components, and only high-frequency components. When the full diffraction signal was used, the reconstructed images exhibited both an overall pattern shape and sharp edges across all probe positions. By contrast, images reconstructed based solely on low-frequency components appeared significantly blurred, and the central region of the Siemens star, where the feature size is smaller, remained unresolved. By contrast, reconstructions based solely on high-frequency components effectively retrieved high-resolution details, including the central region and sharp edges that define the structural boundaries of the pattern. These results highlight the importance of ensuring sufficient HF diffraction signals for accurate and high-resolution image reconstruction in CDI. The inability to reconstruct fine CDs in the absence of HF diffraction signals underscores their essential contribution to enabling both high resolution and reconstruction fidelity.
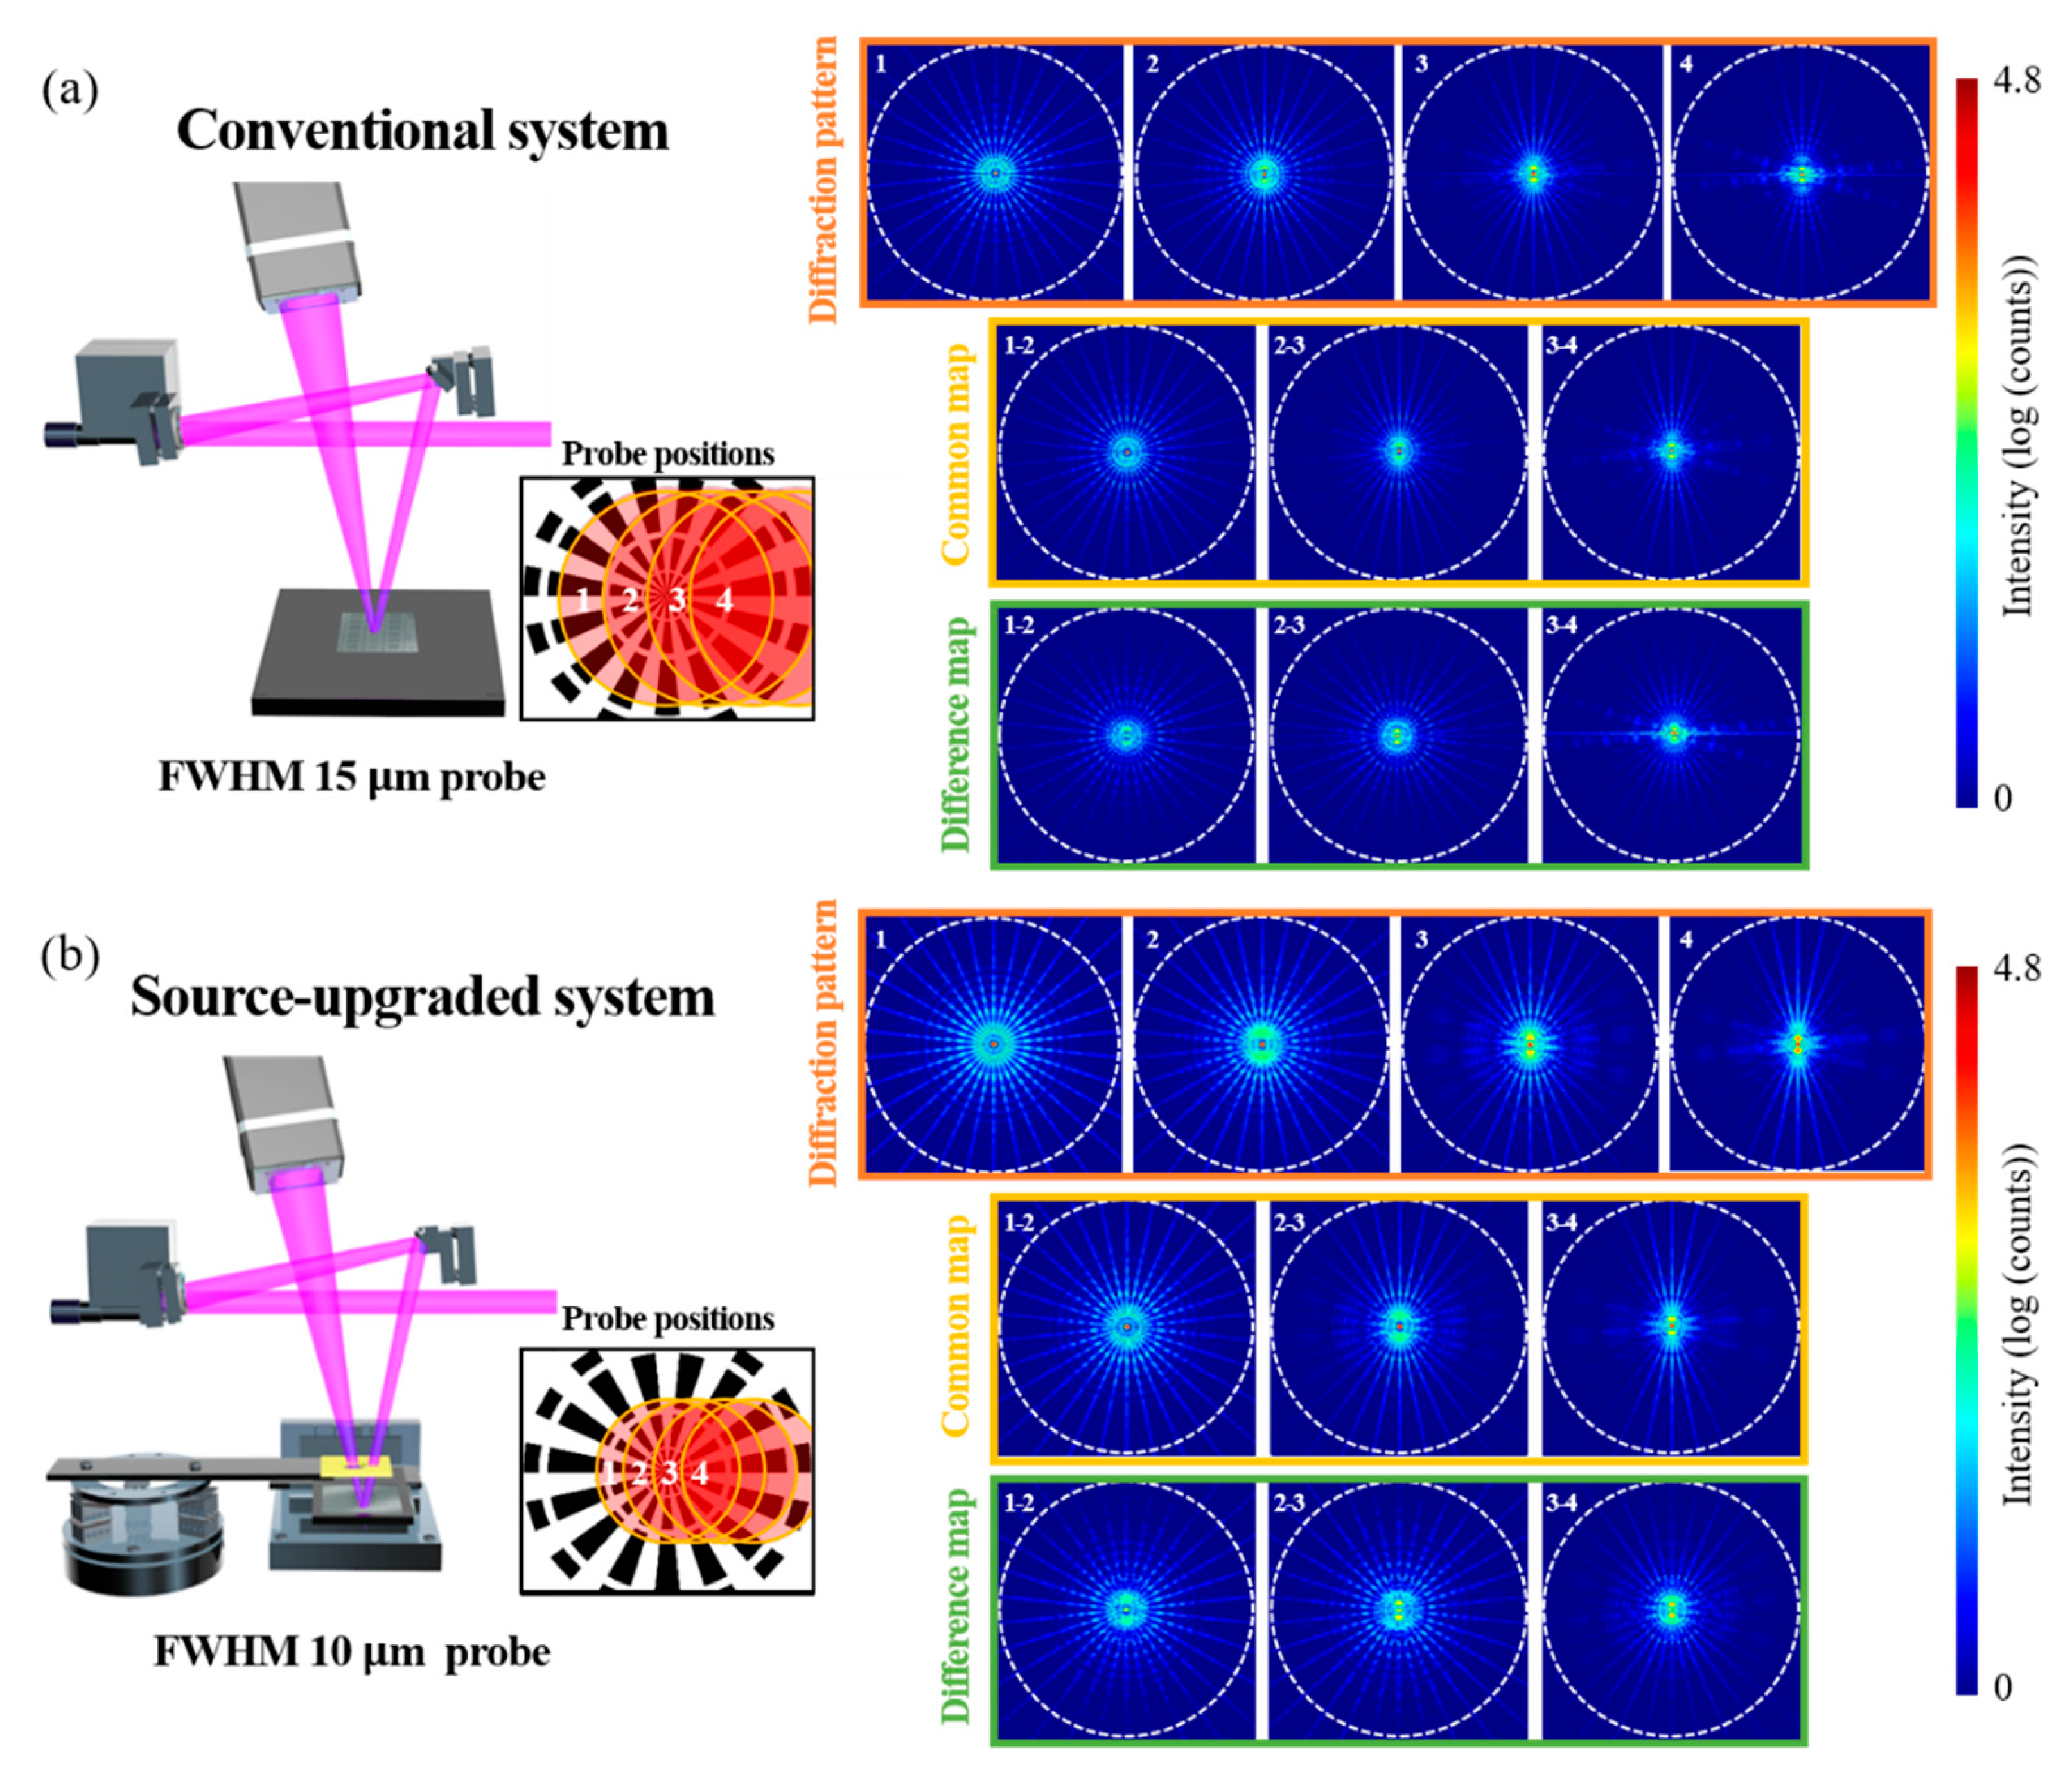
To evaluate the enhancement of the HF diffraction signals achieved through a source upgrade and probe refinement, we compared the diffraction patterns acquired under identical scanning conditions with an 80% probe overlap. Figure 4 compares the conventional system employing a probe with an FWHM of 15 μ m and the source-upgraded system utilizing a refined probe with an FWHM of 10 μ m . In both cases, diffraction patterns at four different positions of the Siemens star pattern were simulated. The diffraction patterns at each scan position were scaled such that their maximum intensity reached the DR of the CCD detector, and all the results were visualized within the spatial frequency range corresponding to an NA of 0.152 at the mask. As shown in Figure 4, a comparison of the diffraction patterns acquired at each scan position reveals that the refined illumination leads to a higher SNR across the entire frequency spectrum, with notable gains in the HF region. This improvement is attributed to the broader spectral distribution of the probe in the Fourier domain resulting from its spatial confinement in real space. In ptychographic imaging, phase continuity across adjacent scan positions is maintained through redundant information encoded in the diffraction signals from probe-overlapped object regions. In addition, the diffraction diversity between the diffraction patterns serves as an independent constraint that determines the phase of the newly illuminated object regions when the probe is scanned [15]. To evaluate these two aspects, we derived common and difference maps from pairs of diffraction patterns corresponding to the neighboring probe positions. Despite having an identical probe overlap ratio, both the common and difference maps demonstrated that the diffraction datasets acquired with the refined probe improved the phase redundancy and diffraction diversity across the entire frequency range. The enhancement of redundancy and diversity in the HF diffraction region underscores the advantages of probe refinement in improving the phase retrieval robustness and reconstruction accuracy of finer structures in ptychographic imaging.

3.2. Resolution Enhancement in Ptychographic Imaging Through High-Frequency Diffraction Signal Enhancement

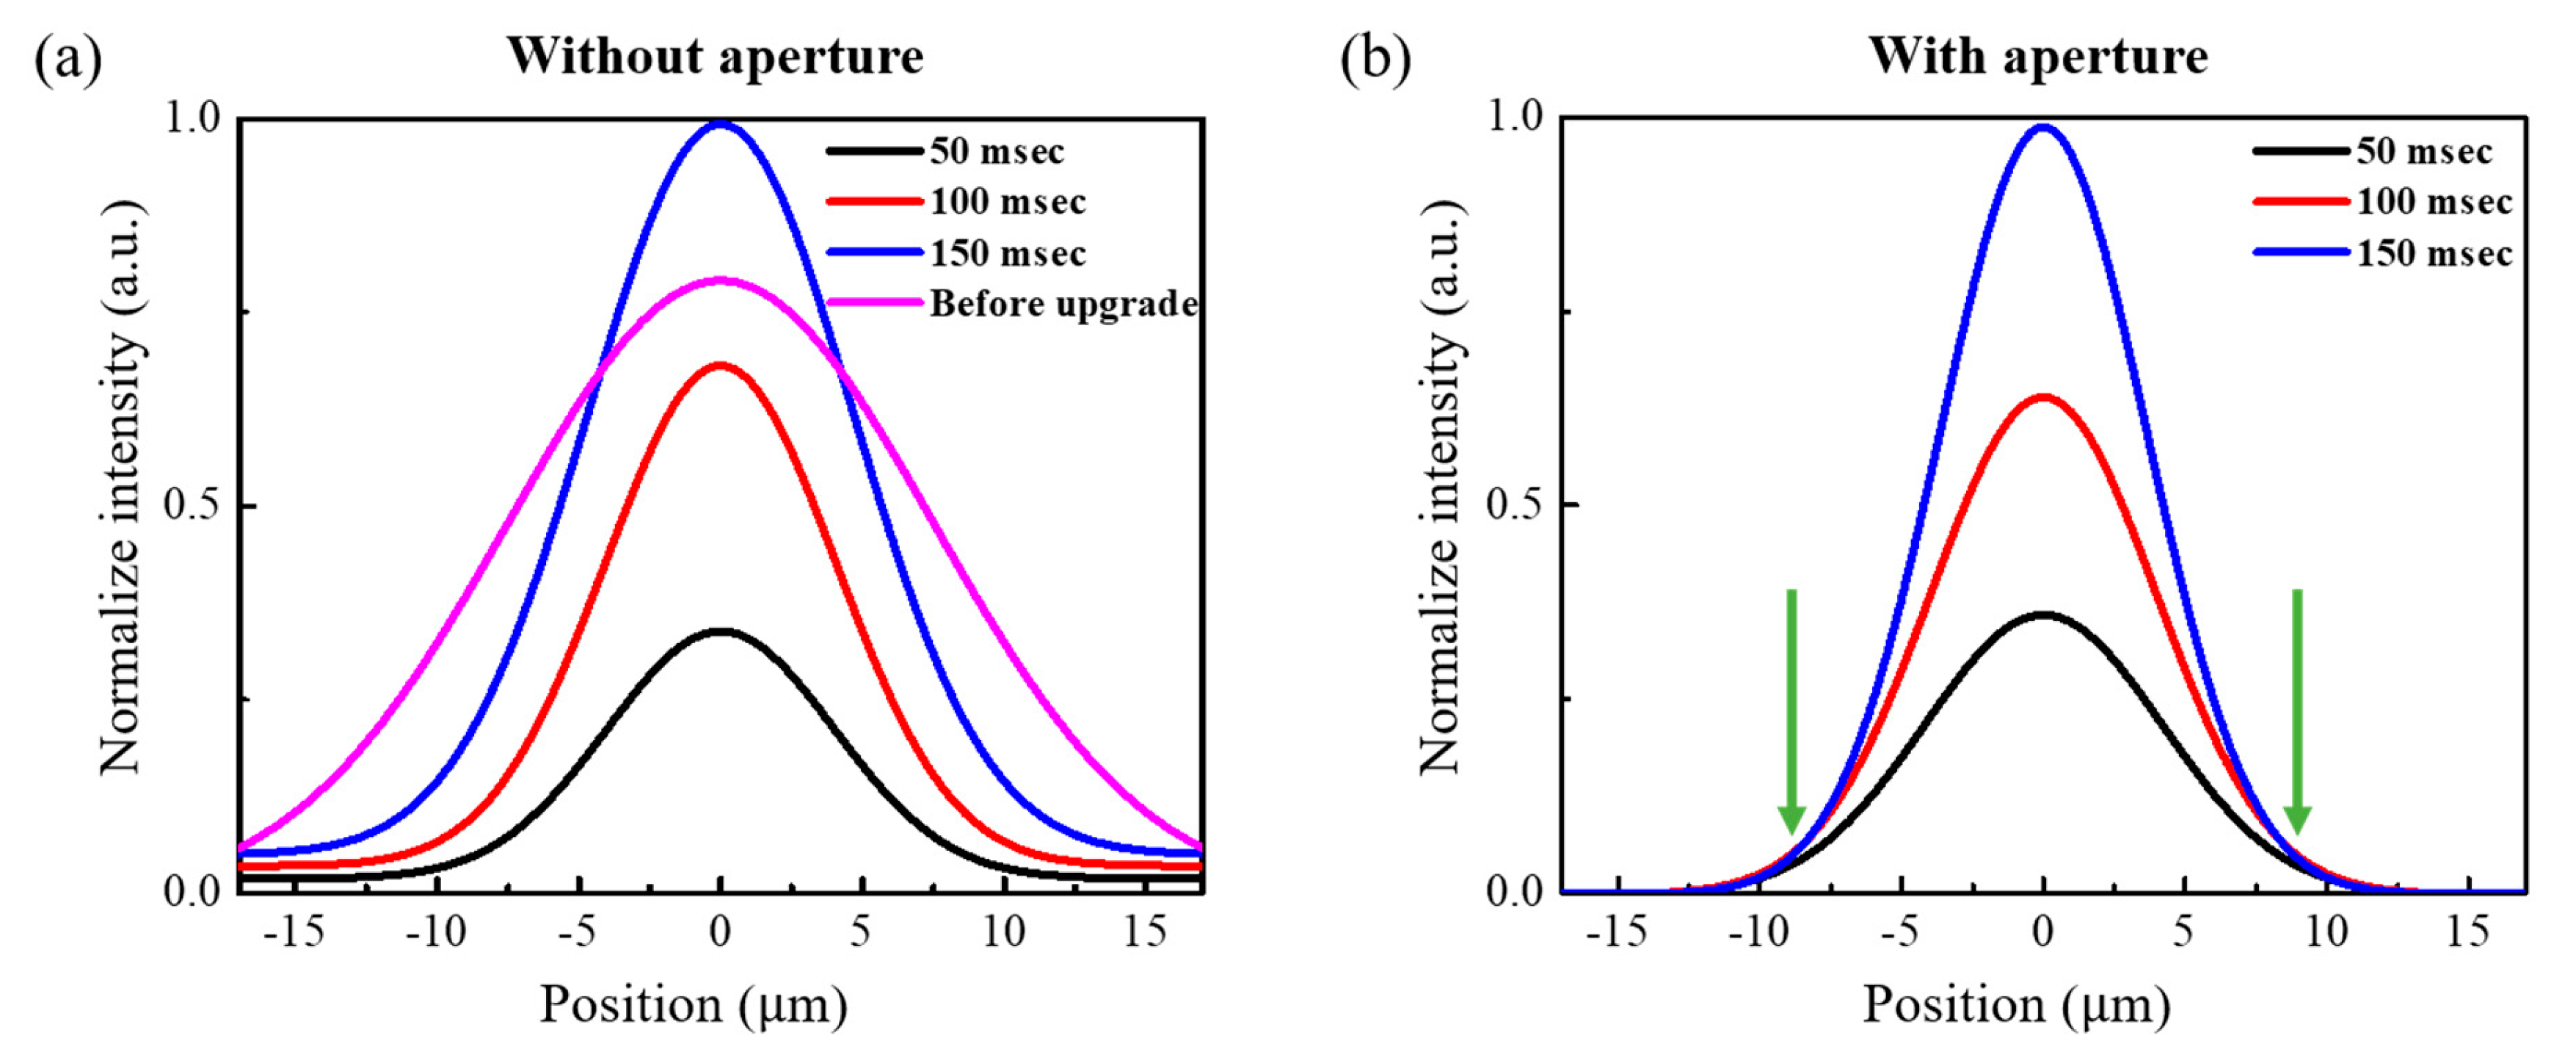
The impact of the source upgrade and application of the illumination aperture on the probe refinement and HF diffraction signal acquisition was experimentally validated, as shown in Figure 5 and Figure 6. Figure 5a compares the probe intensity profiles at the EUV mask plane before and after the source upgrade, measured without an illumination aperture using the knife-edge method. In the conventional system, the probe exhibited a Gaussian profile with an FWHM of 15 μ m . Following the source upgrade, which reduced the source etendue, a narrower probe profile with an FWHM of 10 μ m was achieved. However, as the exposure time increased, the FWHM of the probe broadened and the low-intensity probe tail extended beyond the central region of the Gaussian probe. Broadened illumination with an extended tail can introduce reflected light from areas outside the intended probing region, acting as background noise and thereby degrading the SNR of the HF diffraction signals, particularly when longer exposures are used to acquire sufficient HF diffraction signals. As shown in Figure 5b, applying an illumination aperture to the source-upgraded system effectively blocks the stray light outside the incident hole of the aperture, resulting in the formation of a refined probe spatially confined to the central portion of the Gaussian profile. Because of spatial filtering, the refined probe achieved an improved transverse coherence length, facilitating the preservation of coherent interference across a broader detector area. Consequently, the constructive interference between the diffraction signals from the mask is enhanced, improving the SNR in the HF diffraction region [32]. Furthermore, accurate object reconstruction in ptychographic imaging relies on reliable retrieval of the probe, a process that is facilitated by incorporating an experimentally measured non-diffracted beam as a Fourier constraint through the MEP algorithm [18,26]. A non-diffracted beam is typically collected from the multilayer regions of the EUV mask. However, because of the reflectivity differences between the patterned and multilayer regions, precise control of the exposure time is required to reliably acquire a non-diffracted beam representing the probe within the diffraction dataset. As shown in Figure 5b, the refined probe maintains a stable FWHM of 10 μ m and consistent intensity attenuation boundaries (green arrows), regardless of variations in exposure time, ensuring that the probe used for the MEP constraint remains consistent with that used for diffraction pattern acquisition.
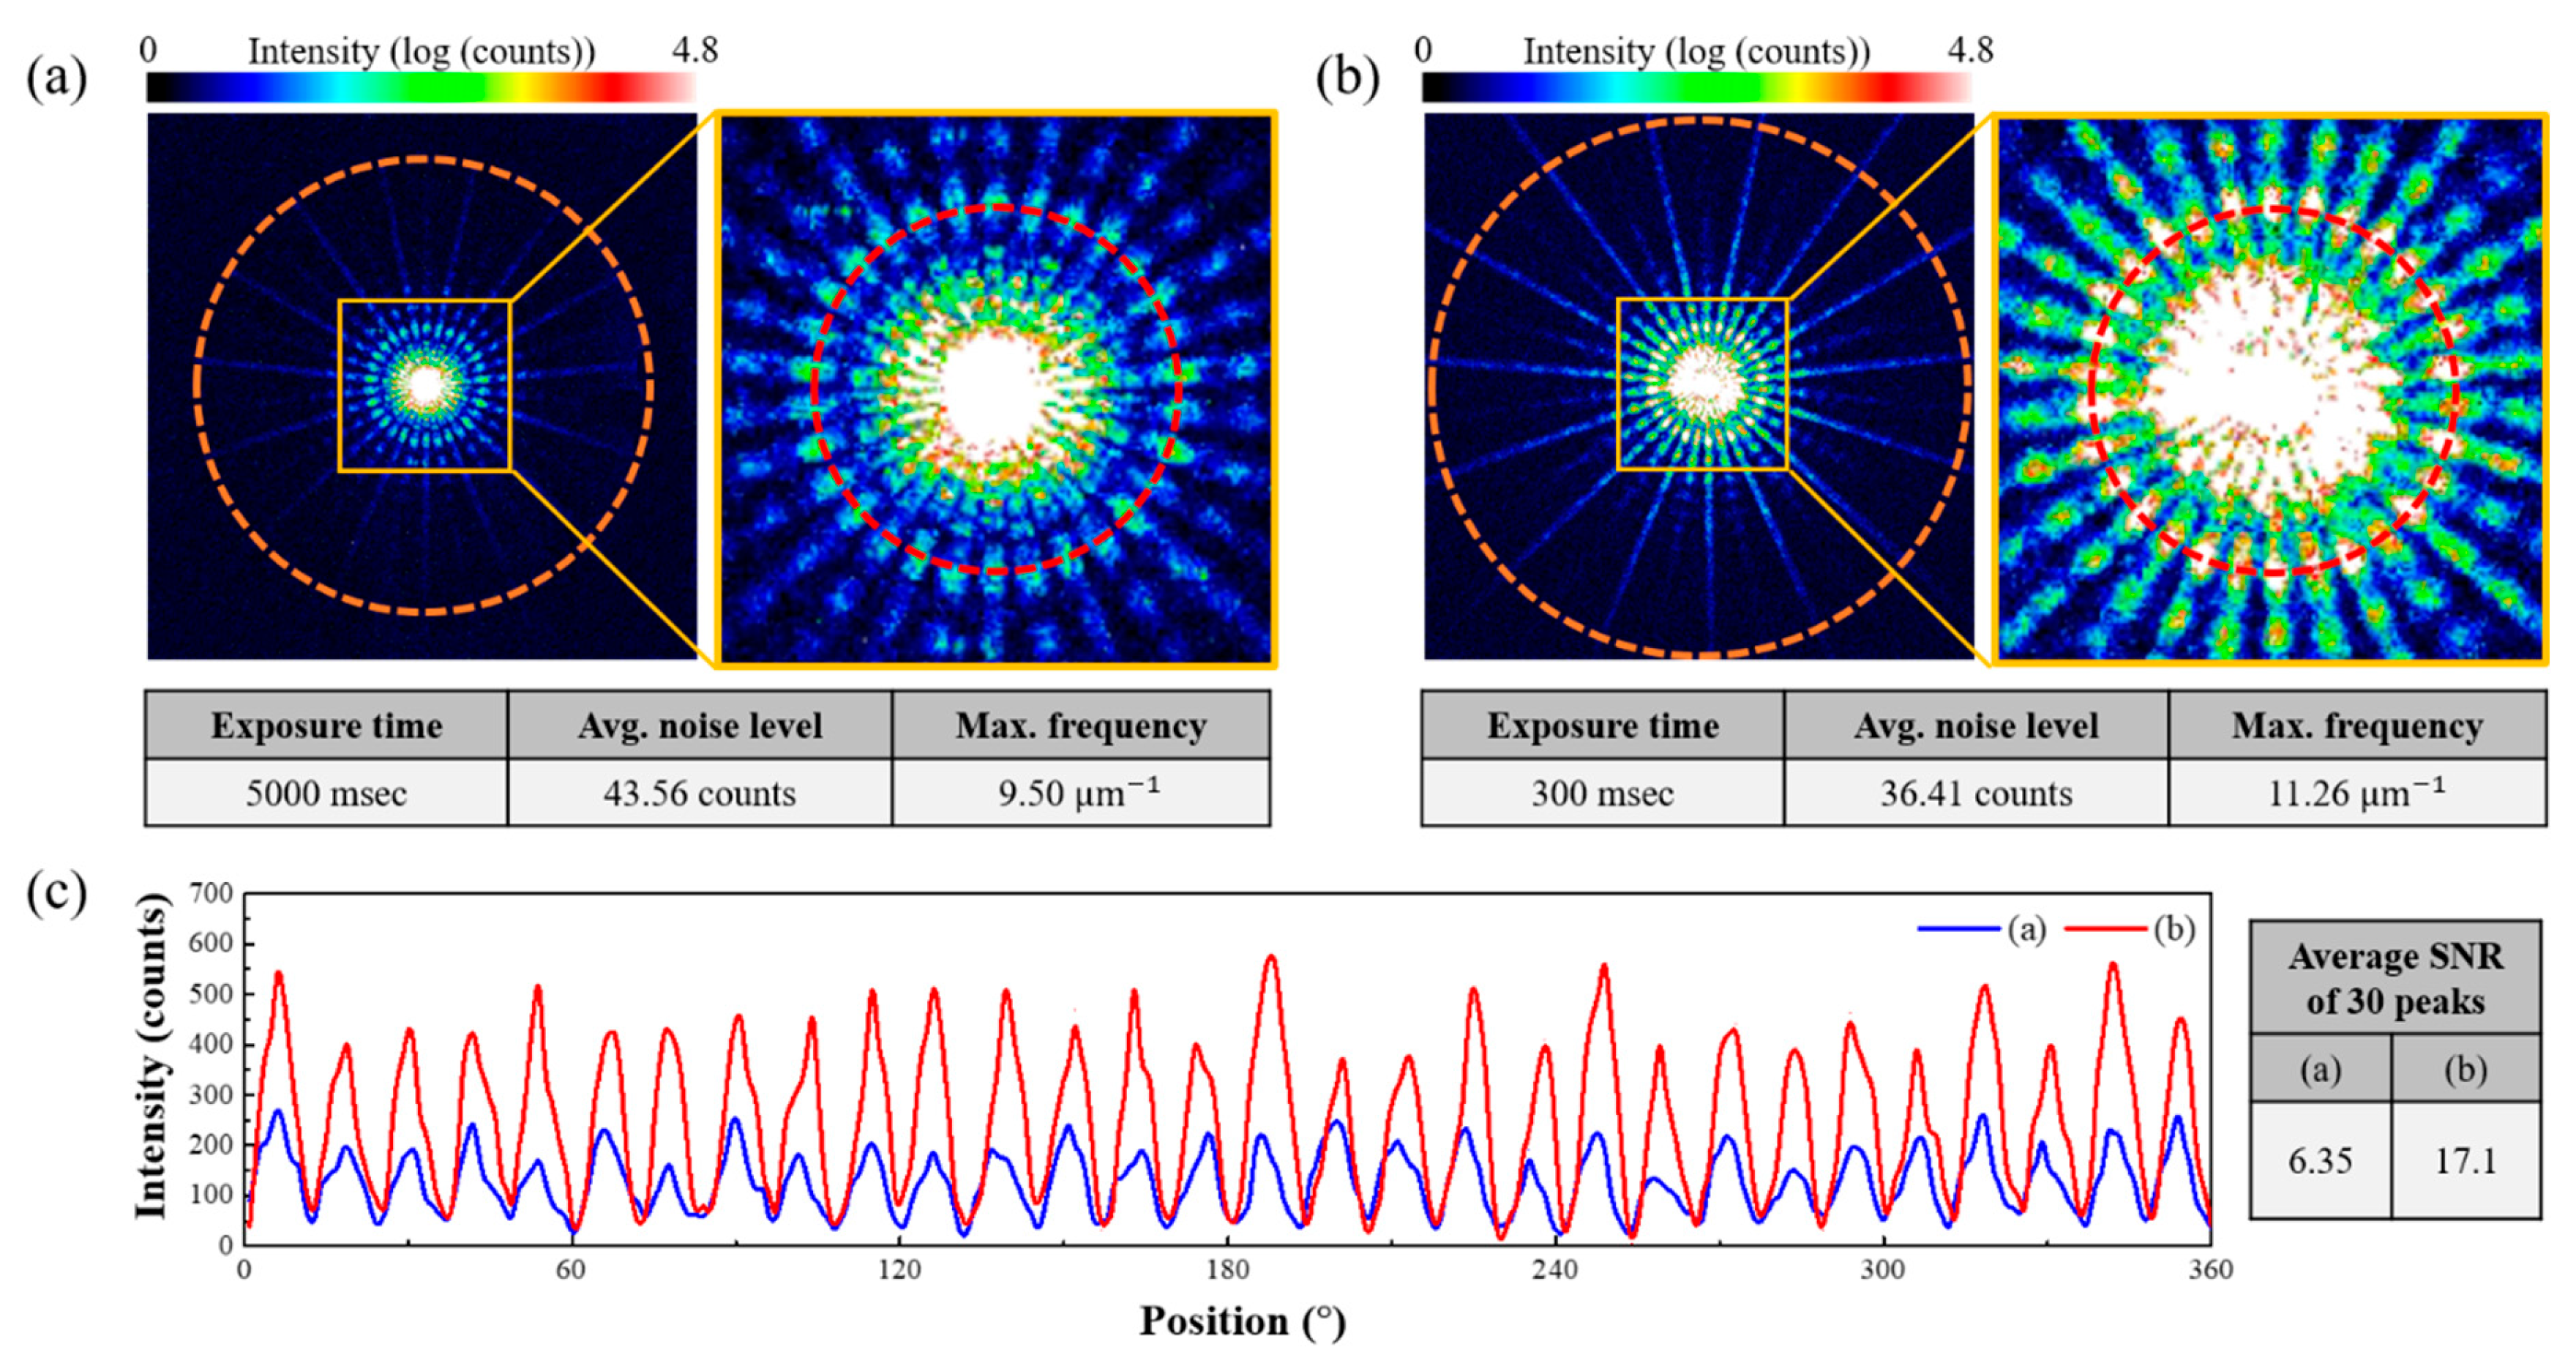
Figure 6 shows the effects of increased photon flux and the refined probe on the diffraction signal acquisition, especially for the HF region. Figure 6a,b shows the diffraction patterns acquired under exposure conditions such that their maximum intensities reach the DR of the CCD detector. To compare the SNR enhancement of the diffraction signals and the extension of the maximum detected spatial frequency, at which the diffraction signal intensity was barely distinguishable from the background noise level, both diffraction patterns were visualized with an identical grayscale range. With the improved photon flux, the exposure time required to reach the DR of the CCD detector was reduced by a factor of approximately 16.7. This reduction mitigated the effects of stage drift and mechanical vibration during exposure, thereby improving positional accuracy. To evaluate the impact of probe refinement on HF diffraction signal enhancement, the intensity profile along the Fourier ring at a spatial frequency of 1.71 μ m 1 , corresponding to the frequency forming pattern edges and fine structural features shown in Figure 3a, was extracted clockwise and plotted in Figure 6c. The average SNR across 30 peaks at this frequency improved by a factor of 2.69. In addition, the maximum detected spatial frequency, as marked by orange dashed circles in Figure 6a,b, was extended by approximately 120%, indicating the acquisition of additional diffraction signals that are essential for reconstructing finer structures. These experimental results are consistent with the simulation shown in Figure 4, which demonstrates an improvement in the diffraction signals through probe refinement. The enhanced SNR in the HF region increases the diffraction diversity between adjacent scan positions, contributing to more robust phase retrieval and improved image resolution. This improvement was further verified by comparing reconstructed images from ptychographic datasets acquired before and after source upgrade and probe refinement using identical imaging parameters, as shown in Figure 7.
The reconstructed images of the Siemens star pattern were cropped to the same region and compared. Given the inherent sensitivity of ptychography to probe positional accuracy, the blurred region observed on the right side of Figure 7b was significantly reduced in Figure 7c because of the shorter exposure time enabled by the increased photon flux and the stable illumination condition enabled by the illumination aperture. Moreover, because of the improved SNR of the HF diffraction signal, a noticeable separation between the multilayer and absorber regions was observed in Figure 7c. To further evaluate resolution enhancement, the central region of the Siemens star pattern, which contains the smallest critical dimensions, was magnified for direct comparison. Although the central region remains unresolved in Figure 7b, it is distinctly reconstructed in Figure 7c, indicating that the improved HF diffraction signal contributes to the reconstruction of the previously unresolvable fine structural features. Furthermore, as shown in Figure 7d, the convergence to a lower Fourier error under identical ptychographic parameters confirms the improvement in the reconstruction accuracy, demonstrating the high fidelity of the reconstructed image. The spatial resolution shown in Figure 7c was evaluated using FRC with the half-bit threshold criterion, as shown in Figure 7e, resulting in a resolution of 46 nm, which corresponds to a pattern CD of 11.5 nm at the wafer plane. The experimentally achieved resolution closely matches the theoretical resolution of the EUV ptychography microscope, calculated to be 44.5 nm.
The upgrade of the EUV source and refinement of the illumination probe enabled improved acquisition of the HF diffraction components, which in turn supported the reconstruction of high-resolution EUV mask images under a 6° illumination angle. These results validate the experimental advancement of EUV ptychography microscopy and demonstrate its potential as a next-generation actinic metrology tool for patterned mask characterization.

4. Conclusions

In this study, we verified significant improvements in the imaging performance of an EUV ptychography microscope, an actinic patterned mask metrology tool, by upgrading the HHG-based EUV source to achieve a smaller etendue, thereby enhancing the photon flux and spatial coherence. In addition, the application of an illumination aperture enabled the formation of a spatially refined probe with a mask illumination angle of 6°.
Both the simulations and experimental results confirmed that the refined probe effectively enhanced the mask diffraction signals, leading to an improved SNR in the HF diffraction region and an extension of the maximum detected spatial frequency. Comparisons of the reconstructed Siemens star pattern images based on the diffraction datasets acquired before and after probe refinement demonstrated that previously unresolved fine CD regions were effectively reconstructed. These results highlight the critical role of improved illumination conditions in extending the resolution limit and enhancing phase-retrieval accuracy in EUV ptychographic imaging. The improved spatial resolution, determined by FRC analysis based on the half-bit threshold criterion, was 46 nm, corresponding to a CD resolution of 11.5 nm at the wafer plane. These findings experimentally validate the advancement of the EUV ptychography microscope as a high-resolution and highly reliable actinic-patterned mask metrology tool.
Future improvements in resolution are anticipated through the application of high dynamic range imaging, merging of multiple diffraction datasets acquired at different exposure times, and introduction of structured illumination techniques to further expand the angular spectrum of mask diffraction, thereby enhancing HF diffraction signal acquisition [16,17,33].

Author Contributions

Conceptualization, S.M. and J.A.; methodology, S.M. and J.H.; software, S.M.; validation, S.M. and J.H.; investigation, S.M. and J.H.; writing—original draft preparation, S.M.; writing—review and editing, J.A. and T.L.; supervision, J.A.; funding acquisition, J.A. All authors have read and agreed to the published version of the manuscript.

Funding

This research was supported by SK HYNIX INC., which specifically funded the implementation of the driving laser used for the EUV source system. Additional support was provided by the National Research Foundation of Korea (NRF), grant funded by the Korean government (Ministry of Science and ICT) (No. RS-2023-00260527).

Data Availability Statement

Data underlying the results presented in this paper are not publicly available at this time but may be obtained from the authors upon reasonable request.

Acknowledgments

We wish to acknowledge the support from Yasin Ekinci and Iacopo Mochi at the Laboratory for X-ray Nanoscience and Technologies (LXN), Paul Scherrer Institute (PSI), Switzerland.

Conflicts of Interest

The authors declare no conflicts of interest.

References

  1. Choi, J.; Melvin, L.S.; Kim, S.-S. EUV mask technologies: Evolution and ecosystem for devices. In Proceedings of the Photomask Technology 2024, Monterey, CA, USA, 29 September–3 October 2024. [Google Scholar]
  2. Yang, S.-H.; Wen, W.L.; Hsiang, J.Y.; Po-Sheng, W. New EUV mask blank for N3 technology node and beyond. In Proceedings of the Photomask Technology 2023, Monterey, CA, USA, 1–6 October 2023. [Google Scholar]
  3. Miyazaki, J.; Yen, A. EUV lithography technology for high-volume production of semiconductor devices. J. Photopolym. Sci. Technol. 2019, 32, 195–201. [Google Scholar] [CrossRef]
  4. Buitrago, E.; Kulmala, T.S.; Fallica, R.; Ekinci, Y. EUV lithography process challenges. Front. Nanosci. 2016, 11, 135–176. [Google Scholar]
  5. Liang, T.; Miyai, H.; Sayan, S.; Mizoguchi, M.; Gondaira, K.; Nishizawa, M.; Suzuki, T.; Todoroki, T.; Li, Y.; Abboud, F. Actinic mask inspection for the era of high-numerical aperture extreme ultraviolet lithography. J. Micro/Nanopatterning Mater. Metrol. 2024, 24, 011006. [Google Scholar] [CrossRef]
  6. Gondaira, K.; Todoroki, T.; Nishizawa, M.; Miyai, H. Actinic patterned mask inspection for high-NA EUV lithography. In Proceedings of the Optical and EUV Nanolithography XXXVII, San Jose, CA, USA, 25 February–1 March 2024; Volume 12953. [Google Scholar]
  7. Helfenstein, P.; Mohacsi, I.; Rajeev, R.; Ekinci, Y. Scanning coherent diffractive imaging methods for actinic extreme ultraviolet mask metrology. J. Micro/Nanolithogr. MEMS MOEMS 2016, 15, 034006. [Google Scholar] [CrossRef]
  8. Li, J.; Li, K.; Zhang, X.; Popmintchev, D.; Xu, H.; Wang, Y.; Li, R.; Zhang, G.; Tang, J.; Niu, J.; et al. Highly efficient and aberration-free off-plane grating spectrometer and monochromator for EUV-soft X-ray applications. Light Sci. Appl. 2024, 13, 12. [Google Scholar] [CrossRef] [PubMed]
  9. Huang, Q.; Medvedev, V.; van de Kruijs, R.; Yakshin, A.; Louis, E.; Bijkerk, F. Spectral tailoring of nanoscale EUV and soft x-ray multilayer optics. Appl. Phys. Rev. 2017, 4, 011104. [Google Scholar] [CrossRef]
  10. Wachulak, P.W.; Bartnik, A.; Kostecki, J.; Wegrzynski, L.; Fok, T.; Jarocki, R.; Szczurek, M.; Fiedorowicz, H. Extreme ultraviolet and soft X-ray imaging with compact, table top laser plasma EUV and SXR sources. Nuclear Instruments and Methods in Physics Research Section B: Beam Interactions with Materials and Atoms. Nucl. Instrum. Methods Phys. Res. Sec. B 2015, 364, 40. [Google Scholar] [CrossRef]
  11. Nakasako, M.; Kobayashi, A.; Takayama, Y.; Asakura, K.; Oide, M.; Okajima, K.; Oroguchi, T.; Yamamoto, M. Methods and application of coherent X-ray diffraction imaging of noncrystalline particles. Biophys. Rev. 2020, 12, 541. [Google Scholar] [CrossRef]
  12. Holler, M.; Guizar-Sicairos, M.; Tsai, E.H.R.; Dinapoli, R.; Müller, E.; Bunk, O.; Raabe, J.; Aeppli, G. High-resolution non-destructive three-dimensional imaging of integrated circuits. Nature 2017, 543, 402. [Google Scholar] [CrossRef]
  13. Khakurel, K.P.; Kimura, T.; Joti, Y.; Matsuyama, S.; Yamauchi, K.; Nishino, Y. Coherent diffraction imaging of non-isolated object with apodized illumination. Opt. Express 2015, 23, 28182. [Google Scholar] [CrossRef]
  14. Robinson, I.; Harder, R. Coherent X-ray diffraction imaging of strain at the nanoscale. Nat. Mater. 2009, 8, 291. [Google Scholar] [CrossRef]
  15. Miao, J. Computational microscopy with coherent diffractive imaging and ptychography. Nature 2025, 637, 281. [Google Scholar] [CrossRef]
  16. Eschen, W.; Liu, C.; Steinert, M.; Penagos, M.D.S.; Siefke, T.; Zeitner, U.D.; Kasper, J.; Pertsch, T.; Limpert, J.; Rothhardt, J. Structured illumination ptychography and at-wavelength characterization with an EUV diffuser at 13.5 nm wavelength. Opt. Express 2024, 32, 3480. [Google Scholar] [CrossRef]
  17. Wang, B.; Brooks, N.J.; Johnsen, P.; Jenkins, N.W.; Esashi, Y.; Binnie, I.; Tanksalvala, M.; Kapteyn, H.C.; Murnane, M.M. High-fidelity ptychographic imaging of highly periodic structures enabled by vortex high harmonic beams. Optica 2023, 10, 1245–1252. [Google Scholar] [CrossRef]
  18. Gardner, D.F.; Tanksalvala, M.; Shanblatt, E.R.; Zhang, X.; Galloway, B.R.; Porter, C.L.; Karl, R., Jr.; Bevis, C.; Adams, D.E.; Kapteyn, H.C.; et al. Subwavelength coherent imaging of periodic samples using a 13.5 nm tabletop high-harmonic light source. Nat. Photonics 2017, 11, 259. [Google Scholar] [CrossRef]
  19. Rodenburg, J.M. Ptychography and related diffractive imaging methods. Adv. Imaging Electron Phys. 2008, 150, 87–184. [Google Scholar]
  20. Liu, Y.; Liu, Q.; Zhao, S.; Sun, W.; Xu, B.; He, Z. Resolution enhancement in coherent diffraction imaging using high dynamic range image. in Photonics. Photonics 2021, 8, 370. [Google Scholar] [CrossRef]
  21. He, K.; Sharma, M.K.; Cossairt, O. High dynamic range coherent imaging using compressed sensing. Opt. Express 2015, 23, 30904. [Google Scholar] [CrossRef]
  22. Kim, Y.W.; Lee, D.G.; Moon, S.; Ku, C.M.; Cho, J.H.; Ahn, J. Actinic patterned mask imaging using extreme ultraviolet ptychography microscope with high harmonic generation source. Appl. Phys. Express 2022, 15, 076505. [Google Scholar] [CrossRef]
  23. Kim, Y.W.; Woo, D.G.; Ahn, J. Performance of extreme ultraviolet coherent scattering microscope. J. Nanosci. Nanotechnol. 2019, 19, 6463. [Google Scholar] [CrossRef]
  24. Lee, D.G.; Moon, S.; Choi, J.; Wi, S.J.; Ahn, J. Extreme ultraviolet pellicle wrinkles influence on mask 3D effects: Experimental demonstration. Appl. Opt. 2023, 62, 6307. [Google Scholar] [CrossRef] [PubMed]
  25. Mochi, I.; Kim, H.-S.; Locans, U.; Dejkameh, A.; Nebling, R.; Kazazis, D.; Ekinici, Y. Illumination control in lensless imaging for EUV mask inspection and review. In Proceedings of the Extreme Ultraviolet (EUV) Lithography XI, San Jose, CA, USA, 23–27 February 2020. [Google Scholar]
  26. Tuitje, F.; Eschen, W.; Tadesse, G.K.; Limpert, J.; Rothhardt, J.; Spielmann, C. Reliability of ptychography on periodic structures. OSA Contin. 2020, 3, 1691–1702. [Google Scholar] [CrossRef]
  27. Bunk, O.; Dierolf, M.; Kynde, S.; Johnson, I.; Marti, O.; Pfeiffer, F. Influence of the overlap parameter on the convergence of the ptychographical iterative engine. Ultramicroscopy 2008, 108, 481. [Google Scholar] [CrossRef] [PubMed]
  28. Loetgering, L.; Du, M.; Flaes, D.B.; Aidukas, T.; Wechsler, F.; Molina, D.S.P.; Rose, M.; Pelekanidis, A.; Eschen, W.; Hess, J.; et al. PtyLab.m/py/jl: A cross-platform, open-source inverse modeling toolbox for conventional and Fourier ptychography. Opt. Express 2023, 31, 13763. [Google Scholar] [CrossRef]
  29. Maiden, A.; Johnson, D.; Li, P. Further improvements to the ptychographical iterative engine. Optica 2017, 4, 736–745. [Google Scholar] [CrossRef]
  30. van Heel, M.; Schatz, M. Fourier shell correlation threshold criteria. J. Struct. Biol. 2005, 151, 250. [Google Scholar] [CrossRef]
  31. Maiden, A.M.; Rodenburg, J.M. An improved ptychographical phase retrieval algorithm for diffractive imaging. Ultramicroscopy 2009, 109, 1256. [Google Scholar] [CrossRef]
  32. Veen, F.v.d.; Pfeiffer, F. Coherent x-ray scattering. Matter 2004, 16, 5003. [Google Scholar]
  33. Kim, H.-S.; Nebling, R.; Dejkameh, A.; Shen, T.; Mochi, I.; Ekinci, Y.; Renwick, S.P. Resolution limit and photon flux dependency in EUV ptychography. In Proceedings of the Photomask Technology 2021, Online, 27 September–8 October 2021. [Google Scholar]
Figure 1. Schematic of the EUV ptychography microscope with an upgraded EUV source. (a) The imaging chamber consists of CDI optical elements, including EUV mirrors, an EUV mask, and a CCD detector. The setup emulates a 6° oblique incidence geometry, consistent with EUV scanner conditions. (b) High-vacuum gas-cell chamber enabling enhanced EUV generation through increased harmonic interaction. (c) Upgraded EUV source system incorporating a high-power femtosecond IR laser to promote high-harmonic generation.
Photonics 12 00831 g001
Figure 2. (a) Schematic of CDI optical system in imaging chamber. A spherical mirror focuses coherent EUV onto the mask, and a flat mirror introduces a 6° mask incident angle. An illumination aperture positioned just above the mask spatially refines the probe. Diffraction patterns from the mask are captured by a CCD detector. (b) Optical microscope image of illumination aperture, comprising a 15 μ m diameter incident hole and exit region. (c) SEM image of a Siemens star pattern on the EUV mask with gold-foil beam block.
Photonics 12 00831 g002
Figure 3. (a) Simulated real-space reconstructions of a Siemens star pattern after applying high-pass filters with progressively increasing cutoff frequencies (ranging from 0.34 to 1.7 μ m 1 ) to the diffraction signal. As low-frequency components are removed, only fine edge features remain visible, highlighting the critical role of HF signals in encoding fine structural information. (b) Reconstructed images obtained using the full diffraction signal (top row), only low-frequency components (middle row), and only high-frequency components (bottom row) across various probe positions.
Photonics 12 00831 g003
Figure 4. Simulated diffraction patterns of a Siemens star pattern obtained at four scan positions with 80% probe overlap under (a) conventional and (b) source-upgraded illumination conditions. For each case, diffraction patterns (top row) are visualized within the NA of the optical system, indicated by white dashed circles. Common (middle row) and difference maps (bottom row) are extracted between two diffraction patterns acquired from adjacent scan positions. The source-upgraded condition shows improved SNR of diffraction signal at overall frequencies, leading to enhanced phase redundancy and diffraction diversity essential for accurate and robust ptychographic reconstruction.
Photonics 12 00831 g004
Figure 5. Probe intensity profiles measured at the EUV mask plane using the knife-edge method, normalized to the intensity at 150 msec exposure after source upgrade. (a) Without illumination aperture, the probe narrows from an FWHM of 15 to 10 μ m after source upgrade but exhibits broadening FWHM and low-intensity tails at longer exposures. (b) With an illumination aperture, the refined probe is spatially confined to the central region, maintaining a stable FWHM and consistent boundaries across varying exposure times.
Photonics 12 00831 g005
Figure 6. Comparison of diffraction signals acquired from the center of a Siemens star pattern (a) before and (b) after source upgrade and illumination aperture implementation. Insets show a magnified view of the central region of the diffraction patterns. (c) Angular intensity profile along the Fourier ring at 1.71 μ m 1 , marked as red dashed lines in the insets. The average SNR across 30 peaks improved from 6.35 to 17.1, confirming enhanced HF diffraction signal acquisition under reduced exposure time following the system upgrade.
Photonics 12 00831 g006
Figure 7. Comparison of reconstructed Siemens star pattern images over an identical field of view. Insets highlight the central region to assess resolution enhancement. (a) SEM image of the Siemens star pattern. Reconstructed images under the condition (b) without and (c) with the EUV source upgrade and application of illumination aperture. The white bars in each of the results indicate 5 μ m . (d) Fourier error metric with respect to ptychographic iterations in the case of (b,c). (e) Fourier ring correlation analysis of (c), showing a half-pitch resolution of 46 nm based on the half-bit threshold criterion. The blue arrow indicates a frequency where FRC curve and half-bit criterion were crossed.
Photonics 12 00831 g007
Disclaimer/Publisher’s Note: The statements, opinions and data contained in all publications are solely those of the individual author(s) and contributor(s) and not of MDPI and/or the editor(s). MDPI and/or the editor(s) disclaim responsibility for any injury to people or property resulting from any ideas, methods, instructions or products referred to in the content.