Article

Fully Phase-Locked Fiber Dual Comb Enables Accurate Frequency and Phase Detection in Multidimensional Coherent Spectroscopy

State Key Laboratory of Precision Spectroscopy, East China Normal University, Shanghai 200062, China
*
Authors to whom correspondence should be addressed.
Photonics 2024, 11(2), 120; https://doi.org/10.3390/photonics11020120
Submission received: 10 January 2024 / Revised: 25 January 2024 / Accepted: 26 January 2024 / Published: 28 January 2024
(This article belongs to the Special Issue Advanced Lasers and Their Applications)

Abstract

:
High-resolution optical multidimensional coherent spectroscopy (MDCS) requires frequency-stable laser sources and high-resolution heterodyne spectra. Fully phase-locked dual-comb spectroscopy (DCS) enables the achievement of high resolution, high accuracy, broad bandwidth, and a rapid multi-heterodyne spectrum, which results in the DCS’s potential to replace the spectrometer and phase detection system in MDCS. We verified the phase measurement capability of the MDCS system based on fully phase-locked fiber DCS by studying phase-sensitive photon echoes and double-quantum processes. The accurate phase and frequency of linear and nonlinear signals were obtained simultaneously using a single detector without subsequent frequency drift correction. Subsequently, the acquisition of longtime quantum beat signals demonstrates the high phase coherence between excitation pulses. Additionally, the two-dimensional coherent spectrum (2DCS) with high signal-to-noise-ratio and 100 MHz resolution was obtained via the MDCS system based on fully phase-locked fiber DCS. These results exhibit that fully phase-locked fiber DCS is an effective method for high-resolution 2DCS measurement, which facilitates further research on cold atoms, higher-order nonlinear spectra, and molecular fingerprint vibrational spectroscopy.

1. Introduction

Optical multidimensional coherent spectroscopy (MDCS) is a nonlinear optical technique, deriving from nuclear magnetic resonance [1,2]. Traditional MDCS usually employs a sequence of ultrafast laser pulses from Ti:sapphire laser to generate four-wave mixing (FWM) signals [3], which has undergone significant development in spectral feature measurements, such as semiconductor materials [4,5,6,7,8,9,10,11], molecular structure, and ultrafast dynamics [12,13,14,15,16,17,18,19]. However, traditional MDCS has long acquisition times and limited spectral resolution due to the integration of bulky spectrometers, complex geometries, phase cycling schemes, and mechanical delay elements [20,21,22,23,24,25,26,27]. These challenges have restricted the application of MDCS mainly to systems with broad resonances or fast dephasing rates. In this case, small frequency fluctuations in laser sources can be ignored in subsequent phase stability and measurement stages [26,27,28,29,30,31]. However, higher spectral resolution is necessary for atomic systems and molecular fingerprint spectroscopy. The prerequisite to achieving high-resolution MDCS is combining phase-stable laser sources with high spectral-resolution spectrometers.
Dual-comb spectroscopy (DCS) has enabled high resolution, high accuracy, broad bandwidth, and rapid spectral measurements, which makes it widely used in the field of the gas absorption spectrum and nonlinear spectrum, such as Raman-induced Kerr-effect spectroscopy [32], coherent anti-stokes Raman spectroscopy [33,34,35], stimulated Raman spectroscopy [36], and transient absorption spectrum [37]. By precisely controlling the repetition frequencies, DCS can achieve automatic delay time scanning, known as asynchronous optical sampling, to investigate various relaxation processes associated with photochemical or photobiological phenomena [36,37,38]. Repetition frequency-stabilized optical frequency combs (OFCs) are sufficient for noncoherent nonlinear processes or broad resonance materials [32,36,38,39], whereas for nonlinear coherent spectroscopy, especially in high-resolution and phase-stable atomic coherent spectra or condensed phases [40], the stability of pulse-to-pulse relative phases is crucial [41]. Recently, Steven Cundiff’s group pioneered an innovative MDCS by merging OFCs, which obtained photon echo and double-quantum two-dimensional coherent spectra (2DCS) of the Rb atom D1 lines (5S1/2 → 5P1/2, 795 nm), and improved spectrum resolution (from GHz to MHz) with a shorter acquisition time [42,43,44,45]. Notably, two repetition frequency-stabilized Ti:sapphire lasers were used to excite the Rb atom, which required a continuous wavelength (CW) laser and an out-of-the-loop phase cancellation scheme to overcome frequency fluctuations between OFCs and the optical path fluctuation [42,43,44,45]. Although the method mentioned above sufficiently compensates for the coherence between two OFCs [46,47], the accuracy of the optical source is limited by the frequency jitter of the laser, which restricts the application in cold atoms, optical lattice, and exciton-induced shift in semiconductor [10,48,49,50]. Fully phase-locked DCS can directly achieve high-frequency accuracy, high coherence, and high phase stability without subsequent frequency drift correction [37,51,52,53,54], which is achieved by referencing an absolute frequency standard such as an optical clock or atomic clock [55,56,57]. In addition, the fully phase-locked DCS was used to research the absorption spectrum or transient absorption process, which directly realized the high phase resolution of a few milliradians [37,41,53]. Despite this, there is still a lack of relevant reports on the combination of the fully phase-locked DCS and MDCS, which is crucial for characterizing complex nonlinear physical phenomena.
In this paper, we achieved accurate frequency and phase measurement in MDCS using the fully phase-locked fiber DCS. We verified the capability of the MDCS system based on fully phase-locked fiber DCS by studying phase-sensitive photon echo and double-quantum processes of the D2 line in rubidium. Above all, we obtained accurate frequency and phase of linear and nonlinear signals simultaneously with one detector by utilizing the fully phase-locked fiber DCS system. Afterward, the acquisition of longtime quantum beat signals without subsequent frequency drift correction demonstrates the high phase coherence between excitation pulses. Furthermore, we obtained a high signal-to-noise ratio (SNR) of 2DCS with a resolution of 100 MHz, allowing us to capture the nonlinear optical response of the sample. The consistent phase of the diagonal peaks in the real-part 2DCS for different polarization excitation pulses further confirms the accurate phase control and measurement capability of our system. Owing to the accurate phase and frequency information detection and the superior band expansion ability of the fully phase-locked fiber DCS, it can provide physical insight into future research on cold-atom 2DCS and molecular fingerprint vibrational spectroscopy.

2. Experimental Setup and Principle

In this section, we demonstrate an MDCS measurement system based on the fully phase-locked fiber DCS. Primarily, we outline the experimental setup in Section 2.1. Subsequently, the principles of photon echo and double-quantum signals are introduced separately in Section 2.2. Moreover, the corresponding data acquisition and coherent average processing of the photon echo and double-quantum signals are adopted to improve the SNR in Section 2.3.

2.1. MDCS System Based on the Fully Phase-Locked Fiber DCS

Figure 1 presents the schematic diagram of the experimental setup. Our optical source is a fully phase-locked fiber DCS (details are in ref. [52]). We employed two Er-doped OFCs, centered at 1560 nm and mode-locked via a nonlinear amplifying loop mirror. The repetition frequency of the master OFC was locked to 100 MHz via a piezoelectric transducer (PZT), while the carrier-envelope offset frequency (fceo) was self-reference-locked to 20 MHz via the combination of pump current and amplitude-modulating electro-optic modulator (AM-EOM). The fceo follows a normal trace ranging from −2.1 to 2.1 mHz with a standard deviation of 265 μHz. The slave OFC was phase-locked to the master comb by a bridge of a 1560 nm CW laser, which was locked to the master comb at 10 MHz. Through the CW laser, the relative frequency beat between the master and slave OFCs was extracted and locked to 20 MHz via the combination of PZT and phase-modulating EOM with a standard deviation of 206 μHz. The fceo of the slave OFC was then locked to 20 MHz via the pump current and AM-EOM. After that, the repetition frequency of the slave OFC was 100 MHz +177.35 Hz. To calibrate the optical frequencies of the two OFCs, all RF reference signals (100, 20, and 10 MHz) were referenced to a standard hydrogen clock. In the MDCS based on DCS, the master comb acted as the signal comb to excite Rb atoms, while the slave comb acted as the local comb to down-convert the signal frequency from the optical domain to the RF domain.
To excite and probe the rubidium vapor, the two OFC pulse trains were delivered into two periodically poled lithium niobite (PPLN), directly outputting two 780.2 nm coherent OFCs with a spectral width of 0.9 nm and an average power of 70 mW. The signal comb beam was split into two parts using a half-wave plate (HWP) and a polarizing beam splitter (PBS). One beam was frequency-shifted by 86 MHz via an acoustic–optic modulator (AOM) while the other beam was delayed via moving the retroreflector-mounted mechanical stage (Newport GTS150). The two beams were then recombined to excite the D2 lines (5S1/2 → 5P3/2) of both 85Rb and 87Rb atoms (which were loaded in a 2 mm cell at 105 °C) using an f = 30 mm spherical lens. To avoid phase distortion caused by the propagation effect while ensuring a high SNR, we set the temperature to 105 °C [45,58]. And in natural rubidium, stable isotope 85Rb is 72%, and slightly radioactive 87Rb is 28% [59]. The FWM signals emitted from the sample, along with the linear absorbed beams, were combined with the slave OFC on the beam splitter (BS). A transmission grating was utilized to filter unabsorbed spectral components with a spectral width of 0.2 nm to be collected using collimators, which helped improve the SNR of the FWM signals. A balanced detector (Thorlabs, PDB410C) was used to detect both the FWM and linear RF signals, which were separated in the RF domain. The resulting dual-comb interferogram was further converted into digital signals using a fast data acquisition card (AlazarTech Inc., AST9462, Pointe-Claire, Canada).
To illustrate the frequency resolution and accuracy of the excitation optical source, we measured the linear absorption spectra of Rb atoms with the fully phase-locked fiber DCS. Figure 2a,d show the comb-tooth-resolved linear absorption spectra and phase spectra obtained via the fully phase-locked fiber DCS with 100 MHz resolution and a 1 s long recording time. The residual phase noise of the phase-locked loop is observed in DCS, exhibiting a noise floor in the fast Fourier transform (FFT) RF spectrum. The linewidth of an individual comb tooth is 1 Hz in the radio frequency domain and 565 kHz in the optical frequency domain, which equals the Fourier transformation limit of a 1 s long recording time, as shown in Figure 2b. Figure 2c illustrates the coherent averaging absorption spectrum. The experimental results are consistent with the frequency of standard transition lines [59].

2.2. The Principle of Photon Echo and Double-Quantum Signal

Based on the experimental conditions, there are two possible phase-matching cases for the FWM signal, corresponding to the photon echo and the two-quantum signal. The phase matching condition −kA + 2kB corresponds to photon echo; pulse A excites once and pulse B excites twice, where kA and kB are the wave vectors of pulses A and B, respectively [42]. Figure 3a shows the pulse sequences that generate the photon echo. The first complex conjugated pulse E A * , shifted by 86 MHz using an AOM, excites the coherence between the ground state and the excited state. The second pulse EB from the delay line converts the coherence to a population of the excited state or the ground state and then continues to convert the population back to coherence between the excited state and ground state. Finally, the photon echo signal is emitted from the last coherent superposition state. The 2DCS was obtained by calculating the two-dimensional Fourier transform (2DFT) concerning the delay time t1 between the two pulses and the emission time t3 [3,42]. These pathways (GSB and SE) were described using the double-sided Feynman diagrams for the atomic density matrix shown in Figure 3b. Based on the photon echo excitation process, we solved the optical Bloch equations for a two-level system in the interaction picture [3]:
ρ · = i H 0 , ρ i H int , ρ γ ρ . H int = μ e g E ( t ) . μ e g = 0 μ μ 0 .
where ρ is the density matrix; H0 is the unperturbed Hamiltonian describing the two-level system with ω resonant frequencies; Hint is the perturbation part arising from the transition dipole μeg and laser electric fields E(t), wherein E(t) represents delta-function pulses, μ is the transition dipole strength of the excited states, which is calculated using Clebsch–Gordan coefficients [59], and γ is the dephasing rate.
To model a real system, inhomogeneous broadening was incorporated into the simulation by integrating a Gaussian function [60,61]. In consideration of the resonance frequency, dephasing times, and relative phase between the OFC pulses acting on samples, the FWM signals can constructively or destructively interfere with each other [62], and then the third-order polarization P(3) =μρ(3)⟩ is as follows [3]:
P ( 3 ) ( t 1 , t 3 ) = i / 3 E A * E B 2 μ e g 4 exp ( i ω 1 t 1 i ω 3 t 3 γ t 1 + t 3 ( t 1 t 3 ) 2 σ 2 / 2 + i n ( 2 φ B , 0 φ A , 0 ) ) .
Here, ω1 and ω3 are the absorption and emission frequencies, respectively; σ is the inhomogeneous linewidth; φA,0 and φB,0 are the carrier-envelope phase slips for pulses A and B, respectively; and n is an integer that varies from 0 to 10. The simulation results of photon echo 2DCS are presented in Section 3.1.
The other phase matching condition −kB + 2kA corresponds to double quantum; pulse A excites twice and pulse B excites once [45]. Double-quantum 2DCS is an effective method to investigate dipole–dipole interactions between atoms, which occurs with a pulse sequence, as illustrated in Figure 3c. The first pulse EA excites the coherence between the ground state and the single-excited state of the rubidium atom vapor and then continues to transform this coherence to double-quantum coherence between the ground state and the double-excited state. The complex-conjugated pulse E B * transforms the double-quantum coherence either back to the coherence between the ground state and the excited state or the coherence between the single excited state and the double-excited state. Finally, a double-quantum signal is emitted and the system returns to either the excited state or the ground state [3,45]. However, the spectral range of the excitation spectrum did not cover 5D3/2 and 5D5/2 excited states in the experiment. Therefore, the double-excited state was formed by the interaction between the two two-level Rb atoms. Figure 3d shows the two-sided Feynman diagram for generating double-quantum FWM signals. In the absence of interaction between the two atoms, the signals for Feynman diagrams I and II exhibit equal strength but opposite signs. Moreover, when dipole–dipole interactions occur between two atoms, the energy of the single-excited state and double-excited state will slightly shift, which can break the energy symmetry to produce a double-quantum signal. Slight energy level shifts δ1 and δ2 were considered in our simulations. Considering the correlation between the double-quantum frequency ω2Q and emission frequency ω3 within inhomogeneous broadening [63], as well as the effect of phase accumulation, the final double-quantum signal can be expressed as:
P t 2 Q , t 3 = ( i / ) 3 E A 2 E B * μ e g 4 { exp [ i ω 2 Q t 2 Q + i ω 3 t 3 γ t 3 + 2 t 2 Q 2 t 2 Q 2 1 + κ 2 t 2 Q t 3 1 + κ + t 3 2 σ 2 / 2 + i n ( 2 φ A , 0 φ B , 0 ) ] } .
where t2Q is the delay between pulse A and pulse B for double quantum, and κ is the correlation coefficient. The simulation results of double-quantum 2DCS are presented in Section 3.2.

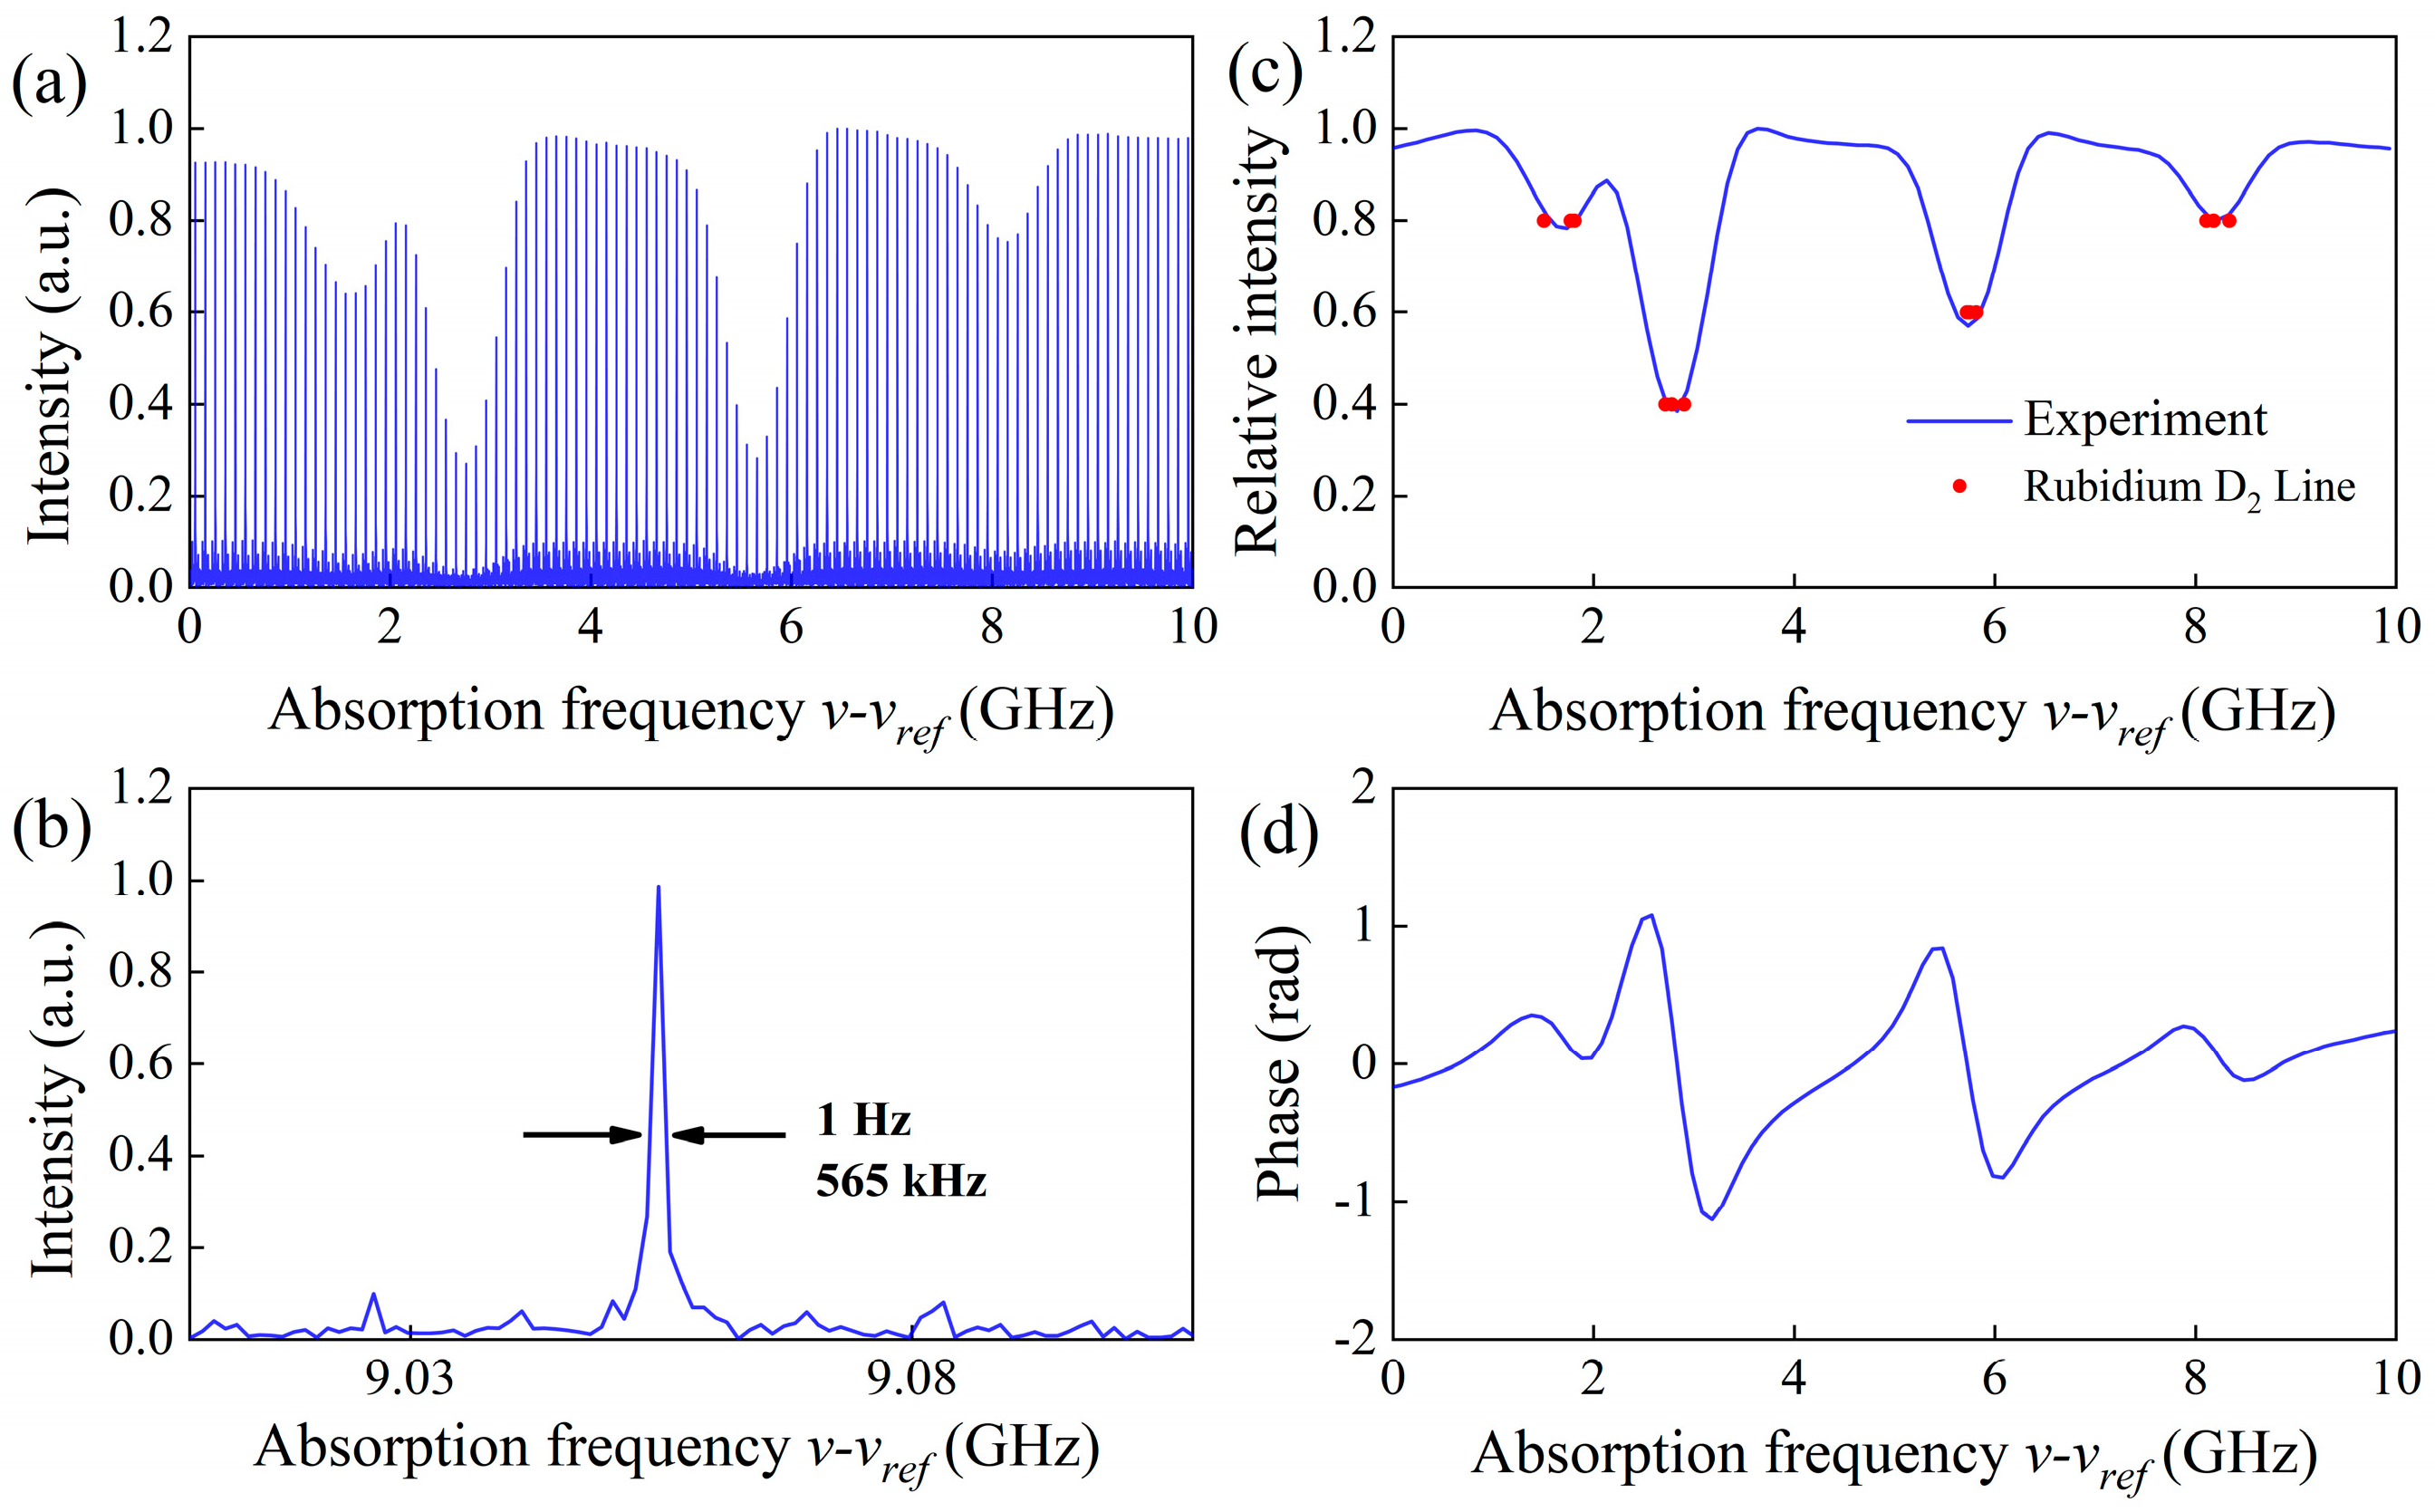
2.3. The Data Acquisition of Photon Echo and Double-Quantum Spectrum

By combining the fully phase-locked fiber DCS with MDCS, we measure linear and nonlinear signals simultaneously with one balance detector, as shown in Figure 4a. According to the phase match, we can obtain the photon echo and the two-quantum signal. The initial pulse B corresponds to fB = fS − fLO at 40 MHz in the RF domain, and pulse A after the AOM shift corresponds to fA = fS + fAOM − fLO at 46 MHz in the RF domain, where fS and fLO are the frequencies of signal comb and local comb, and fAOM is the AOM drive frequency. According to the relationship between wave vector and frequency k = 2π/λ = 2πf/c, the frequency of photon echo in the RF domain is fecho =fA + 2fB by the phase matching condition −kA + 2kB, which is located at 26 MHz. As shown in Figure 4b, the photon echo signal was measured at a delay of 300 ps using comb-tooth-resolved DCS without correction. The power of the co-linear polarization excitation pulses A and B are 6 mW and 8 mW, respectively. In the experimental scheme, the total phase fluctuations were mainly derived from the space optical path fluctuations between pulses A and B. We extracted the optical path fluctuations from the linear DCS signals and then this information was used to compensate for the phase fluctuations of echo [64,65]. After that, the SNR of the photon echo signal was improved to 435 by coherently averaging 177 times in the frequency domain, corresponding to a 1 s recording time, as shown in Figure 4b. Similar to the photon echo, the double-quantum signal was located at 32 MHz in DCS with phase matching condition 2kAkB. The powers of the co-linear polarization excitation pulses A and B were 15 mW and 3 mW, respectively. The comb-teeth-resolved double-quantum signal was measured by our DCS system without correction, as shown in Figure 4c. After 177 times coherently averages in the frequency domain, the SNR of the double-quantum spectra was improved to 208.

3. Results and Discussion

In this section, we investigate the dynamic characteristics and 2DCS of single quantum and double quantum signals at D2 hyperfine lines for two rubidium isotopes (85Rb and 87Rb) in the experiment [59]. The coherently averaged FWM signals with collinearly (HHHH) and cross-linearly (HVVH: H horizontal polarization; V, vertical polarizations) polarized excitation pulses were measured at various time delays. Subsequently, we obtained and analyzed the 2DCS by applying FFT to the time-resolved dynamic process. Detailed results of photon echo and double quantum are given in Section 3.1 and Section 3.2, respectively.

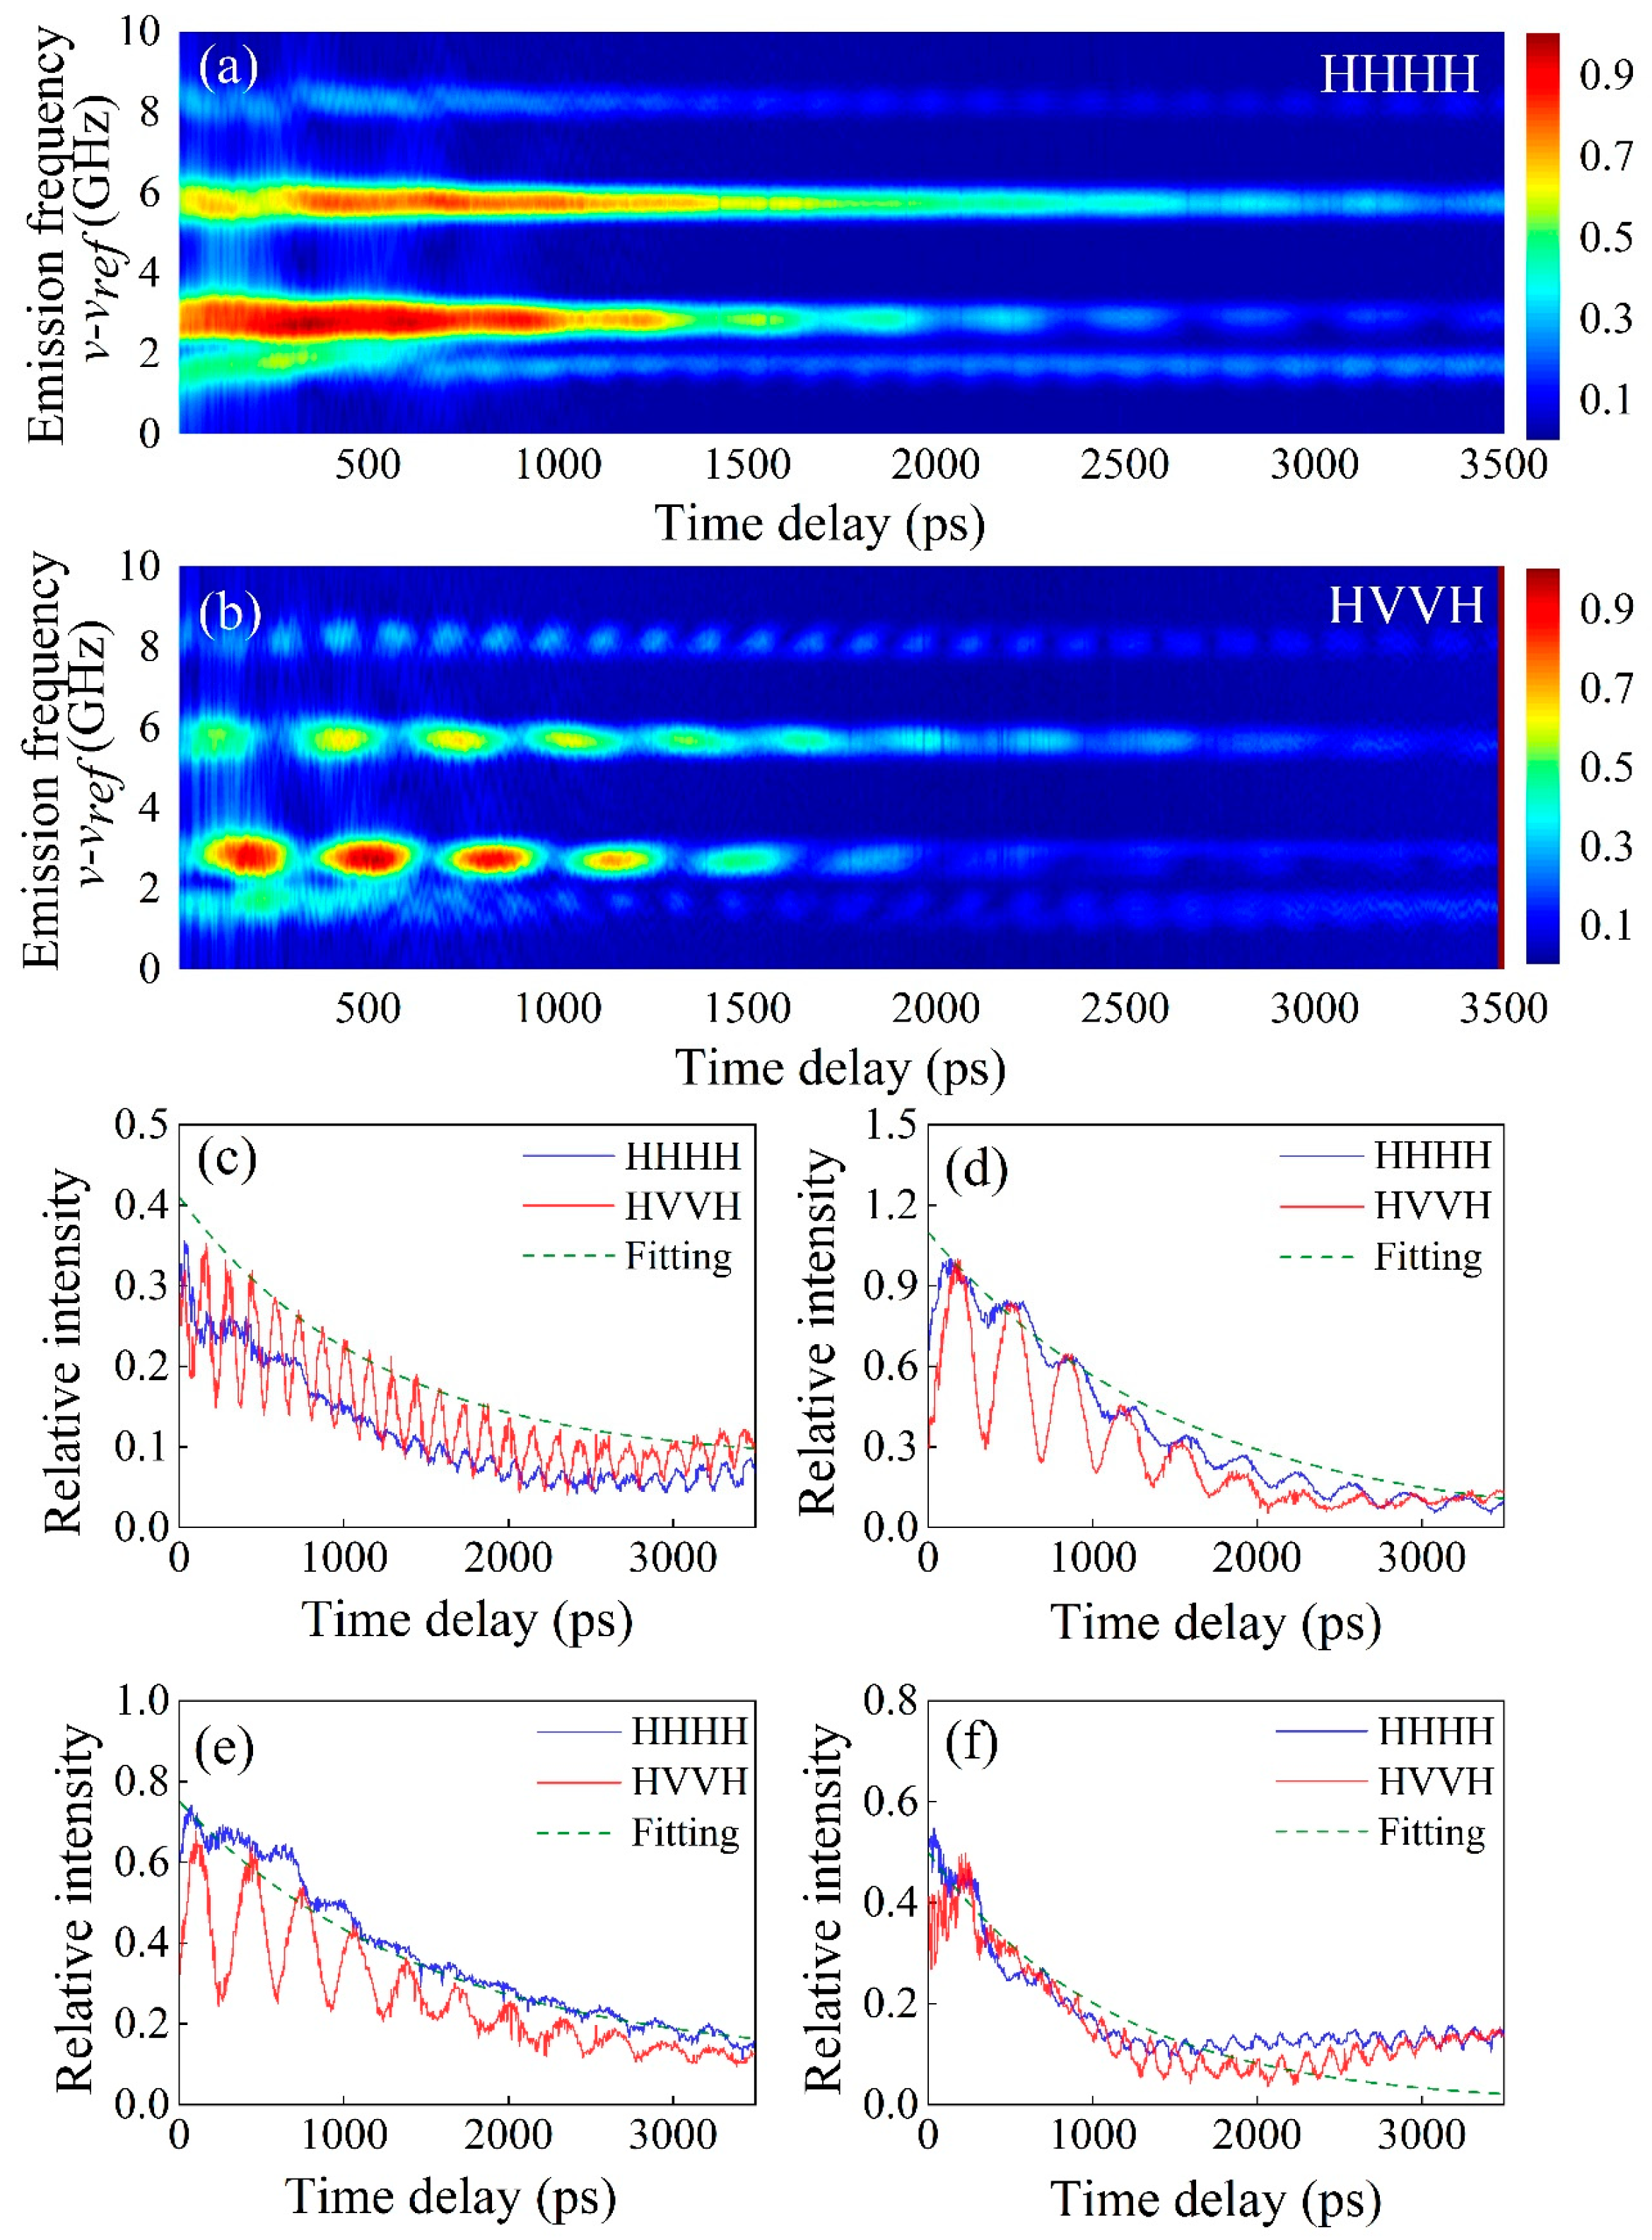
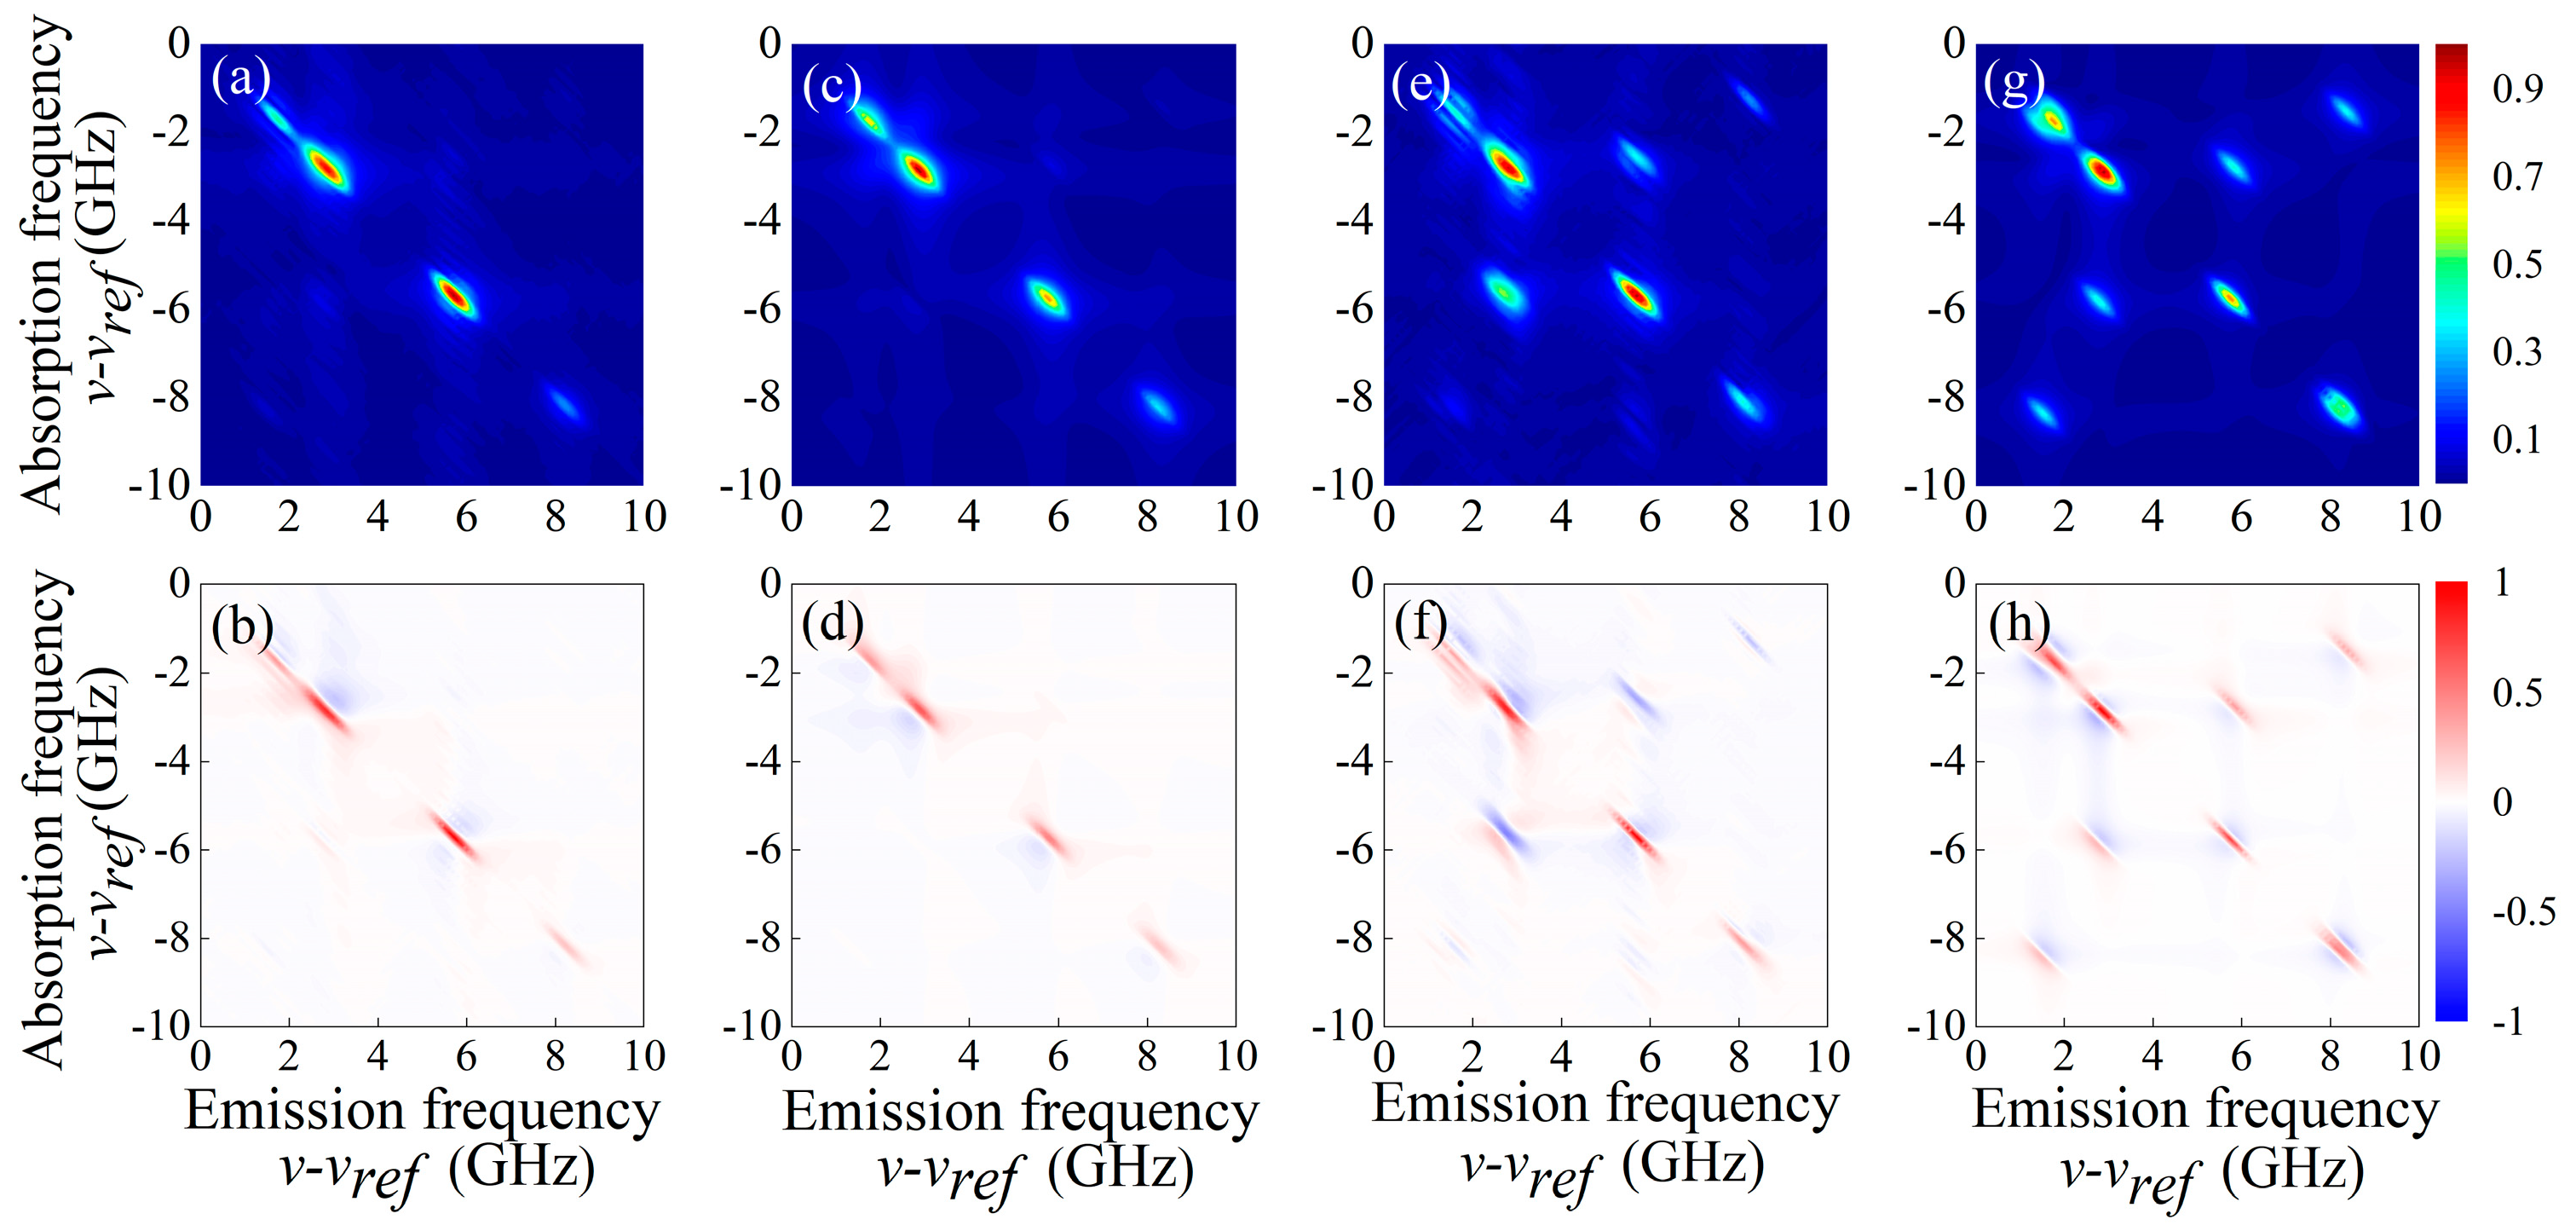
3.1. Photon Echo 2DCS

Figure 5 shows the results of the photon echo signal using HHHH and HVVH excitation pulses measured by DCS. Figure 5a,b illustrate the experimental time-resolved photon echo dynamic processes, in which the delay between two excitation pulses was tuned from 0 to 3.5 ns with 5.3 ps steps to generate the absorption frequency axis for 2DCS. For the isotope 85Rb, the emission frequencies are recorded as 2.98 GHz and 5.92 GHz. For the isotope 87Rb, the emission frequencies are recorded as 1.87 GHz and 8.24 GHz. The echo signal decays with time delay, owing to dephasing, and weak quantum beats are observed in HHHH, but intense quantum beats are observed in HVVH excitation pulses. These quantum beats arise from the excitation of the quantum mechanical coherent superposition of several discrete levels via the common ground state or excited state [66,67]. Depending on the atomic transition selection rule, the coherent superposition of several discrete levels is more obvious for the HVVH case, which will be explained in the next paragraph. To determine the beat frequency, we fitted the experimental data using a damped sine function [68]. The beat frequencies are approximately 6.85 GHz in relation to the splitting between F = 1 and F = 2 for 87Rb at emission frequencies of 1.87 GHz and 8.24 GHz. The beat frequencies are approximately 3.05 GHz in relation to the splitting between F = 2 and F = 3 for 85Rb at emission frequencies of 2.98 GHz and 5.92 GHz. In addition, we focused on the dynamic evolution of the four major peaks with different polarization states. Figure 5c,f show the beating dynamics of 87Rb. With exponential decay fitting [68], the coherence dephasing times for 87Rb at emission frequencies of 1.87 GHz and 8.24 GHz are 1.1 ns and 1.2 ns, respectively. The beat amplitudes are affected by both the polarization state and the transition energy level. Notably, Figure 5d,e show the beating dynamics of 85Rb, where the beat amplitudes show a great discrepancy between HHHH and HVVH polarization excitation. The coherence dephasing times for 85Rb at emission frequencies of 2.98 GHz and 5.92 GHz is 1.5 ns. In the beating dynamics, the amplitude of the four major peaks has non-zero bases, which shows the effects of correlation between the energetic splitting of the levels [66]. The measurement of quantum beats requires phase coherence between pulses, which is significant for dynamic processes in molecules and energy transfer in photosynthesis.
By applying FFT to the time-resolved photon echo process, the experimental and simulated 2DCS are depicted in Figure 6. Figure 6a,c show the experimental and simulated 2DCS for the HHHH case, respectively. Compared with linear absorption spectra, 2DCS provides a wealth of information with two frequency axes. The negative values on the absorption frequency axis reflect the negative phase evolution corresponding to a complex conjugated pulse E A * . It is observed that the diagonal peak signal indicates that the absorption and emission frequencies are equal, while the elongation of certain peaks along the diagonal is derived from inhomogeneous broadening in Rb atom vapor. Based on the diagonal slice, the inhomogeneous width of the Rb atom vapor is approximately 600 MHz. The transverse resolution of 2DCS is 100 MHz, mainly limited by the repetitions of OFCs, and the longitudinal resolution depending on the length of the mechanical stage is 285 MHz. In the HHHH case, all signals have the same sign, which leads to the addition of neighboring peaks [42,59]. The intensity of the diagonal peak is so strong that the off-diagonal peak is not obvious in the HHHH polarization state. However, adjusting the polarization state can cause some diagonal peaks to be suppressed in the HVVH-polarized 2DCS compared with the HHHH-polarized 2DCS. Figure 6b,d show the experimental and simulated real-part 2DCS, respectively. The real part of the spectrum exhibits an “absorptive” line shape which agrees well with the simulated results. Figure 6e,g show the results of the experimental and simulated 2DCS for the HVVH case, respectively. By comparing the simulation with the experiment, it is observed that the echo signals for the F to F’ = F transitions exhibit an opposite sign relative to the F to F’ = F ± 1 transition in the HVVH-polarized 2DCS. This sign flip results in the partial cancellation of adjacent diagonal peaks [42], which causes the peak strength to drop to 0.25 of that observed in the HHHH-polarized case. The off-diagonal peaks correspond to the coupling between two excited states via the same ground state, or two ground states via the same excited state. In addition, the off-diagonal peak strengths are stronger and more asymmetric for HVVH, which is consistent with the enhanced beats in the HVVH-polarized time-resolved dynamic process in Figure 5b [7]. As shown in Figure 6f,h, the real-part 2DCS presents absorptive line shapes for diagonal peaks, but dispersive line shapes for off-diagonal peaks. All diagonal peaks in echo 2DCS are caused by the sampling mechanism and have the same phase, which verifies the phase measurement capability of the DCS system [69].

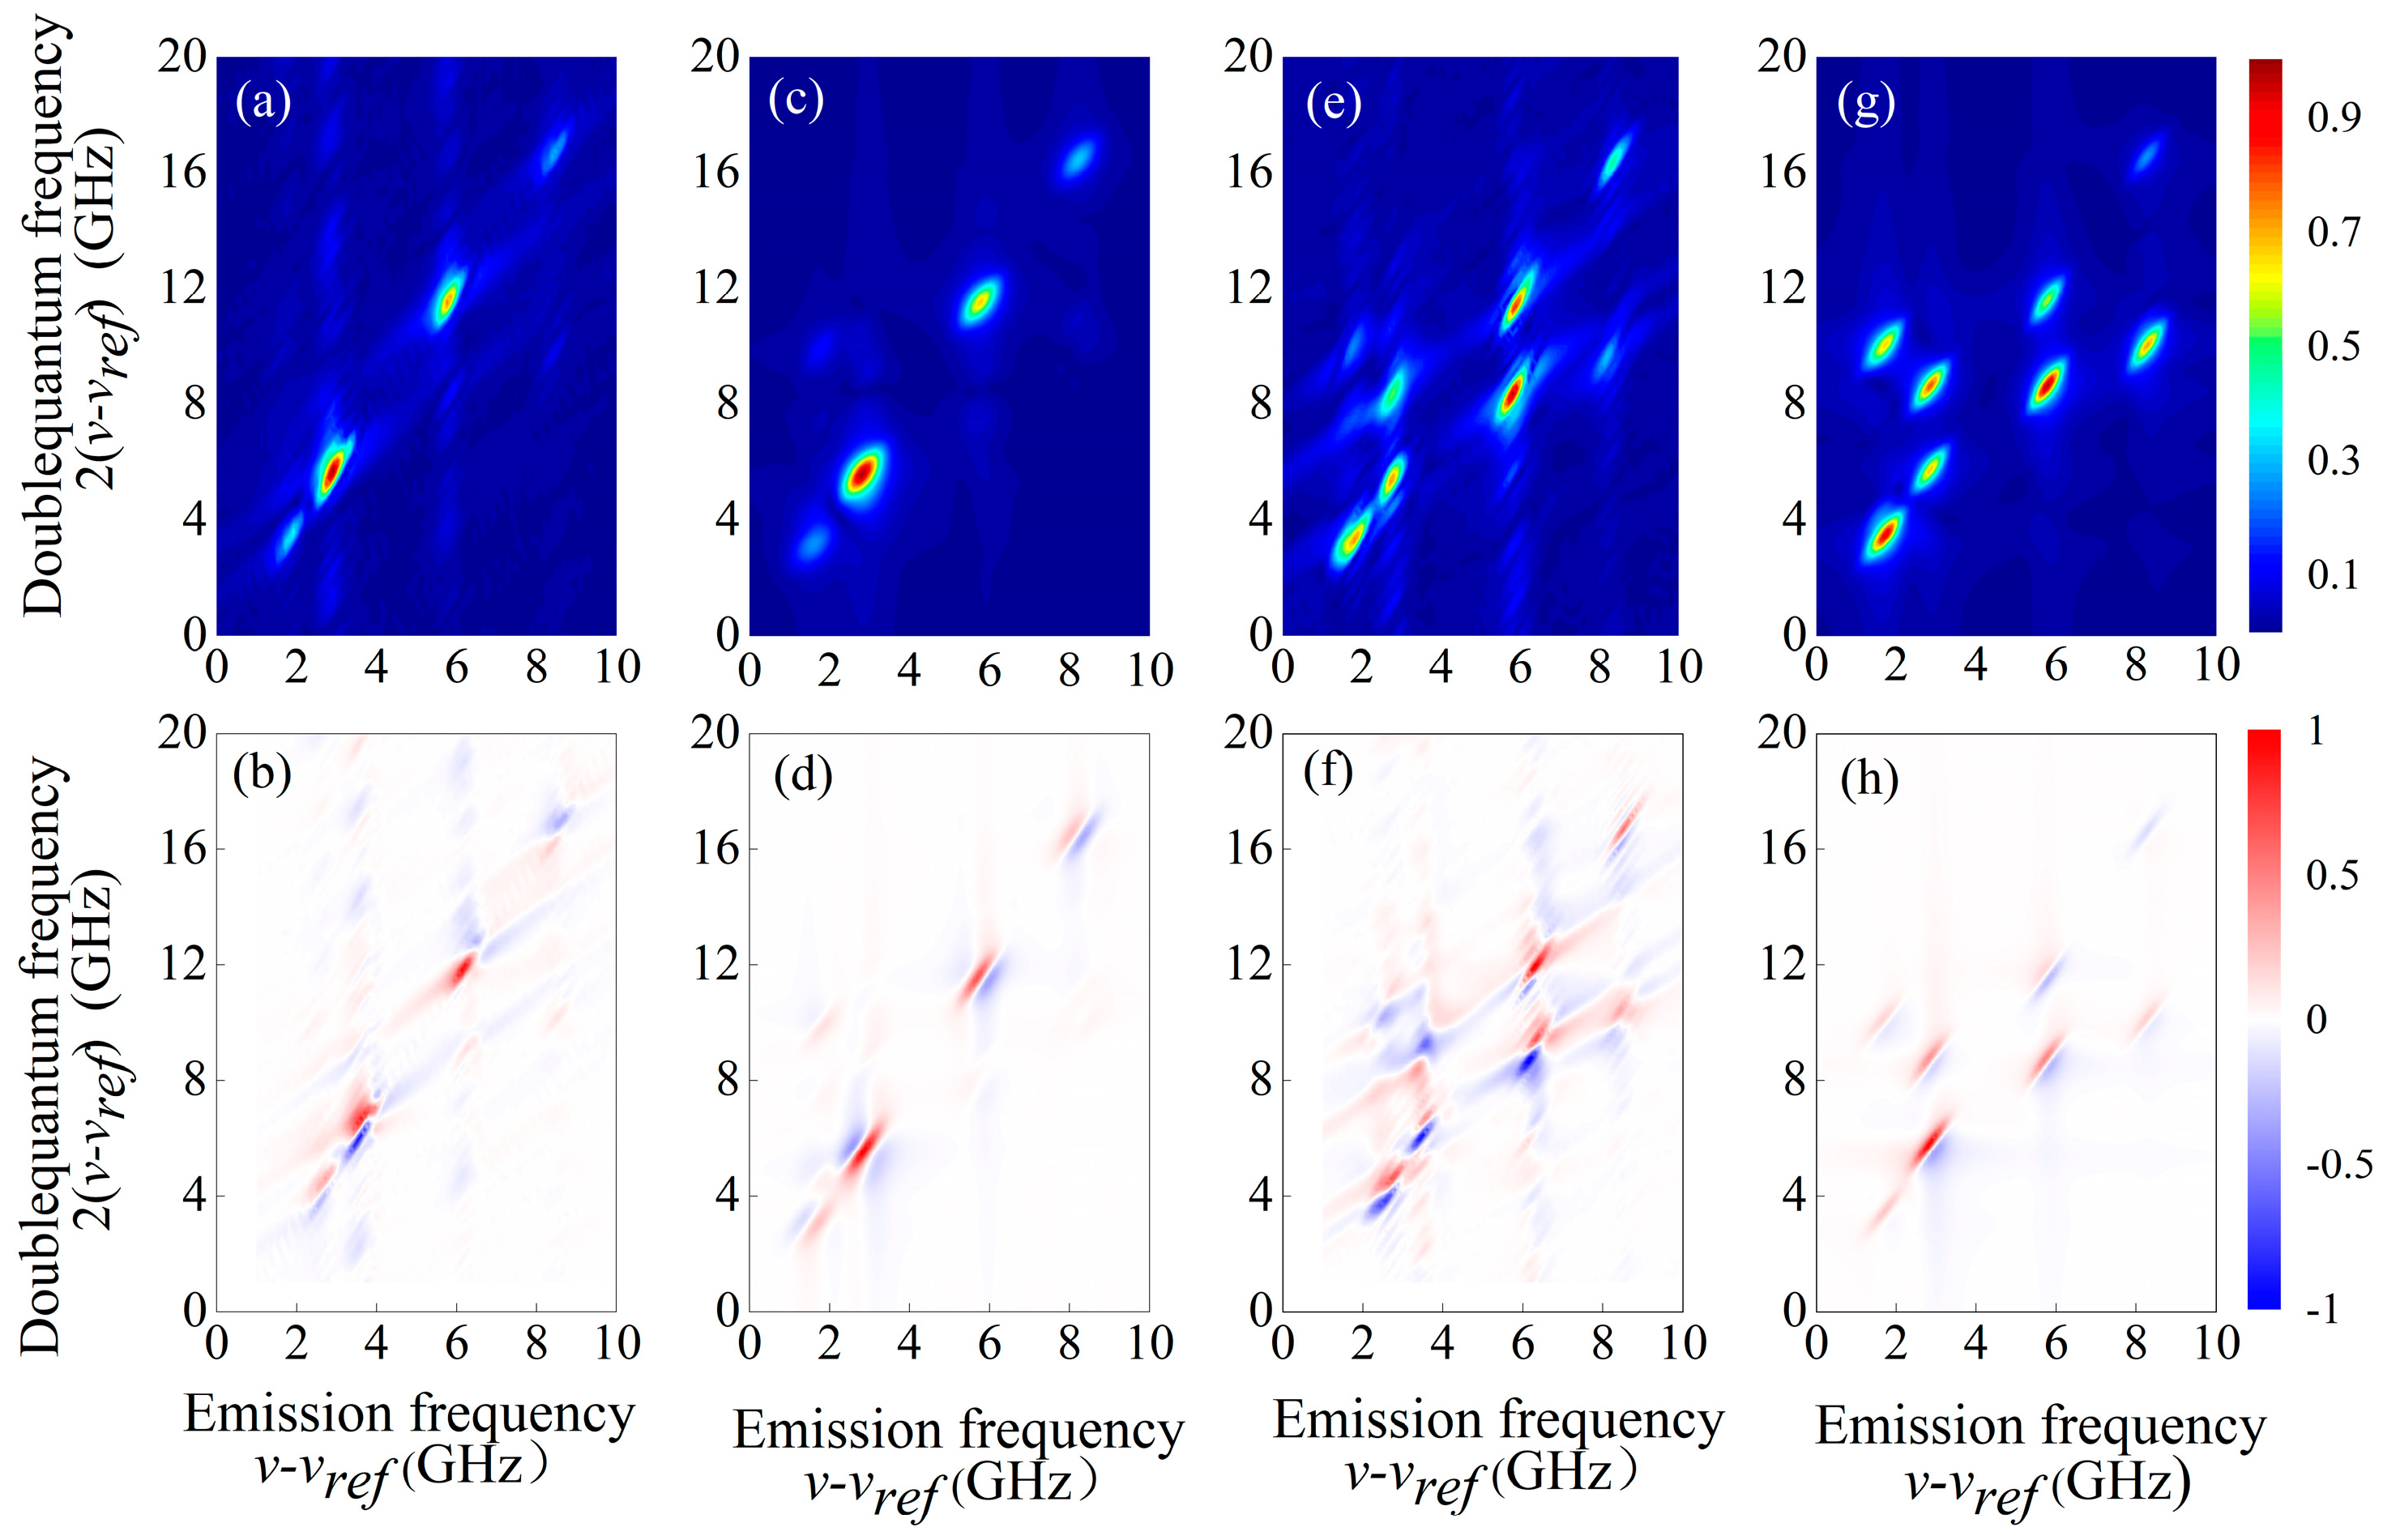
3.2. Double-Quantum 2DCS

Based on the phase matching condition 2kAkB, we obtained the time-resolved double quantum dynamic process using HHHH and HVVH excitation pulses as shown in Figure 7a,b. The delay between two excitation pulses is varied from 0 to 1.2 ns with 5.3 ps steps to generate the double-quantum frequency axis for a 2DCS. Compared with photon echo, the double-quantum signal decays rapidly. Moreover, sideband splitting is observed (around 3.4 GHz and 6.3 GHz) near the main peak, which is attributed to dipole–dipole interactions. After damped sine fitting, the measured beat frequencies are approximately 6.80 GHz in relation to the transition frequency difference of the two coupled 87Rb atoms at emission frequencies of 1.87 GHz and 8.24 GHz. The beat frequencies are about 3.05 GHz in relation to the transition frequency difference of the two coupled 85Rb atoms at emission frequencies 2.98 GHz and 5.92 GHz. Finally, we focus on the double-quantum dynamic evolution of the four major peaks with different polarization states. Figure 7c,f show the beating dynamics of 87Rb; with exponential decay fitting, the coherence dephasing times are 0.6 ns and 0.65 ns at emission frequencies of 1.87 GHz and 8.24 GHz, respectively. Figure 7e,d show the beating dynamics of 85Rb, and the coherence dephasing times are 0.7 ns and 0.65 ns at emission frequencies of 2.98 GHz and 5.92 GHz, respectively. Compared with photon echo, the dephasing rate of the double-quantum signal is doubled and the coherence dephasing time of the double-quantum signal is halved [70].
By applying FFT to the time-resolved double-quantum signal, we obtained the experimental and simulated 2DCS as shown in Figure 8. Figure 8a,c show the experimental and simulated 2DCS for the HHHH case, respectively. The diagonal peaks correspond to the coupling between the same hyperfine energy level of the homonuclear atoms. The diagonal tilting and elongation of some peaks suggest a correlation between the emission and double-quantum frequencies. This correlation provides insight into what velocity group of atoms participates in the generation of the FWM signal [45]. In our simulation, a correlated two-dimensional Gaussian function was used to include inhomogeneous broadening for two coupled two-level systems [63]. We set the correlation parameter κ to 0.7, which means that the FWM signal is generated by the coupled atoms with near-zero relative velocities [45,66]. Our simulated results agree with the experimental results in this regard. Figure 8e,g show the experimental and simulated 2DCS results for the HVVH case, respectively. The off-diagonal peaks show coupling between different hyperfine energy levels of the homonuclear atoms. For instance, in Figure 8e, the peaks at (1.7, 3.5) GHz and (8.4, 16.8) GHz correspond to the coupling of two 87Rb atoms that have the same hyperfine resonance frequencies, whereas the peaks around (1.8, 10.1) GHz and (8.2, 9.9) GHz correspond to the coupling of two 87Rb atoms with different hyperfine resonance frequencies. The coupling between heteronuclear atoms at (1.7, 7.32) GHz is so weak compared with the homonuclear atoms. A similar analysis can be performed to identify all the peaks in the double-quantum 2DCS. The off-diagonal peak strengths are stronger and more asymmetric in the HVVH case, which is consistent with the enhanced beats observed in the HVVH-polarized time-resolved dynamic process shown in Figure 7b. Figure 8b,f show the experimental real-part 2DCS results for HHHH and HVVH cases; all diagonal peaks in double-quantum spectra are caused by the sampling mechanism and have dispersive line shapes, which once again verifies the phase accuracy of the MDCS based on fully phase-locked fiber DCS [69]. Furthermore, the slight discrepancy between the experimental and simulated results is due to the simulation not considering weak propagation effects [58,71] and its assumption of the same dephasing rates and energy shifts for complex hyperfine energy level transitions, which may not accurately reflect the real experimental system.

4. Conclusions

In summary, our study verified the phase measurement capability of the MDCS system based on the fully phase-locked fiber DCS through the investigation of phase-sensitive photon echo and double-quantum processes. We successfully achieved accurate phase and frequency measurements of both linear and nonlinear signals using a single detector without subsequent frequency drift correction. The high-precision phase-locked system of the dual-comb enabled us to acquire a high SNR amplitude and real part of the 2DCS. The consistent phase of the diagonal peaks in the real-part 2DCS for different polarization excitation pulses further confirms the accurate phase measurement capability of our system. Furthermore, the measurement of longtime quantum beat signals demonstrates the high coherence between excitation pulses, which is crucial for quantum coherent energy transfer related to photosynthesis. Based on the advantages of fully phase-locked fiber DCS, our MDCS system can be applied to higher-order nonlinear spectra involving multiple excitation pulses, cold-atom 2DCS, and molecular fingerprint vibrational spectroscopy.

Author Contributions

Conceptualization, S.X.; methodology, S.X. and Z.D.; validation, S.X., Z.D., J.P. and Z.Z. (Zhong Zuo); formal analysis, Z.Z. (Zilin Zhao) and G.X.; investigation, S.X.; resources, W.L.; data curation, S.X.; writing—original draft preparation, S.X.; writing—review and editing, S.X. and Z.D.; visualization, J.P.; supervision, W.L.; project administration, W.L.; funding acquisition, W.L. All authors have read and agreed to the published version of the manuscript.

Funding

This work was supported by the National Natural Science Foundation of China (12134004, 12104162, 12204178, 12274141).

Institutional Review Board Statement

Not applicable.

Informed Consent Statement

Not applicable.

Data Availability Statement

Data are contained within the article.

Conflicts of Interest

The authors declare no conflicts of interest.

References

  1. Ernst, R.R.; Bodenhausen, G.; Wokaun, A. Principles of Nuclear Magnetic Resonance in One and Two Dimensions; International Series of Monographs on Chemistry; Oxford University Press: Oxford, UK; New York, NY, USA, 1990; ISBN 978-0-19-855647-3. [Google Scholar]
  2. Wei, Z.; Yang, J.; Chen, Y.; Chen, L.; Cao, S.; Cai, S.; Lin, Y.; Chen, Z. Ultrafast Multidimensional Nuclear Magnetic Resonance Technique: A Proof of Concept Based on Inverse-k-Space for Convenient and Efficient Performance. Appl. Phys. Lett. 2016, 108, 084102. [Google Scholar] [CrossRef]
  3. Hamm, P.; Zanni, M. Concepts and Methods of 2D Infrared Spectroscopy; Cambridge University Press: Cambridge, UK, 2011; ISBN 978-1-107-00005-6. [Google Scholar]
  4. Chemla, D.S.; Shah, J. Many-Body and Correlation Effects in Semiconductors. Nature 2001, 411, 549–557. [Google Scholar] [CrossRef] [PubMed]
  5. Cundiff, S.T.; Zhang, T.; Bristow, A.D.; Karaiskaj, D.; Dai, X. Optical Two-Dimensional Fourier Transform Spectroscopy of Semiconductor Quantum Wells. Acc. Chem. Res. 2009, 42, 1423–1432. [Google Scholar] [CrossRef] [PubMed]
  6. Moody, G.; Cundiff, S.T. Advances in Multi-Dimensional Coherent Spectroscopy of Semiconductor Nanostructures. Adv. Phys. X 2017, 2, 641–674. [Google Scholar] [CrossRef] [PubMed]
  7. Bristow, A.D.; Karaiskaj, D.; Dai, X.; Mirin, R.P.; Cundiff, S.T. Polarization Dependence of Semiconductor Exciton and Biexciton Contributions to Phase-Resolved Optical Two-Dimensional Fourier-Transform Spectra. Phys. Rev. B 2009, 79, 161305. [Google Scholar] [CrossRef]
  8. Li, X.; Zhang, T.; Borca, C.N.; Cundiff, S.T. Many-Body Interactions in Semiconductors Probed by Optical Two-Dimensional Fourier Transform Spectroscopy. Phys. Rev. Lett. 2006, 96, 057406. [Google Scholar] [CrossRef] [PubMed]
  9. Li, D.; Trovatello, C.; Dal Conte, S.; Nuß, M.; Soavi, G.; Wang, G.; Ferrari, A.C.; Cerullo, G.; Brixner, T. Exciton–Phonon Coupling Strength in Single-Layer MoSe2 at Room Temperature. Nat. Commun. 2021, 12, 954. [Google Scholar] [CrossRef]
  10. Shacklette, J.M.; Cundiff, S.T. Role of Excitation-Induced Shift in the Coherent Optical Response of Semiconductors. Phys. Rev. B 2002, 66, 045309. [Google Scholar] [CrossRef]
  11. Wang, H.; Ferrio, K.; Steel, D.G.; Hu, Y.Z.; Binder, R.; Koch, S.W. Transient Nonlinear Optical Response from Excitation Induced Dephasing in GaAs. Phys. Rev. Lett. 1993, 71, 1261–1264. [Google Scholar] [CrossRef]
  12. Zheng, J.; Kwak, K.; Asbury, J.; Chen, X.; Piletic, I.R.; Fayer, M.D. Ultrafast Dynamics of Solute-Solvent Complexation Observed at Thermal Equilibrium in Real Time. Science 2005, 309, 1338–1343. [Google Scholar] [CrossRef]
  13. Ghosh, A.; Hochstrasser, R.M. A Peptide’s Perspective of Water Dynamics. Chem. Phys. 2011, 390, 1–13. [Google Scholar] [CrossRef] [PubMed]
  14. Zhang, Y.; Luo, Y.; Zhang, Y.; Yu, Y.-J.; Kuang, Y.-M.; Zhang, L.; Meng, Q.-S.; Luo, Y.; Yang, J.-L.; Dong, Z.-C.; et al. Visualizing Coherent Intermolecular Dipole–Dipole Coupling in Real Space. Nature 2016, 531, 623–627. [Google Scholar] [CrossRef] [PubMed]
  15. Abramavicius, D.; Palmieri, B.; Voronine, D.V.; Šanda, F.; Mukamel, S. Coherent Multidimensional Optical Spectroscopy of Excitons in Molecular Aggregates; Quasiparticle versus Supermolecule Perspectives. Chem. Rev. 2009, 109, 2350–2408. [Google Scholar] [CrossRef] [PubMed]
  16. Cannizzo, A. Ultrafast UV Spectroscopy: From a Local to a Global View of Dynamical Processes in Macromolecules. Phys. Chem. Chem. Phys. 2012, 14, 11205–11223. [Google Scholar] [CrossRef] [PubMed]
  17. Russo, M.; McGhee, K.E.; Virgili, T.; Lidzey, D.G.; Cerullo, G.; Maiuri, M. Dephasing Processes in the Molecular Dye Lumogen-F Orange Characterized by Two-Dimensional Electronic Spectroscopy. Molecules 2022, 27, 7095. [Google Scholar] [CrossRef]
  18. Policht, V.R.; Russo, M.; Liu, F.; Trovatello, C.; Maiuri, M.; Bai, Y.; Zhu, X.; Dal Conte, S.; Cerullo, G. Dissecting Interlayer Hole and Electron Transfer in Transition Metal Dichalcogenide Heterostructures via Two-Dimensional Electronic Spectroscopy. Nano Lett. 2021, 21, 4738–4743. [Google Scholar] [CrossRef] [PubMed]
  19. Zhu, R.; Zou, J.; Wang, Z.; Chen, H.; Weng, Y. Electronic State-Resolved Multimode-Coupled Vibrational Wavepackets in Oxazine 720 by Two-Dimensional Electronic Spectroscopy. J. Phys. Chem. A 2020, 124, 9333–9342. [Google Scholar] [CrossRef]
  20. Nardin, G.; Autry, T.M.; Silverman, K.L.; Cundiff, S.T. Multidimensional Coherent Photocurrent Spectroscopy of a Semiconductor Nanostructure. Opt. Express 2013, 21, 28617–28627. [Google Scholar] [CrossRef]
  21. Tekavec, P.F.; Lott, G.A.; Marcus, A.H. Fluorescence-Detected Two-Dimensional Electronic Coherence Spectroscopy by Acousto-Optic Phase Modulation. J. Chem. Phys. 2007, 127, 214307. [Google Scholar] [CrossRef]
  22. Bristow, A.D.; Karaiskaj, D.; Dai, X.; Zhang, T.; Carlsson, C.; Hagen, K.R.; Jimenez, R.; Cundiff, S.T. A Versatile Ultrastable Platform for Optical Multidimensional Fourier-Transform Spectroscopy. Rev. Sci. Instrum. 2009, 80, 073108. [Google Scholar] [CrossRef]
  23. Munoz, M.F.; Medina, A.; Autry, T.M.; Moody, G.; Siemens, M.E.; Bristow, A.D.; Cundiff, S.T.; Li, H. Fast Phase Cycling in Non-Collinear Optical Two-Dimensional Coherent Spectroscopy. Opt. Lett. 2020, 45, 5852–5855. [Google Scholar] [CrossRef]
  24. Wagner, W.; Li, C.; Semmlow, J.; Warren, W.S. Rapid Phase-Cycled Two-Dimensional Optical Spectroscopy in Fluorescence and Transmission Mode. Opt. Express 2005, 13, 3697–3706. [Google Scholar] [CrossRef] [PubMed]
  25. Tiwari, V. Multidimensional Electronic Spectroscopy in High-Definition—Combining Spectral, Temporal, and Spatial Resolutions. J. Chem. Phys. 2021, 154, 230901. [Google Scholar] [CrossRef] [PubMed]
  26. Zhang, T.; Kuznetsova, I.; Meier, T.; Li, X.; Mirin, R.P.; Thomas, P.; Cundiff, S.T. Polarization-Dependent Optical 2D Fourier Transform Spectroscopy of Semiconductors. Proc. Natl. Acad. Sci. USA 2007, 104, 14227–14232. [Google Scholar] [CrossRef] [PubMed]
  27. Bristow, A.D.; Karaiskaj, D.; Dai, X.; Cundiff, S.T. All-Optical Retrieval of the Global Phase for Two-Dimensional Fourier-Transform Spectroscopy. Opt. Express 2008, 16, 18017–18027. [Google Scholar] [CrossRef] [PubMed]
  28. Jonas, D.M. Two-Dimensional Femtosecond Spectroscopy. Annu. Rev. Phys. Chem. 2003, 54, 425–463. [Google Scholar] [CrossRef] [PubMed]
  29. Keusters, D.; Tan, H.-S. Warren Role of Pulse Phase and Direction in Two-Dimensional Optical Spectroscopy. J. Phys. Chem. A 1999, 103, 10369–10380. [Google Scholar] [CrossRef]
  30. Zhu, Z.; Yang, S.; He, C.; Lin, X. Cavity-Birefringence-Dependent Vector Pure-Quartic Soliton Fiber Laser. Opt. Express 2023, 31, 35529–35541. [Google Scholar] [CrossRef]
  31. Zhu, Z.; Yang, S.; He, C.; Lin, X. Vector Pure-Quartic Soliton Molecule Fiber Laser. Chaos Solitons Fractals 2023, 175, 113978. [Google Scholar] [CrossRef]
  32. Ideguchi, T.; Bernhardt, B.; Guelachvili, G.; Hänsch, T.W.; Picqué, N. Raman-Induced Kerr-Effect Dual-Comb Spectroscopy. Opt. Lett. 2012, 37, 4498–4500. [Google Scholar] [CrossRef]
  33. Ideguchi, T.; Holzner, S.; Bernhardt, B.; Guelachvili, G.; Picqué, N.; Hänsch, T.W. Coherent Raman Spectro-Imaging with Laser Frequency Combs. Nature 2013, 502, 355–358. [Google Scholar] [CrossRef] [PubMed]
  34. Coluccelli, N.; Howle, C.R.; McEwan, K.; Wang, Y.; Fernandez, T.T.; Gambetta, A.; Laporta, P.; Galzerano, G. Fiber-Format Dual-Comb Coherent Raman Spectrometer. Opt. Lett. 2017, 42, 4683–4686. [Google Scholar] [CrossRef] [PubMed]
  35. Chen, K.; Wu, T.; Chen, T.; Wei, H.; Yang, H.; Zhou, T.; Li, Y. Spectral Focusing Dual-Comb Coherent Anti-Stokes Raman Spectroscopic Imaging. Opt. Lett. 2017, 42, 3634–3637. [Google Scholar] [CrossRef] [PubMed]
  36. Kim, J.; Yoon, T.H.; Cho, M. Time-Resolved Impulsive Stimulated Raman Spectroscopy with Synchronized Triple Mode-Locked Lasers. J. Phys. Chem. Lett. 2020, 11, 2864–2869. [Google Scholar] [CrossRef] [PubMed]
  37. Asahara, A.; Minoshima, K. Development of Ultrafast Time-Resolved Dual-Comb Spectroscopy. APL Photon. 2017, 2, 041301. [Google Scholar] [CrossRef]
  38. Cho, M. Coherent Nonlinear Spectroscopy with Multiple Mode-Locked Lasers. J. Phys. Chem. Lett. 2021, 12, 10284–10294. [Google Scholar] [CrossRef] [PubMed]
  39. Kim, J.; Cho, B.; Yoon, T.H.; Cho, M. Dual-Frequency Comb Transient Absorption: Broad Dynamic Range Measurement of Femtosecond to Nanosecond Relaxation Processes. J. Phys. Chem. Lett. 2018, 9, 1866–1871. [Google Scholar] [CrossRef]
  40. Kim, J.; Yoon, T.H.; Cho, M. Interferometric Measurement of Transient Absorption and Refraction Spectra with Dual Frequency Comb. J. Phys. Chem. B 2018, 122, 9775–9785. [Google Scholar] [CrossRef]
  41. Kim, J.; Jeon, J.; Yoon, T.H.; Cho, M. Dual Frequency-Comb Spectroscopy of Chromophores in Condensed Phases. Chem. Phys. 2019, 520, 122–137. [Google Scholar] [CrossRef]
  42. Lomsadze, B.; Cundiff, S.T. Frequency Combs Enable Rapid and High-Resolution Multidimensional Coherent Spectroscopy. Science 2017, 357, 1389–1391. [Google Scholar] [CrossRef]
  43. Lomsadze, B.; Smith, B.C.; Cundiff, S.T. Tri-Comb Spectroscopy. Nat. Photon. 2018, 12, 676–680. [Google Scholar] [CrossRef]
  44. Lomsadze, B.; Cundiff, S.T. Frequency Comb-Based Four-Wave-Mixing Spectroscopy. Opt. Lett. 2017, 42, 2346–2349. [Google Scholar] [CrossRef] [PubMed]
  45. Lomsadze, B.; Cundiff, S.T. Frequency-Comb Based Double-Quantum Two-Dimensional Spectrum Identifies Collective Hyperfine Resonances in Atomic Vapor Induced by Dipole-Dipole Interactions. Phys. Rev. Lett. 2018, 120, 233401. [Google Scholar] [CrossRef] [PubMed]
  46. Ideguchi, T.; Poisson, A.; Guelachvili, G.; Picqué, N.; Hänsch, T.W. Adaptive Real-Time Dual-Comb Spectroscopy. Nat. Commun. 2014, 5, 3375. [Google Scholar] [CrossRef] [PubMed]
  47. Ideguchi, T.; Poisson, A.; Guelachvili, G.; Hänsch, T.W.; Picqué, N. Adaptive Dual-Comb Spectroscopy in the Green Region. Opt. Lett. 2012, 37, 4847–4849. [Google Scholar] [CrossRef] [PubMed]
  48. Liu, X.; Ivanov, E.; Kitching, J.; Donley, E.A. Frequency Shift Mitigation in a Cold-Atom CPT Clock. In Proceedings of the 2016 IEEE International Frequency Control Symposium (IFCS), New Orleans, LA, USA, 9–12 May 2016; pp. 1–3. [Google Scholar]
  49. Eckner, W.J.; Darkwah Oppong, N.; Cao, A.; Young, A.W.; Milner, W.R.; Robinson, J.M.; Ye, J.; Kaufman, A.M. Realizing Spin Squeezing with Rydberg Interactions in an Optical Clock. Nature 2023, 621, 734–739. [Google Scholar] [CrossRef] [PubMed]
  50. Aeppli, A.; Chu, A.; Bothwell, T.; Kennedy, C.J.; Kedar, D.; He, P.; Rey, A.M.; Ye, J. Hamiltonian Engineering of Spin-Orbit–Coupled Fermions in a Wannier-Stark Optical Lattice Clock. Sci. Adv. 2022, 8, eadc9242. [Google Scholar] [CrossRef] [PubMed]
  51. Chen, Z.; Yan, M.; Hänsch, T.W.; Picqué, N. A Phase-Stable Dual-Comb Interferometer. Nat. Commun. 2018, 9, 3035. [Google Scholar] [CrossRef]
  52. Deng, Z.; Liu, Y.; Zhu, Z.; Luo, D.; Gu, C.; Zhou, L.; Xie, G.; Li, W. Ultra-Precise Optical Phase-Locking Approach for Ultralow Noise Frequency Comb Generation. Opt. Laser Technol. 2021, 138, 106906. [Google Scholar] [CrossRef]
  53. Asahara, A.; Nishiyama, A.; Yoshida, S.; Kondo, K.; Nakajima, Y.; Minoshima, K. Dual-Comb Spectroscopy for Rapid Characterization of Complex Optical Properties of Solids. Opt. Lett. 2016, 41, 4971–4974. [Google Scholar] [CrossRef]
  54. Benko, C.; Ruehl, A.; Martin, M.J.; Eikema, K.S.E.; Fermann, M.E.; Hartl, I.; Ye, J. Full Phase Stabilization of a Yb:Fiber Femtosecond Frequency Comb via High-Bandwidth Transducers. Opt. Lett. 2012, 37, 2196–2198. [Google Scholar] [CrossRef] [PubMed]
  55. Ascarrunz, F.G.; Dudin, Y.O.; Delgado Aramburo, M.C.; Ascarrunz, L.I.; Savory, J.; Banducci, A.; Jefferts, S.R. A Portable Cold 87Rb Atomic Clock with Frequency Instability at One Day in the 10−15 Range. In Proceedings of the 2018 IEEE International Frequency Control Symposium (IFCS), Olympic Valley, CA, USA, 21–24 May 2018; pp. 1–3. [Google Scholar]
  56. Chabbra, N.; Wade, A.R.; Rose Rees, E.; Sutton, A.J.; Stochino, A.; Ward, R.L.; Shaddock, D.A.; McKenzie, K. High Stability Laser Locking to an Optical Cavity Using Tilt Locking. Opt. Lett. 2021, 46, 3199–3202. [Google Scholar] [CrossRef] [PubMed]
  57. Kim, K.; Aeppli, A.; Bothwell, T.; Ye, J. Evaluation of Lattice Light Shift at Low 10−19 Uncertainty for a Shallow Lattice Sr Optical Clock. Phys. Rev. Lett. 2023, 130, 113203. [Google Scholar] [CrossRef] [PubMed]
  58. Li, H.; Spencer, A.P.; Kortyna, A.; Moody, G.; Jonas, D.M.; Cundiff, S.T. Pulse Propagation Effects in Optical 2D Fourier-Transform Spectroscopy: Experiment. J. Phys. Chem. A 2013, 117, 6279–6287. [Google Scholar] [CrossRef] [PubMed]
  59. DA Steck Rubidium 85 and 87 D Line Data (2008). Available online: http://steck.us/alkalidata (accessed on 30 April 2008).
  60. Tokmakoff, A. Two-Dimensional Line Shapes Derived from Coherent Third-Order Nonlinear Spectroscopy. J. Phys. Chem. A 2000, 104, 4247–4255. [Google Scholar] [CrossRef]
  61. Siemens, M.E.; Moody, G.; Li, H.; Bristow, A.D.; Cundiff, S.T. Resonance Lineshapes in Two-Dimensional Fourier Transform Spectroscopy. In Frontiers in Optics 2010/Laser Science XXVI; Optica Publishing Group: Washington, DC, USA, 2010; p. LThA3. [Google Scholar]
  62. Lomsadze, B.; Weight, S.C.; Hovland, P.K.D. Effects of Phase Accumulation in Frequency-Comb-Based Multidimensional Coherent Spectroscopy. Phys. Rev. A 2022, 106, 033704. [Google Scholar] [CrossRef]
  63. Lomsadze, B.; Cundiff, S.T. Line-Shape Analysis of Double-Quantum Multidimensional Coherent Spectra. Phys. Rev. A 2020, 102, 043514. [Google Scholar] [CrossRef]
  64. Zuo, Z.; Gu, C.; Wang, S.; Xiong, S.; Deng, Z.; Di, Y.; Luo, D.; Wu, J.; Li, W. Phase-Stable Multidimensional Coherent Spectroscopy Based on Dual-Comb Interferometry. Adv. Optical Mater. 2024, 2303130. [Google Scholar] [CrossRef]
  65. Coddington, I.; Swann, W.C.; Nenadovic, L.; Newbury, N.R. Rapid and Precise Absolute Distance Measurements at Long Range. Nat. Photon. 2009, 3, 351–356. [Google Scholar] [CrossRef]
  66. Cundiff, S.T. Effects of Correlation between Inhomogeneously Broadened Transitions on Quantum Beats in Transient Four-Wave Mixing. Phys. Rev. A 1994, 49, 3114–3118. [Google Scholar] [CrossRef]
  67. Li, H.; Lomsadze, B.; Moody, G.; Smallwood, C.; Cundiff, S. Optical Multidimensional Coherent Spectroscopy; Oxford University Press: Oxford, UK, 2023; ISBN 978-0-19-284386-9. [Google Scholar]
  68. Yi, Z.; Begzjav, T.K.; Ariunbold, G.O.; Zheltikov, A.M.; Sokolov, A.V.; Scully, M.O. Multiple Pathway Quantum Beat Spectroscopy. Front. Phys. 2022, 10, 921499. [Google Scholar] [CrossRef]
  69. Dai, X.; Richter, M.; Li, H.; Bristow, A.D.; Falvo, C.; Mukamel, S.; Cundiff, S.T. Two-Dimensional Double-Quantum Spectra Reveal Collective Resonances in an Atomic Vapor. Phys. Rev. Lett. 2012, 108, 193201. [Google Scholar] [CrossRef]
  70. Bott, K.; Heller, O.; Bennhardt, D.; Cundiff, S.T.; Thomas, P.; Mayer, E.J.; Smith, G.O.; Eccleston, R.; Kuhl, J.; Ploog, K. Influence of Exciton-Exciton Interactions on the Coherent Optical Response in GaAs Quantum Wells. Phys. Rev. B 1993, 48, 17418–17426. [Google Scholar] [CrossRef]
  71. Yetzbacher, M.K.; Belabas, N.; Kitney, K.A.; Jonas, D.M. Propagation, Beam Geometry, and Detection Distortions of Peak Shapes in Two-Dimensional Fourier Transform Spectra. J. Chem. Phys. 2007, 126, 044511. [Google Scholar] [CrossRef] [PubMed]
Figure 1. Schematic diagram of the experimental setup. PPLN, periodically poled lithium niobate; HWP, half-wave plate; PBS, polarization beam splitter; AOM, acoustic–optic modulator; BS, beam splitter; BD, balanced detector.
Photonics 11 00120 g001
Figure 2. (a) Linear absorption spectrum, (b) the linewidth of individual comb tooth, (c) the coherent averaging absorption spectrum, and (d) the phase spectrum of DCS in Rb gas after FFT from a 1 s long recording. The absorption frequency is relative to a reference frequency, vref = 384.226348468 THz.
Photonics 11 00120 g002
Figure 3. (a) Single-quantum process and excitation pulse sequences and (b) double-sided Feynman diagrams. SE, stimulated emission; GSB, ground state bleach. (c) Double-quantum process and excitation pulse sequences and (d) double-sided Feynman diagrams. |f⟩, |e⟩, and |g⟩ are the doubly excited state, excited state, and ground state, respectively.
Photonics 11 00120 g003
Figure 4. (a) The single periodic linear and nonlinear DCS signals after RF down-conversion in 0 to half repetition frequency range. (b) Photon echo DCS and (c) the double-quantumDCS with comb teeth and coherent averaging after FFT one-second-long recording data. The reference frequency, vref = 384.226348468 THz.
Photonics 11 00120 g004
Figure 5. Experimental time-resolved photon echo dynamic process generated by (a) HHHH- and (b) HVVH-polarized excitation pulses (H, horizontal polarization; V, vertical polarizations). Photon echo beating dynamics of the amplitude for the four major peaks at emission frequencies (c) 8.24 GHz, (d) 5.92 GHz, (e) 2.98 GHz, and (f) 1.87 GHz. The reference frequency, vref = 384.226348468 THz.
Photonics 11 00120 g005
Figure 6. Experimental photon echo (a) amplitude 2DCS, (b) real-part 2DCS, simulated (c) amplitude 2DCS, and (d) real-part 2DCS generated by HHHH excitation pulses. Experimental photon echo (e) amplitude 2DCS, (f) real-part 2DCS, simulated (g) amplitude 2DCS, and (h) real-part 2DCS generated by HVVH excitation pulses. The reference frequency, vref = 384.226348468 THz.
Photonics 11 00120 g006
Figure 7. Experimental time-resolved double-quantum dynamic process generated by (a) HHHH- and (b) HVVH-polarized excitation pulses (H, horizontal polarization; V, vertical polarizations). Double-quantum beating dynamics of the amplitude for the four major peaks at emission frequencies (c) 8.24 GHz, (d) 5.92 GHz, (e) 2.98 GHz, and (f) 1.87 GHz. The reference frequency, vref = 384.226348468 THz.
Photonics 11 00120 g007
Figure 8. Experimental double-quantum (a) amplitude 2DCS, (b) real-part 2DCS, simulated (c) amplitude 2DCS, and (d) real-part 2DCS generated by HHHH excitation pulses. Experimental double-quantum (e) amplitude 2DCS, (f) real-part 2DCS, simulated (g) amplitude 2DCS, and (h) real-part 2DCS generated by HVVH excitation pulses. The reference frequency, vref = 384.226348468 THz.
Photonics 11 00120 g008
Disclaimer/Publisher’s Note: The statements, opinions and data contained in all publications are solely those of the individual author(s) and contributor(s) and not of MDPI and/or the editor(s). MDPI and/or the editor(s) disclaim responsibility for any injury to people or property resulting from any ideas, methods, instructions or products referred to in the content.

