Abstract
The basic mechanisms of absorption of THz range radiation in optically perfect LiGdF4 single crystals were studied using the broadband experimental data and the dielectric response function analysis within the harmonic oscillator model. The polarized IR reflection spectra have allowed one to determine the phonon contribution in the absorption coefficient in the THz range, while transmission spectra in the THz range were used to obtain the birefringence value and the effects of various mulitparticle processes. Additionally, we established the optical and electrodynamic parameters of the LiGdF4 single crystal, which are necessary for the design of nonlinear optical devices.
1. Introduction
In addition to the obvious coverage of the frequency range of low-energy vibrational, rotational, and relaxation excitations in various media, terahertz (THz) radiation has well-known advantages [1]. The energy of THz radiation quanta is less than meV, and this is not enough for the ionization of matter, in contrast to X-ray (tens of keV) irradiation. The penetration depth of THz waves depends on the type and structural and morphological properties of matter. Scattering effects in porous and heterogeneous substances are noticeably reduced for wavelengths of 100 μm or longer. Materials with such properties are in demand in the introscopy (defectoscopy) of modern materials [2,3], high-rate communication systems, environmental monitoring, and the detection of hazardous substances [4,5,6]. The safety of THz radiation for biological objects opens up broad prospects for its application in medicine for the diagnosis and treatment of various diseases [7,8,9].
The increasing efficiency of optical systems in the THz range poses the problem of synthesizing and studying new materials for the manufacture of passive and active devices, such as reflectors, lenses, splitters, waveguides, converters, amplifiers, and generators. Single-crystal fluorine compounds have prospects for application in THz-range systems. In particular, LiLnF4 (Ln = Tb-Yb) crystals are used in broadband optical insulators based on the Faraday effect [10]. The successful use of the LiYF4:Nd laser in a compact THz-radiation generator was reported in [11,12].
In addition to laser physics application [13,14,15], scheelite-type LiGdF4 crystals (space symmetry group I41/a, Z = 4 [16]) are used as one of the most efficient magnetic adiabatic refrigerators for obtaining ultralow temperatures [17]. This may be of interest for the elaboration of highly sensitive systems for detecting THz radiation. Fluoride crystals are widely used as active laser media in the mid-IR to VUV range [18], but their characteristics in the THz spectrum range require further careful study.
The optical and vibrational properties of LiLnF4 (Ln = Y, Gd-Lu) (scheelite crystal family) were studied using IR, Raman, and inelastic neutron scattering data [19,20,21]. Nevertheless, there are no reports on the optical characteristics of the said crystals in the THz range. Standard approaches to the analysis of the IR spectra, including the generalized four-parameter model and classical oscillator model, provide limited reliability to the results extrapolated to both low and high frequency with respect to phonon eigenfrequencies. In addition to the contribution of the low-frequency wing of phonon absorption, crystal absorption increases in the THz range due to extrinsic and multi-particle processes [22,23]. The high-frequency extrapolation of the calculated spectra of optical phonons, obtained with the use of the classical oscillator model, gives unacceptable overestimated values due to the assumption that the damping constant does not depend on frequency. At the same time, narrow-band measurements by THz spectroscopy only allow one to determine the optical constants of the crystal, which are the sum of various processes. Thus, the calculation of the contributions of all absorption mechanisms requires the acquisition of broadband data covering the entire range dispersion of the analyzed processes.
This paper presents the results of our study of the scheelite-type LiGdF4 single crystal.
2. Experimental Methods and Data Analysis
Single crystals LiGdF4 were grown in Kazan Federal University by the Bridgman–Stockbarger method (32 mol% GdF3 and 68 mol% LiF composition; 755 °C; 10–3 Pa high vacuum; high-purity graphite resistive heater and thermal insulators; 1 mm/h pulling rate; graphite crucibles for [100]-oriented boules [24]). These parameters are consistent with the growing conditions selected by Chai et al. [25].
X-ray diffraction (XRD) measurements were performed on Empyrean X-ray diffractometer (Malvern PANalytical B.V.; Cu Kα radiation, λ = 0.154 nm).
The variation of initial of chemical composition along with the special growth conditions allowed one to obtain up to 50 mm long transparent optically perfect crystals. Two plane–parallel polished plates were made from the grown boule. In one plate, the crystallographic c axis coincided with the plane of the plate, while in the second one, the c axis was perpendicular to the said plate plane. The thickness of the plates (2.225 ± 0.005 mm) was measured using a digital point Mitutoyo 342-251-30 micrometer (±0.002 mm accuracy). The surface area of the obtained samples made allowed for the measuring of their optical properties using a diaphragm with a diameter of 8 mm, which is larger than the radiation wavelength. This eliminates diffraction distortion in the obtained transmission spectra over the entire experimental frequency range.
The low-frequency transmission spectra of the LiGdF4 single crystal in the 0.3–3 THz (10–100 cm−1) range were recorded using the laboratory THz time-domain spectrometer (TDS) [26]. Linearly polarized THz radiation was obtained using free-standing wire grid. The polarization degree was measured as a transmission parallel (Tmax) and crossed the (Tmin) grid polarizer and analyzer according to the following equation: P = (Tmax − Tmin)/(Tmax + Tmin), and it was found to be equal to 0.99.
The Bruker IFS113v IR Fourier spectrometer was used to record transmission and reflection spectra in the 30–5000 cm−1 range. A periodic metal grid (1200 lines/mm) on a polyethylene substrate provided linear polarization of IR radiation, with a degree of polarization of 0.975.
The spectra were recorded with the electric field vector E of the radiation parallel and perpendicular to the c axis of the crystal.
Spectra simulations were performed simultaneously for all transmission and reflection data sets. The Fresnel equations were used for reflection spectra modelling, while absorption bands were calculated using the classical oscillator additive model. Three adjustable parameters—the dielectric contribution of the j-th optical phonon mode Δεj, its frequency νj [cm−1], and the damping constant γj [cm−1]—were determined using Equation (1), as follows:
The interference pattern in the transmission spectra in the THz range was simulated using the model of coherent transmission of a plane-parallel layer [27,28,29].
Difference multiparticle absorption in the THz range [22,23,30,31] was simulated using the classical oscillator model. The dispersion of the transmission spectra at the high-frequency edge of phonon absorption was separately calculated using the Cauchy–Sellmeier (C-S) approach. The obtained parameters of polynomials (not listed in the tables) were used only to calculate the response function spectra at the frequencies above 1000 cm−1.
3. Experimental Results
The phase composition of the LiGdF4 crystal was confirmed by the X-ray diffraction method (XRD). The calculation of the lattice parameters (a = b = 5.217(4), c = 10.976(5) Å, tetragonal system, SSG I41/a) was carried out using HighScore Plus software.
The XRD data of the LiGdF4 powdered samples (crushed single crystal) are presented in Figure 1 together with XRD standard data.
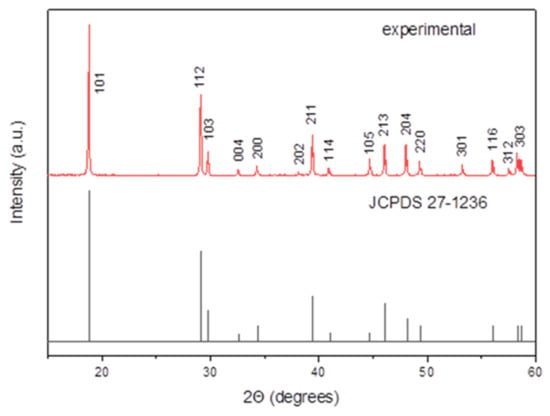
Figure 1.
XRD pattern of the LiGdF4 sample and XRD standard of LiGdF4.
The LiGdF4 samples are transparent in near IR and visible spectral ranges and have intensive absorption bands in UV due to 4f-4f transitions from the 8S7/2 ground state of the Gd3+ ions to the 6Pj, 6Ij, and 6Dj excited ions, being outside of the said spectrum range (Figure 2).
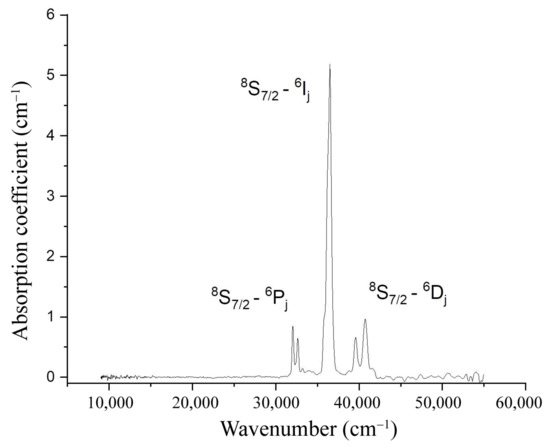
Figure 2.
Non-polarized room-temperature absorption spectrum of LiGdF4 crystal.
4. THz-IR Spectra Fitting and Parameters Calculation
Broadband experimental and calculated spectra of LiGdF4 single crystal for E‖c and E⊥c polarization are shown in Figure 3 by dots and solid lines, respectively. The factor group analysis [32,33] predicts 4 Au optical phonon modes and 4 Eu modes corresponding to the directions of E polarization parallel and perpendicular to the c axis. The reconstruction of the parameters of optical phonon modes was performed based on the reflection spectra and with the use of the Equation (1) under the assumption of semi-infinite flat sample. The determined parameters of optical phonon modes of LiGdF4 single crystal are listed in Table 1 and Table 2. Semi-infinite approximation is valid in the frequency range of high absorption. However, experimental reflection data increased due to incoherent reflection from the rear face of the sample in the transparent area above 1000 cm−1.
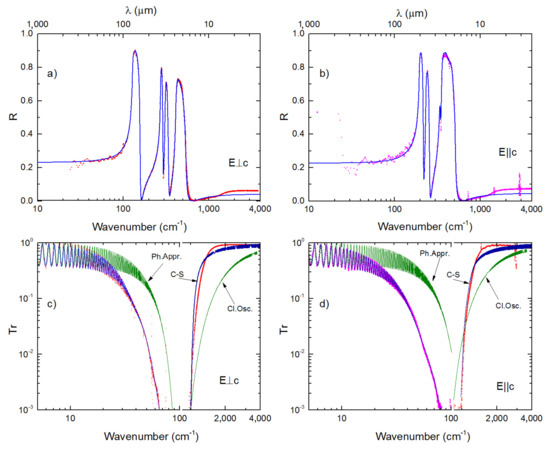
Figure 3.
Reflection (a,b) and transmission (c,d) spectra on the LiGdF4 single crystal obtained in E⊥c and E‖c. Dots show experimental data. Solid lines show calculated spectra. Lines marked (Ph. Appr.) show extrapolation to the THz range of the calculated spectra in the phonon approximation; lines marked Cl.Osc. are calculated transmission spectra using parameters of classical oscillator model; and lines denoted as C-S show the simulated spectra using Cauchy–Sellmeier approach.

Table 1.
Parameters of oscillators simulating the absorption bands of the LiGdF4 single crystal for E‖c. ε∞ = 2.36(7) n = 1.53(8).

Table 2.
Parameters of oscillators simulating the absorption bands of the LiGdF4 single crystal for E⊥c. ε∞ = 2.25(4) n = 1.50(1).
The limits of applicability of fitting the reflection spectra of optical phonon modes by the additive classical oscillator model (Figure 3a,b) are illustrated by the graphs of the transmission spectra (Figure 3 c,d) in order to reconstruct the crystal response function. The transmission spectra were calculated in the coherent mode and contain interference patters in the low- and high-frequency transparency regions. The said transmission spectra are calculated using the classical oscillator model in accordance with the obtained parameters of the optical phonon modes (denoted as Cl.Osc.); they have an reduced value compared to the experiment in the mid-IR range. In order to obtain the absorption values in the mid-IR spectrum range, the transmission spectra were fitted using the Cauchy–Sellmeyer approach. In the THz range, the transmission spectra were calculated using the parameters of IR optical phonon modes, which are shifted to the higher frequencies compared to the experimental data. The eigenfrequency of the lowest optical phonon modes Au(1) and E1u(1) (Table 1 and 2) are 195.5 and 129.2 cm−1, respectively, and their contributions are not sufficient to fit the experiment. One can expect both intrinsic and extrinsic absorption in the THz spectrum range. The extrinsic absorption can be neglected due to the high optical quality and low defect concentration in the grown crystals. The intrinsic absorption includes both the contribution of optical phonon modes and two-phonon difference processes [22,23]. Absorption due to different multiparticle processes in the THz range was described using Equation (1) with the substitution of large values of the damping constant γ. The parameters of the oscillators are listed in Table 1 and Table 2 and denoted as Dmp. Additional absorption was also present at the frequencies of the highest reflection bands (LO-TO phonon splitting). These absorption bands are associated with second-order two-phonon processes [34], for which the photon absorption leads to the creation of two optical phonons on the Brillouin zone boundary with opposite momenta. The parameters of these absorption bands are denoted as ∑mp.
5. Absorption Processes in the THz Range
The spectral data obtained in the THz range for a LiGdF4 single crystal with linear polarized radiation are shown in Figure 4a,b. High-resolution transmission spectra (Figure 4a) indicate the differences in the recorded interference patterns. Interference in the spectra was used to calculate the refractive indexes according model [27] for both ordinary and extraordinary beams in LiGdF4 single crystal (no = 2.85 and ne = 2.81, the birefringence value is ∆n = 0.04).
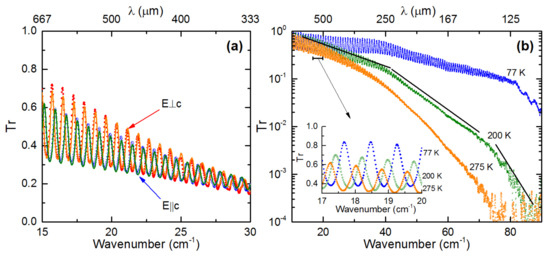
Figure 4.
Scaled part of transmission spectra of the LiGdF4 single crystal in the THz range for E⊥c and E‖c polarization. Points represent the experimental data, and solid lines correspond to the spectra calculated by Fresnel–Lorentz model (a). Temperature dependence of the transmission spectra of the single crystal LiGdF4 in E⊥c polarization (b).
The deconvolution of the phonon and multiparticle absorption processes was carried out with the use of the temperature dependence of transmission spectra. The temperature evolution of transmission of LiGdF4 single crystal for E⊥c polarization is shown in Figure 4b. Two processes led to the observed temperature-dependent changes: the narrowing of the phonon absorption contour and the decrease in the probability of transitions between phonon branches due to the reduction in their population [22].
The changes in the slopes of the transition spectra in different frequency regions (Figure 4b) indicate the presence of overdamped absorption processes. The total dielectric permittivity of optical phonon modes is assumed to be constant due to the fulfillment of the sum rule and the absence of structural phase transitions. In the insert Figure 4b, it can be seen that the interference period of the transmission spectra increases with cooling; this fact indicates a decrease in the refractive index and, hence, the dielectric permittivity.
6. Discussion
The spectra decomposition into elementary excitations was carried out using calculations by the classical oscillator model. The deconvolution of the absorption processes in the response function of a LiGdF4 single crystal was carried out using the spectra of the complex dielectric permittivity. Two independent approaches were used to reconstruct the spectra of real ε’(ν) and imaginary ε”(ν) parts of the dielectric permittivity. In the first method, these spectra were calculated by fitting the parameters listed in Table 1 and Table 2. The second method was to apply the Kramers–Krönig relations to the IR reflectivity spectra R(ν) to reconstruct the phase spectra of reflected waves φ(ν). The experimental reflectivity and reconstructed phase shift spectra were used to calculate ε’(ν) and ε”(ν). In Figure 5, the solid lines show the spectra calculated using the model parameters, and the dots show the spectra obtained using the Kramers–Krönig relations. The spectra obtained by the Kramers–Krönig method retain all the noise and distortions of the experimental reflection spectra. They also contain distortions in the low-absorption regions at frequencies between the two optical phonon modes (150–250 cm−1 E⊥c, and 200–300 cm−1 E‖c). Nevertheless, the Kramers–Krönig method provides an independent way to control the modelling reliability of the contribution of the optical phonon modes.
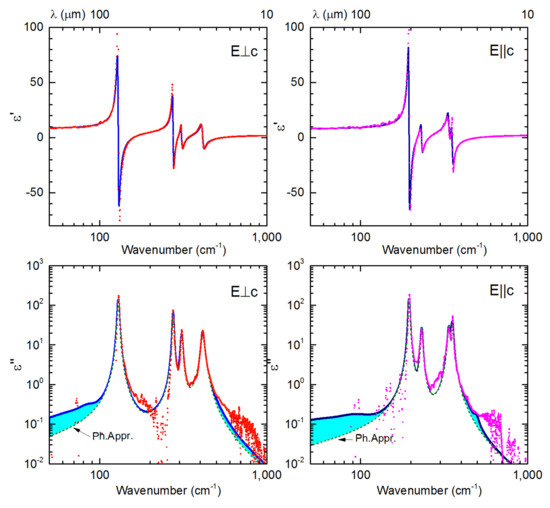
Figure 5.
Spectra of complex dielectric permittivity of LiGdF4 single crystal along principal crystallographic direction with E⊥c and E‖c. Solid lines show spectra simulated using parameters listed in Table 1 and Table 2. Dashed lines show the extrapolation of the simulated spectra using only Au and Eu phonons contribution. Dots show spectra obtained using Kramers–Krönig relations.
The classical oscillator model provides a correct shape of the resonance line near the eigenfrequencies of the optical phonon modes. The low-frequency extrapolation of the dielectric loss spectra ε”(ν) of the Au and Eu phonon modes, depicted by dashed lines in Figure 5 (Ph.Appr.), indicates that their values are approximately an order of magnitude smaller than ε”(ν) spectra calculated based on transmission data (solid lines, Figure 5).
The phonon contribution to the dielectric loss was calculated based on reflection spectra; it is shown by dashed lines in Figure 6 for 298 K and 77 K temperatures. The temperature dependence of the eigenfrequency of the phonon mode follows the Grüneisen relation [35,36,37]. A change in the sample temperature within about 200 K range corresponds to the blue shift eigenfrequency approximately of 1–3 cm−1. The decrease in cooling of phonon absorption in the THz range due to narrowing of the resonance contour has been determined by the damping constant according to the Bose–Einstein model [35].
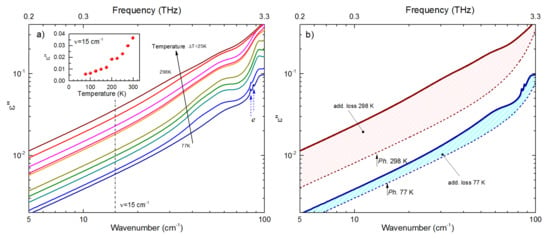
Figure 6.
Temperature evolution of ε”(ν) spectra in the THz frequency range. Solid lines on graphs (a,b) indicate the total level of the dielectric losses, obtained using THz transmission spectra. Dashed lines on graph (b) indicate the level of dielectric losses determined by the contribution of optical phonon contours at temperatures of 298 and 77 K. The shaded areas show additional losses (add.loss) with respect to one-phonon absorption.
Solid lines in Figure 4 show the spectra of total losses in the THz range. The spectra were acquired with 25 K temperature steps. The wide absorption band has been revealed in the spectra ε”(ν) in the frequency range of 40–70 cm−1 with temperature decrease. Dielectric losses exhibit non-monotonic reduction under cooling outside of the dispersion range of this band (Figure 6a insert). Such temperature behavior of the loss spectra may reflect a decrease in the population of acoustic branches under cooling and residual absorption due to transitions between optical branches.
Another type of absorption in the form of narrow resonances at 83.9 and 86.6 cm−1 frequencies has been observed below 100 K. These bands can be associated with 5d-4f electron orbital transitions having a mixed electro and magnetic dipole character [38]. The electro dipole transition between f-states is forbidden in centrosymmetric Gd+3 (4f75d1) ion sites. However, the low symmetry of the LiGdF4 crystal lattice promotes the splitting J ground state into Kramers doublets, so inter-multiplet transitions take place. Figure 6b illustrates the decrease in the contribution of multi-particle processes to the loss spectra (denoted as add.loss) under cooling from 298 K to 77 K by approximately factor of 3. In this chart, changes in the low-frequency wings of the phonon absorption contours are taken into account and are shown by dashed lines.
Thus, in the THz range, three main intrinsic absorption processes represent the electrodynamic response of the LiGdF4 crystal: the low-frequency wing of the optical phonon mode, the multipartile difference processes, and the contribution of the electronic transition between the split multiplet levels of the Gd+3 ion ground state.
Figure 7 shows the calculated spectra of the refractive index and the absorption coefficient of the LiGdF4 single crystal in the THz-IR ranges at room temperature, which are of practical interest for the non-linear optical applications.
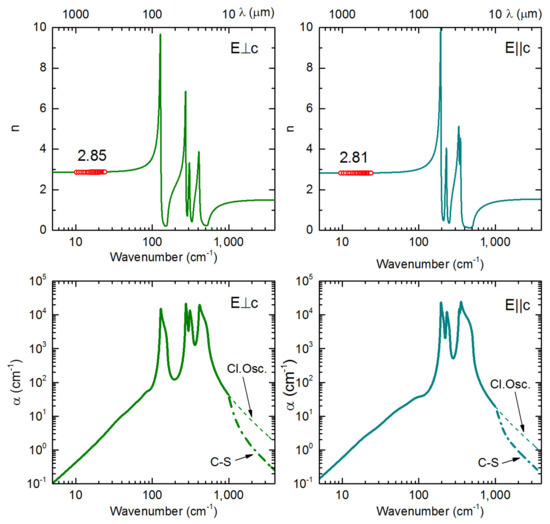
Figure 7.
Calculated spectra of the refractive index and absorption coefficient of the LiGdF4 single crystal in the THz-IR ranges at room temperature. Solid lines are the spectra n(ν) and α(ν) calculated using parameters given in Table 1 and Table 2, and hollow circles are refractive index values obtained directly from interference pattern using model [27].
Refractive index values, calculated using fitting parameters (solid lines) and obtained using equations of the coherent transmittance of single-layer sample (hollow circles), are presented in the said Figure 7 for the THz range. In the mid-IR range, absorption spectra, obtained based on the classical oscillator model (dashed lines Cl.Osc.), were corrected using Cauchi–Sellmeyer equations (dash-dotted lines C-S). Thus, the optical parameters of the LiGdF4 single crystal in the THz-IR ranges were restored with sufficient accuracy.
7. Conclusions
LiGdF4 single crystals were grown by Bridgman–Stockbarger technique. The dimensions of prepared single crystals were suitable for optical measurements in a wide frequency range without diffraction distortions. The decoding of the electric-dipole absorption spectrum in a crystal into elementary excitations has been carried out using the model of a classical oscillator. It allowed one to determine the parameters of the optical phonon modes of the LiGdF4 crystal in the main crystallographic directions and to highlight the contribution of multiparticle difference processes that increased absorption in the THz frequency range by about an order of magnitude.
The optical characteristics of the crystal were established using direct measurements of transmission spectra with high-frequency resolution. The birefringence in the THz range Δn = 0.04 was calculated. The dependence of the absorption coefficient of the crystal on temperature in the THz range, determined by both a single-phonon contribution and by multiparticle processes, has been found. The dispersion of the crystal absorption coefficient at the high-frequency edge of phonon absorption has been estimated using the Cauchy–Sellmeyer approach. It is worth noting that, in the THz range, the behavior of the response functions of a rare-earth fluoride crystal and oxides has a qualitative similarity. The main mechanisms, determining the absorption and dispersion of the optical parameters of this crystal in the THz and IR ranges, were determined and analyzed.
Author Contributions
G.A.K.: Conceptualization, methodology, formal analysis, investigation, writing—original draft preparation, writing— review and editing, and visualization. S.P.L.: Methodology, formal analysis, investigation, software, and writing—review and editing. S.L.K.: Crystal growth and sample preparation. O.A.M.: Crystal growth and sample preparation. V.M.K.: Investigation. V.V.S.: Writing—review and editing. P.P.F.: Conceptualization, writing—review and editing. All authors have read and agreed to the published version of the manuscript.
Funding
This work was carried under the R&D plan of the Prokhorov General Physics Institute of the Russian Academy of Sciences.
Data Availability Statement
The data that support the findings of this study are available within the article.
Acknowledgments
The crystal growth experiments and primary samples’ characterization were carried out in accordance with the Strategic Academic Leadership Program “Priority 2030” of the Kazan Federal University of the Government of the Russian Federation and were funded by the government assignment for FRC Kazan Scientific Center of RAS. The authors express their gratitude to A. R. Hadiev for measuring the absorption spectra of LiGdF4 crystals in the near infrared, visible, and UV ranges. The authors express their sincere gratitude to Arthur I. Popov for his most kind assistance in the preparation of the present manuscript.
Conflicts of Interest
The authors declare no conflict of interest.
References
- Zhang, Y.; Li, K.; Zhao, H. Intense terahertz: Generation and application. Front. Optoelectron. 2021, 14, 4–36. [Google Scholar] [CrossRef]
- Recur, B.; Guillet, J.P.; Manek-Hönninger, I.; Delagnes, J.C.; Benharbone, W.; Desbarats, P.; Mounaix, P. Propagation beam consideration for 3D THz computed tomography. Opt. Express 2012, 20, 5817–5829. [Google Scholar] [CrossRef] [PubMed]
- Cherkassky, V.S.; Gerasimov, V.V.; Ivanov, G.M.; Knyazev, B.A.; Kulipanov, G.N.; Lukyanchikov, L.A.; Merzhievsky, L.A.; Vinokurov, N.A. Techniques for introscopy of condense matter in terahertz spectral region. Nucl. Instrum. Methods Phys. Res. A 2007, 575, 63–67. [Google Scholar] [CrossRef]
- Samuels, A.C.; Woolard, D.L.; Globus, T.; Gelmont, B.; Brown, E.R.; Jensen, J.O.; Suenram, R.; Loerop, W.R. Environmental sensing of chemical and biological warfare agents in the THz region. Int. J. High Speed Electron. Syst. 2002, 12, 479–489. [Google Scholar] [CrossRef]
- Kellarev, A.; Sheffer, D. Terahertz Remote Sensing. In Proceedings of the Terahertz Physics, Devices, and Systems V: Advance Applications in Industry and Defense, Orlando, FL, USA, 23–27 April 2011; p. 80230N. [Google Scholar] [CrossRef]
- Dolfi, D.; Morvan, L.; Pillet, G.; Larat, C.; Legagneux, P.; Montanaro, A.; de Rossi, A.; Crété, D.; Marcilhac, B.; Bortolotti, P.; et al. Building Blocks and Concepts for THz Remote Sensing and Communications. In Proceedings of the 44th International Conference on Infrared, Millimeter, and Terahertz Waves (IRMMW-THz), Paris, France, 1–6 September 2019; pp. 1–2. [Google Scholar] [CrossRef]
- Zaytsev, K.I.; Dolganova, I.N.; Chernomyrdin, N.V.; Katyba, G.M.; Gavdush, A.A.; Cherkasova, O.P.; Komandin, G.A.; Shchedrina, M.A.; Khodan, A.N.; Ponomarev, D.S.; et al. The progress and perspectives of terahertz technology for diagnosis of neoplasms: A review. J. Opt. 2020, 22, 013001. [Google Scholar] [CrossRef]
- Cherkasova, O.P.; Serdyukov, D.S.; Nemova, E.F.; Ratushnyak, A.S.; Kucheryavenko, A.S.; Dolganova, I.N.; Xu, G.; Skorobogatiy, M.; Reshetov, I.V.; Timashev, P.S.; et al. Cellular effects of terahertz waves. J. Biomed. Opt. 2021, 26, 90902. [Google Scholar] [CrossRef]
- Smolyanskaya, O.A.; Chernomyrdin, N.V.; Konovko, A.A.; Zaytsev, K.I.; Ozheredov, I.A.; Cherkasova, O.P.; Nazarov, M.M.; Guillet, J.-P.; Kozlov, S.A.; Kistenev, Y.V.; et al. Terahertz biophotonics as a tool for studies of dielectric and spectral properties of biological tissues and liquids. Prog. Quantum Electron. 2018, 62, 1–77. [Google Scholar] [CrossRef]
- Vasyliev, V.; Villora, E.G.; Nakamura, M.; Sugahara, Y.; Shimamura, K. UV–visible Faraday rotators based on rare-earth fluoride single crystals: LiREF4 (RE = Tb, Dy, Ho, Er and Yb), PrF3 and CeF3. Opt. Express 2012, 20, 14460–14470. [Google Scholar] [CrossRef]
- Angeluts, A.A.; Bezotosnyi, V.V.; Cheshev, E.A.; Goltsman, G.N.; Finkel, M.I.; Seliverstov, S.V.; Evdokimov, M.N.; Gorbunkov, M.V.; Kitaeva, G.K.; Koromyslov, A.L.; et al. Compact 1.64 THz source based on a dualwavelength diode endpumped Nd:YLF laser with a nearly semiconfocal cavity. Laser Phys. Lett. 2014, 11, 015004. [Google Scholar] [CrossRef]
- Liu, Y.; Zhong, K.; Wang, A.; Zhou, M.; Li, S.; Gao, L.; Zhang, Z. Optical Terahertz Sources Based on Difference Frequency Generation in Nonlinear Crystals. Crystals 2022, 12, 936. [Google Scholar] [CrossRef]
- Zhang, X.X.; Bass, M.; Villaverde, A.B.; Lefaucheur, J.; Pham, J.; Chai, B.H.T. Efficient laser performance of Nd:GdLiF4: A new laser crystal. Appl. Phys. Lett. 1993, 62, 1197. [Google Scholar] [CrossRef]
- Danger, T.; Sandrock, T.; Heumann, E.; Huber, G.; Chai, G. Pulsed Laser Action of Pr:GdLiF4 at Room Temperature. Appl. Phys. B 1993, 57, 239–241. [Google Scholar] [CrossRef]
- Cornacchia, F.; Di Lieto, A.; Tonelli, M. LiGdF4:Tm3+: Spectroscopy and diode-pumped laser experiments. Appl. Phys. B 2009, 96, 363–368. [Google Scholar] [CrossRef]
- Goryunov, A.V.; Popov, A.I.; Khajdukov, N.M.; Fedorov, P.P. Crystal Structure of Lithium and Yttrium Complex Fluorides. Mater. Res. Bull. 1992, 27, 213–220. [Google Scholar] [CrossRef]
- Numazawa, T.; Kamiya, K.; Shirron, P.; DiPirro, M.; Matsumoto, K. Magnetocaloric Effect of Polycrystal GdLiF4 for Adiabatic Magnetic Refrigeration. AIP Conf. Proc. 2006, 850, 1579. [Google Scholar] [CrossRef]
- Semashko, V.V.; Korableva, S.L.; Fedorov, P.P. Lithium Rare-Earth Fluorides as Photonic Materials: 2. Some Physical, Spectroscopic, and Lasing Characteristics. Inorg. Mater. 2022, 58, 447–492. [Google Scholar] [CrossRef]
- Salaün, S.; Fornoni, M.T.; Bulou, A.; Rousseau, M.; Simon, P.; Gesland, J.Y. Lattice dynamics of fluoride sheelites: I. Raman and infrared study of LiYF4 and LiLnF4 (Ln=Ho, Er, Tm and Yb). J. Phys. Condens. Matter. 1997, 9, 6941. [Google Scholar] [CrossRef]
- Salaün, S.; Bulou, A.; Rousseau, M.; Hennion, B.; Gesland, J.Y. Lattice dynamics of fluoride scheelites: II. Inelastic neutron scattering in LiYF4 and modelization. J. Phys. Condens. Matter. 1997, 9, 6957. [Google Scholar] [CrossRef]
- Babkevich, P.; Finco, A.; Jeong, M.; Dalla Piazza, B.; Kovacevic, I.; Klughertz, G.; Krämer, K.W.; Kraemer, C.; Adroja, D.T.; Goremychkin, E.; et al. Neutron spectroscopic study of crystal-field excitations and the effect of the crystal field on dipolar magnetism in LiRF4 (R=Gd, Ho, Er, Tm, and Yb). Phys. Rev. B 2015, 92, 144422. [Google Scholar] [CrossRef]
- Stolen, R.; Dransfield, K. Far-Infrared lattice absorption in alkali halide crystals. Phys. Rev. 1965, 139, A1295. [Google Scholar] [CrossRef]
- Sparks, M.; King, D.F.; Mills, D.L. Simple theory of microwave absorption in alkali halides. Phys. Rev. B 1982, 26, 6987. [Google Scholar] [CrossRef]
- Fedorov, P.P.; Semashko, V.V.; Korableva, S.L. Lithium Rare-Earth Fluorides as Photonic Materials: 1. Physicochemical Characterization. Inorg. Mater. 2022, 58, 223–245. [Google Scholar] [CrossRef]
- Chai, B.; Lefaucheur, J.; Pham, A. Growth of Nd:GdLiF4 Single Crystals. Proc. SPIE 1993, 1863, 9–12. [Google Scholar]
- Komandin, G.A.; Gavdush, A.A.; Goncharov, Y.G.; Porodinkov, O.E.; Nozdrin, V.S.; Chuchupal, S.V.; Spektor, I.E. Electrodynamical characteristics of α-lactose monohydrate in the terahertz range. Opt. Spectrosc. 2019, 126, 514–522. [Google Scholar] [CrossRef]
- Harbecke, B. Coherent and incoherent reflection and transmission of multilayer structures. Appl. Phys. B 1986, 39, 165–170. [Google Scholar] [CrossRef]
- Grosse, P.; Harbecke, B.; Heinz, B.; Meyer, R.; Offenberg, M. Infrared spectroscopy of oxide layers on technical Si wafers. Appl. Phys. A 1986, 39, 257–268. [Google Scholar] [CrossRef]
- Komandin, G.A.; Nozdrin, V.S.; Spektor, I.E.; Porodinkov, O.E.; Seregin, D.S.; Vishnevskiy, A.S.; Vorotilov, K.A. Dielectric contribution of the IR absorption bands of porous organosilicate glass thin films on platinum sublayer. J. Phys. D Appl. Phys. 2021, 54, 215304. [Google Scholar] [CrossRef]
- Komandin, G.A.; Porodinkov, O.E.; Spector, I.E.; Volkov, A.A. Multiphonon absorption in a MgO single crystal in the Terahertz Range. Phys. Sol. State 2009, 51, 2045. [Google Scholar] [CrossRef]
- Komandin, G.; Nozdrin, V.; Chuchupal, S.; Lomonov, S.; Pisarevskii, Y.; Porodinkov, O.; Spektor, I. Assessment of the application of paratellurite for the acousto-optical deflection of terahertz rays based on broadband spectroscopy data. J. Phys. D Appl. Phys. 2020, 53, 495102. [Google Scholar] [CrossRef]
- Salaun, S.; Bulou, A.; Gesland, J.Y.; Simon, P. Lattice dynamics of the fluoride scheelite CaZnF4. J. Phys. Condens. Matter 2000, 12, 7395. [Google Scholar] [CrossRef]
- Porto, S.P.S.; Scott, J.F. Raman spectra of CaWO4, SrWO4, CaMoO4 and SrMoO4. Phys. Rev. 1967, 157, 716. [Google Scholar] [CrossRef]
- Burstein, E.; Johnson, F.A.; Loudon, R. Selection rules for second-order infrared and Raman processes in the Rocksalt structure and interpretation of the Raman spectra of NaCl, KBr, and NaI. Phys. Rev. 1965, 139, A1239. [Google Scholar] [CrossRef]
- Gervais, F.; Piriou, B. Temperature dependence of transverse and longitudinal optic phonon modes in the α and β phases of quartz. Phys. Rev. B 1975, 11, 3944. [Google Scholar] [CrossRef]
- Knight, S.; Korlacki, R.; Dugan, C.; Petrosky, J.C.; Mock, A.; Dowben, P.A.; Mann, J.M.; Kimani, M.M.; Schubert, M. Infrared-active phonon modes in single crystal thorium dioxide and uranium dioxide. J. Appl. Phys. 2020, 127, 125103. [Google Scholar] [CrossRef]
- Gervais, F.; Piriou, B. Anharmonicity in several-polar-mode crystals: Adjusting phonon self-energy of LO and TO modes in Al2O3 and TiO2 to far infrared reflectivity. J. Phys. C Solid State Phys. 1974, 7, 2374. [Google Scholar] [CrossRef]
- Walter, U. Treating Crystal field parameters in lower than cubic symmetry. J. Phys Chem. Solids 1984, 45, 401–408. [Google Scholar] [CrossRef]
Disclaimer/Publisher’s Note: The statements, opinions and data contained in all publications are solely those of the individual author(s) and contributor(s) and not of MDPI and/or the editor(s). MDPI and/or the editor(s) disclaim responsibility for any injury to people or property resulting from any ideas, methods, instructions or products referred to in the content. |
© 2023 by the authors. Licensee MDPI, Basel, Switzerland. This article is an open access article distributed under the terms and conditions of the Creative Commons Attribution (CC BY) license (https://creativecommons.org/licenses/by/4.0/).