Communication

Study of Straight-Line-Type Sagnac Optical Fiber Acoustic Sensing System

1
The Institute of Xi’an Aerospace Solid Propulsion Technology, Xi’an 710025, China
2
The Key Laboratory of Electromagnetic Technology and Engineering, China West Normal University, Nanchong 637000, China
3
The Key Laboratory of Optoelectronic Technology & System, Education Ministry of China, Chongqing University, Chongqing 400044, China
*
Author to whom correspondence should be addressed.
Photonics 2023, 10(1), 83; https://doi.org/10.3390/photonics10010083
Submission received: 8 December 2022 / Revised: 7 January 2023 / Accepted: 9 January 2023 / Published: 11 January 2023

Abstract

:
A straight-line-type Sagnac optic fiber acoustic sensing system is proposed in this paper to adopt the application needs of no man’s plateau borderline for monitoring mechanical invasion. The Sagnac interference fiber loop is replaced by a straight-line fiber and a 1 × 2 coupler, and the length of the Sagnac interference fiber loop is shortened by close to 50%. The influences of delay fiber and sensing fiber on the sensing system are analyzed by theory calculation and simulation and the optimal lengths of delay fiber and sensing fiber were decided. The experiment system was set, and the sensing fiber was wound into titanium alloy cylinder to compose the sensing element. Experimental results show that the sensing system has a good response to 50−8000 Hz and 70 dB sinusoidal acoustical signals and can well distinguish the signals of different frequencies. Using a small-scale helicopter audio signal as the acoustical signal, the test results show that the response curve is consistent with the simulation results and the sensitivity reaches 30.67 mV/Pa.

1. Introduction

Optical fiber acoustic sensing technology has broad application prospects in perimeter security, environmental noise monitoring, nondestructive monitoring, etc. [1]. Compared with traditional electroacoustic sensors, photoacoustic sensors have the advantages of high temperature and humidity resistance, anti-electromagnetic interference, and corrosion resistance, which make them the hot spot of acoustic sensing technology research [2,3,4,5,6]. Presently, interferometric fiber optic acoustic sensors are mainly based on the principles of Michelson interference, fiber optic Fabry–Perot interference, Mach–Zehnder interference, and Sagnac interference [7,8,9,10,11,12,13]. The photoacoustic sensing system based on the Michelson interferometer and Fabry–Perot interferometer requires high-precision machining technology and accurate alignment of components, which leads to poor environmental adaptability and is limited to applications in harsh natural environments [14]. Mach–Zehnder interferometric photoacoustic sensors have the disadvantages of low sensitivity and low signal-to-noise ratio (SNR) [15,16,17]. The photoacoustic sensing system based on Sagnac interference has high sensitivity, wide bandwidth, and high signal-to-noise ratio and only uses optic fiber as the sensitive elements without any fiber structure changes, which makes it become a cheap and reliable choice for sound detection in harsh environments, especially when it applied in no man’s plateau borderline for monitoring the invasion of military motor vehicles, armored cars, unmanned aerial vehicles, etc. [18,19,20].
When a photoacoustic sensing system based on a Sagnac interferometer is operated in a natural environment, a large amount of non-sensing fiber of the Sagnac loop is exposed to environmental vibration and noise [18]. The acoustic detection sensitivity, SNR, and stability will be significantly reduced by disturbances in the non-sensing optical fiber. The traditional solution is to add anti-vibration and anti-wear protection for non-acoustic sensing fiber [18]. However, this method greatly increases the application cost, especially when the length of the signal transmission fiber is long. Meanwhile, the signal transmission fiber with protection cannot completely eliminate the problems of sensitivity and stability reduction. Therefore, shortening the length of signal transmission fiber becomes a good idea for solving this problem.

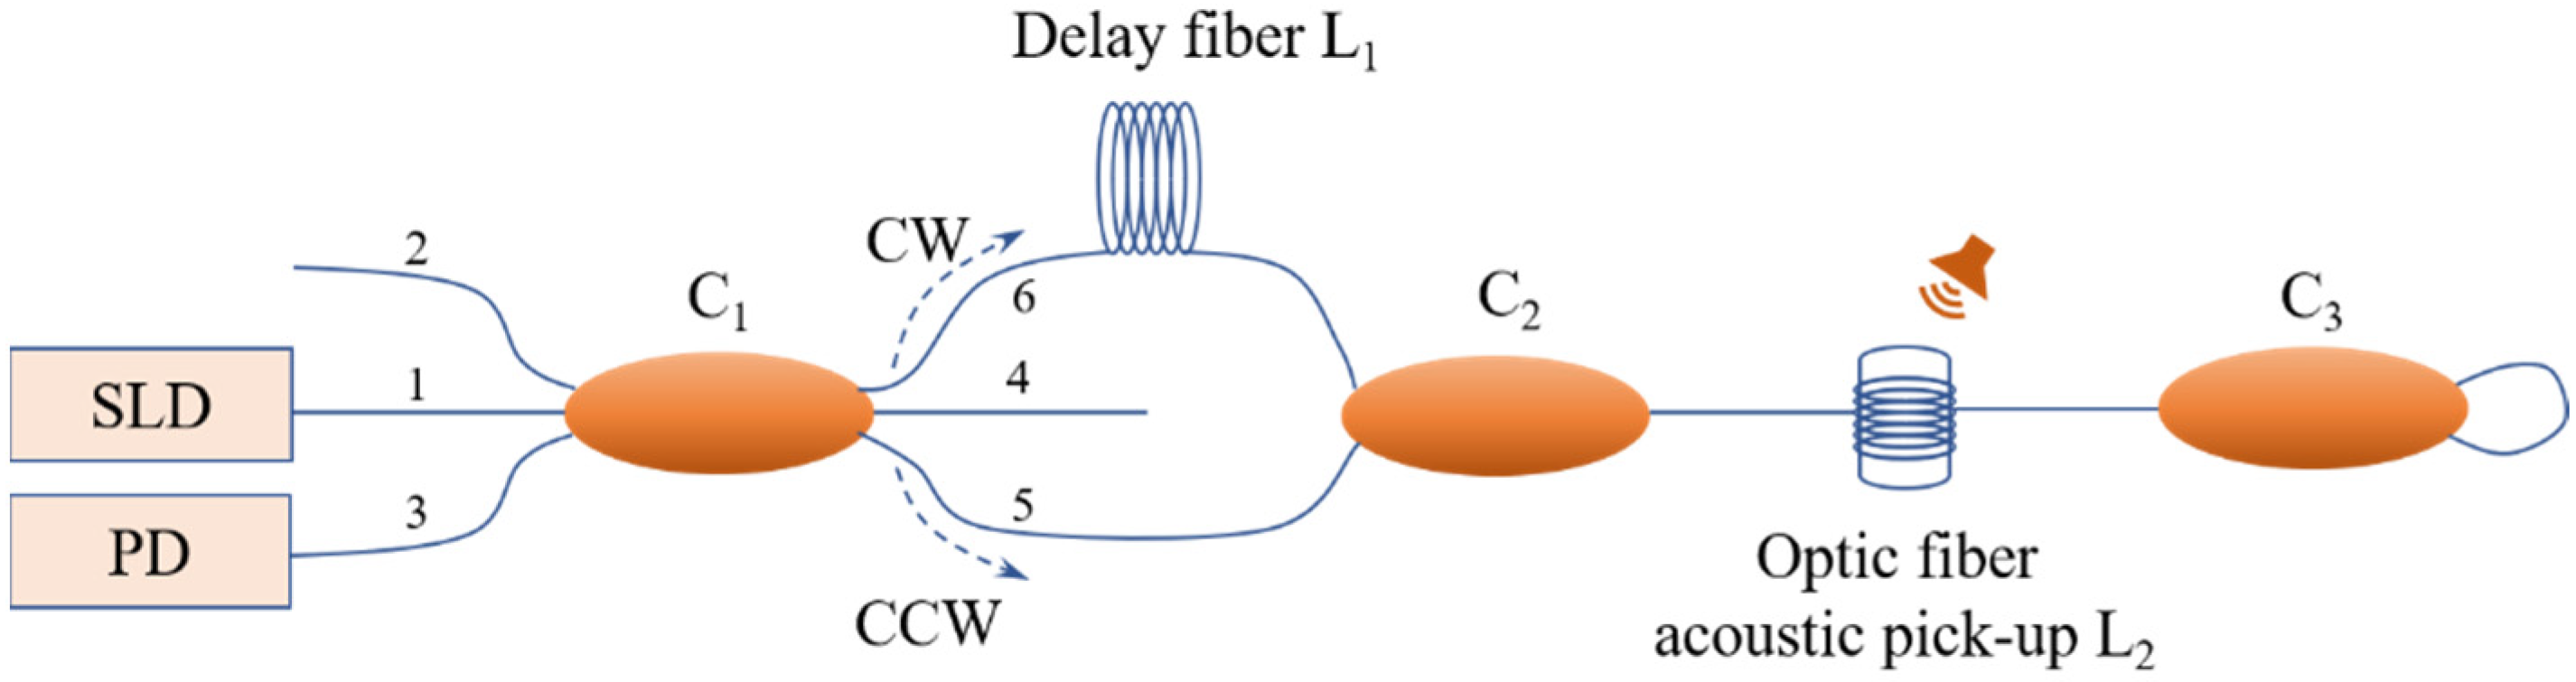
2. Sensor Configuration and Theory Analysis

As shown in Figure 1, the traditional Sagnac fiber optic acoustic sensor has a long Sagnac interference optic fiber loop. When the long optic fiber loop is exposed to the natural environment, severe noise appears at the detector. As shown in Figure 2, a schematic diagram of the straight-line-type Sagnac fiber optic acoustic sensing system was proposed. Compared to the traditional Sagnac fiber optic acoustic sensor, the two light beams of the CW (clockwise) and CCW (counterclockwise) pass coupler C2 are transmitted by one fiber. At coupler 3, the beams pass it and come back to the optic fiber again. Because of the improvement in the Sagnac loop, one arm of the loop disappeared, which means the transmission fiber is reduced by nearly 50%. The straight-line-type Sagnac fiber optic acoustic sensing system shortens the lengths of the Sagnac loop and reduces the disturbance of environments.
The light emitted by a super-luminescent light-emitting diode (SLD) passes 3 × 3 coupler C1 and can be divided into three beams, and then two beams enter the CW (clockwise) and CCW (counterclockwise) optical paths through port 6 and 5. At coupler C2, the two beams are merged into one single beam and transmitted to optic fiber acoustic pick-up L2. At coupler C3, the light is divided into two beams and comes back through port 2 and 3 of C3. When the two beams come back to C1, interference occurs and is detected by the photoelectric detector (PD). During this process, there are four main optical paths, as follows.
A:1—6—L1—C2—L2—C3—L2—C2—L1—6—C1;
B:1—6—L1—C2—L2—C3—L2—C2—5—C1;
C:1—5—C2—L2—C3—L2—C2—L1—6—C1;
D:1—5—C2—L2—C3—L2—C2—5—C1.
In the four optical paths, path A is the longest, path D is the shortest, and paths B and C are equal. When a broadband light source is used, the coherence length is very short and only optical paths B and C can find a recognizable interference in coupler C1.
The interference light intensity in C1 can be expressed as
I = 1 9 I 0 1 + cos ( Δ φ + Δ ψ )
where I is the interference light intensity, I0 is the light intensity of SLD coupled into the optical fiber, ∆φ is the phase difference caused by sound pressure, and ∆ψ is the phase shift caused by coupler C1. The sensing light beam passes the optic fiber acoustic pick-up L2 twice, so the practical acoustic sensing fiber length is two-times the optic fiber acoustic pick-up L2, and the sensitivity is obviously higher than the traditional Sagnac fiber optic acoustic sensing system. The phase sensitivity of the straight-line-type Sagnac fiber optic acoustic sensing system under 1Pa sound pressure can be expressed as
S = 8 π n k L 2 λ sin n π L 1 f c
where S is the phase sensitivity, L2 is the length of the optic fiber acoustic pick-up, L1 is the length of the delay fiber, n is the refractive index of silica fiber, k is the elastic coefficient of optical fiber, f is the sound frequency, λ is the optical wavelength, and c is the vacuum speed of light. The phase sensitivity expression shows that the phase sensitivity is linear to sensing fiber loop L2 and is sinusoidal to delay fiber loop L1. For a definite sound pressure P, the phase difference caused by the sound pressure can be calculated by
Δ φ = S P = 8 π n k L 2 λ sin n π L 1 f c P
Substituting Equation (3) into Equation (1), the interference light intensity received by PD is shown as
I = 1 9 I 0 1 + cos 8 π n k L 2 λ P sin n π L 1 f c + Δ ψ
When a 3 × 3 coupler is used, the phase shift caused by the coupler is ∆ψ = 2π/3. For a certain sensing system and a certain invader, the initial light intensity, light wavelength, elastic coefficient, sound pressure, and the frequency of sound are all certain. Then, the interference light intensity received by PD will mainly be influenced by the lengths of the sensing fiber and delay fiber.
When the system is used to monitor invasion of military motor vehicles, armored cars, unmanned aerial vehicles, etc., at the borderline, the sound-detection frequency is focused on 50−8000 Hz and the detection sound pressure level (SPL) range is often 50−100 dB. To confirm the best element parameters, a series of simulations is finished. In the simulations, I0 = 1.3 mW, λ = 1310 nm, n = 1.456, k = 6.829 × 10⁻⁹ Pa−1, c = 3 × 10⁸ m/s.
When f = 5000 Hz and L2 = 20 m, the SPL is between 50 and 100 dB, and the length of the delay fiber is set to 1 km, 2 km, and 4 km. Under the influence of the delay fiber loop, the simulation curves of sound pressure and interference light intensity are shown in Figure 3. The results show that the longer the delay fiber loop, the shorter period of interference light intensity and higher sensitivity of photoacoustic detection. However, as the length of the delay fiber loop increases, the linear detection range of sound pressure becomes narrower. When the delay fiber loop length is 4 km, although the sensitivity is higher, there is a crest at 98 dB and the linearity of the response curve becomes poor. When the delay fiber loop is 1 km, the sensitivity is lower. When the delay fiber loop is 2 km, the sensitivity is high and there is no peak and trough during 50−100 dB. Considering the balance of sensitivity and detection range, a 2 km delay optic fiber length is the best choice.
When f = 5000 Hz and L1 = 2 km, the SPL is between 50 and 100 dB, and the length of the sensing fiber is set to 10 m, 20 m, and 40 m, the influence of optic fiber acoustic pick-up to sound pressure and interference light intensity is shown in Figure 4. Similar to the effect of delay fiber, the longer the optic fiber acoustic pick-up is, the shorter period of interference light intensity and the higher sensitivity of photoacoustic detection are. As the length of optic fiber acoustic pick-up increases, the sound-pressure-detection range becomes narrower. When the sensing fiber length is 30 m, although the sensitivity is higher, the curve is close to the crest at 100 dB and the linearity of the response curve becomes poor. When the sensing fiber is 10 m, the sensitivity is lower. Considering the balance of sensitivity and detection range, 20 m sensing optic fiber is the best choice.
With the delay fiber is 2 km and optic fiber acoustic pick-up is 20 m, the influence of sound frequency and SPL on the interference light intensity is shown in Figure 5. When the sound frequency is 5000 Hz and the SPL is 50−100 dB, the relationship between interference light intensity and sound pressure will remain near linearity and there is no interference crest point in the sound-pressure range, which means there is no blind hearing problem. These results show that the designed system can be used as a sensor for sound detection with frequency 5000 Hz and SPL 50−100 dB.

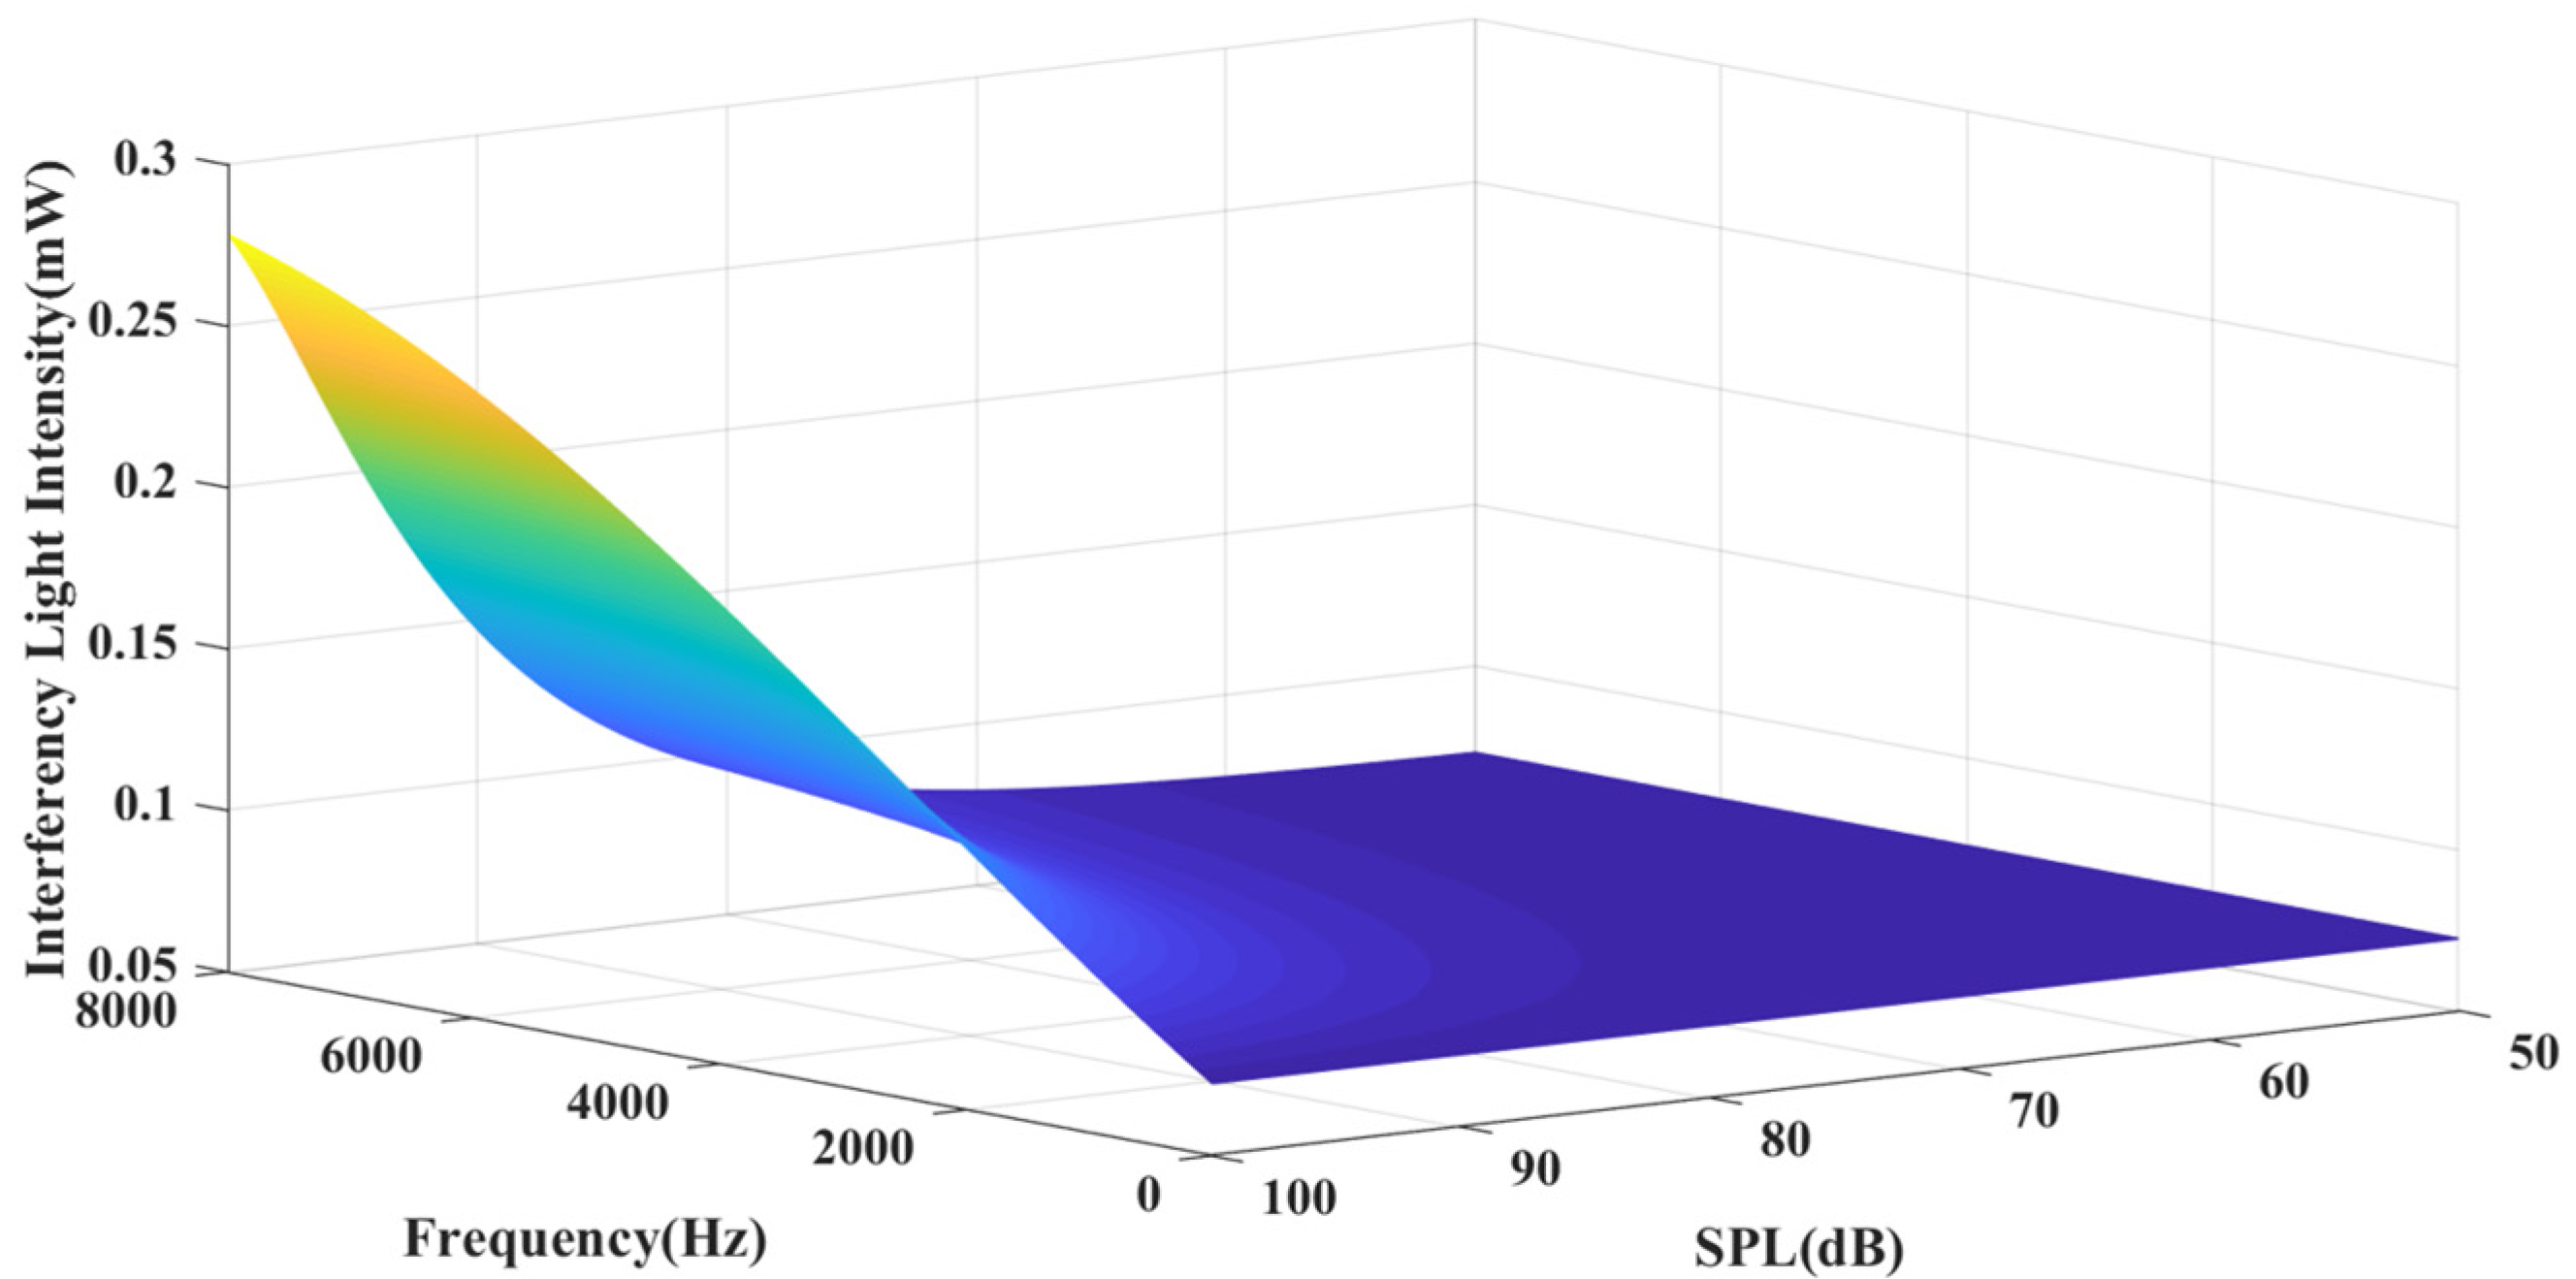
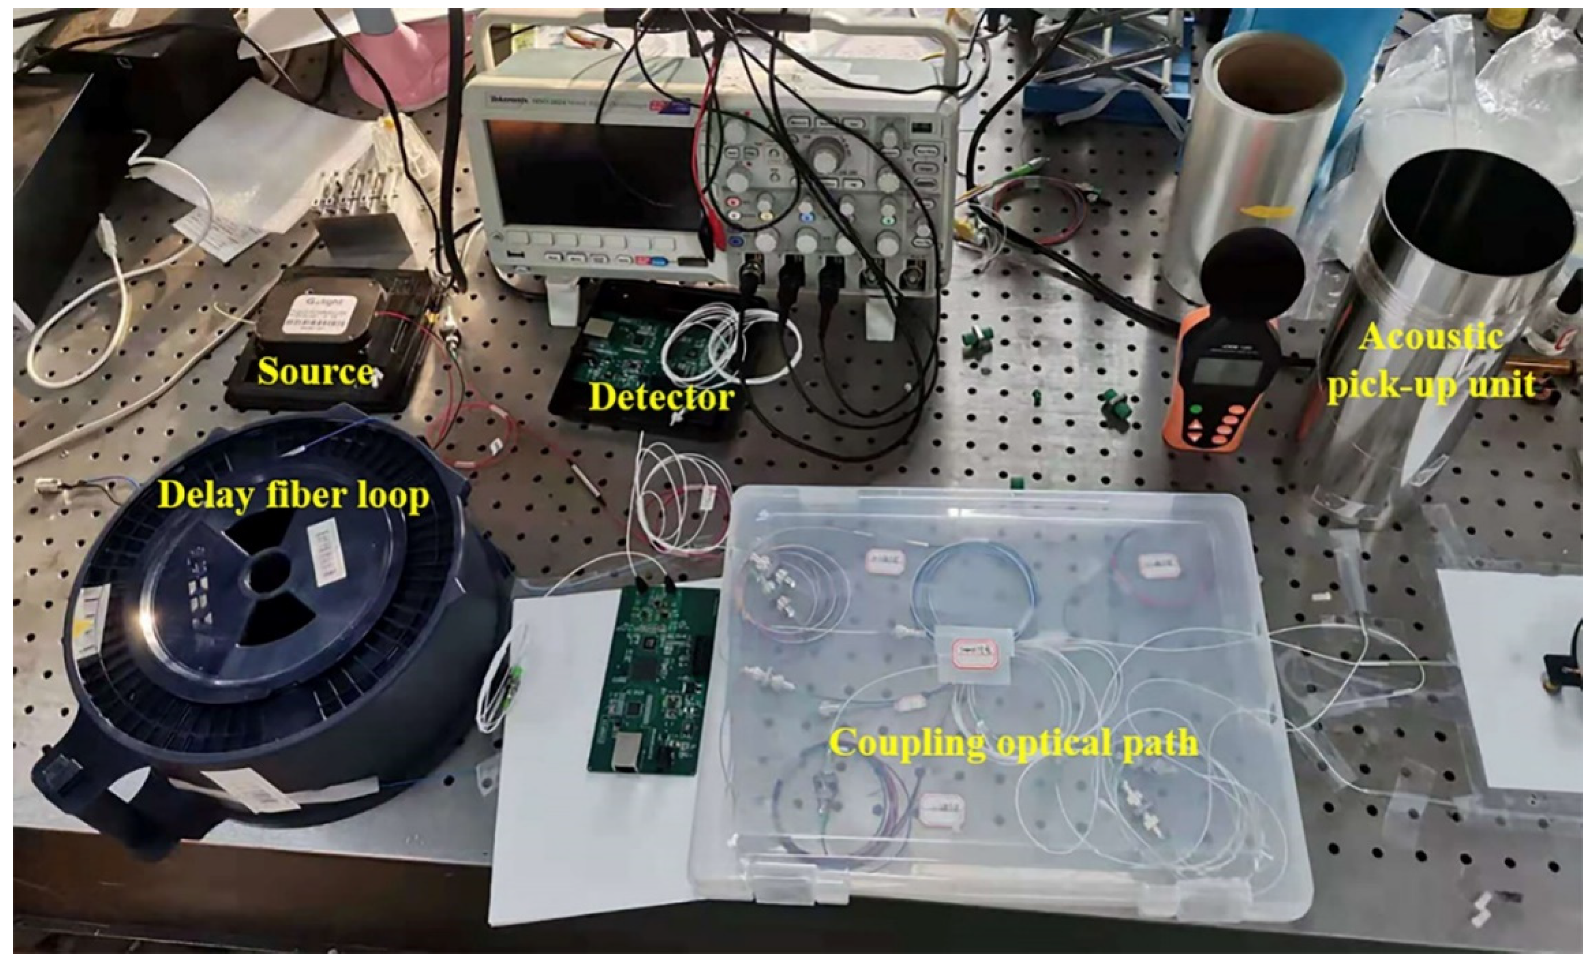
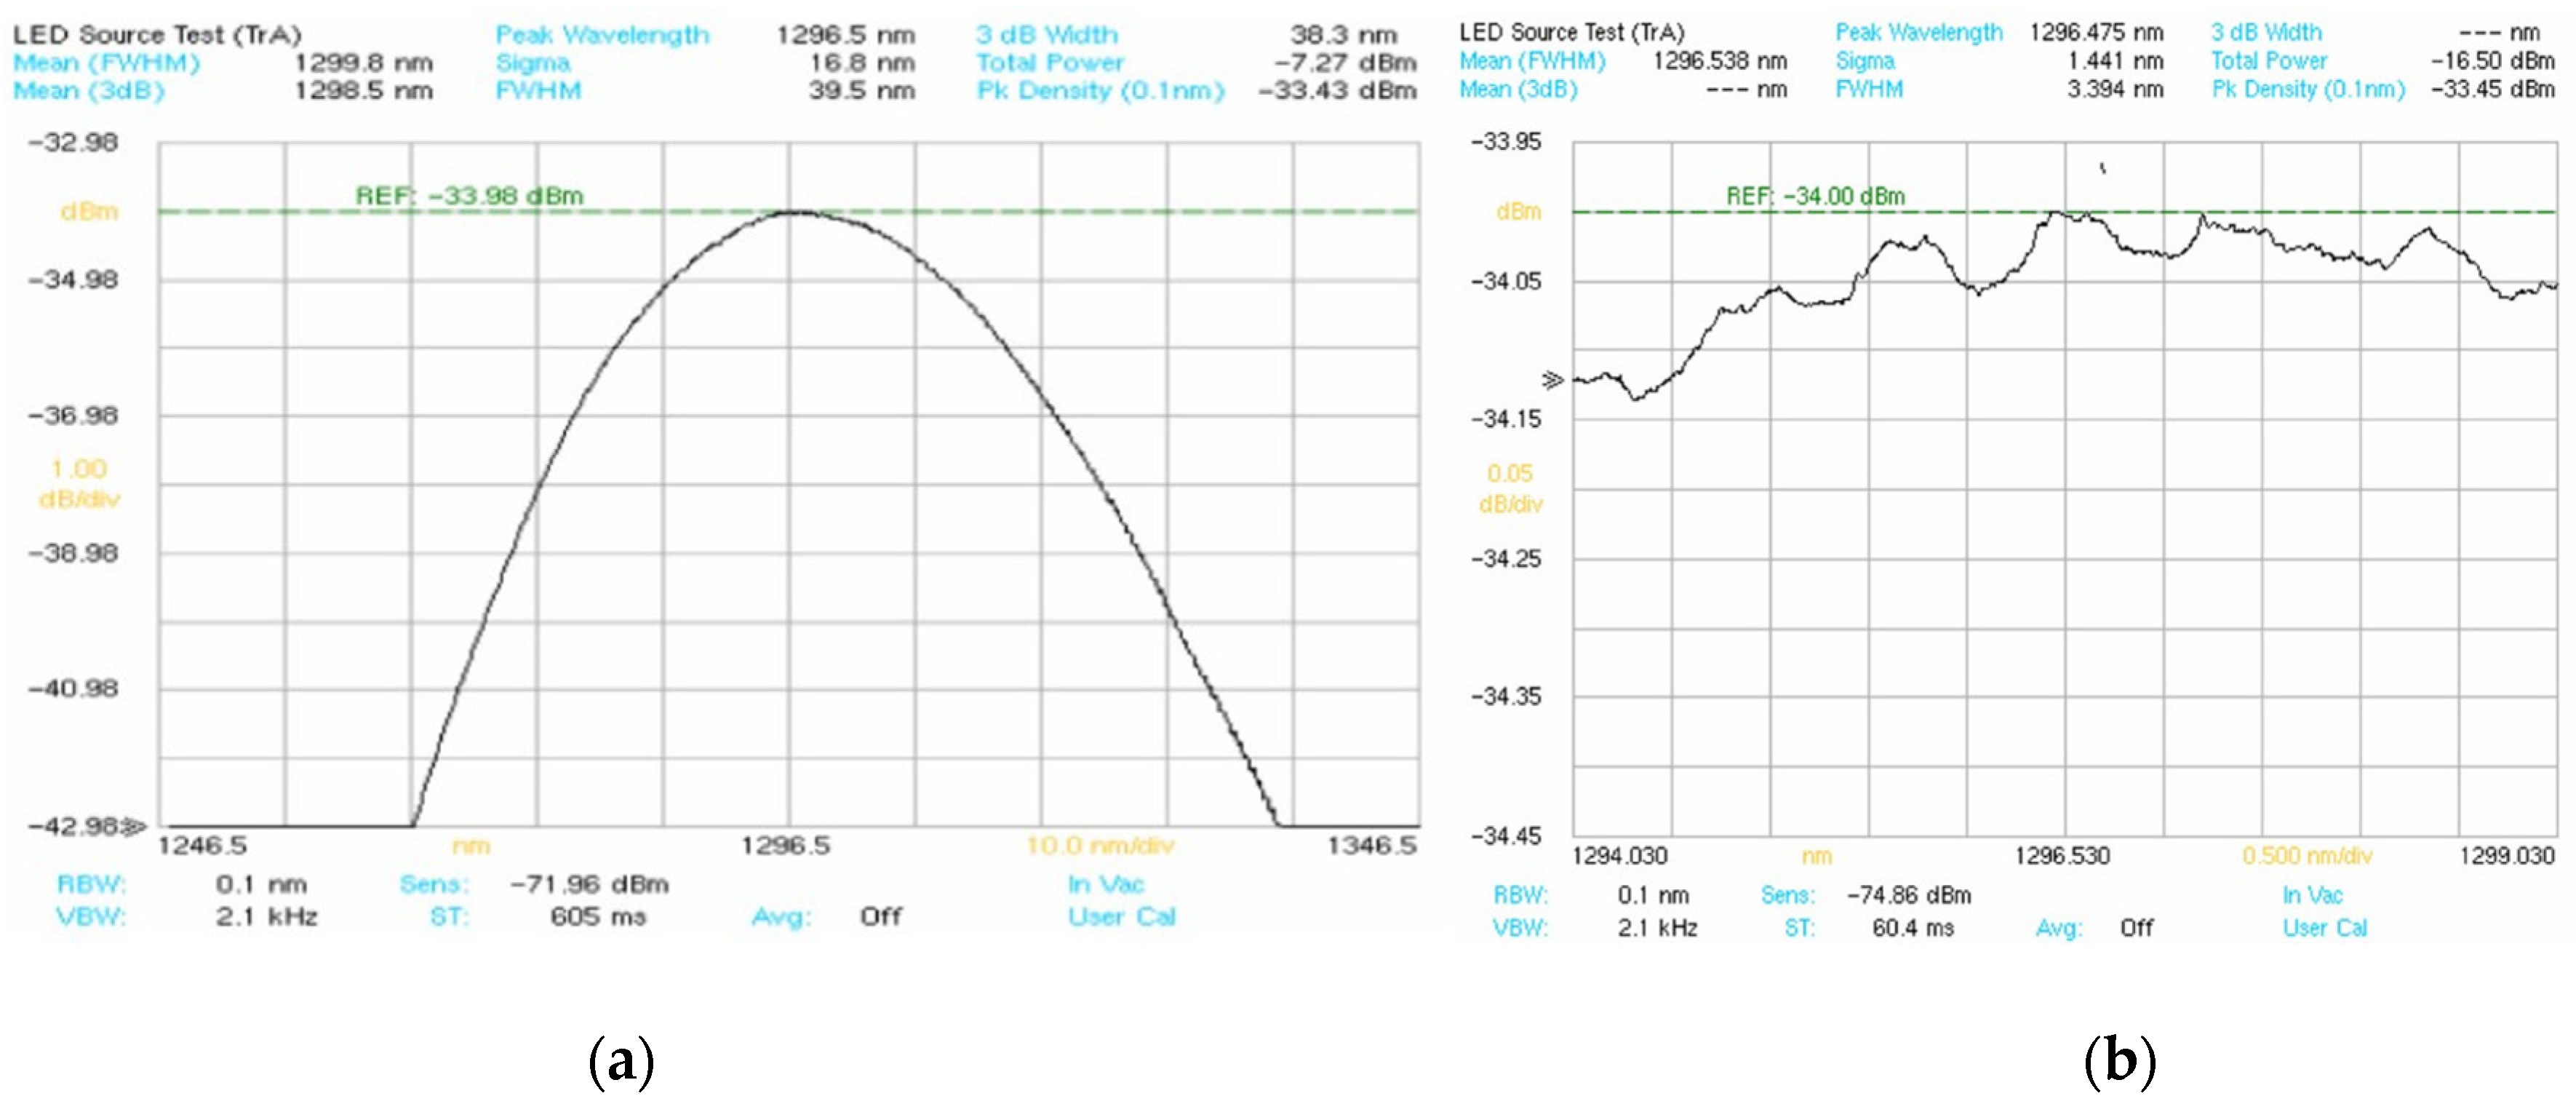
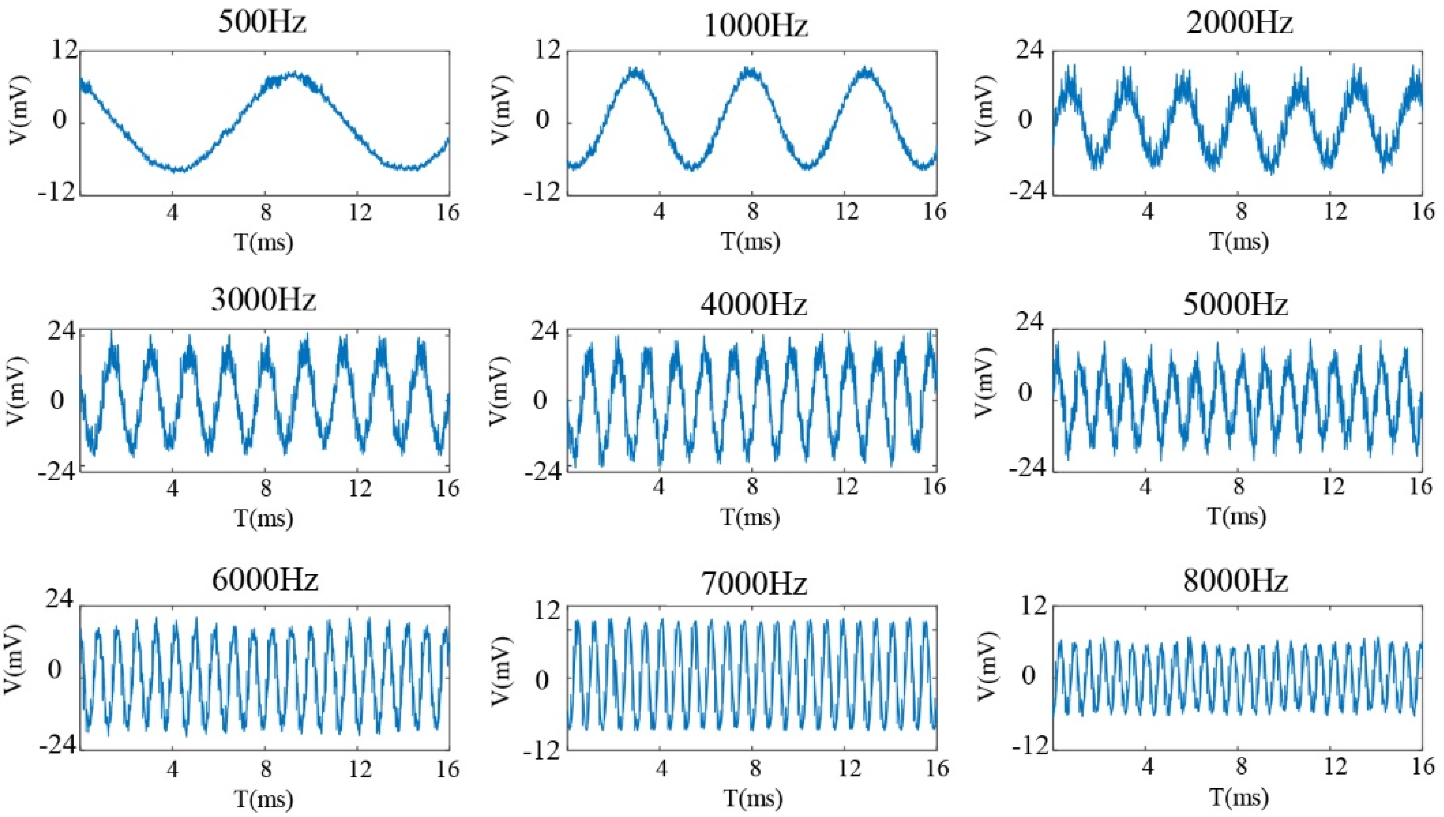
3. Experiments and Discussions

Figure 6 shows the experimental setup of the acoustic sensing system. An SLD (GR1346Q-A, made by the 44th Research Institute of CETC) was used as the light source. An InGaAs detector (GT322D, made by the 44th Research Institute of CETC) was used as the photoelectric detector (PD) in the testing system. The delay fiber used a single-mode silica fiber with a length of 2000 ± 5 m. The optic fiber acoustic pick-up was composed of titanium alloy cylinders and tightly wound single-mode silica optical fiber and the length of the sensing fiber was 20 ± 0.3 m. The interference signal acquisition and processing were finished by preprocessing circuit and LabView platform. The main parameters of SLD, PD, and DAQ (Data Acquisition) are shown in Table 1 and the spectrum of the source is shown in Figure 7.
The response curves under different frequencies were tested. A 70 dB sinusoidal acoustical signal was used as an acoustic source, and the sampling frequency was set as 50 MHz. The audio signal frequencies firstly change between 500 and 8000 Hz, and the sampling time was 16 ms which ensures that signals of different frequencies are fully displayed. As shown in Figure 8, because the resonance frequency of the titanium alloy cylinder is about 4000 Hz, the optic acoustic sensing system has a good response to 500−8000 Hz acoustical signals, especially at 2000−6000 Hz, which covers the main frequency domain of the mechanical vehicles; the maximum output signal peak-to-peak response reaches 47.65 mV. The test results show that the frequency differences can be distinguished clearly from the curve, which means the different sounds are expected to be recognized from the output.
The lower limit of frequency response was tested. Figure 9 shows that the frequency difference between 50 Hz and 100 Hz can be distinguished, but the curve of 20 Hz becomes indiscernible.
All of the test results show that when the sound-pressure level is 70 dB, the peak-to-peak response of the sensing system to the pure sinusoidal acoustical signal of 50−8000 Hz is between 6.29 and 50.35 mV, and the interferential curve of the sound signal of different frequencies can be well distinguishable. The results also show that the response of the system under 50 Hz is very poor. The main reason is that the resonance frequency of the titanium alloy cylinder is about 4000 Hz, and when sound frequency is less than 50 Hz, the vibration of the titanium alloy cylinder becomes very weak. When the frequencies are more than 8000 Hz, the same problem will also appear on the system. However, in the application conditions of this paper, the frequencies of the military motor vehicles, armored cars, and unmanned aerial vehicles are often between 500 and 8000 Hz, so the system can meet application requirements well.
A test of the sensitivity of the sensing system was finished. An audio signal from a small-scale helicopter was used as the signal source and the SPL changed between 50 and 95 dB. The responding curve of the different SPL is tested and the statistical results of the test data are shown in Table 2. As shown in Figure 10, the test curve is matched with the simulation results, which are shown in Figure 3, Figure 4 and Figure 5.
As shown in Figure 11, the relationship between sound pressure and the output voltage was acquired, and the fitting curve was obtained using the least-square method. The equation of the fitting curve is
V = 30.67 × P + 1.64
where V is the output voltage of the sensing system and P is the sound pressure of the acoustical signal. The fitted equation shows that the equivalent output voltage varies linearly with the sound pressure, and the sensitivity of sound pressure detection is 30.67 mV/Pa in the linear responding region. The experimental results show that the system can accurately reflect the change in sound intensity, and the experimental results are in good agreement with the simulation results. The system has an application prospect in sound detection in harsh environments, such as no man’s borderline.

4. Conclusions

In summary, a straight-line-type Sagnac fiber optic acoustic sensing system based on the Sagnac interference loop was proposed, which is utilized for sound detection and recognition of invading mechanical vehicles in harsh environments, such as the plateau borderline. The suitable lengths of delay fiber and sensing fiber were decided by theoretical calculation and simulation. In the experiment setup, the sensing fiber was tightly wound with titanium alloy cylinders to work as the acoustic sensing element. The test results show that the sensing system has a good response to the 50−8000 Hz acoustical signal at 70 dB and the acoustical signal can be distinguished by the interference curve. However, since the resonance frequency of the elastomer cylinder is around 4000 Hz, the system has a weak response to the acoustic signal, lower than 50 Hz and higher than 8000 Hz. When a small-scale helicopter audio signal is used as the signal source, the sensing system has a good response in 50−100 dB, the output voltage varies linearly with sound pressure, and the sensitivity of sound pressure detection reaches 30.67 mV/Pa. The straight-line-type Sagnac fiber optic acoustic sensing system has obviously shortened the length of the Sagnac interference fiber loop and provides an available method for noise monitoring, perimeter security, and nondestructive monitoring. This work aimed to be applied on sound detection and identification in harsh work environments.

Author Contributions

Conceptualization, J.W. and J.C.; methodology, N.W. and J.C.; software, J.W. and R.T.; validation, J.W., J.C. and N.W.; formal analysis, J.C. and R.T.; investigation, J.R.; resources, Y.Z.; data curation, J.W. and R.T.; writing—original draft preparation, J.W. and R.T.; writing—review and editing, J.C. and J.Z.; visualization, J.W. and R.T.; supervision, Y.Z.; project administration, Y.Z.; funding acquisition, N.W. and J.C. All authors have read and agreed to the published version of the manuscript.

Funding

This research was funded by the National Natural Science Foundation of China, grant number 51875067 and “Sichuan Science and Technology Program, grant number 2021yj0541”.

Institutional Review Board Statement

Not applicable.

Informed Consent Statement

Not applicable.

Data Availability Statement

Not applicable.

Conflicts of Interest

The authors declare no conflict of interest.

References

  1. Gorshkov, B.G.; Yüksel, K.; Fotiadi, A.A.; Wuilpart, M.; Korobko, D.A.; Zhirnov, A.A.; Stepanov, K.V.; Turov, A.T.; Konstantinov, Y.A.; Lobach, I.A. Scientific Applications of Distributed Acoustic Sensing: State-of-the-Art Review and Perspective. Sensors 2022, 22, 1033. [Google Scholar] [CrossRef] [PubMed]
  2. He, Z.; Liu, Q. Optical Fiber Distributed Acoustic Sensors: A Review. J. Light. Technol. 2021, 39, 3671–3686. [Google Scholar] [CrossRef]
  3. Sun, Y.; Li, H.; Fan, C.; Yan, B.; Chen, J.; Yan, Z.; Sun, Q. Review of a Specialty Fiber for Distributed Acoustic Sensing Technology. Photonics 2022, 9, 277. [Google Scholar] [CrossRef]
  4. Pan, C.; Liu, X.; Zhu, H.; Shan, X.; Sun, X. Distributed optical fiber vibration sensor based on Sagnac interference in conjunction with OTDR. Optics Express 2017, 25, 20056–20070. [Google Scholar] [CrossRef] [PubMed]
  5. Tang, J.; Cai, L.; Li, C.; Yang, M.; Guo, H.; Gan, W. Distributed acoustic sensors with wide frequency response based on UWFBG array utilizing dual-pulse detection. Opt. Fiber Technol. 2021, 61, 102452. [Google Scholar] [CrossRef]
  6. Chen, Z.; He, J.; Xu, X.; He, J.; Xu, B.; Du, B.; Liao, C.; Wang, Y. High-Temperature Sensor Array Based on Fiber Bragg Gratings Fabricated by Femtosecond Laser Point-by-Point Method. Acta Opt. Sin. 2021, 41, 1306002. [Google Scholar]
  7. Lalam, N.; Westbrook, P.S.; Li, J.; Lu, P.; Buric, M.P. Phase-Sensitive Optical Time Domain Reflectometry with Rayleigh Enhanced Optical Fiber. IEEE Access 2021, 9, 114428–114434. [Google Scholar] [CrossRef]
  8. Ma, F.; Wang, X.; Wang, Y.; Zhu, R.; Yuan, Z.; Wang, P.; Yu, J.; Song, N. An improved device and demodulation method for fiber-optic distributed acoustic sensor based on homodyne detection. Opt. Fiber Technol. 2022, 71, 102925. [Google Scholar] [CrossRef]
  9. Wang, J.; Zhao, J.; Wang, J.; Wan, H.; Zhang, Z. A multi-frequency fiber optic acoustic sensor based on graphene-oxide Fabry-Perot microcavity. Opt. Fiber Technol. 2021, 65, 102607. [Google Scholar] [CrossRef]
  10. Yu, F.; Li, Z.; Okabe, Y. Application of a remotely bonded fiber-optic Bragg grating sensor to acoustic emission testing for a carbon-carbon composite at a temperature of 1000 °C. Measurement 2022, 203, 111908. [Google Scholar] [CrossRef]
  11. Moradi, H.; Parvin, P.; Ojaghloo, A.; Shahi, F. Ultrasensitive fiber optic Fabry Pérot acoustic sensor using phase detection. Measurement 2021, 172, 108953. [Google Scholar] [CrossRef]
  12. Stepanova, L.N.; Kabanov, S.I.; Chernova, V.V. Locating Acoustic Emission Signals Due to Shock Impacts on a Carbon Fiber Sample Using Piezoelectric and Fiber Optic Sensors. Russ. J. Nondestruct. Test 2022, 58, 237–247. [Google Scholar] [CrossRef]
  13. Kislov, K.V.; Gravirov, V.V. Distributed Acoustic Sensing: A New Tool or a New Paradigm. Seism. Instr. 2022, 58, 485–508. [Google Scholar] [CrossRef]
  14. Titov, S.A.; Machikhin, A.S.; Pozhar, V.E.; Bulatov, M.F. Study of the Ultrasonic Field in an Acousto-Optic Crystal Using Acoustic Methods. J. Commun. Technol. Electron. 2022, 67, 1443–1449. [Google Scholar] [CrossRef]
  15. Ma, J.; He, Y.; Bai, X.; Sun, L.P.; Chen, K.; Oh, K.; Guan, B.O. Flexible microbubble-based Fabry–Pérot cavity for sensitive ultrasound detection and wide-view photoacoustic imaging. Photon. Res. 2020, 8, 1558–1565. [Google Scholar] [CrossRef]
  16. Gao, X.K.; Ning, T.G.; Zhang, C.B.; Xu, J.; Zheng, J.J.; Lin, H.; Li, J.; Pei, L.; You, H.D. A dual-parameter fiber sensor based on few-mode fiber and fiber Bragg grating for strain and temperature sensing. Opt. Commun. 2020, 454, 124441. [Google Scholar] [CrossRef]
  17. Xia, P.; Tan, Y.G.; Li, T.L.; Zhou, Z.D.; Lv, W.Q. A high-temperature resistant photonic crystal fiber sensor with single-side sliding Fabry-Perot cavity for super-large strain measurement. Sens. Actuator A-Phys. 2021, 318, 112492. [Google Scholar] [CrossRef]
  18. Sun, L.P.; Yuan, Z.; Huang, T.; Sun, Z.; Lin, W.; Huang, Y.; Xiao, P.; Yang, M.; Li, J.; Bai-Ou Guan, B.-O. Ultrasensitive sensing in air based on Sagnac interferometer working at group birefringence turning point. Opt. Express 2019, 27, 29501–29509. [Google Scholar] [CrossRef] [PubMed]
  19. Marin, J.M.; Ashry, I.; Alkhazragi, O.; Trichili, A.; Ng, T.K.; Ooi, B.S. Simultaneous distributed acoustic sensing and communication over a two-mode fiber. Opt. Lett. 2022, 47, 6321–6324. [Google Scholar] [CrossRef] [PubMed]
  20. Chen, J.; Wang, J.; Wang, N.; Ruan, J.; Zhang, J.; Zhu, Y. An Improved Acoustic Pick-Up for Straight Line-Type Sagnac Fiber Optic Acoustic Sensing System. Sensors 2022, 22, 8193. [Google Scholar] [CrossRef] [PubMed]
Figure 1. A schematic diagram of traditional Sagnac fiber optic acoustic sensor.
Photonics 10 00083 g001
Figure 2. A schematic diagram of straight-line-type Sagnac fiber optic acoustic sensor.
Photonics 10 00083 g002
Figure 3. The influence of delay fiber length.
Photonics 10 00083 g003
Figure 4. The influence of optic fiber acoustic pick-up length.
Photonics 10 00083 g004
Figure 5. The simulation result of the straight-line-type Sagnac fiber optic acoustic sensor.
Photonics 10 00083 g005
Figure 6. A photo of the testing system.
Photonics 10 00083 g006
Figure 7. The tested spectrum of the source: (a) spectrum curve, (b) wavy curve around the central wavelength.
Photonics 10 00083 g007
Figure 8. The responding curve of the sensing system to acoustical signals of 500−8000 Hz.
Photonics 10 00083 g008
Figure 9. The responding curve of the sensor to acoustical signals of 100, 50, and 20 Hz.
Photonics 10 00083 g009
Figure 10. The response curve of SPL and output voltage.
Photonics 10 00083 g010
Figure 11. The test curve of sound pressure and output voltage.
Photonics 10 00083 g011
Table 1. The main parameters of the experiment setup.
SLDPDDAQ
Model: GR1346Q-A
Central wavelength: 1296.5 nm
Radiation power, ≥1 mW
FWHM:Typ = 35 nm
model: GT322D
Spectral Response Range:900–1700 nm
Responsivity: 0.7 A/w at 1310 nm
−3 dB bandwidth: ≥1500 MHz
Type: UDP communication
Sampling Frequency:50 MHz
Sampling Time: 16 ms
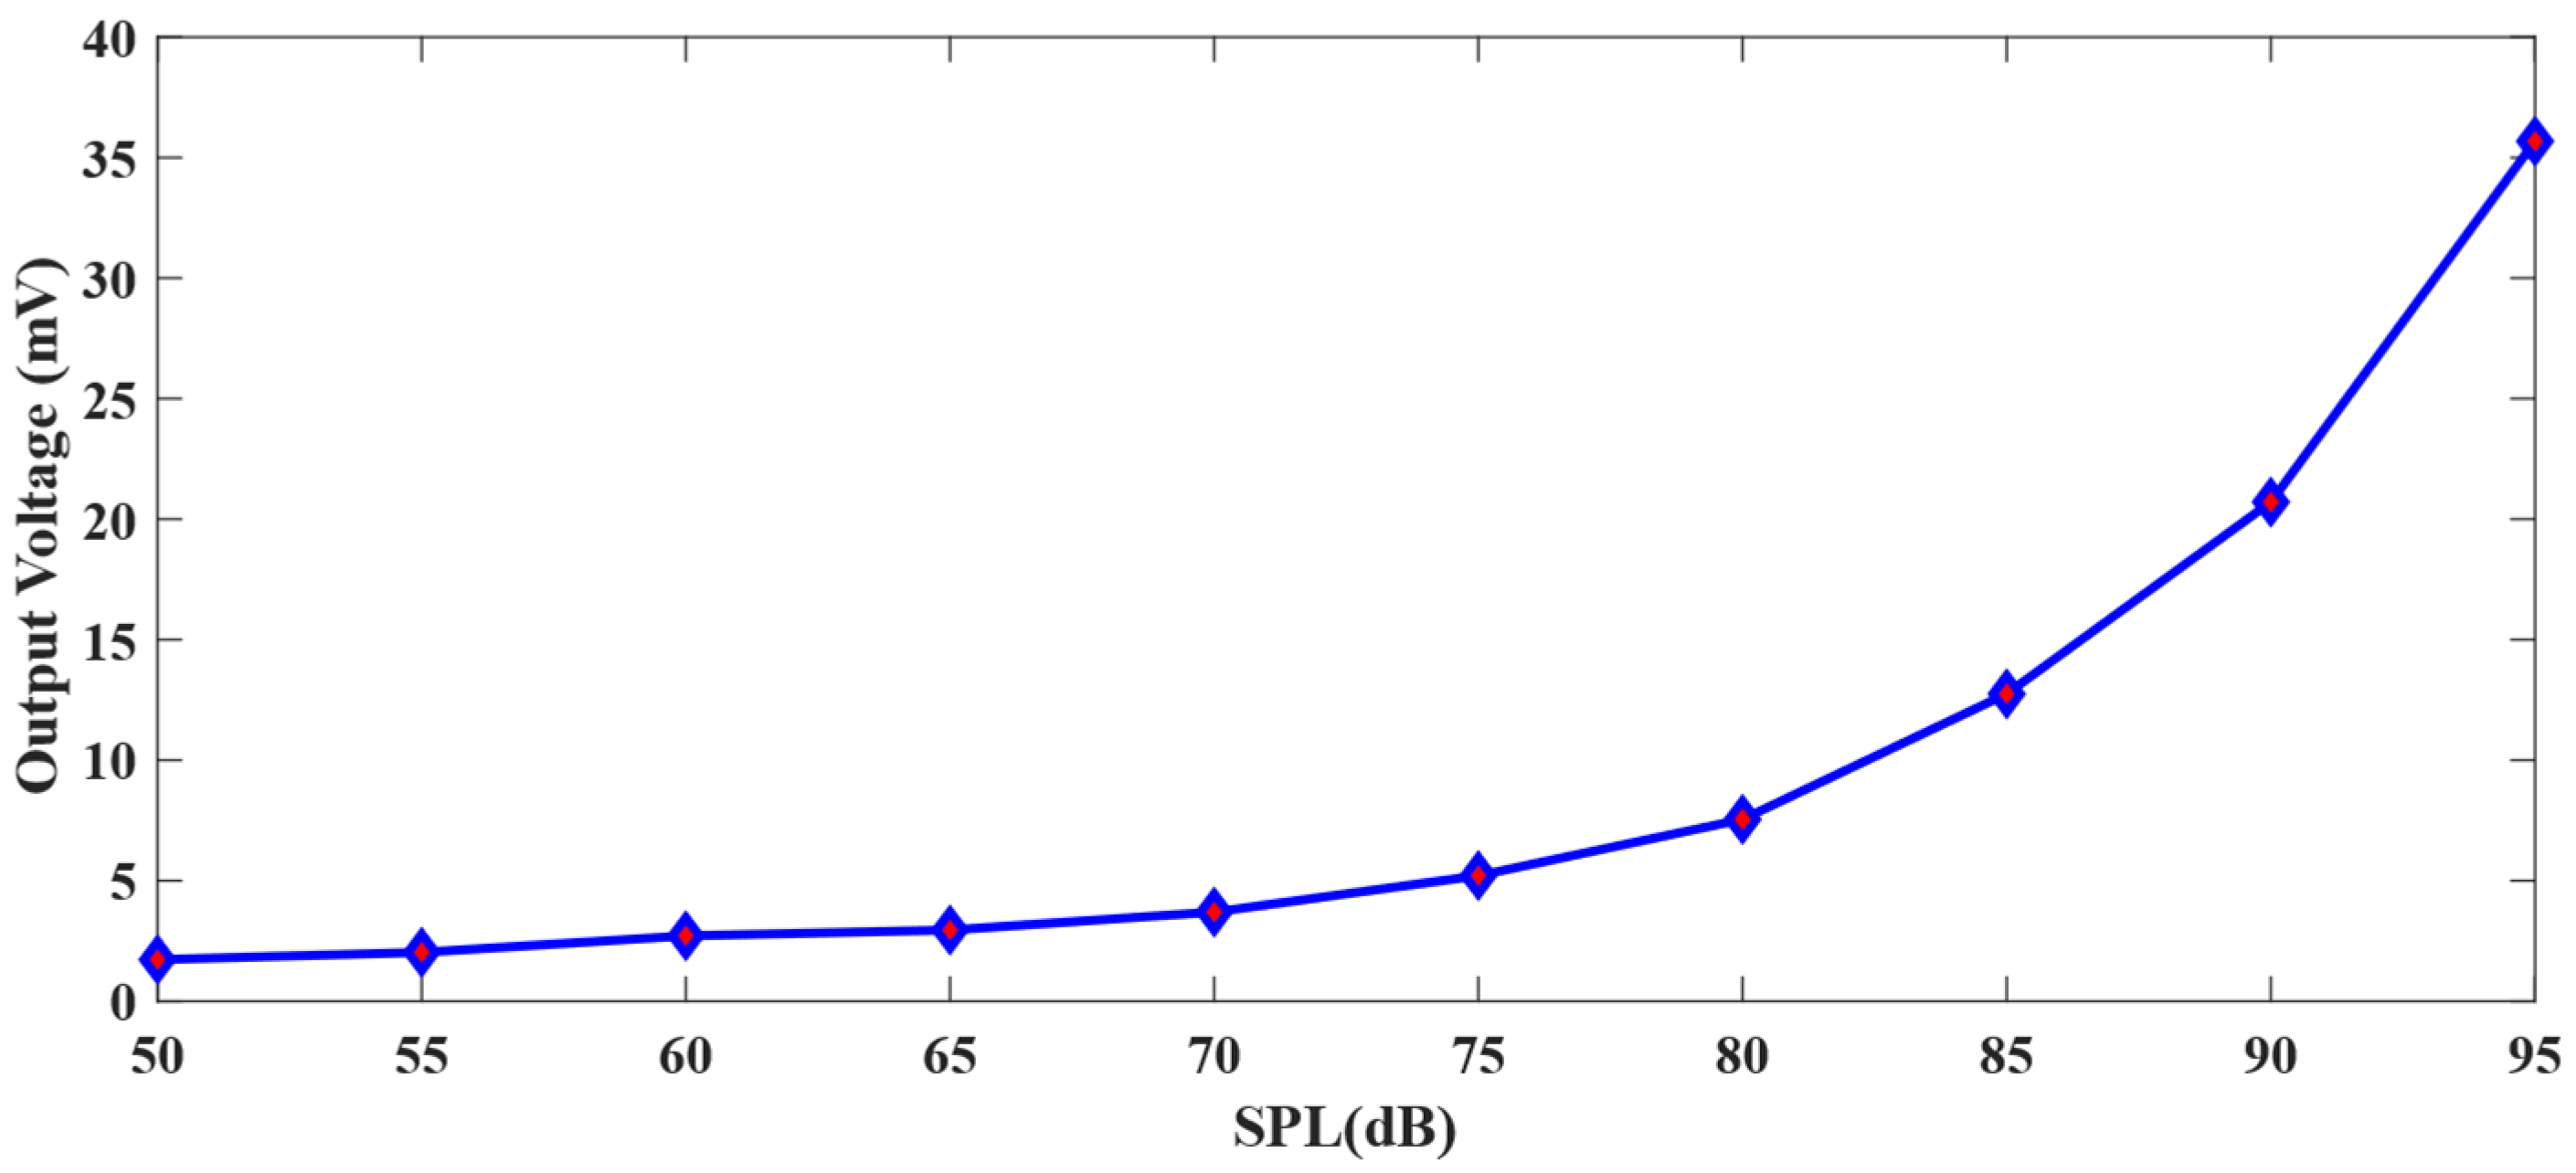
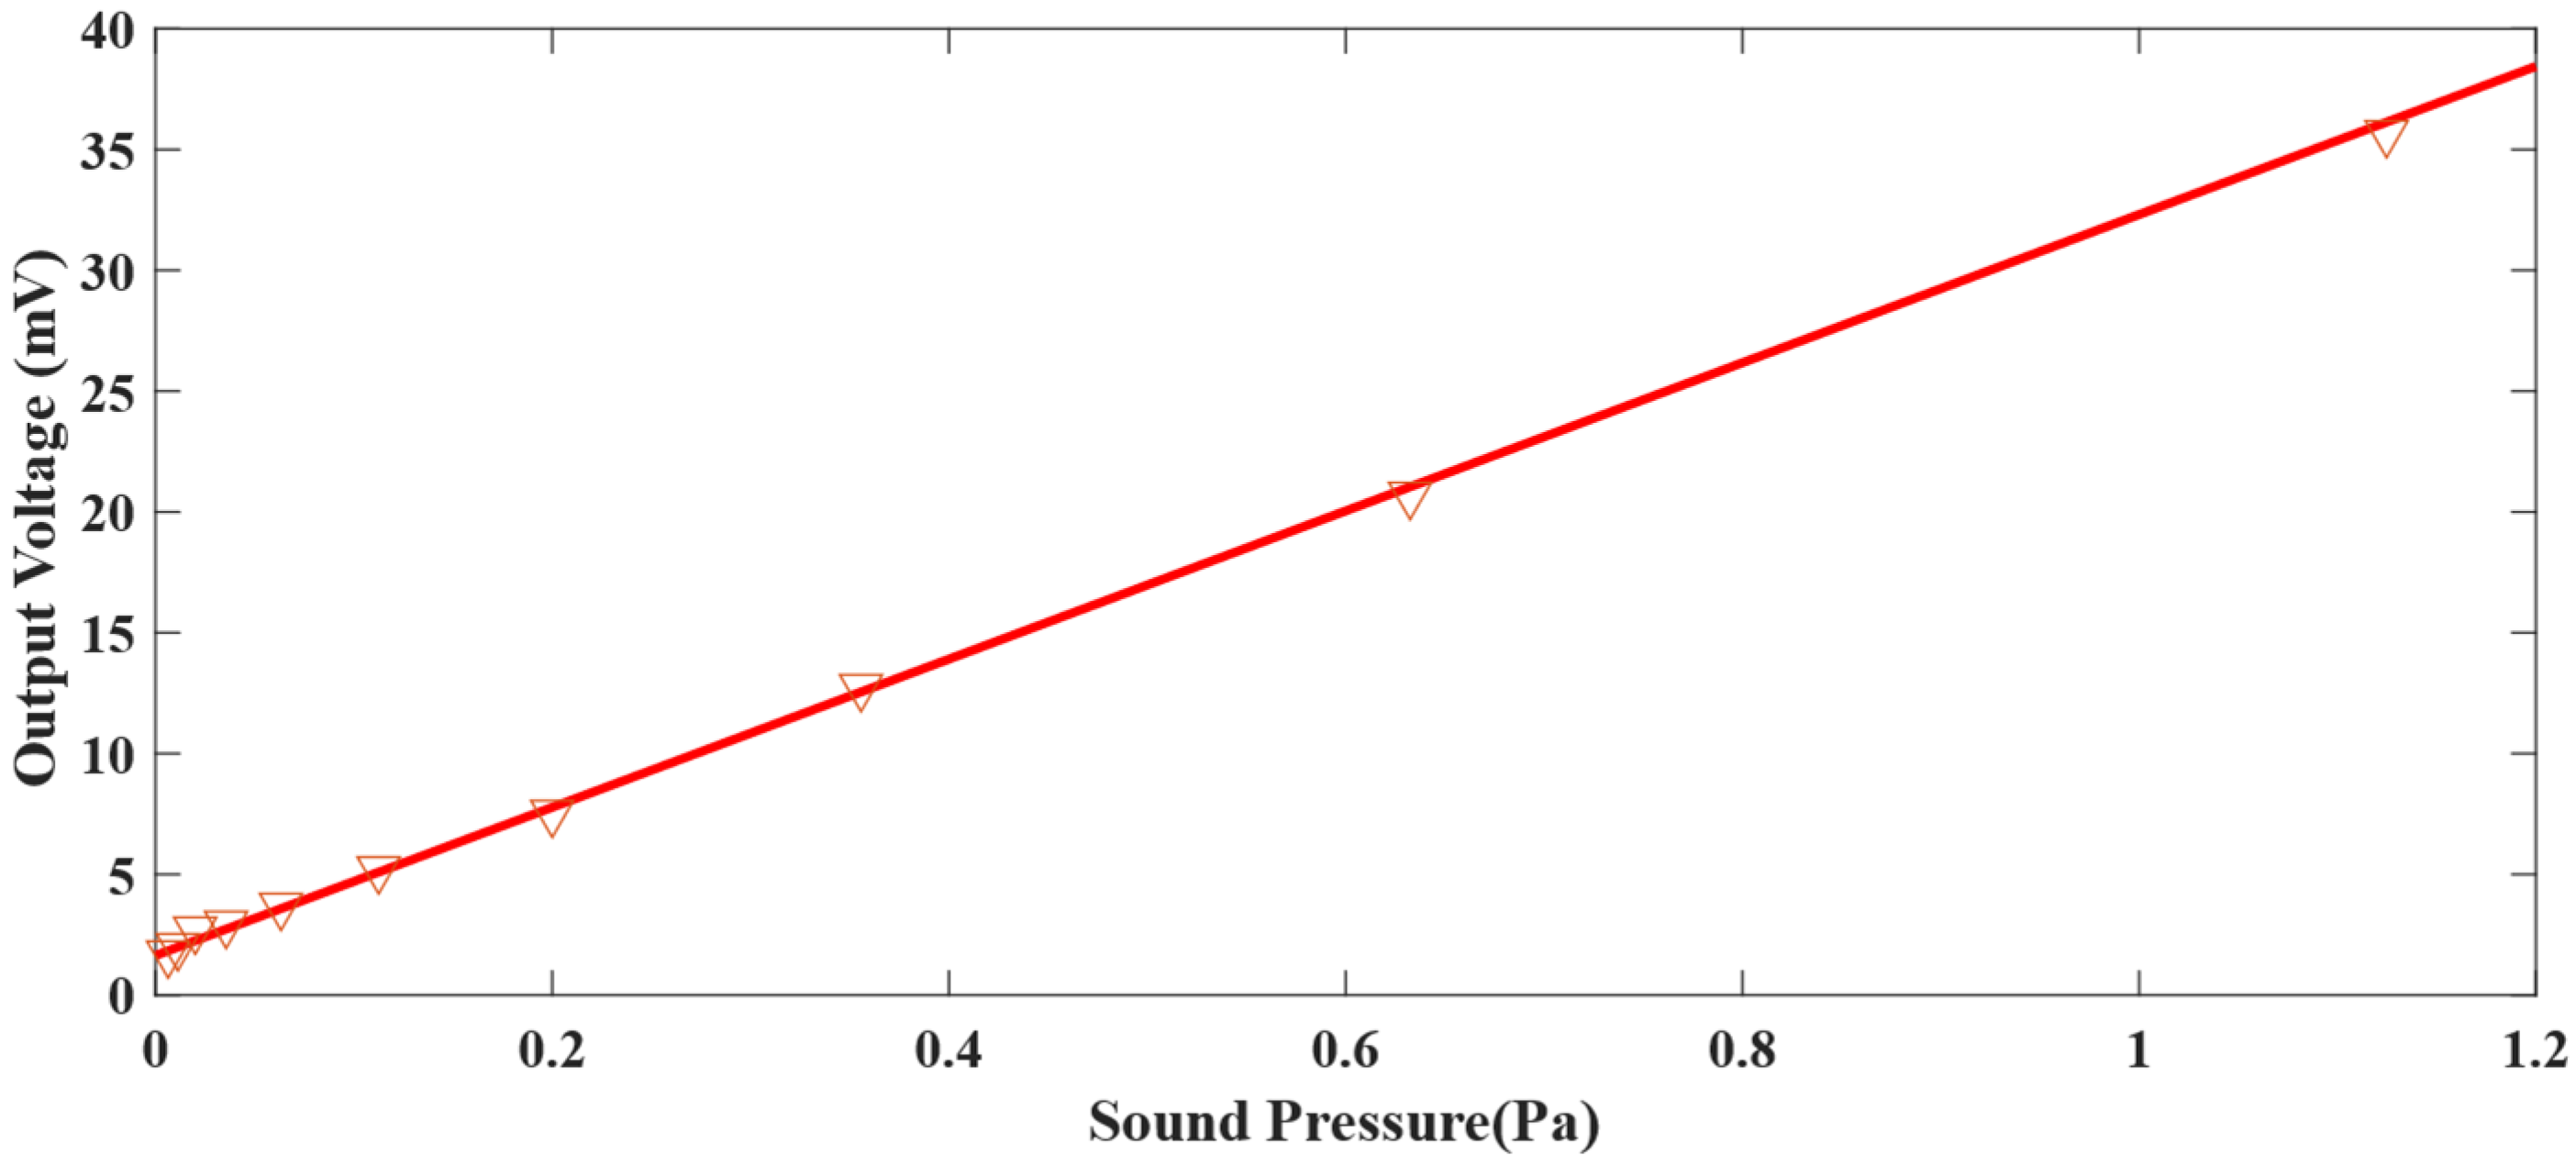
Table 2. Statistical table of the system response to sound data under different decibels.
SPL(dB)50556065707580859095
Sound Pressure (Pa)0.00630.0110.020.0360.0630.110.20.360.632
Data Points Number171201269293367517749126620563543
Output Voltage (mV)1.721.972.582.733.515.077.5412.5620.9935.87
Disclaimer/Publisher’s Note: The statements, opinions and data contained in all publications are solely those of the individual author(s) and contributor(s) and not of MDPI and/or the editor(s). MDPI and/or the editor(s) disclaim responsibility for any injury to people or property resulting from any ideas, methods, instructions or products referred to in the content.

