1. Introduction
With the large-scale development of modern industry, environmental problems and the energy crisis are becoming more and more serious. Volatile organic compounds (VOCs) are important atmospheric pollutants. VOCs have complex components and a wide range of sources [
1,
2]. VOCs come from anthropogenic emissions and natural emissions. In recent years, industrial emissions have accounted for an increasing proportion of VOCs [
3]. VOCs from industry generally have irritant and toxic effects, and are seriously harmful to human health [
4,
5]. They are also flammable and explosive, rendering production and transportation dangerous [
6,
7]. Although VOCs are generally harmful, they can be valuable. In petroleum refining, the organic chemical industry and other industries, VOCs contain a large number of recyclable light hydrocarbons, such as propylene and propane. Recycling hydrocarbons not only reduces environmental pollution, but also brings about economic benefits [
8]. Propylene and propane are rather extensively observed VOCs. Exploring them provides us with general information on VOCs. It is more suitable to choose propylene and propane over other light hydrocarbons, such as methane, which is too simple and, therefore, unsuitable as a general representative of VOCs.
Organic vapor membrane separation technology is a new type of VOC recovery technology. It is suitable for nearly all kinds of VOCs, and has the advantages of a high recovery rate, low energy consumption, no secondary pollution, etc. [
9,
10,
11,
12]. The VOC mixture first dissolves on the membrane surface at the feed side. The components adsorbed on the membrane surface diffuse through the membrane and desorb on the membrane surface at the permeation side. VOCs can penetrate the membrane and are enriched on the permeation side, while air and other gases that have difficulty penetrating the membrane are enriched on the feed side. As such, the mixtures are separated and purified using the technology [
13]
.Compact silicone rubber polydimethylsiloxane (PDMS) has been widely used for its high gas permeability. Sahin et al. [
14] separated organic vapor from N
2 by filling PDMS membranes with a zeolite imidazolate framework (ZIF). Gazic et al. [
15] prepared different polymer membranes to recover 1-ethyl-2-methylbenzene from aqueous solutions by pervaporation, and found that PDMS membranes had the highest total flux. Kim et al. [
16] prepared PDMS membranes with PEG-impregnated non-woven fabric as a support layer to separate VOCs mainly composed of toluene. Shi et al. [
17] used a PDMS composite membrane for the separation of C
3H
6 and N
2; they found that PDMS membranes can effectively separate C
3H
6 from N
2 and verified the feasibility of PDMS membranes for olefin recovery in polyolefin purge gas.
According to previous experimental results [
18], we know that C
3H
8 and C
3H
6 have a higher transport rate than N
2 in PDMS, though N
2 has a smaller volume than C
3H
8 and C
3H
6. To explain this unusual phenomenon, we need to explore gas transport in PDMS at the molecular level and obtain profound knowledge of this process. Molecular dynamics (MD) simulations have been widely used by researchers to explore such mechanisms at the molecular level. Liu et al. [
19] simulated the mass transfer process of furfural and water in polyether block amide (PEBA-2533) membranes, revealing the influence of membrane structure on selectivity at the molecular level. Pazirofteh et al. [
20] studied the structure, transport mechanism and properties of two polyether block amide membranes in the presence of functional nanoparticles using a molecular dynamics (MD) simulation and found that the simulation results were essentially consistent with the experimental results, proving that MD simulation yields rather precise results. Wang et al. [
21] studied the swelling behavior of PEBA -2533 membranes in aqueous solutions of phenol, aniline and furfural through experiments and MD simulation, and analyzed the effects of non-bond interaction energy and hydrogen bond number between water and high boiling point organic compound (HBOC) molecules on the swelling degree of PEBA-2533. Molecular simulation technology can be used not only to explore the dissolution and diffusion mechanism of permeation at the molecular level, but also to provide precise values for various macro physical property data. Therefore, we carried out MD simulations of gas transport in PDMS.
In this study, using BIOVIA Materials Studio (MS, Accelrys Software Inc. San Diego, USA), we simulated gas transport in PDMS membranes. The dissolution and diffusion properties of three different gases (C3H8, C3H6, and N2) were simulated and analyzed in the membranes at different temperatures. We were then able to ascertain the factors that lead to this unusual phenomenon. The differences in mass transfer processes between mixed gases and pure gases in PDMS membranes were also investigated. In addition, a series of properties, such as the free volume fraction, the cohesive energy density, the density field distribution and the adsorption energy distribution of the membranes, was also studied.
2. Models and Methods
The MD simulations were carried out using MS software. The COMPASS force field was used, the electrostatic interaction was calculated using the Ewald summation method and the van der Waals interaction, and the
Supplementary Materials (SM) was computed by selecting the “atom-based” option [
19,
21]. The structures of C
3H
8, C
3H
6, N
2 and the PDMS monomer were drawn by the “visualizer” module. Firstly, relaxation and optimization were performed on these structures. PDMS chains composed of 50 repeating monomers were constructed using the “homopolymer” module.
Then, the initial models of the membranes were established using the “amorphous cell” module. The lattice type was set as cubic, and the final density of the cell was set as 0.97 g/cm
3. The output was 10 cells. In order to prevent any interaction between the polymer chains, only one chain was placed in each cell, and the cells initially had a low density (0.1 g/cm
3). The cells with the lowest energy were selected for further optimization. Different gas molecules were loaded into PDMS cells to obtain simulation systems for each gas. A total of five gas molecules were put into each model. For the model of mixed gas, one N
2 molecule and four C
3 molecules were put into each system. Then, the “smart minimizer” method was used to minimize the system energy and relax the structures. For the minimization process, the convergence level was set to 0.001 kcal mol
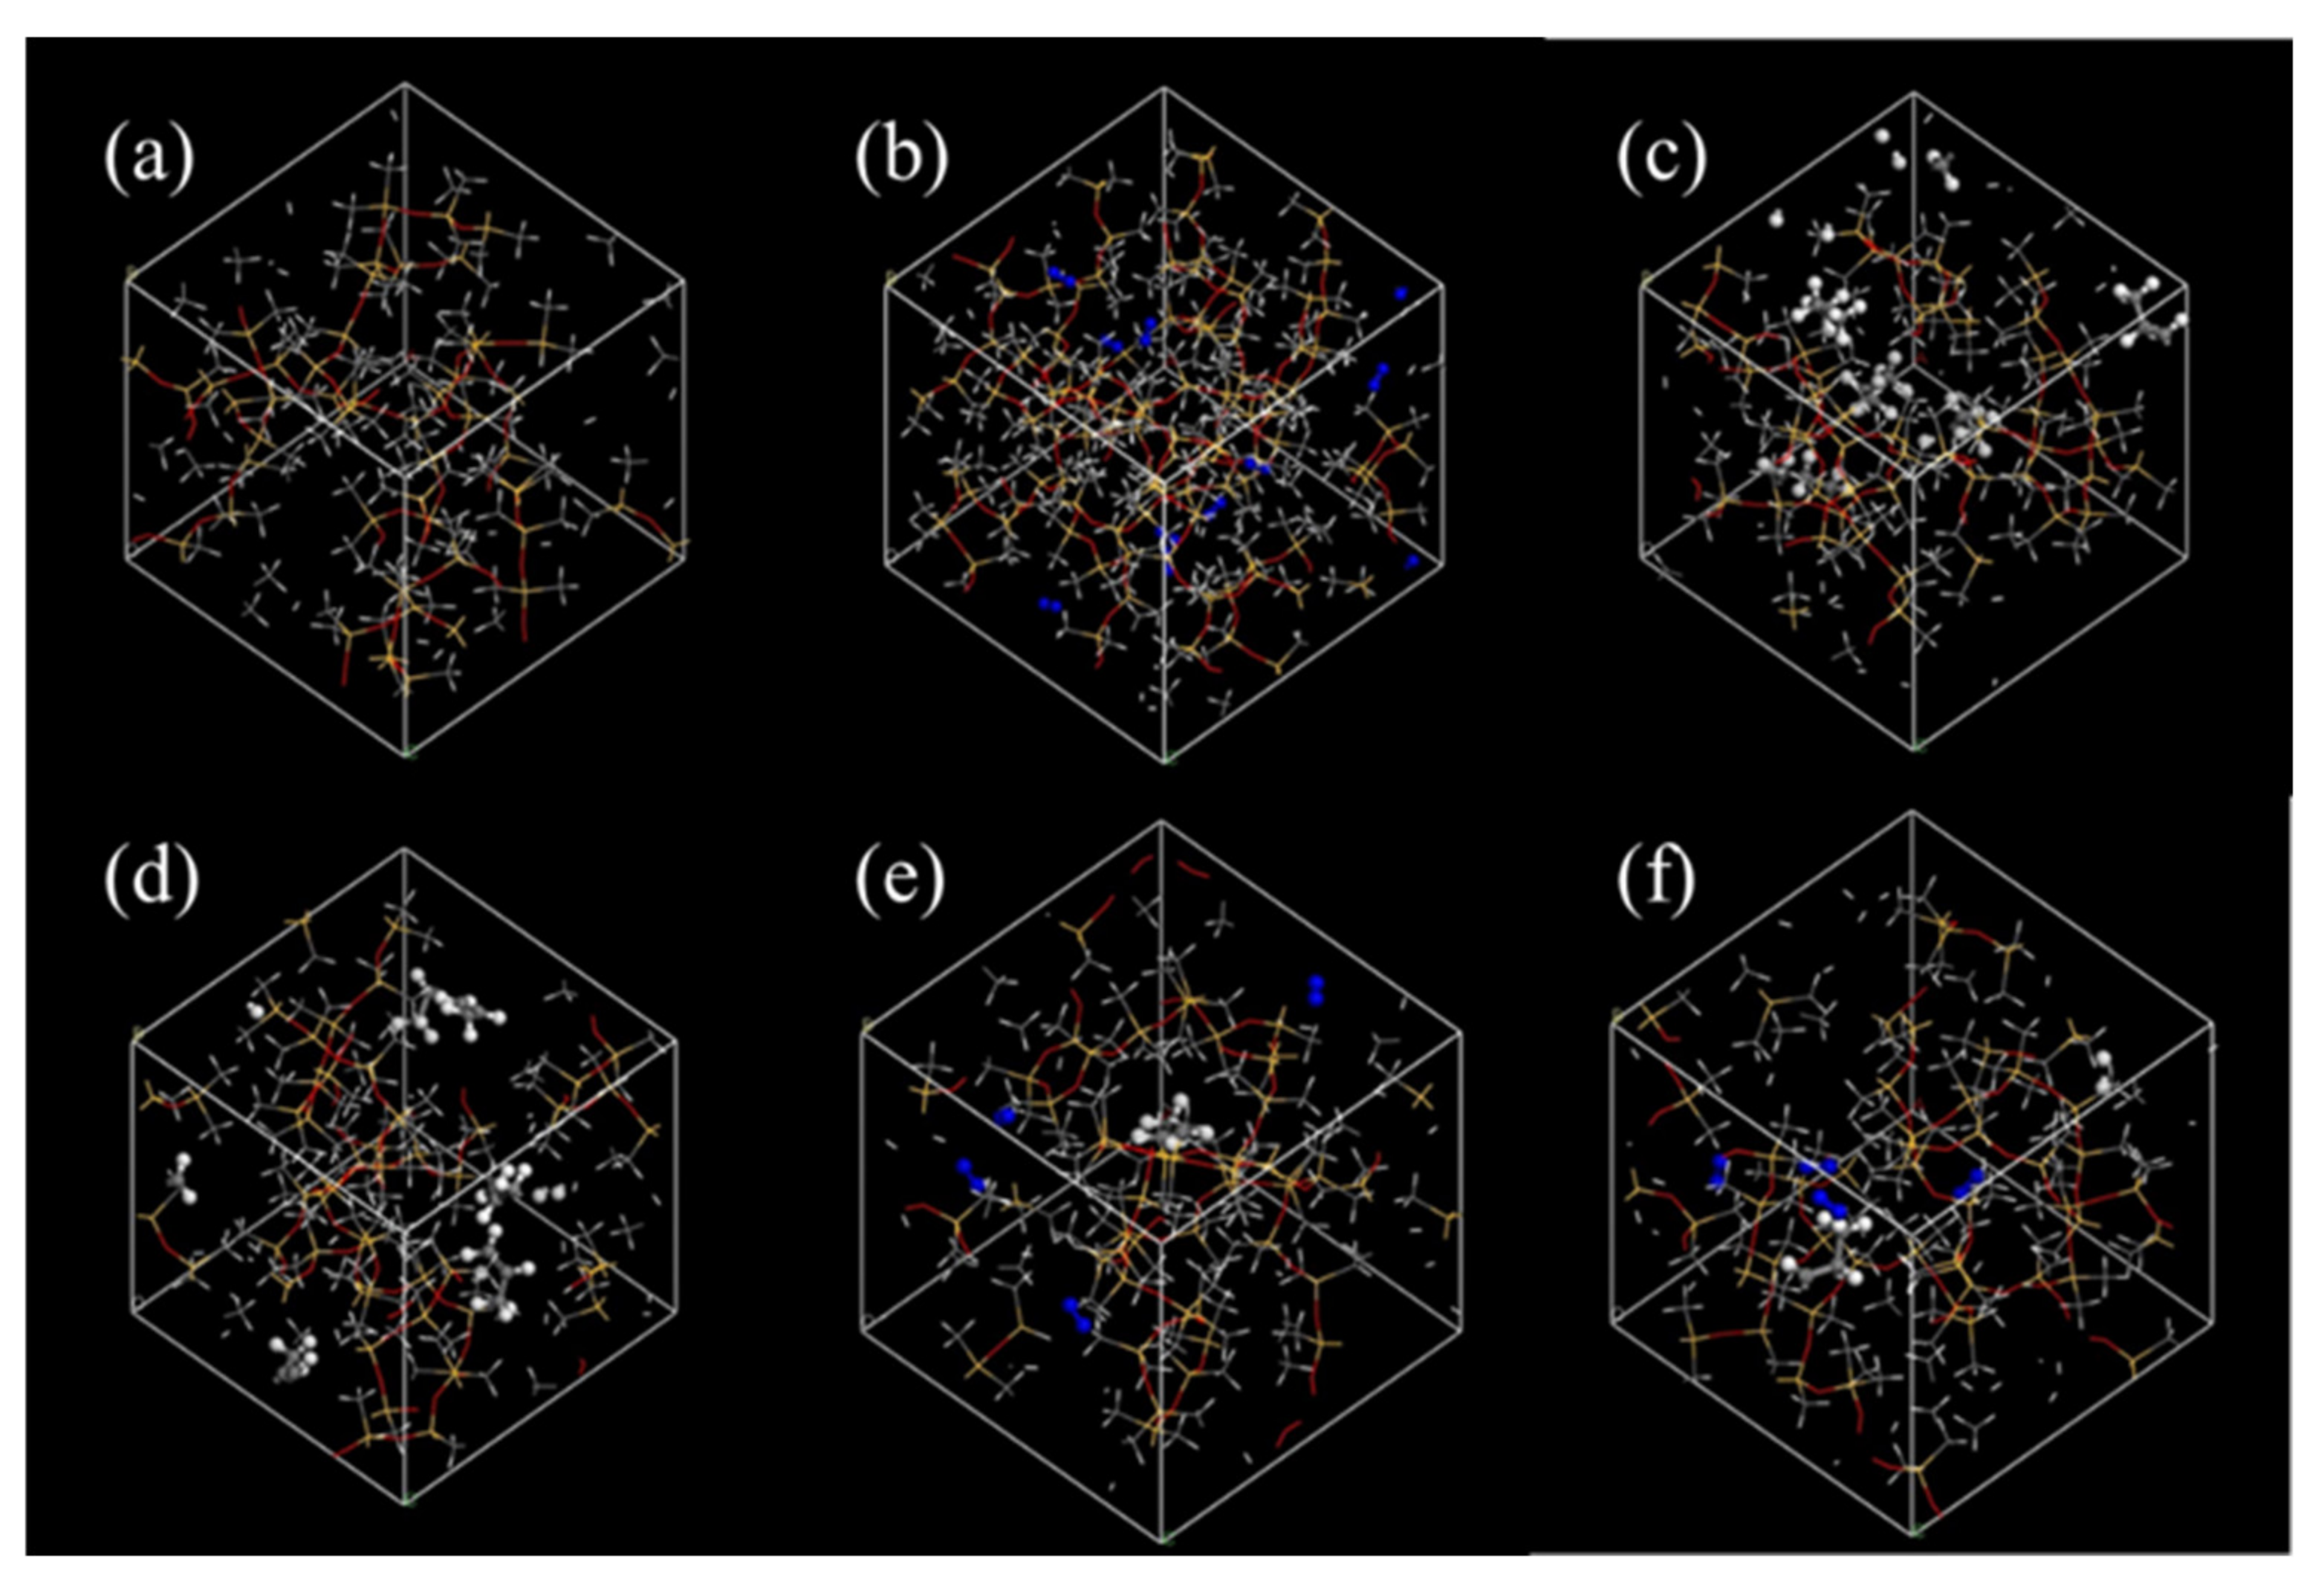
−1 Å. Afterwards, the cells were annealed in the “anneal” module, gradually heated from 200 K to 600 K, and then cooled to 200 K again. The process was repeated five times. With high-temperature relaxation, the distribution of holes was closer to that of the real material. Then, 100 ps MD simulations were performed successively in the NVT ensemble and the NPT ensemble at 298 K for the final optimization. The structures of the membrane cells are presented in
Figure 1.
Through an analysis of the optimization model, the characteristic parameters of the membrane can be obtained, such as the fraction of accessible volume (FAV), the cohesive energy density (CED) and the radial distribution function (RDF). Part of the PDMS membrane volume is occupied by molecular chains, and the other part is free volume. FAV represents the percentage of free volume available in the membrane relative to the total volume of the membrane. The CED is used to characterize the intermolecular force of polymers and judge the stacking degree of chain segments. The RDF reflects the aggregation characteristics between atoms or molecules.
The optimized model was used for GCMC simulation and MD simulation to study the dissolution and diffusion process of molecules in the model. The solubility coefficient and the diffusion coefficient of different gas molecules in the PDMS membrane were calculated, and the permeability coefficient was then calculated. The permeability coefficient indicates how difficult it is for gas molecules to pass through the polymer membrane.
The SM presents the relevant knowledge and calculation techniques of the FAV, the CED, the RDF, the diffusion coefficient, the solubility coefficient and the permeability coefficient.
3. Results and Discussion
Table 1 shows the calculated CED values of PDMS from the MD simulation results and the CED values of PDMS in the literature. The simulation value of PDMS is close to the literature value, which shows that the construction of the model is reasonable.
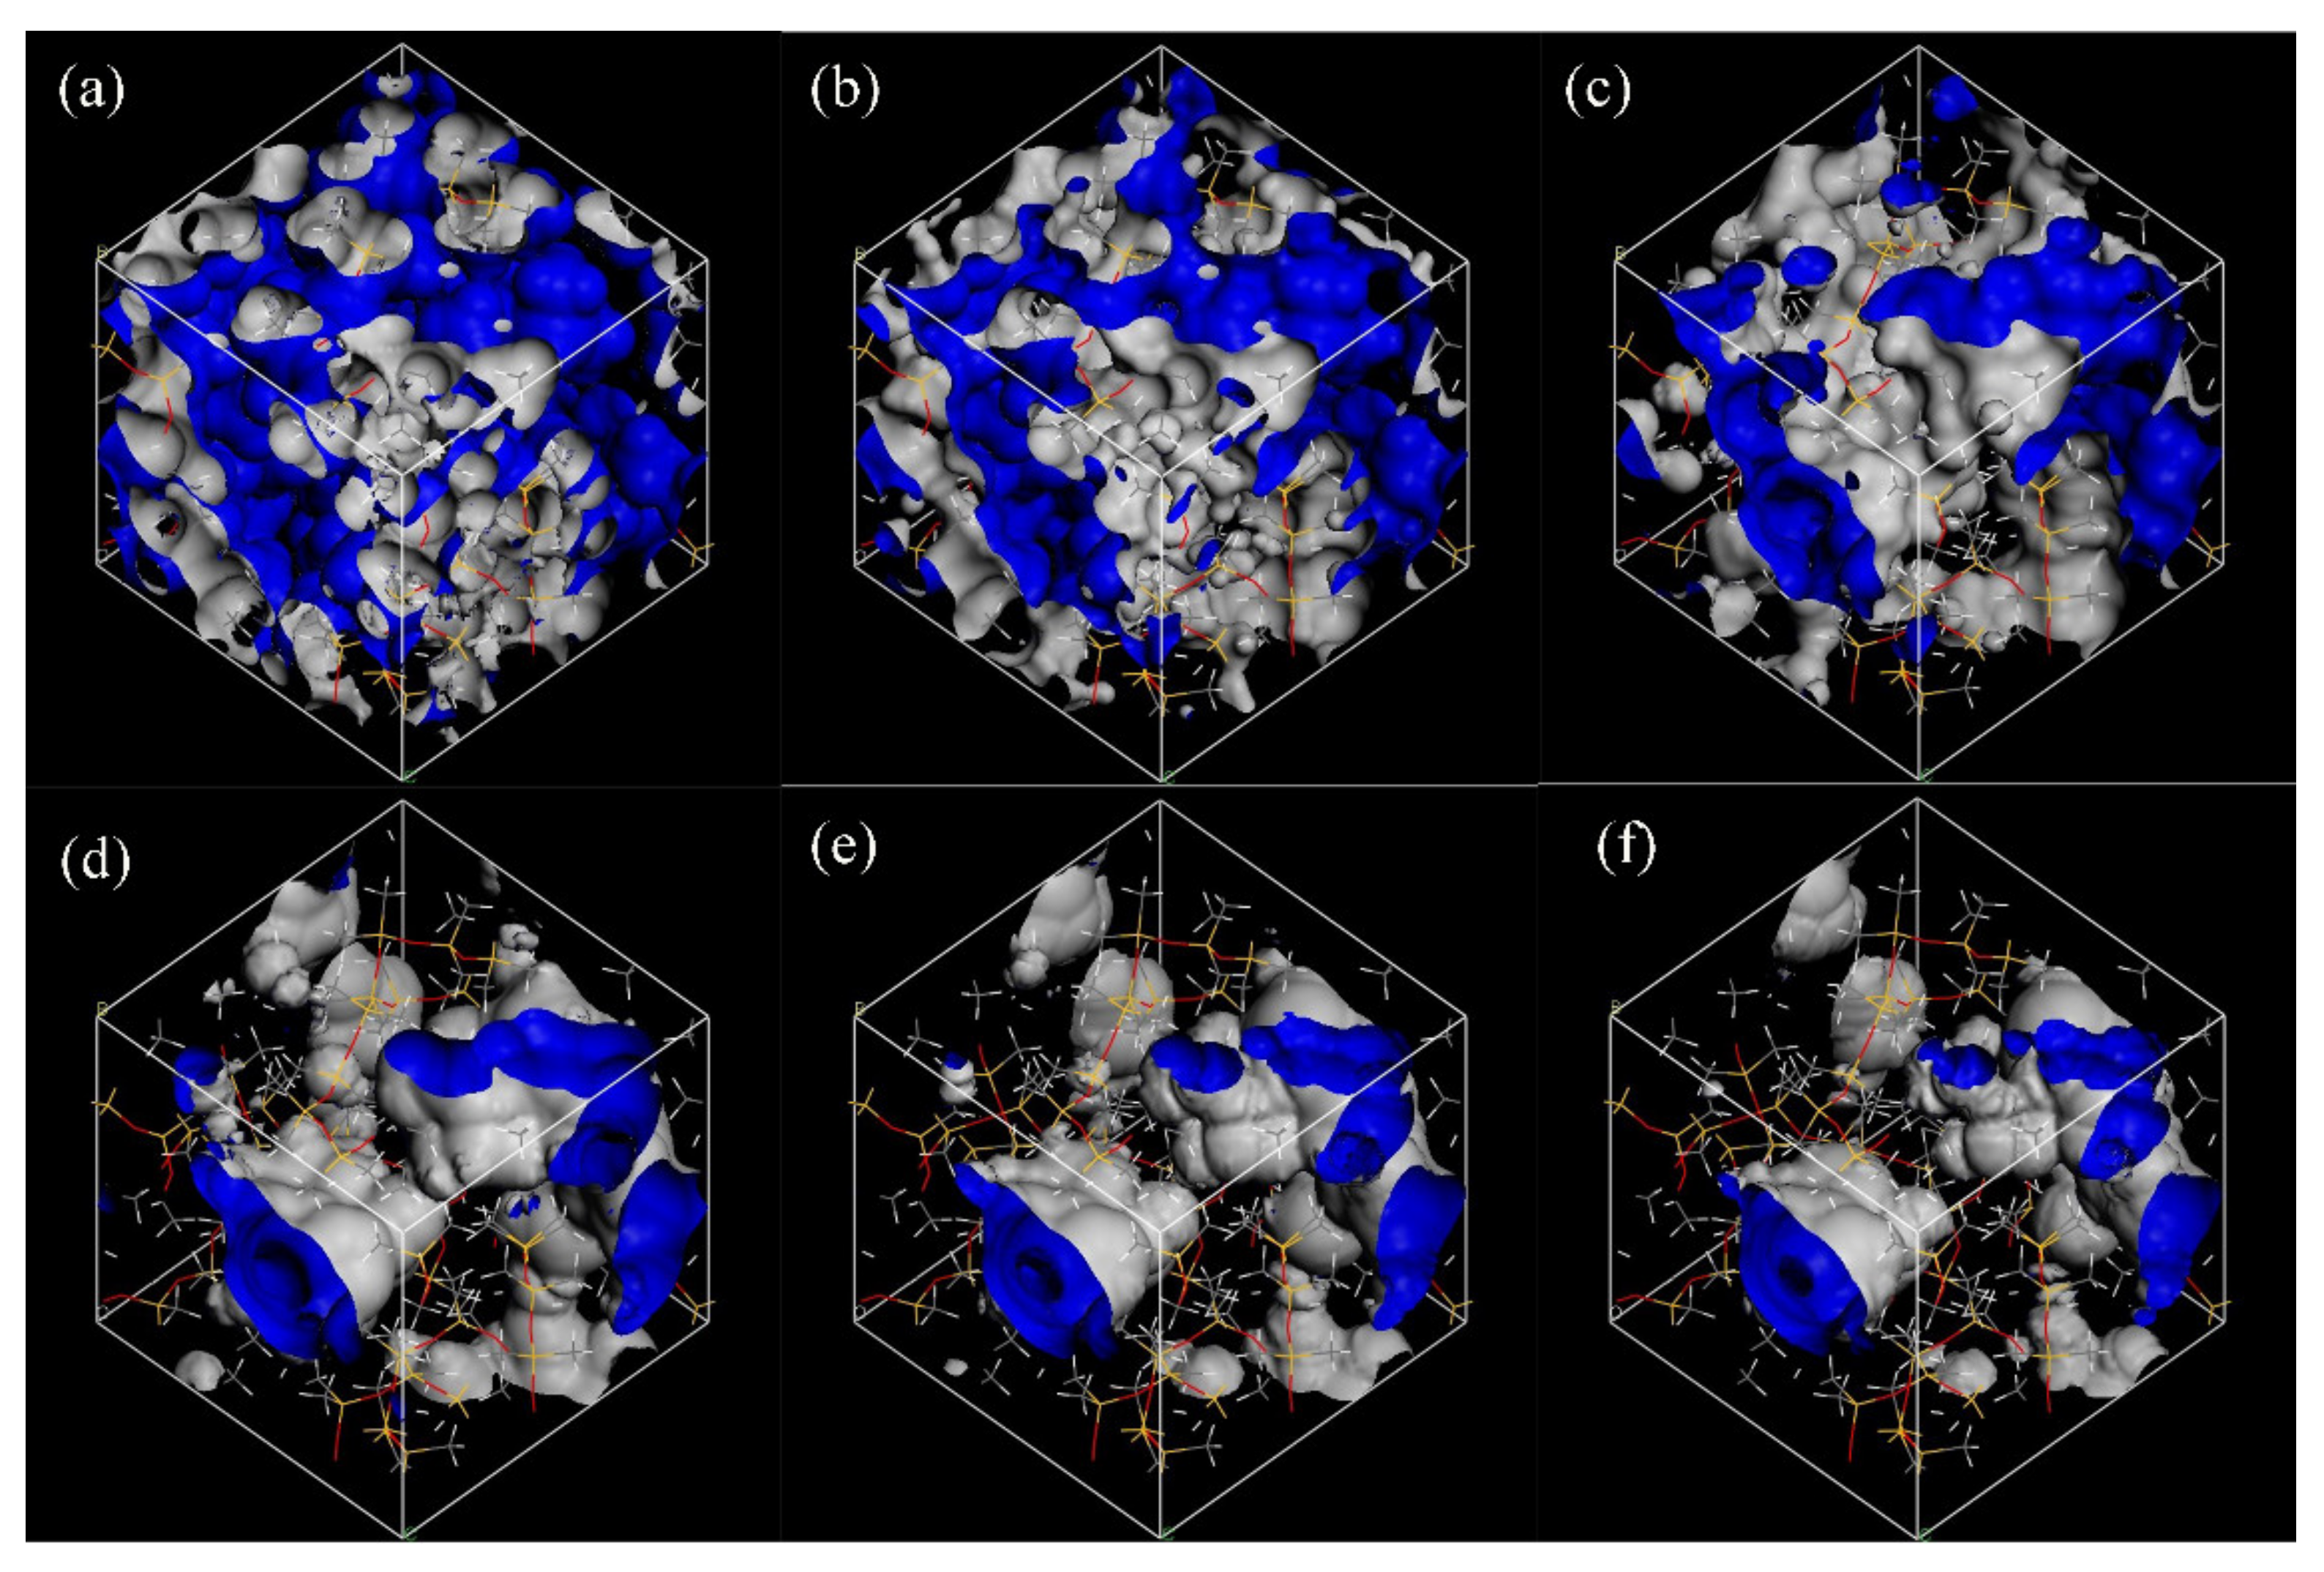
To obtain profound knowledge of gas transport in PDMS, we studied the distribution of free volume and accessible volume in PDMS simulation cells, because gas molecules can only diffuse in accessible free volume.
Figure 2 shows the accessible spaces determined by setting a different Connolly radius for the probes.
Table 2 shows the free volume, occupied volume, total volume and FAV determined by probes with a different radius. The FFV of the PDMS membrane is 44.62%, which is larger than that of most polymers, including polyethylene and polypropylene. According to the figures, with a gradual increase in the probe radius, some accessible spaces shrink and finally disappear. As the radius of N
2 molecules (1.8 Å) was used as the probe size, the FAV in PDMS reached 24.24%. However, when the radius of C
3 molecules (2.2 Å) was used as the probe size, the FAV decreased to 16.48%. As a result, the N
2 molecules had more space to pass through the PDMS membrane than the C
3 molecules. It appears that in the PDMS membrane, N
2 molecules have a higher transport rate than C
3 molecules.
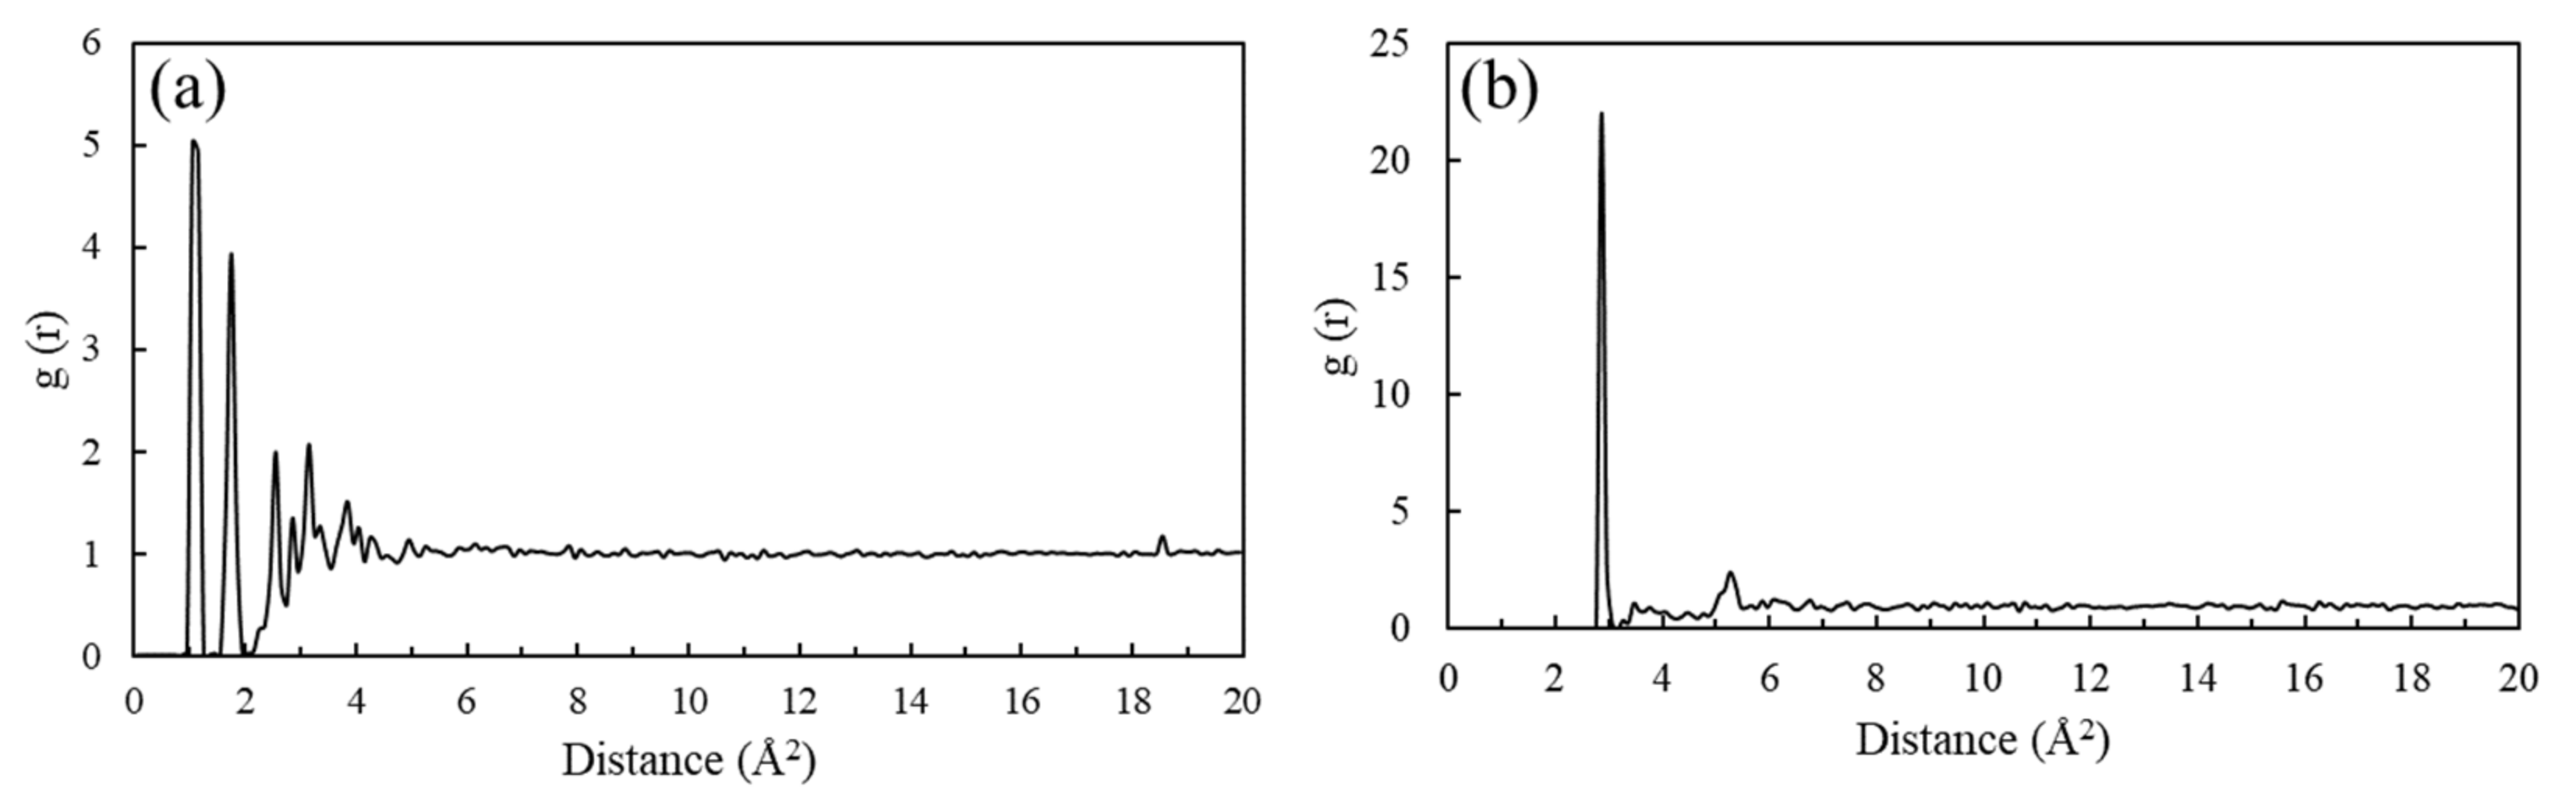
Then, the RDF of PDMS membrane atoms was calculated. The results are presented in
Figure 3.
Figure 3a shows the RDF of all the atoms of the PDMS. It is observed that the atoms of the PDMS lack long-range order, indicating that the polymer is amorphous. As the distance is shorter than 1 Å, the peak intensity is zero, indicating that the distance between the atoms is larger than 1 Å, which reflects the mutual repulsive force between the atoms.
Figure 3b shows the RDF between the Si atoms and the C atoms of the branch chain. The radial distribution between the C atoms and the Si atoms has a sharp peak at 2.25 Å. This is the bond length of the C-Si bond.
A mean square displacement (MSD) curve can be used to calculate the diffusion coefficient. Over long time intervals, when ions enter the Fickian diffusive zone, the MSD values are linear over time.
Figure 4 shows the MSD values as a function of time for the transport of gases in PDMS membranes at 298 K. According to the MSD-t curve obtained from the simulation analysis, the logarithmic curve of MSD-t is drawn and fitted linearly. The region corresponding to the part with the slope of a logarithmic curve of about one is the normal diffusion region, and the diffusion coefficient can only be calculated by MSD in the normal diffusion region. For all gases, the normal diffusion region is reached within 1200 ps.
The slope of the MSD-t curve of N2 is much larger than those of C3H8 and C3H6; the slopes of C3H8 and C3H6 are close to each other. As a result, the diffusion coefficients of N2 are much greater than those of C3 molecules, and the diffusion coefficients of the two C3 gases are similar to each other, which is consistent with the FAV results. Therefore, smaller molecules show larger diffusivities.
Table 3 shows the diffusion coefficients of C
3/N
2 as pure gases and mixed gases in PDMS. The diffusion coefficients of various gases in the mixed gas systems are higher than those of pure gases. The diffusion coefficients of N
2 in both systems are much greater than those of both C
3 molecules. The increase in N
2 diffusion coefficients in the mixed gas system is smaller than those of both C
3 molecules in mixed gas systems, indicating that mixing N
2 with other gases has a relatively smaller influence on the diffusion of N
2.
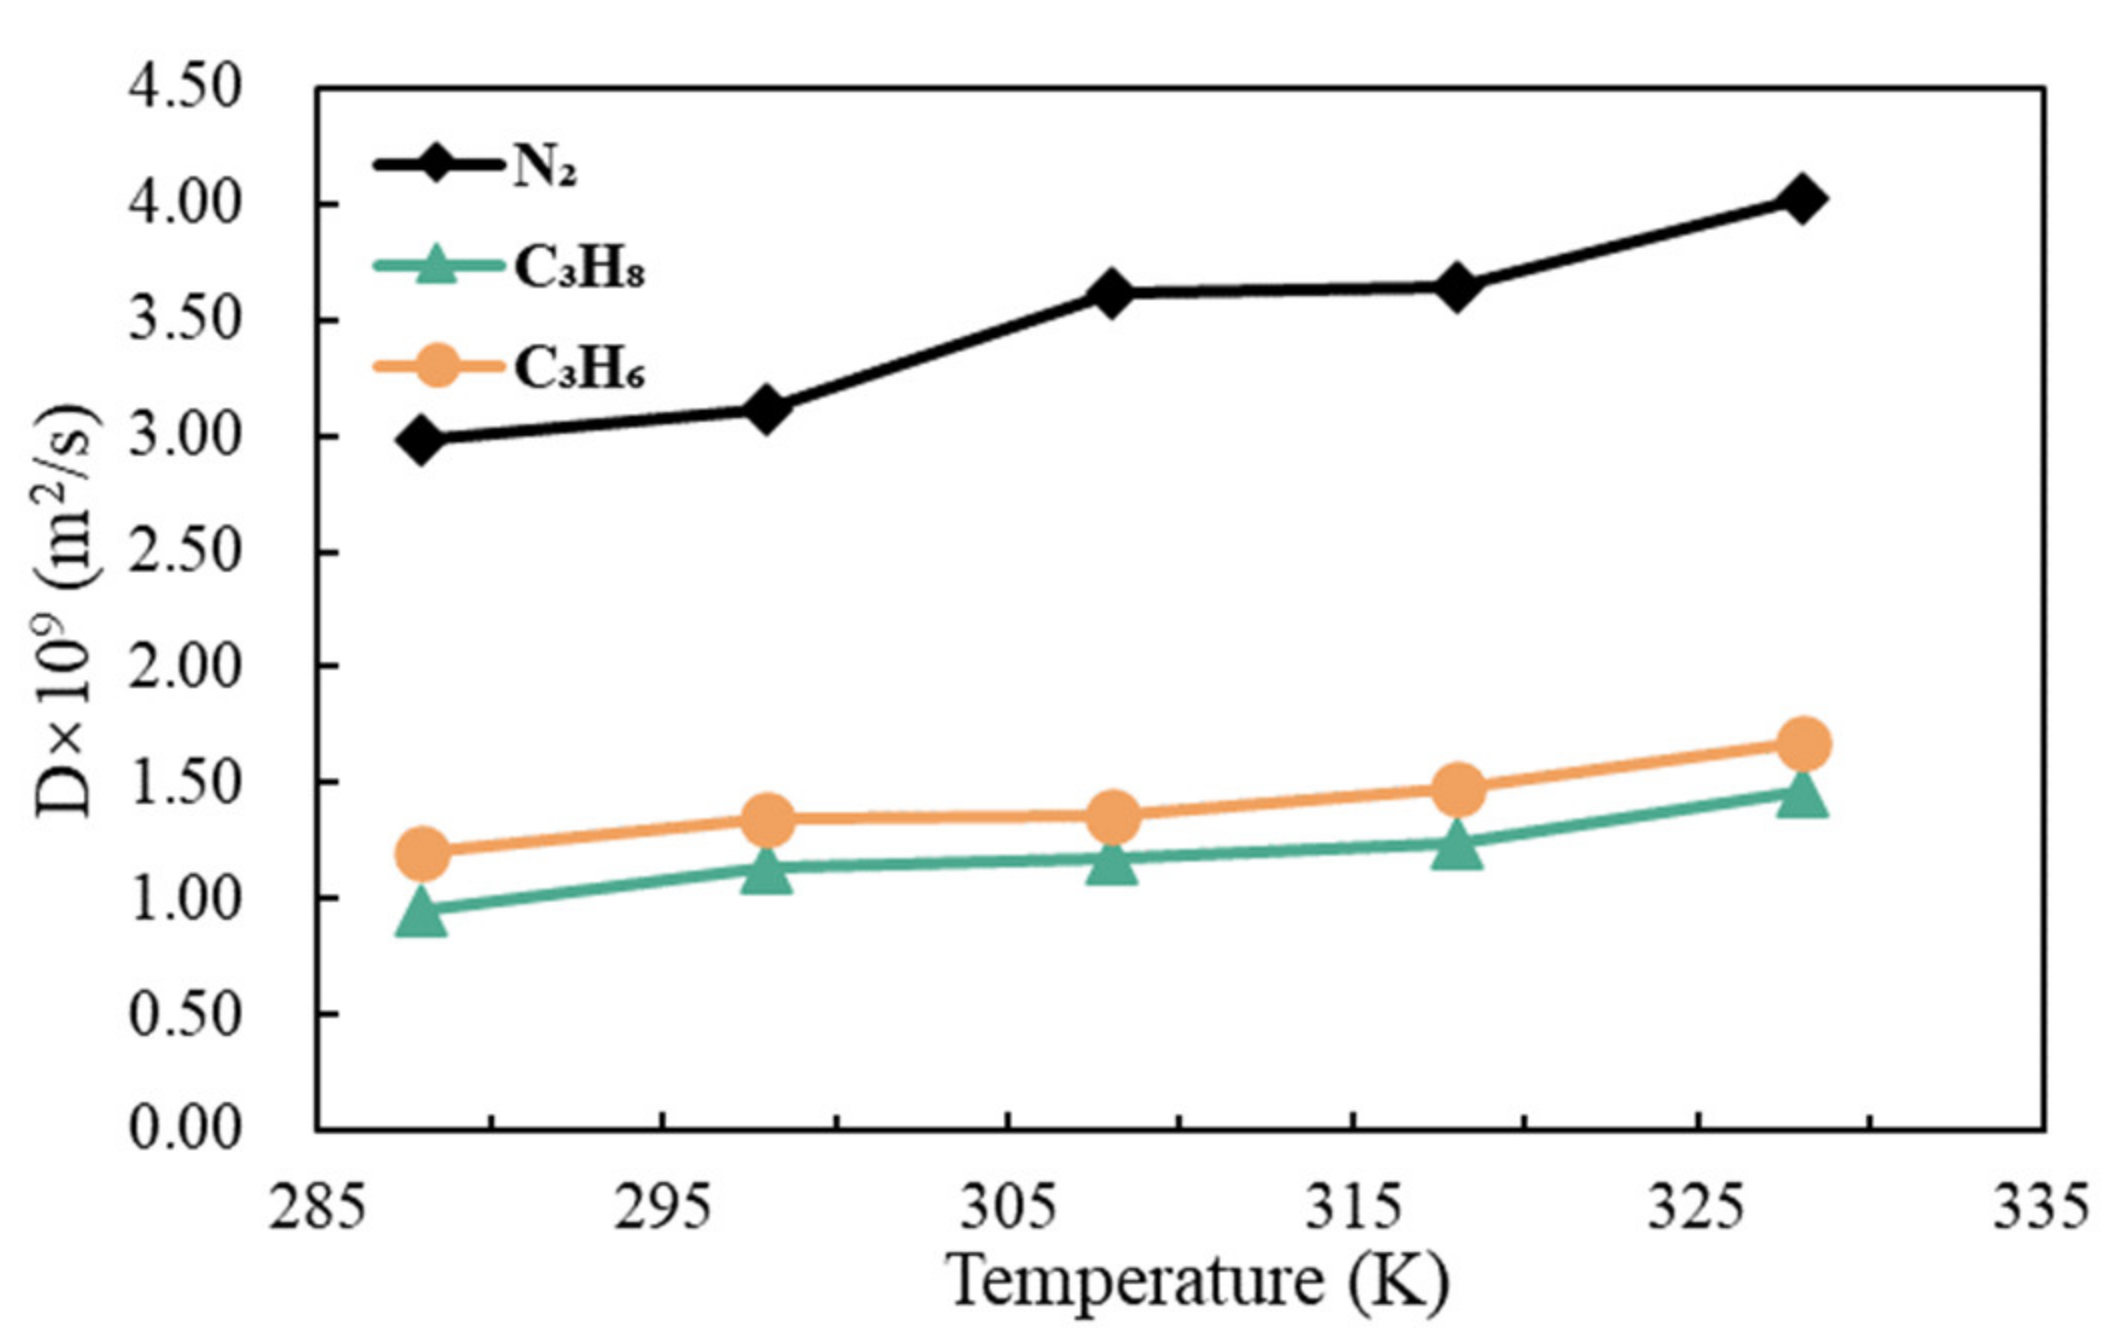
Figure 5 shows the diffusion coefficients of N
2, C
3H
8 and C
3H
6 in the PDMS membrane at temperatures of 288 K, 298 K, 308 K, 318 K and 328 K. With a temperature increase from 288 K to 328 K, the diffusion coefficients gradually increase as well. Equation (1) is based on the Arrhenius formula [
26]:
where
D0 is the diffusion constant,
Q is the diffusion activation energy,
R is the gas constant and
T is the temperature. It is generally believed that
D0 and
Q are independent of temperature. Therefore, when
T increases,
D will also increase. The simulation results are in line with this trend.
It can also be observed from
Figure 5 that at the same temperature, the larger the gas molecule, the smaller the diffusion coefficient. This phenomenon can be explained by the free volume of the membrane. N
2 has more holes to pass through the membrane than C
3, so it has a higher diffusion coefficient.
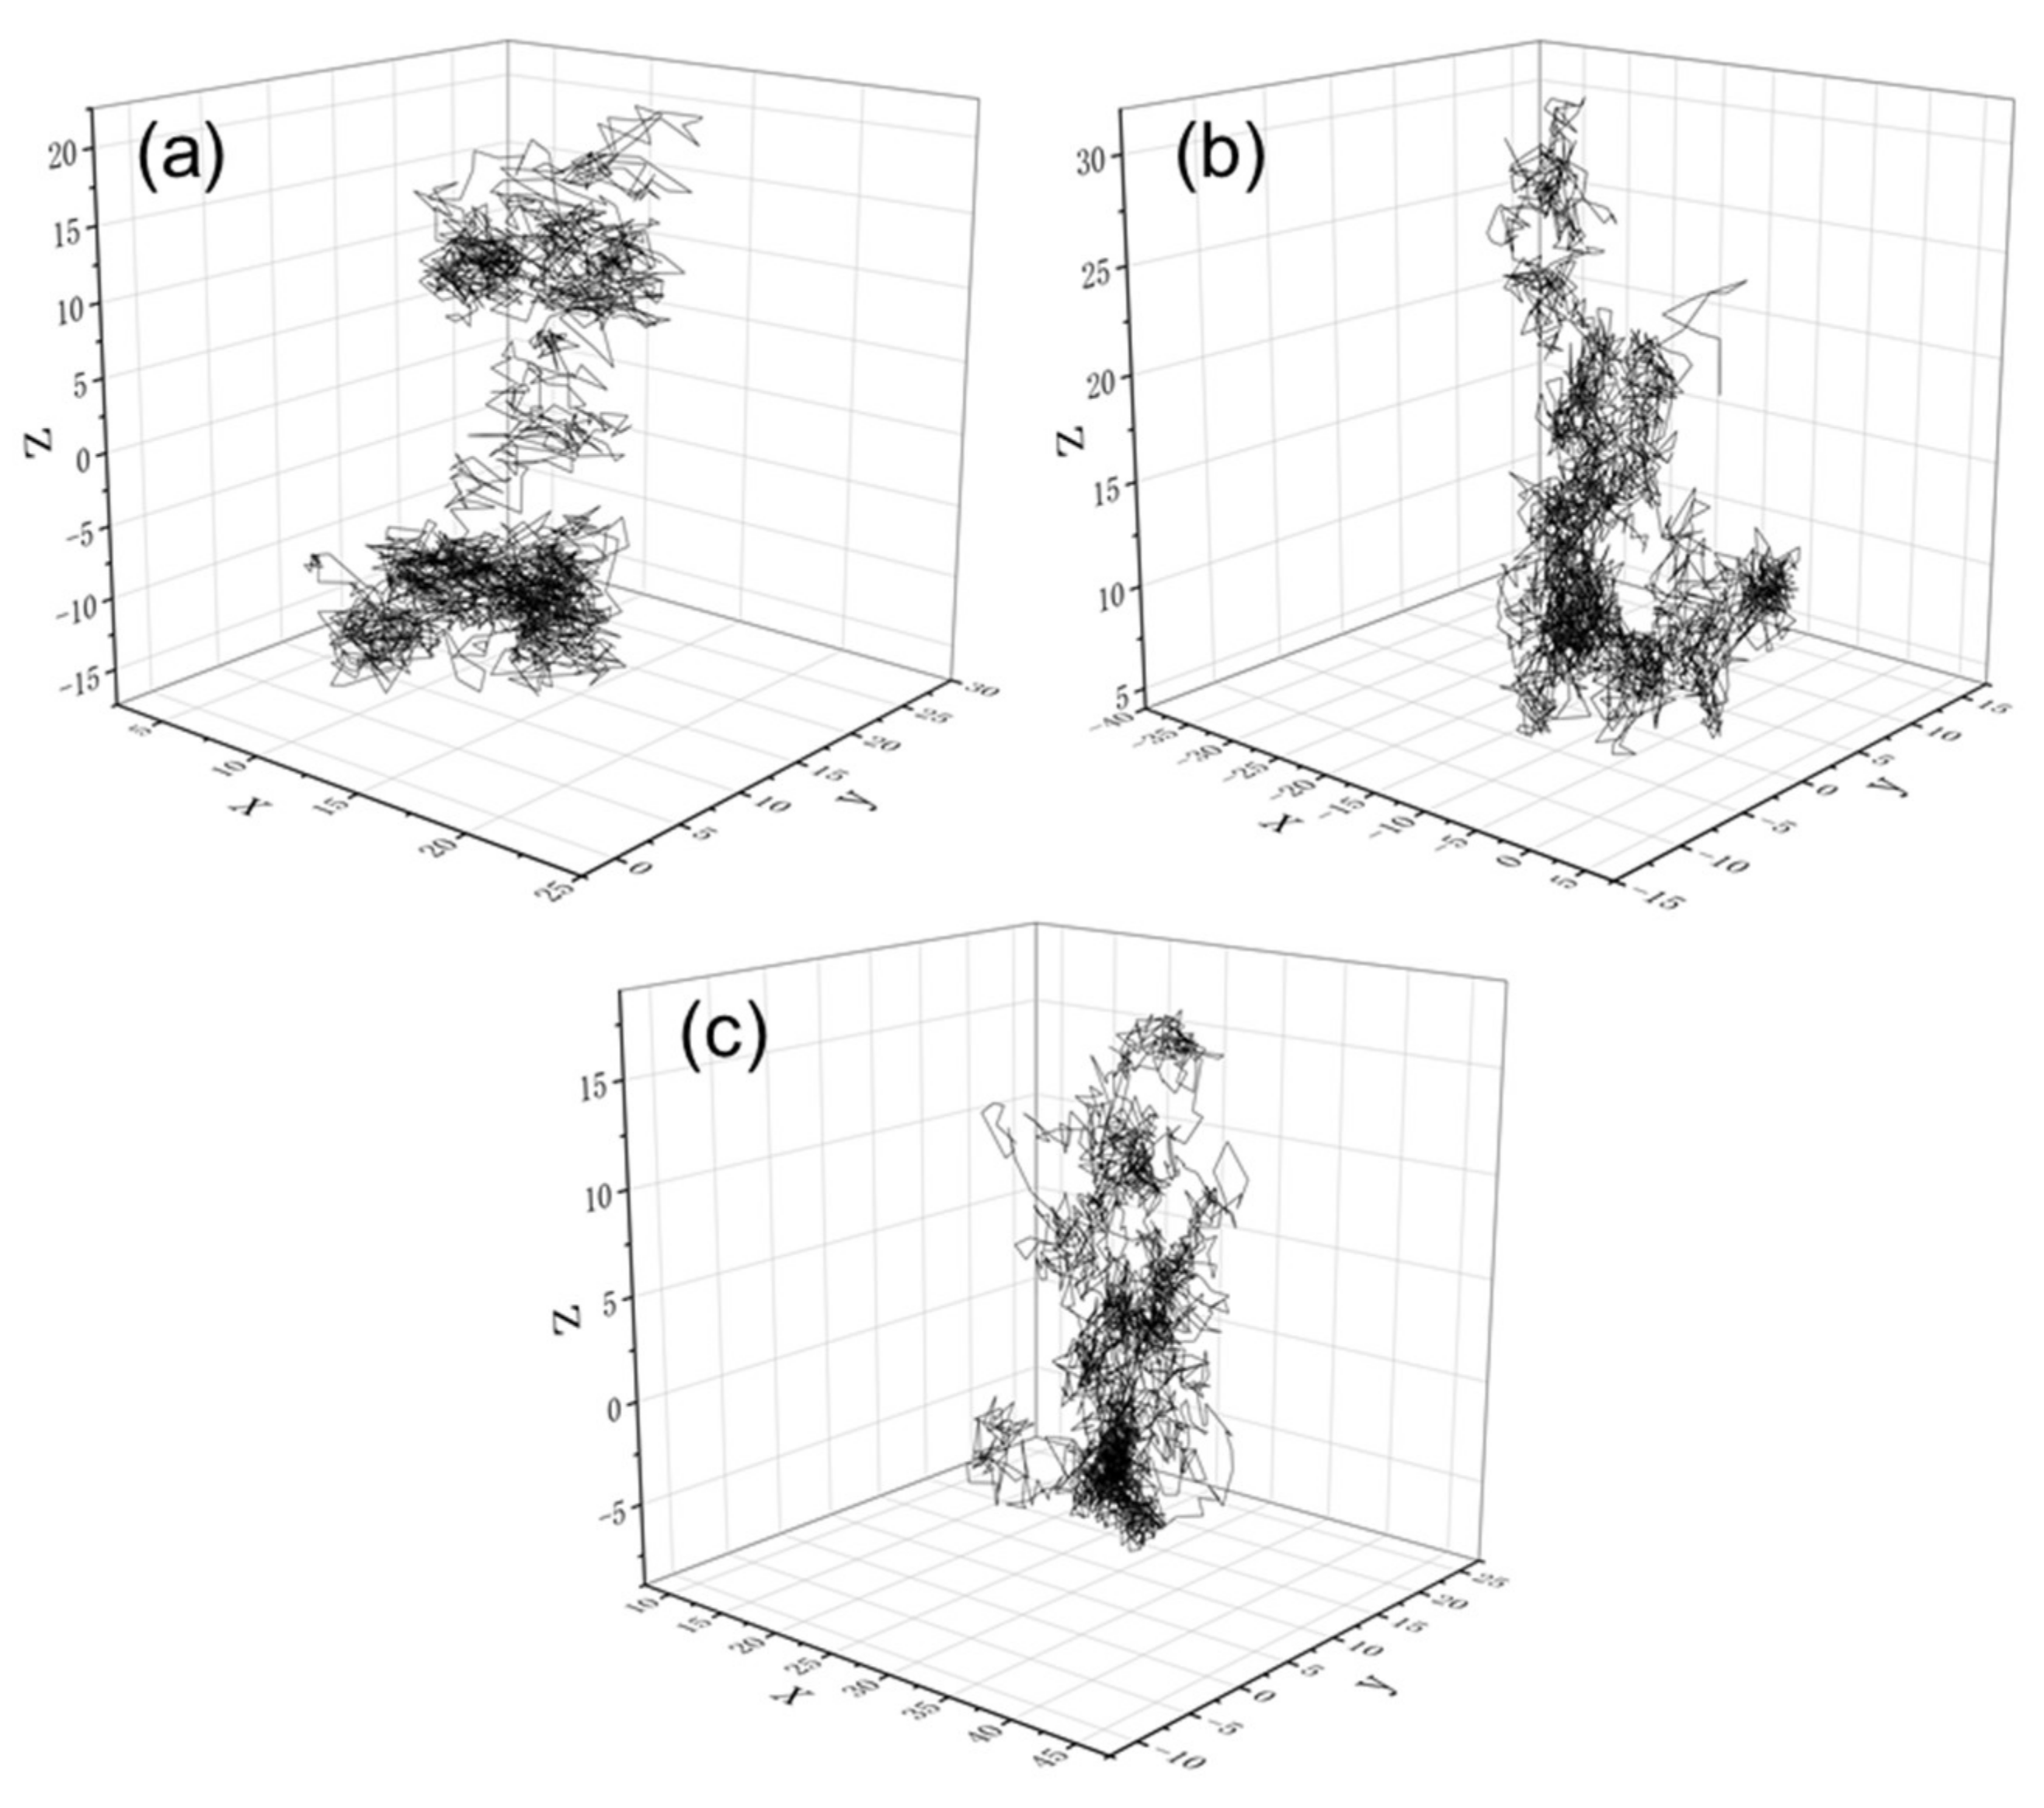
Figure 6 shows the trajectories of the three gases at 298 K. The gases jump among holes in PDMS in the diffusion process. The space ranges that gases reach are determined by the magnitudes of the diffusion coefficients. The diffusion range of N
2 is larger than that of C
3. Because the volume of N
2 molecules is smaller, they can reach some holes with a volume smaller than that of C
3 molecules, and the diffusion coefficient of N
2 is larger than that of C
3, that is, N
2 has a higher diffusion rate. Therefore, N
2 has the largest diffusion range.
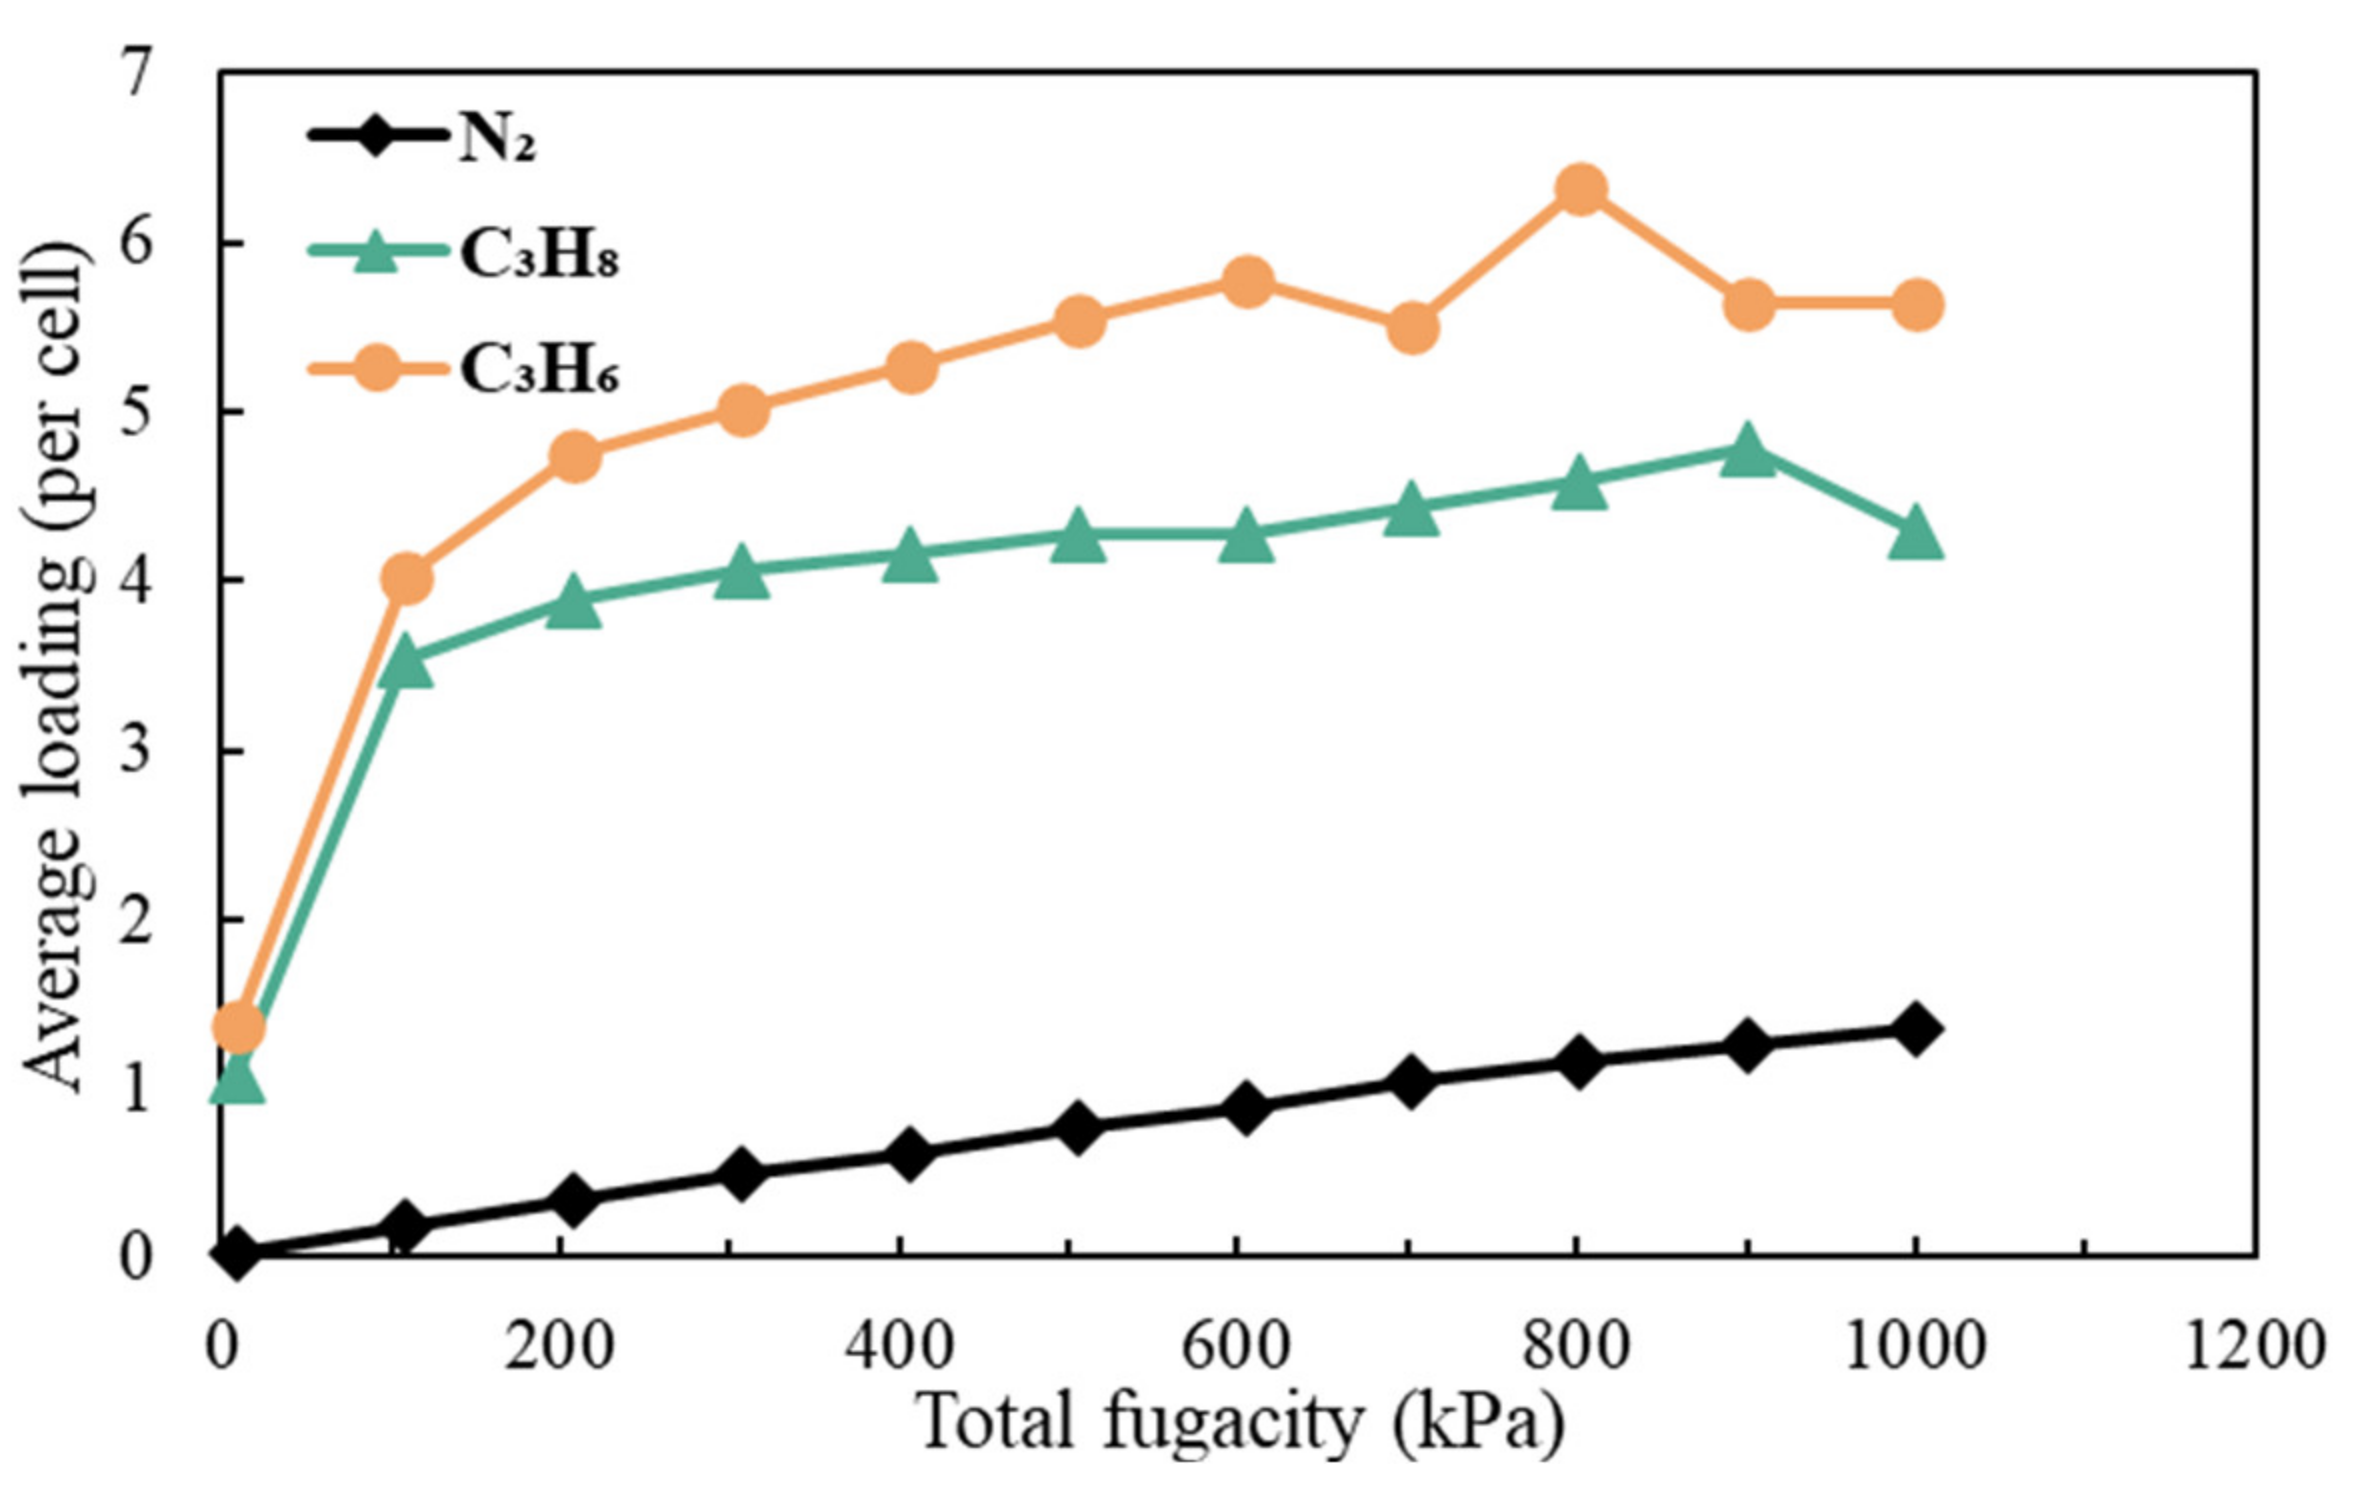
Figure 7 shows the adsorption isotherms of all three gases on the PDMS membrane at 298 K. At the same temperature and pressure, the number of gas molecules adsorbed by PDMS decreases in the order of C
3H
6, C
3H
8 and N
2. With an increase in pressure, the number of molecules adsorbed on the PDMS membrane gradually increases. When the pressure reaches 200 kPa, C
3H
8 and C
3H
6 reach the adsorption equilibrium, and the number of adsorbed molecules remains unchanged. However, N
2 does not reach the adsorption equilibrium, even as the pressure reaches 1000 kPa. This is because interactions of N
2 with PDMS chains are rather limited, compared to those of C
3H
8 and C
3H
6. Even at lower pressure, PDMS can absorb sufficient C
3H
8 and C
3H
6 and reach equilibrium, but for N
2, at pressures as high as 1000 kPa, we can observe that the amount of N
2 absorbed is still low and that there are still spaces in PDMS for more N
2. As a result, an equilibrium is not reached.
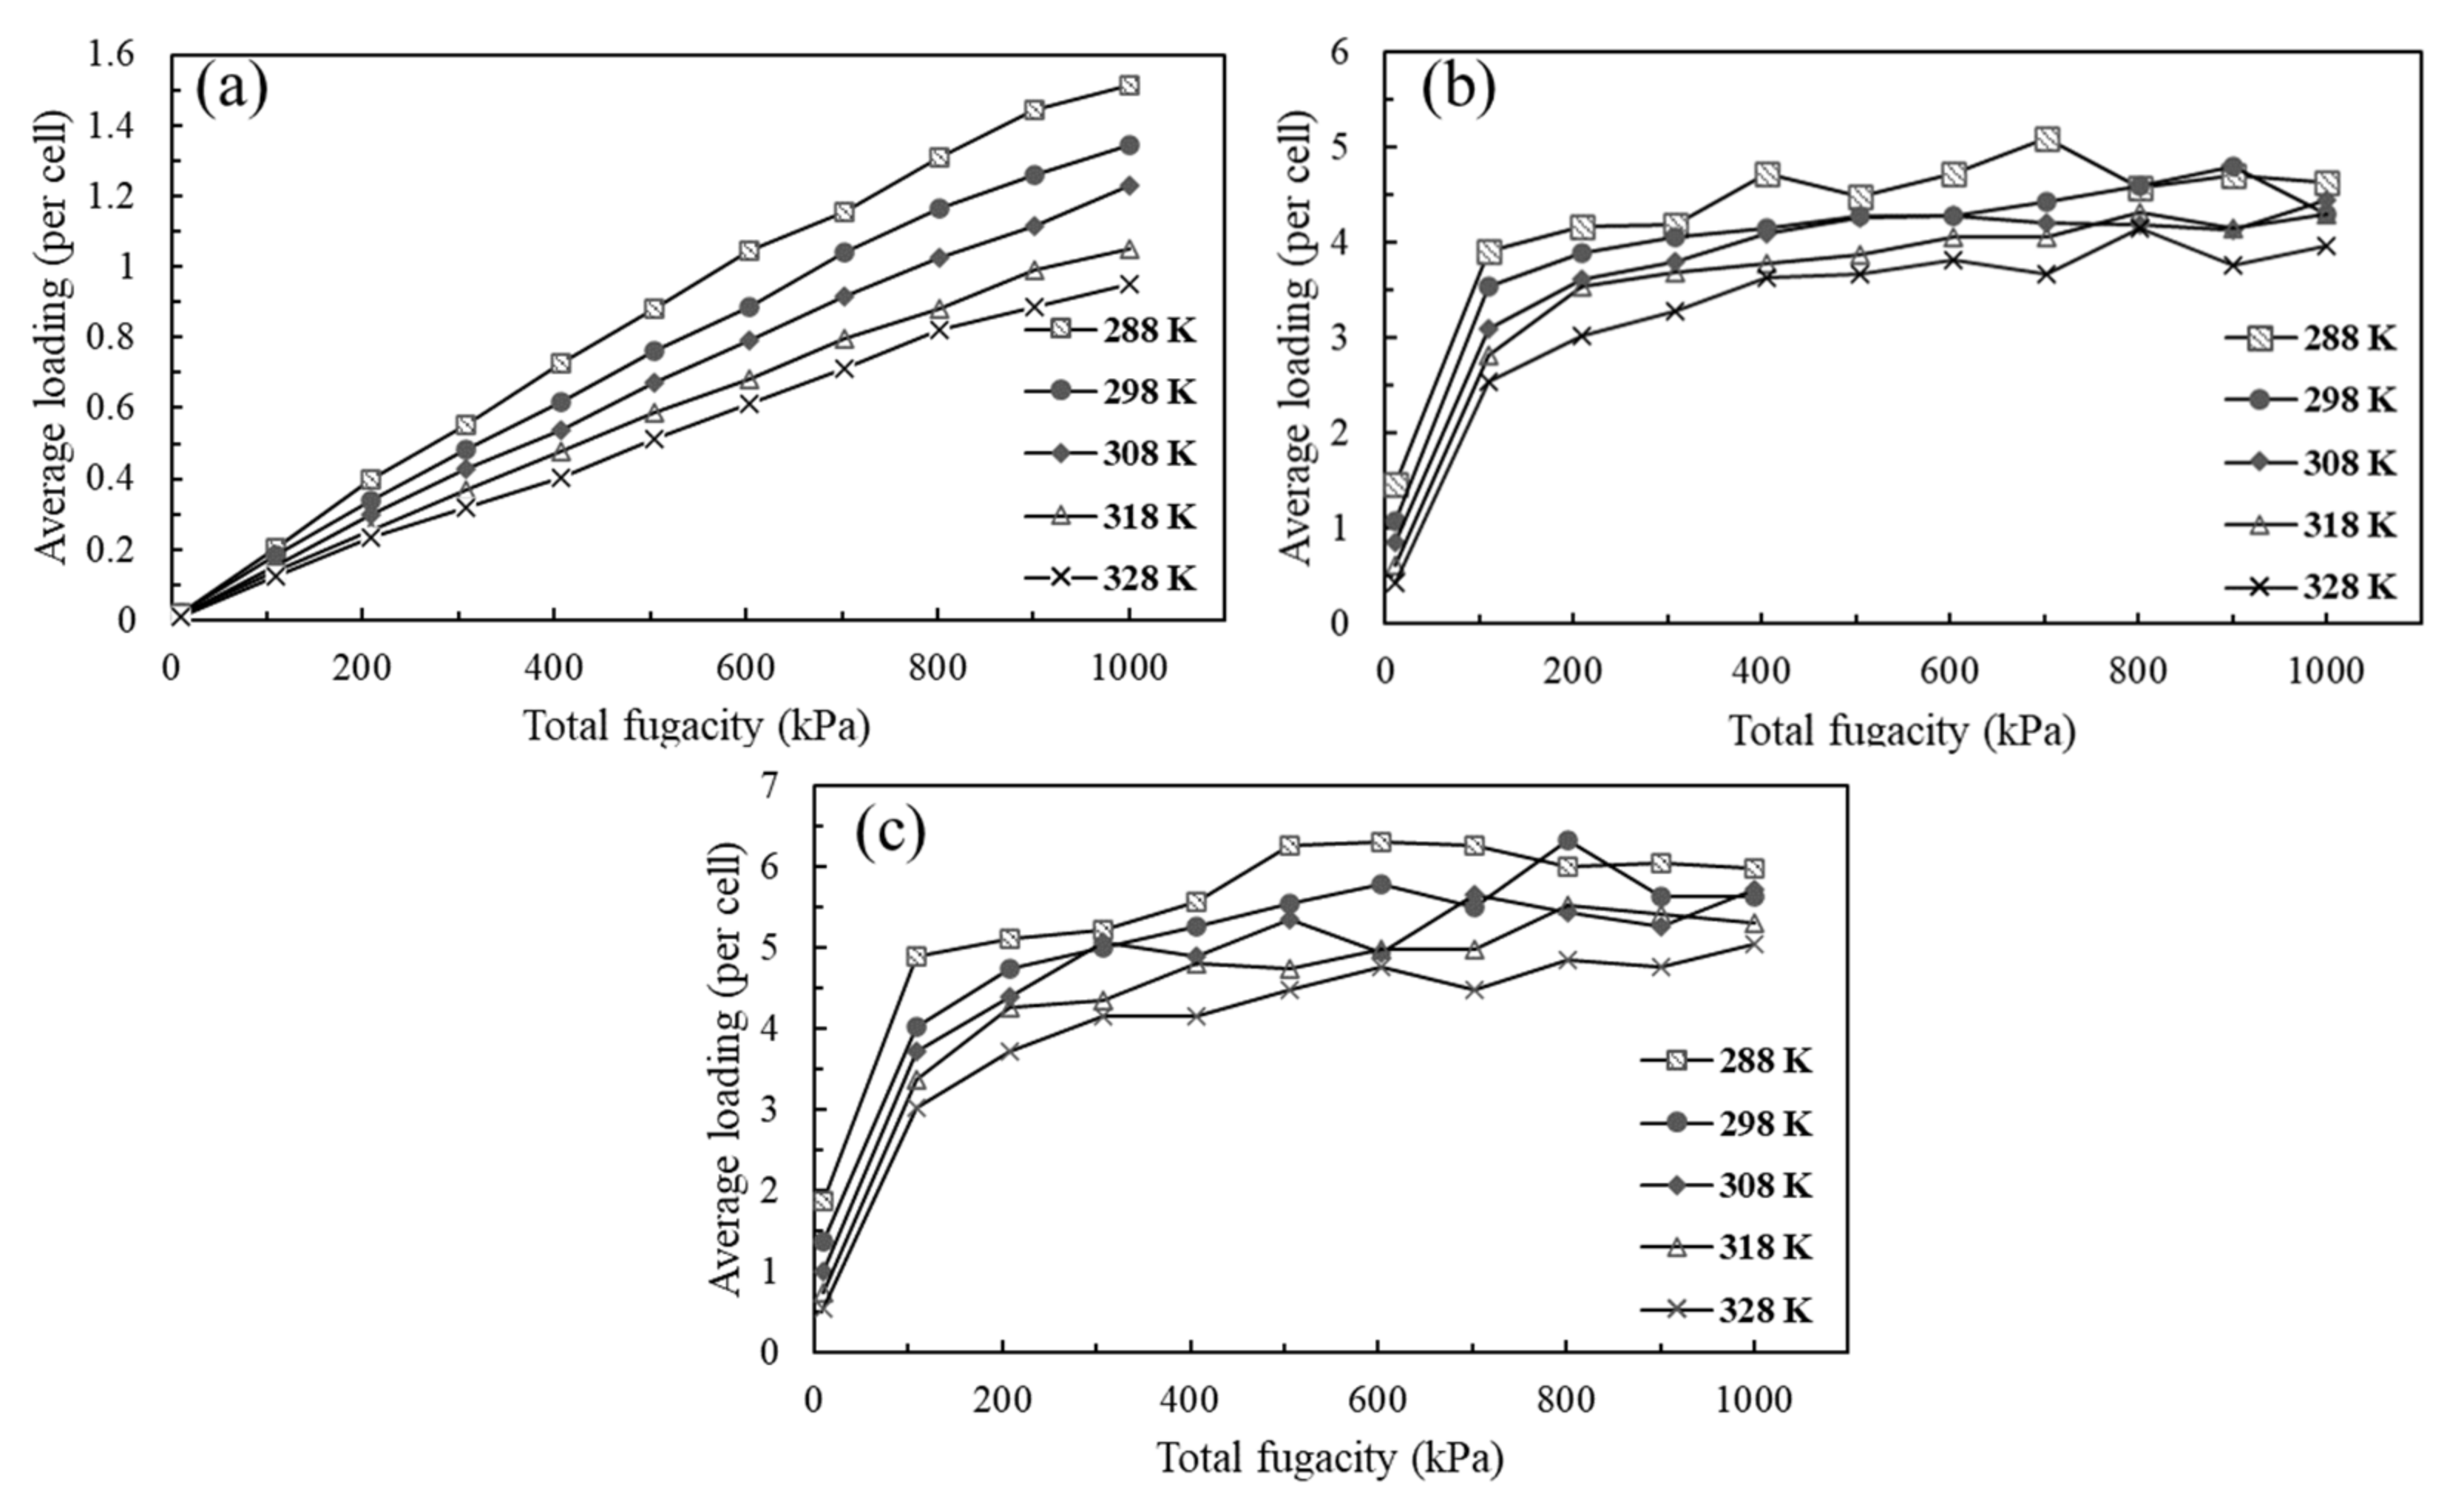
Figure 8 shows the adsorption isotherms of all three gases in the PDMS membrane at different temperatures. At the same pressure, as the temperature increases, the number of adsorbed molecules for all three gases on the PDMS membrane decreases. As a result, though N
2 molecules are smaller, the number of molecules adsorbed is lower than for both C
3 molecules. This is contrary to the case of diffusivities. Smaller N
2 molecules have higher diffusivities than both C
3 molecules.
The solubility coefficients for the three gases, as pure gases and as mixed gases, in PDMS at 298 K are shown in
Table 4. The competitive adsorption of gases in mixtures leads to a decrease in the solubility coefficients, and the decrease in the solubility coefficient of C
3 is greater than that of N
2.
Figure 9 shows the solubility coefficients of N
2, C
3H
8 and C
3H
6 in the PDMS membranes at different temperatures. It can be observed that the solubility coefficients of C
3H
8 and C
3H
6 are relatively similar, while the solubility coefficient of N
2 in PDMS is much smaller than those of C
3H
8 and C
3H
6. This is consistent with the previous inference based on adsorption energy. The solubility coefficients of all three gases in PDMS gradually decrease as the temperature increases. Thus, we can observe that C
3 shows higher solubility than N
2. The most probable explanation for this is that C
3 has a higher transport rate in PDMS.
The permeability coefficient can be calculated by multiplying the diffusion coefficient and solubility coefficient of gas in the PDMS membrane.
Table 5 shows the permeability and selectivity coefficients of C
3/N
2 as pure gases and as mixed gases in the PDMS membrane. At 298 K, the selectivity coefficients of C
3/N
2 in PDMS are close to those obtained in the experimental results [
27], and the selectivity coefficients of C
3/N
2 as mixtures are lower than those of C
3/N
2 as pure gases. Therefore, selectivity coefficients were obtained. This is the most important parameter to determine if a membrane can be used for the separation of gas mixtures.
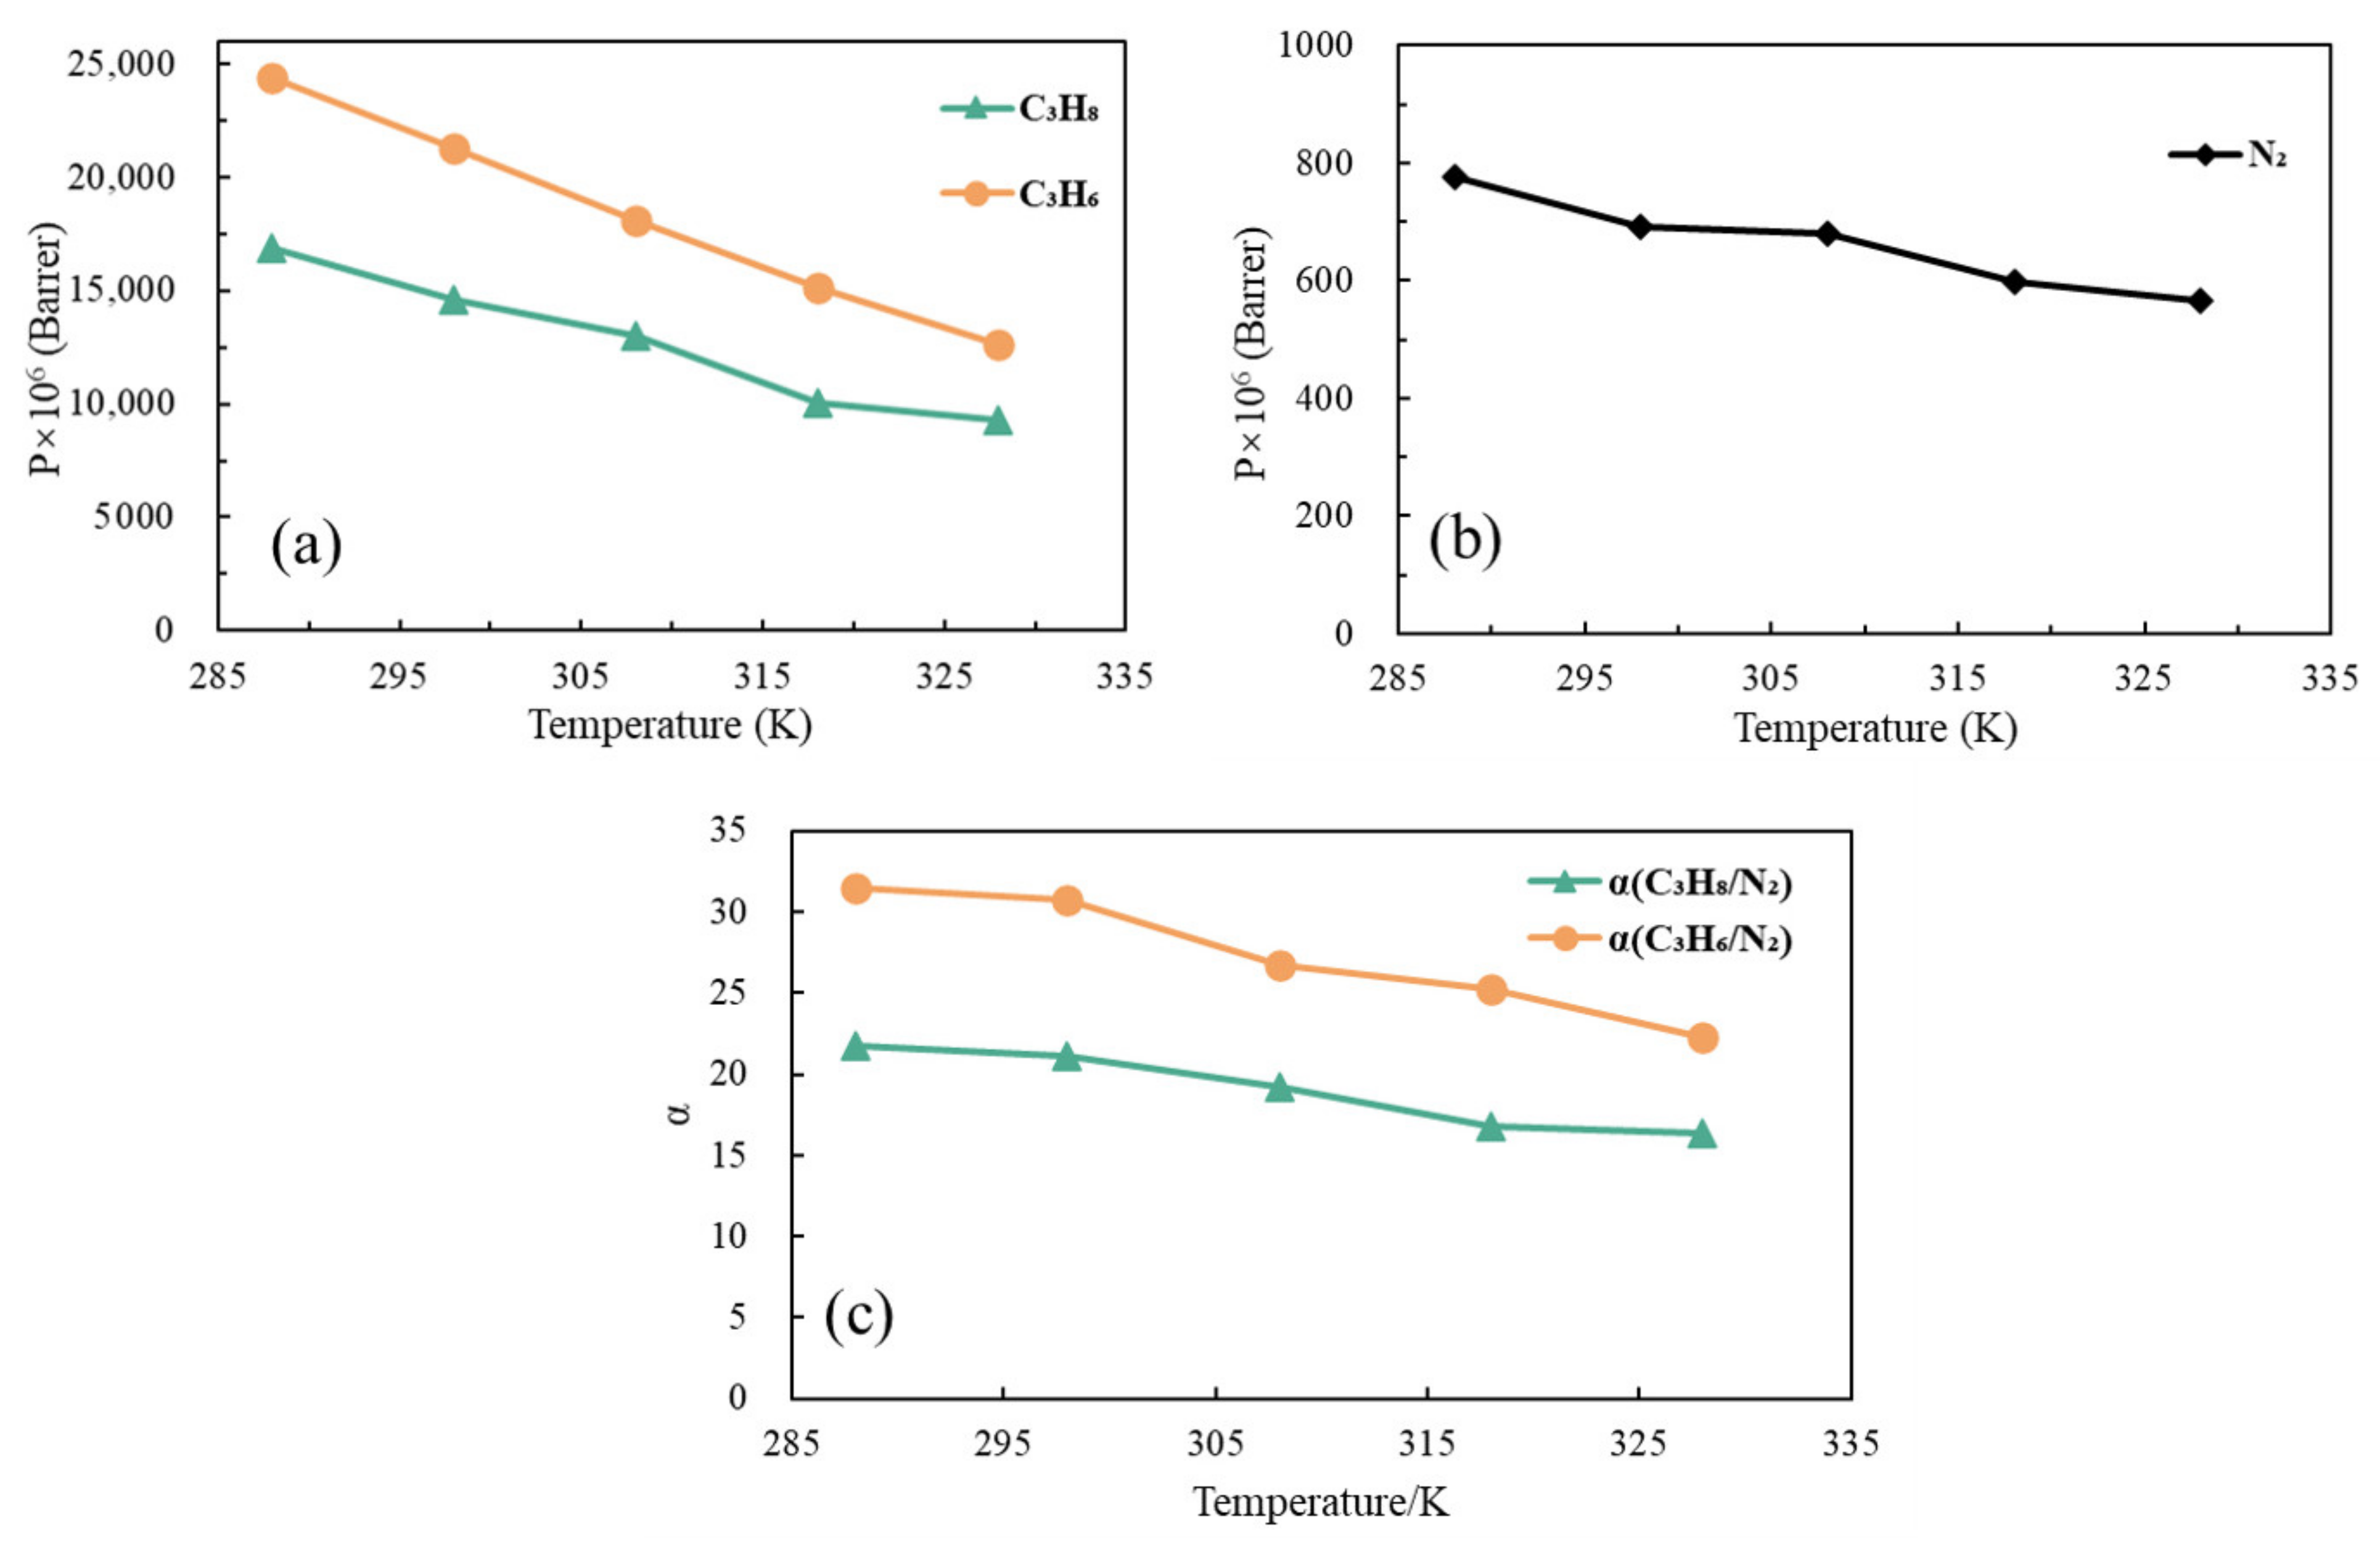
The permeability coefficients of the three gases at different temperatures are shown in
Figure 10. The permeability coefficients of the two C
3 molecules in PDMS are similar to one another and are much higher than that of N
2. For the same gas, the permeability coefficient in PDMS decreases with an increase in temperature. The selectivity coefficient of C
3/N
2 gradually decreases with an increase in temperature.
According to the results, the apparently higher solubility coefficient of C3 than that of N2 results in higher permeability of C3. Therefore, the transmembrane mass transfer of C3 and N2 in PDMS is mainly controlled by the dissolution step. Molecules with a large volume and low polarity, such as C3, have high solubility in PDMS, and, thus, have a high permeability coefficient. This explains the unusual phenomena of large C3 molecules having a higher transport rate than small N2 molecules in PDMS.
4. Conclusions
In this study, the PDMS models were built using MS software, the related parameters of PDMS membranes were simulated, the transport process of C3/N2 in PDMS membranes was studied and analyzed, and the specific conclusions were as follows:
The diffusion and dissolution processes of C3 and N2 in PDMS membranes were analyzed using MD simulation and GCMC simulation, and the diffusion coefficient and solubility coefficient of C3/N2 in PDMS membranes were calculated. The results show that the diffusion rate of C3 in PDMS membranes is lower than that of N2, but the dissolution rate of C3 in PDMS membranes is much greater than that of N2, indicating that the mass transfer process of C3 in PDMS membranes is mainly controlled by the dissolution process, while that of N2 is mainly controlled by the diffusion process.
By comparing the mass transfer processes of pure gas and mixed gas, the effect of intermolecular force on the mass transfer process of gases in PDMS membranes was studied. It was found that under the same simulation conditions, the diffusion coefficients of gases in the mixed gas system are greater than those in the pure gas system, indicating that the diffusion process of gas molecules in polymer membranes has a synergistic effect. In the dissolution process, the solubility coefficients of various gases in the mixed gas system are lower than those of pure gases, indicating that there is a competitive adsorption relationship in the dissolution process of these gases in the PDMS membrane.
The effect of temperature on the mass transfer process of C3/N2 in PDMS membranes was also studied. The results show that with an increase in temperature from 288 K to 328 K, the diffusion coefficients of the three gases in PDMS gradually increase, the solubility coefficients gradually decrease, and the overall permeability selectivity coefficients of the gases gradually decrease. Therefore, according to an analysis of the control steps of the mass transfer of C3/N2 in PDMS membranes, it can be deduced that low-temperature conditions are more conducive to the separation of C3/N2 in PDMS membranes.


