Abstract
This study developed an automated multistage countercurrent extraction device and applied it to the separation and extraction of phenolic acids—including neochlorogenic acid, chlorogenic acid, cryptochlorogenic acid, isochlorogenic acid A, isochlorogenic acid B, and isochlorogenic acid C—from an aqueous extract of Lonicera japonica Thunb. The extraction process was optimized by systematically evaluating critical parameters such as liquid–liquid equilibrium pH, internal diameter of the tee connector, phase flow rate ratio, and the number of extraction stages. The apparent partition coefficients of all six phenolic acids increased with decreasing aqueous pH, with fitted pKa values ranging from 3.7 to 4.3. A reduction in tee diameter (0.75 mm) was found to enhance mass transfer efficiency. Increasing the flowrate of both phases (20 mL/min), the organic-to-aqueous phase ratio (4:1), and the number of extraction stages (3 stages) significantly improved both stage efficiency and overall extraction yield. Under optimized conditions, the target chlorogenic acids were efficiently enriched, with their total content increasing from 50.3 mg/g to 70.1 mg/g in the solid residue after three countercurrent stages. The automated multistage countercurrent extraction system demonstrated robust performance, suggesting promising potential for applications in the preparation of traditional Chinese medicine ingredients or as an automated sample pretreatment method in analytical workflows. This study provides a novel and green technological solution for efficient separation of complex TCM systems.
1. Introduction
Liquid–liquid extraction (LLE) [1]—a fundamental separation technique based on the unequal distribution of a solute between two immiscible liquid phases—is extensively used for the purification of natural product compounds during the analysis or preparation of traditional Chinese medicines (TCMs). In the production of TCM injections [2], which are subject to stricter safety requirements than other dosage forms, LLE is more frequently adopted. Commonly employed extraction solvents include n-butanol and ethyl acetate. Current industrial practices in TCM production mainly utilize repeated single-stage extraction or multistage cross-flow extraction. However, the application of multistage countercurrent extraction for TCM production has not yet been reported.
Multistage countercurrent extraction involves connecting multiple extraction units in series, enabling two solvents to flow in opposite directions to achieve the separation of different components in a mixture. This technique offers advantages such as low energy consumption and suitability for thermolabile compounds [3]. By exploiting differences in the partition coefficients [4] among various substances, multistage countercurrent extraction facilitates efficient separation. Compared to single-stage extraction, this method significantly reduces solvent consumption and enhances purification efficiency [5].
Lonicera japonica Thunb., the dried flower buds of plants belonging to the genus Lonicera in the Caprifoliaceae family [6], was first documented as “Rendong” in the Mingyi Bielu during the Southern and Northern Dynasties. It is primarily distributed across subtropical and northern temperate regions, including Asia, North America, and Europe [7]. The major bioactive constituents of Lonicera japonica are phenolic acids including neochlorogenic acid [8], chlorogenic acid [9], cryptochlorogenic acid [10], isochlorogenic acid A [11], isochlorogenic acid B [12], and isochlorogenic acid C [13]. The molecular structures of these six phenolic acids are illustrated in Figure 1. Modern pharmacological studies have revealed that Lonicera japonica exhibits various therapeutic properties, such as heat-clearing, detoxifying, anti-inflammatory, antibacterial [14], hemostatic, and immunomodulatory [15] effects. It also serves as a raw material in several TCM injections, including Compound Reduning Injection [16] and Tanreqing Injection [17].
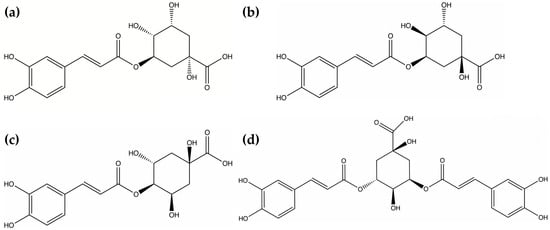
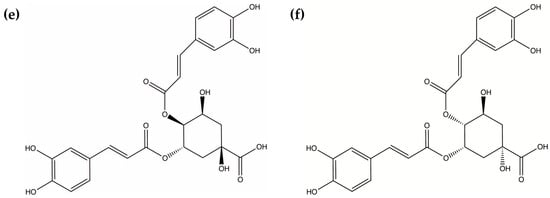
Figure 1.
Molecular structures of active components in Lonicera japonica Thunb.: (a) Neochlorogenic acid; (b) Chlorogenic acid; (c) Cryptochlorogenic acid; (d) Isochlorogenic acid A; (e) Isochlorogenic acid B; (f) Isochlorogenic acid C.
In this study, an automated continuous multistage countercurrent extraction system was constructed using an aqueous extract of Lonicera japonica as a model system [18]. Key operational parameters—such as tee diameter, flowrate, phase ratio, and number of extraction stages—were systematically investigated. In contrast to conventional single-stage extraction [19], which suffers from inherent limitations including high solvent consumption and low operational efficiency, multistage countercurrent extraction offers theoretical advantages yet remains underexplored and rarely automated in the context of TCM, largely due to the complexity of TCM systems. The present work was designed to address this technological gap by developing an integrated automated control system to achieve precise and continuous operation of the multistage countercurrent process, thereby overcoming the inefficiency and solvent-intensive nature of existing separation methods. The main achievements and innovations of this work include: successful establishment of a flexibly regulated automated multistage countercurrent extraction platform; identification and experimental optimization of critical parameters affecting separation efficiency; demonstration of the method’s capability to significantly reduce solvent usage while markedly enhancing the purification efficiency of target phenolic acids. This study provides a novel and green technological solution for efficient separation of complex TCM systems.
2. Materials and Methods
2.1. Reagents and Materials
Lonicera japonica Thunb. (batch number: 250,308) was purchased from Sichuan Health Pharmaceutical Co., Ltd., Chengdu, China. Ultrapure water was prepared using a water purification system (Millipore Synergy UV, Merck & Co., Inc., Rahway, NJ, USA). The standard substances and chemical reagents employed in this work, along with their respective sources and purity levels, are provided below for details.
Methanol (purity ≥ 99.9%, analytically pure) and acetonitrile (purity ≥ 99.9%, analytically pure) were purchased from Tedia Company, Inc. (Fairfield, OH, USA). n-butanol (purity ≥ 99.5%, analytically pure) and hydrochloric acid (purity 36.0~38.0%, analytically pure) were obtained from Sinopharm Chemical Reagent Co., Ltd. (Shanghai, China). Phosphoric acid (purity 85~90%, chromatographically pure) was supplied by Aladdin Biochemical Technology Co., Ltd. (Shanghai, China). Reference standards, including neochlorogenic acid (purity > 99.6%, chromatographically pure), chlorogenic acid (purity > 96.5%, chromatographically pure), cryptochlorogenic acid (purity > 98%, chromatographically pure), isochlorogenic acid A (purity > 98.5%, chromatographically pure), isochlorogenic acid B (purity > 88.3%, chromatographically pure), and isochlorogenic acid C (purity > 94.0%, chromatographically pure), were all provided by Anpel Laboratory Technologies Inc. (Shanghai, China).
2.2. Preparation of Lonicera Japonica Extract
Approximately 40.0 g of dried Lonicera japonica buds were placed in a round-bottom flask, soaked in 1000 mL of water, and subjected to reflux extraction for 4 h with the flask immersed in a water bath maintained at 80–90 °C. Upon completion of the extraction, the mixture was allowed to cool to room temperature and then filtered to remove the solid residue, yielding the aqueous extract.
2.3. Analytical Method for Lonicera Japonica Extract
Concentrations of the six phenolic acids were determined using an HPLC (High Performance Liquid Chromatography) method based on the procedure described by Wang et al. [20]. An Agilent 1260 Infinity II HPLC system (Agilent Technologies, Santa Clara, CA, USA) equipped with a quaternary pump, autosampler, column compartment, and a diode array detector (DAD) was employed. Separation was achieved using an Agilent ZORBAX SB-C18 (Agilent Technologies, Santa Clara, CA, USA) column (250 mm × 4.6 mm, 5 μm) maintained at 30 °C. The injection volume was 10 μL, and the flowrate was set to 1 mL/min. Detection was performed at a wavelength of 325 nm. Mobile phase A consisted of 0.1% phosphoric acid in water, and mobile phase B was acetonitrile. The following gradient elution program was used: 0–10 min, 8–10% B; 10–20 min, 10–15% B; 20–30 min, 15–15% B; 30–40 min, 15–25% B; 40–60 min, 25–100% B.
2.4. Extraction Experiment
2.4.1. Setup of the Extraction Device
The extraction setup consisted of peristaltic pumps (model DIPump 550, Kachuaner Fluid Technology Co., Ltd., Three Rivers, MI, USA), silicone tubing, vertical glass phase separation tubes (each approximately 15 cm in length, fitted with a light-phase outlet at the top, a heavy-phase outlet at the bottom, and a mixed-phase inlet at the center), and T-shaped tee connectors. The peristaltic pumps delivered the aqueous and organic phases, with a total number of pumps equal to 2k + 2, where k represents the number of extraction stages. The T-shaped tee connectors facilitated rapid mixing of the two liquid phases, while the settling tubes enabled phase separation under static conditions. A photograph and schematic diagram of the apparatus configured for three extraction stages are shown in Figure 2. In the schematic, the flow direction of the heavy phase is indicated by the red arrows in Figure 2b, the light phase by the green arrows, and the mixed stream following the Tee junction by the purple arrows.
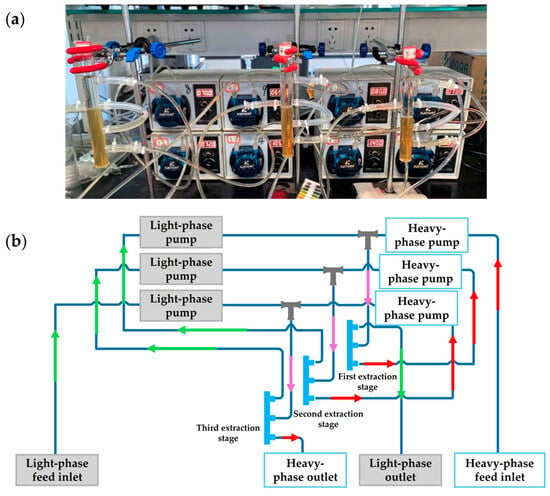
Figure 2.
Continuous countercurrent extraction setup with three extraction stages: (a) Photograph of the apparatus; (b) Schematic diagram of the apparatus.
The extraction system established communication between the computer and the peristaltic pumps via an RS-485 serial interface [21], a robust industrial standard for differential data transmission that supports multi-device communication over long distances, with the computer serving as the master controller. The communication protocol adhered to the Modbus RTU standard. Automated control of the peristaltic pumps was achieved using self-developed “Continuous Micro-Extraction Equipment Control Software V1.0”, programmed in Python (v3.11). Upon launching the software, the user interface (Figure 3) displayed a central module dedicated to controlling the peristaltic pumps, including functions such as speed regulation, flow direction, and start/stop operations.
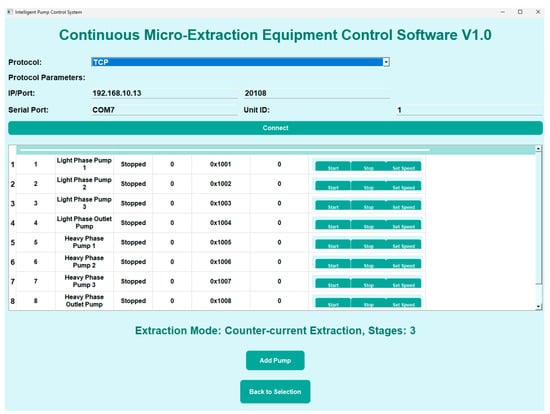
Figure 3.
Software operation interface.
During operation, the aqueous extract of Lonicera japonica (aqueous phase) was introduced through the heavy-phase feed inlet into the k-th extraction stage using the k-th heavy-phase pump. It then flowed sequentially into the (k − 1)-th extraction unit via the (k − 1)-th heavy-phase pump and was finally discharged from the first extraction stage through the heavy-phase outlet pump. After the heavy phase reached steady-state operation within the system, n-butanol (organic phase) was fed through the light-phase inlet using the first-stage light-phase pump into the first extraction unit. It was subsequently transported to the second extraction unit by the second-stage heavy-phase pump and ultimately exited the k-th extraction unit via the light-phase outlet pump.
2.4.2. Determination of Apparent Partition Coefficients
Six 50 mL aliquots of the aqueous extract of Lonicera japonica were placed in conical flasks. A hydrochloric acid solution with a volume fraction of approximately 1% was used to adjust the pH of the extracts to 5.31, 4.74, 3.93, 3.00, 1.62, and 1.21, respectively. Then, 50 mL of n-butanol was added to each flask. The mixtures were stirred magnetically (DLAB, MS-M-S10) for 4 h. After phase separation, 2 mL of each upper and lower phase was collected, centrifuged at 12,000 rpm for 10 min (Minispin, Eppendorf, Hamburg, Germany), and the supernatant was filtered through a 0.22 μm membrane filter. The concentrations of bioactive compounds were quantified using HPLC.
2.4.3. Optimization of Tee Junction Diameter
A total of 2000 mL of the aqueous extract was used as the feed solution with n-butanol as the extraction solvent. Tee junctions with internal diameters of 1.0 mm, 0.80 mm, and 0.75 mm were individually employed as the mixing unit in the continuous multistage extraction setup. The flowrate ratio (organic phase–aqueous phase) was maintained at 1:1, with a total flowrate of 20 mL/min for both phases. A single extraction stage was used, and the pH of the feed solution was 5.39. After extraction, 2 mL samples from both organic and aqueous phases were collected, centrifuged at 12,000 rpm for 10 min, filtered through a 0.22 μm membrane, and analyzed via HPLC.
2.4.4. Optimization of Flowrate
A volume of 2000 mL of the aqueous extract was used as the feed solution with n-butanol as the solvent. Experiments were conducted at total flowrates of 5 mL/min, 10 mL/min, and 20 mL/min for both phases. The phase ratio (organic–aqueous) was 1:1, with one extraction stage, a feed pH of 5.39, and a tee junction diameter of 0.75 mm. After extraction, 2 mL of each phase was centrifuged (12,000 rpm, 10 min), filtered, and quantitatively analyzed by HPLC.
2.4.5. Optimization of Phase Flow Ratio
A volume of 2500 mL of the aqueous extract was used as the feed with n-butanol as the extraction solvent. The solvent flow ratio (organic–aqueous) was varied at 0.5:1, 1:1, 2:1, and 4:1. The aqueous phase flowrate was fixed at 20 mL/min. Three extraction stages were used, with a feed pH of 5.39 and a tee junction internal diameter of 0.75 mm. After extraction, 2 mL of each phase was centrifuged (12,000 rpm, 10 min), filtered, and quantitatively analyzed by HPLC.
2.4.6. Optimization of Extraction Stages
A volume of 2000 mL of the aqueous extract was used as the aqueous phase with n-butanol as the organic phase. Experiments were carried out using one, two, and three extraction stages. The phase flow ratio (organic–aqueous) was set to 4:1, with the aqueous phase flowrate fixed at 20 mL/min. The tee junction diameter was 0.75 mm, and the feed pH was 5.39. After extraction, 2 mL of each phase was centrifuged (12,000 rpm, 10 min), filtered, and quantitatively analyzed by HPLC.
2.5. Data Processing
2.5.1. Fitting of Apparent Partition Coefficients
The partition coefficients of the six phenolic acids were calculated using Equation (1):
where represents the apparent partition coefficient of the target compound, and and denote the concentrations of the target compound in the organic and aqueous phases, respectively.
For the correlation between apparent partition coefficients and pKa, the nonlinear fitting equation derived by Gong et al. [22] was applied (Equation (2)):
where and represent the partition coefficients of the molecular form and the first dissociated form of the phenolic acid, respectively. To improve the reliability of the fitting, both sides of Equation (2) were transformed by taking base-10 logarithms, yielding Equation (3):
where and .
2.5.2. Stage Efficiency and Extraction Rate in Single-Stage Extraction
The Murphree stage efficiency for single-stage extraction was calculated using Equations (4) and (5) [23]:
where C denotes concentration (mass/volume), and η represents the stage efficiency (%). Subscripts org, aq, in, out, and eq refer to the organic phase, aqueous phase, inlet, outlet, and liquid–liquid equilibrium, respectively.
The extraction rate of the six phenolic acids was calculated according to Equation (6):
where E is the relative extraction rate (%), is the mass (mg) of the target compound extracted into the solvent, and m is the total mass (mg) of the target compound.
2.5.3. Performance Evaluation of Continuous Multistage Extraction
For multistage extraction, material balance was performed for each component to sequentially compute the outlet concentrations of both phases after each extraction stage. The yield and purity of each component were determined based on the compositions at the first-stage outlet and the final-stage outlet. The material balance is described by Equations (7) and (8):
where F represents the flow rate (volume/time), C is the concentration (mass/volume), is the arithmetic mean of and , superscripts org and aq denote the organic and aqueous phases, and subscripts in, out, and i refer to the inlet, outlet, and extraction stage number, respectively.
The purity and yield of each component in both phases were calculated using Equations (9) to (12):
where ω is the purity (%), Y is the yield (%), subscript α refers to the component, is the concentration of component α in the feed, and is the flow rate of the feed solution.
3. Results
3.1. Apparent Partition Coefficients and pKa Values of Bioactive Compounds
A representative chromatogram of the bioactive compounds in honeysuckle is shown in Figure 4, and further calculations were performed based on the chromatographic peak areas. The UV absorption spectra of the respective active compounds are depicted in Figure 5.
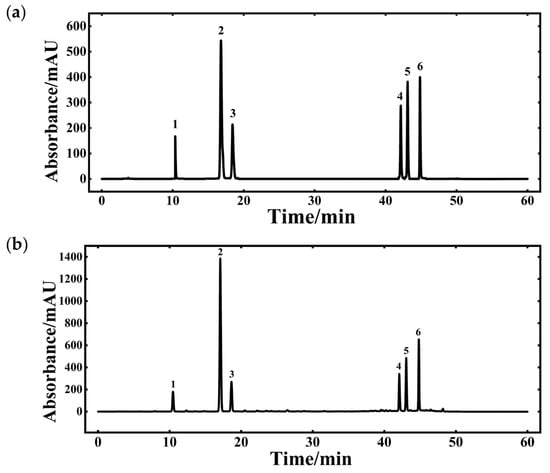
Figure 4.
HPLC chromatogram of bioactive compounds in Lonicera japonica: (a) Chromatogram of the standard mixture; (b) Chromatogram of the sample (1: Neochlorogenic acid; 2: Chlorogenic acid; 3: Cryptochlorogenic acid; 4: Isochlorogenic acid A; 5: Isochlorogenic acid B; 6: Isochlorogenic acid C).
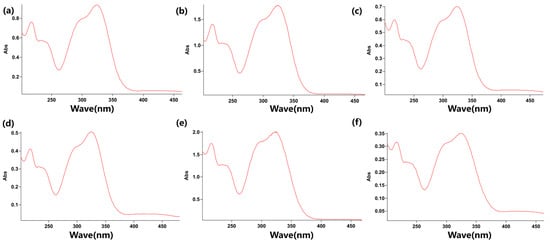
Figure 5.
Representative UV absorption spectra of the bioactive compounds in Lonicera japonica: (a) Neochlorogenic acid; (b) Chlorogenic acid; (c) Cryptochlorogenic acid; (d) Isochlorogenic acid A; (e) Isochlorogenic acid B; (f) Isochlorogenic acid C.
The apparent partition coefficients of the six phenolic acids under liquid–liquid equilibrium in the n-butanol–water system were fitted using Equation (2) in Section 2.5.1 via Origin Pro software (Version 2025b Academic). The fitting results are presented in Figure 6. Within the liquid–liquid equilibrium system, the apparent partition coefficients of all six phenolic acids increased with decreasing aqueous pH and reached a plateau at pH ≤ 3.0. At higher pH values, the phenolic acids predominantly existed in the dissociated ionic form, which resulted in higher solubility in the aqueous phase and lower partition coefficients. Under acidic conditions (low pH), the compounds remained primarily in their molecular form, leading to increased solubility in the organic phase. Under identical aqueous pH conditions, chlorogenic acid exhibited the lowest apparent partition coefficient, whereas isochlorogenic acid B showed the highest. The apparent partition coefficients of neochlorogenic acid, chlorogenic acid, and cryptochlorogenic acid were all below 0.4, while those of isochlorogenic acids A, B, and C consistently exceeded 2.
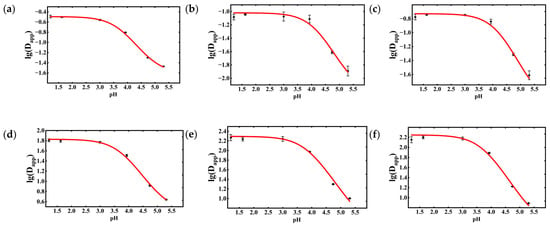
Figure 6.
Experimental and fitted results of the apparent partition coefficients for the six phenolic acids: (a) Neochlorogenic acid; (b) Chlorogenic acid; (c) Cryptochlorogenic acid; (d) Isochlorogenic acid A; (e) Isochlorogenic acid B; (f) Isochlorogenic acid C. Data are shown as the mean ± standard deviation (n = 3).
The fitted parameters d0, d1, and pKa values for the six phenolic acids are summarized in Table 1. The R2 values for all six chlorogenic acids exceeded 0.9, indicating excellent goodness-of-fit. The fitted pKa values of the phenolic acids ranged between 3.7 and 4.3.

Table 1.
Fitted parameters d0, d1, and pKa values of the six phenolic acids. Data are shown as the mean ± standard deviation (n = 3).
The pKa values obtained in this study were compared with previously reported literature values, as shown in Table 2. The results indicate that the fitted pKa values of isochlorogenic acids A, B, and C were in close agreement with those reported by Wang et al. [24]. Similarly, the pKa values of neochlorogenic acid, chlorogenic acid, and cryptochlorogenic acid were consistent with the values reported by Tang et al. [25], thereby supporting the reliability of the obtained results.

Table 2.
Comparison of pKa values from this study with literature values (n = 3).
3.2. Effect of Tee Junction Diameter on Continuous Countercurrent Extraction
Under mechanically stirred liquid–liquid equilibrium conditions (phase ratio 1:1), the extraction yields were determined as follows: neochlorogenic acid: 3.54 ± 0.02%, chlorogenic acid: 0.102 ± 0.028%, cryptochlorogenic acid: 4.06 ± 1.31%, isochlorogenic acid A: 73.3 ± 0.7%, isochlorogenic acid B: 69.1 ± 0.8%, isochlorogenic acid C: 80.9 ± 0.3%.
The Murphree stage efficiencies of the six phenolic acids in both phases after extraction using tee junctions with internal diameters of 1.0 mm, 0.80 mm, and 0.75 mm are summarized in Table 3. A decrease in the diameter of the T-shaped tee junction resulted in an increase in the stage efficiencies of the target compounds in both the organic and aqueous phases, which can be attributed to the reduced droplet diameter at the microscale mixing point, leading to an enlarged interfacial area between the two phases.

Table 3.
Murphree stage efficiencies (%) of the six phenolic acids in both phases after tee junction diameter experiment (n = 3).
The extraction yields of the six phenolic acids in both phases are summarized in Table 4. As the internal diameter of the T-shaped tee junction decreased, the extraction yields of the phenolic acids increased.

Table 4.
Extraction yields (%) of the six phenolic acids after tee junction diameter experiment (n = 3).
The contents of the six phenolic acids in the total solids of the extracted aqueous solution are presented in Table 5. Variations in the tee diameter did not significantly influence the proportion of phenolic acids in the total solids. Among all the compounds, chlorogenic acid exhibited the highest content in the total solids.

Table 5.
Content of phenolic acids in the total solids after tee junction diameter experiment (unit: mg/g) (n = 3).
The highest stage efficiency and extraction yield for all six phenolic acids were achieved using a tee junction with an internal diameter of 0.75 mm. Therefore, this diameter was selected for all subsequent continuous countercurrent extraction experiments.
3.3. Effect of Flow Rate on Continuous Countercurrent Extraction
The Murphree stage efficiencies of the six phenolic acids in both phases after extraction under total flowrates of 5 mL/min, 10 mL/min, and 20 mL/min (for both organic and aqueous phases) are summarized in Table 6. An increase in the flowrates of both phases resulted in an increase in the stage efficiencies of the target compounds in both the organic and aqueous phases, which can be attributed to the enhanced linear velocity of droplets within the tee junction at higher flow rates. This increase in velocity augments the shear forces acting on the droplets, thereby intensifying the mixing and improving the overall mass transfer efficiency.

Table 6.
Murphree stage efficiencies (%) of the six phenolic acids in both phases after flow rate experiment (n = 3).
The extraction yields of the six phenolic acids in both phases are presented in Table 7. The extraction yields of the phenolic acids increased with higher flowrate. The highest extraction yields for isochlorogenic acids A, B, and C reached 29.6%, 36.9%, and 34.7%, respectively, which were significantly higher than those of the first three phenolic acids.

Table 7.
Extraction yields (%) of the six phenolic acids after flow rate experiment (n = 3).
The contents of the six phenolic acids in the total solids of the extracted aqueous solution are shown in Table 8. Chlorogenic acid exhibited the highest content in the total solids. The highest stage efficiency and extraction yield for all six phenolic acids were achieved when the flowrates of both the organic and aqueous phases were set at 20 mL/min. Therefore, a flowrate of 20 mL/min was selected for all subsequent extraction experiments.

Table 8.
Content of phenolic acids in the total solids after flow rate experiment (unit: mg/g) (n = 3).
3.4. Effect of Phase Ratio on Continuous Countercurrent Extraction
The Murphree stage efficiencies of the six phenolic acids in both phases after extraction under organic-to-aqueous phase ratios of 0.5:1, 1:1, 2:1, and 4:1, with the aqueous phase flowrate fixed at 20 mL/min, are summarized in Table 9. As the proportion of the organic phase increased, the stage efficiencies of the target compounds in both the organic and aqueous phases also increased, which can be attributed to the expanded capacity of the organic phase to accommodate a greater amount of the active compounds, thereby enhancing the extraction stage efficiency.

Table 9.
Murphree stage efficiencies (%) of the six phenolic acids in both phases after phase ratio experiment (n = 3).
The extraction yields of the six phenolic acids in both phases are presented in Table 10. The extraction yields of the phenolic acids increased with higher organic phase ratios. The highest extraction yields for isochlorogenic acids A, B, and C were 45.9%, 58.7%, and 54.8%, respectively, which were significantly higher than those of the first three phenolic acids. The highest extraction yields for all six phenolic acids were achieved at a phase ratio of 4:1.

Table 10.
Extraction yields (%) of the six phenolic acids after phase ratio experiment (n = 3).
The contents of the six phenolic acids in the total solids of the extracted aqueous solution are shown in Table 11. Chlorogenic acid exhibited the highest content in the total solids. After extraction, the contents of neochlorogenic acid, chlorogenic acid, and cryptochlorogenic acid in the total solids showed an increasing trend with higher organic phase ratios. In contrast, the proportions of isochlorogenic acids A, B, and C in the total solids decreased at a phase ratio of 4:1.

Table 11.
Content of phenolic acids in the total solids after phase ratio experiment (unit: mg/g) (n = 3).
The highest stage efficiency and extraction yield for all six phenolic acids were achieved at an organic-to-aqueous phase ratio of 4:1. Therefore, this ratio was selected for all subsequent extraction experiments.
3.5. Effect of Number of Extraction Stages on Continuous Countercurrent Extraction
The extraction yields of the six phenolic acids in both phases after extraction using one, two, and three stages are summarized in Table 12. As the number of extraction stages increased from one to three, the extraction yields of all six phenolic acids showed a significant upward trend. When three extraction stages were employed, the extraction yields of neochlorogenic acid, chlorogenic acid, isochlorogenic acid A, isochlorogenic acid B, and isochlorogenic acid C were significantly higher than those obtained under liquid–liquid equilibrium conditions. Increasing the number of extraction stages also contributed to reduced solvent consumption [26].

Table 12.
Extraction yields (%) of the six phenolic acids after number of extraction stages experiment (n = 3).
The contents of the six phenolic acids in the total solids of the extracted aqueous solution are presented in Table 13. After extraction, the contents of neochlorogenic acid, chlorogenic acid, and cryptochlorogenic acid in the total solids increased with the number of extraction stages, while the proportions of isochlorogenic acids A, B, and C decreased. After three stages of continuous countercurrent extraction, the content of chlorogenic acid in the total solids increased from 50.8 mg/g to 70.1 mg/g.

Table 13.
Content of phenolic acids in the total solids after number of extraction stages experiment (unit: mg/g) (n = 3).
The continuous countercurrent extraction process under different numbers of stages was simulated using MATLAB software (R2022b, MathWorks Inc., Natick, MA, USA) and an in-house developed “Continuous Multistage Extraction Calculation Software V1.0” [27]. The simulation results are compared with the experimentally measured values in Figure 7. The simulated concentrations of the six phenolic acids showed good agreement with the experimental data.
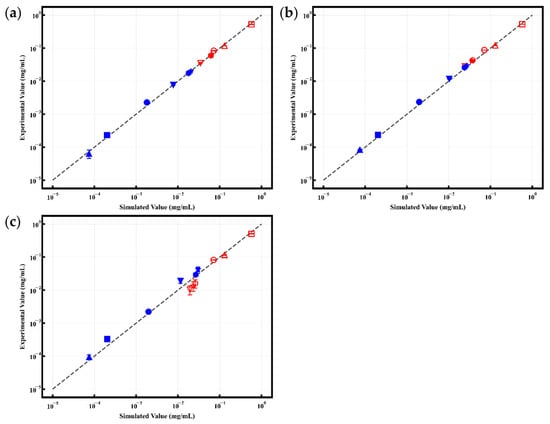
Figure 7.
Comparison of simulated and experimental results: (a) Single-stage continuous extraction; (b) Two-stage continuous extraction; (c) Three-stage continuous extraction (●: neochlorogenic acid; ■: chlorogenic acid; ▲: cryptochlorogenic acid; ▼: isochlorogenic acid A; ★: isochlorogenic acid B; ⬣: isochlorogenic acid C; solid symbols represent the organic phase, hollow symbols represent the aqueous phase) (n = 3).
The optimized extraction conditions determined experimentally were as follows: pH = 5.39, tee junction diameter = 0.75 mm, aqueous phase flowrate = 20 mL/min, phase flow ratio = 4:1 (organic-to-aqueous), and number of extraction stages = 3.
4. Conclusions
This study developed an automated multistage countercurrent extraction device that enables precise control of the extraction process. The system, comprising peristaltic pumps, T-shaped tee connectors, and phase separation units, integrated with self-developed “Continuous Micro-Extraction Equipment Control Software V1.0,” allows automated adjustment of parameters such as phase flow rates and the number of extraction stages, facilitating convenient operation.
Using an aqueous extract of Lonicera japonica as the feed solution, the effects of liquid–liquid equilibrium pH, tee diameter, phase flow ratio, and number of extraction stages on the separation efficiency of six phenolic acids (neochlorogenic acid, chlorogenic acid, cryptochlorogenic acid, and isochlorogenic acids A, B, and C) were investigated. The results demonstrated that the apparent partition coefficients of the six chlorogenic acids increased with decreasing aqueous pH. The partition coefficients of the six phenolic acids ranged from 0.09 to 195, while the partition coefficients of their dissociated forms ranged from 0.005 to 2.6. The pKa values of the six phenolic acids fell within the range of 3.7–4.3, which is consistent with previously reported literature values.
Reducing the tee diameter (0.75 mm) enhanced mass transfer efficiency. Increasing the flowrate (20 mL/min), organic phase ratio (4:1), and number of extraction stages (3 stages) significantly improved the extraction yields. After three stages of countercurrent extraction, the content of chlorogenic acid in the total solids increased from 50.3 mg/g to 70.1 mg/g. The predictions from the in-house developed “Continuous Multistage Extraction Calculation Software V1.0” were in good agreement with the experimental values.
Future development of this research should prioritize the following aspects: gradually increasing processing flow rates during scale-up, enhancing mass transfer by incorporating additional micromixing modules within each extraction stage, and systematically optimizing operational parameters to meet the requirements of large-scale production. For future technological evolution, the introduction of multi-sensor fusion strategies—such as visual inspection technology for real-time monitoring of phase interfaces and liquid levels—combined with AI algorithms for process data modeling and self-learning, is recommended to advance the apparatus toward self-perceiving, self-deciding, and self-optimizing intelligent systems. Concurrently, it is essential to actively embrace the principles of green chemistry by exploring alternative environmentally benign solvents, optimizing process flows to reduce energy consumption and waste emissions, and ultimately establishing an efficient, clean, and sustainable technological platform for the extraction of TCM.
Author Contributions
Conceptualization, X.G.; Methodology, X.G.; Software, Y.F. and Q.W.; Validation, Y.F.; Data curation, Y.F.; Writing—original draft, Y.F.; Writing—review & editing, Q.W. and G.Z.; Supervision, X.G.; Project administration, X.G.; Funding acquisition, X.G. All authors have read and agreed to the published version of the manuscript.
Funding
This research was supported by the National Key Research and Development Program of China (Grant No. 2024YFC3506900).
Data Availability Statement
The original contributions presented in this study are included in the article. Further inquiries can be directed to the corresponding author.
Conflicts of Interest
The authors declare no conflicts of interest.
References
- Rutkowska, M.; Płotka-Wasylka, J.; Sajid, M.; Andruch, V. Liquid–phase microextraction: A review of reviews. Microchem. J. 2019, 149, 103989. [Google Scholar] [CrossRef]
- Zheng, W.; Wu, Y.; Gao, H.; Ouyang, D. Traditional Chinese medicine injections: Where we are after 80-year development. Chin. Med. 2022, 17, 127. [Google Scholar] [CrossRef] [PubMed]
- Weeranoppanant, N.; Adamo, A.; Saparbaiuly, G.; Rose, E.; Fleury, C.; Schenkel, B.; Jensen, K.F. Design of Multistage Counter-Current Liquid–Liquid Extraction for Small-Scale Applications. Ind. Eng. Chem. Res. 2017, 56, 4095–4103. [Google Scholar] [CrossRef]
- Cansino-Jácome, F.; Méndez-Campos, G.K.; Hidalgo-Morales, M.; García-Alvarado, M.A.; Rodríguez-Jimenes, G.C. Extraction of bioactive compounds from papaya leaves (Carica papaya L.) by multistage countercurrent extraction as function of solvent polarity and temperature. Food Chem. 2025, 488, 144824. [Google Scholar] [CrossRef]
- Du, C.; Wang, J.; Wang, Y.; Deng, J.; Luo, G. Microdroplet-based continuous countercurrent extraction with high phase ratio. Sep. Purif. Technol. 2022, 295, 121269. [Google Scholar] [CrossRef]
- Zhang, F.; Shi, P.; Liu, H.; Zhang, Y.; Yu, X.; Li, J.; Pu, G. A Simple, Rapid, and Practical Method for Distinguishing Lonicerae Japonicae Flos from Lonicerae Flos. Molecules 2019, 24, 3455. [Google Scholar] [CrossRef] [PubMed]
- Wu, Q.; Zhao, D.; Leng, Y.; Chen, C.; Xiao, K.; Wu, Z.; Chen, F. Identification of the Hypoglycemic Active Components of Lonicera japonica Thunb. and Lonicera hypoglauca Miq. by UPLC-Q-TOF-MS. Molecules 2024, 29, 4848. [Google Scholar] [CrossRef]
- Navarro-Orcajada, S.; Matencio, A.; Vicente-Herrero, C.; García-Carmona, F.; López-Nicolás, J.M. Study of the fluorescence and interaction between cyclodextrins and neochlorogenic acid, in comparison with chlorogenic acid. Sci. Rep. 2021, 11, 3275. [Google Scholar] [CrossRef]
- Holowinski, P.; Dawidowicz, A.L.; Typek, R. Chlorogenic acid-water complexes in chlorogenic acid containing food products. J. Food Compos. Anal. 2022, 109, 104509. [Google Scholar] [CrossRef]
- Li, J.; Wang, S.-P.; Wang, Y.-Q.; Shi, L.; Zhang, Z.-K.; Dong, F.; Li, H.-R.; Zhang, J.-Y.; Man, Y.-Q. Comparative metabolism study on chlorogenic acid, cryptochlorogenic acid and neochlorogenic acid using UHPLC-Q-TOF MS coupled with network pharmacology. Chin. J. Nat. Med. 2021, 19, 212–224. [Google Scholar] [CrossRef] [PubMed]
- Nie, R.; Dang, M.; Ge, Z.; Huo, Y.; Yu, B.; Tang, S. Interactions of chlorogenic acid and isochlorogenic acid A with model lipid bilayer membranes: Insights from molecular dynamics simulations. Chem. Phys. Lipids 2021, 240, 105136. [Google Scholar] [CrossRef]
- Shi, J.-X.; Cheng, C.; Ruan, H.-N.; Li, J.; Liu, C.-M. Isochlorogenic acid B alleviates lead-induced anxiety, depression and neuroinflammation in mice by the BDNF pathway. NeuroToxicology 2023, 98, 1–8. [Google Scholar] [CrossRef] [PubMed]
- Xu, J.-Y.; Rong, X.-J.; Shen, Z.; Guo, Y.-D.; Zhang, Y.-X.; Ding, C.-C.; Wang, Y.; Han, Y.-X.; Gao, T.-L.; Tie, C. Isochlorogenic Acid C Alleviates Allergic Asthma via Interactions Between Its Bioactive Form and the Gut Microbiome. Int. J. Mol. Sci. 2025, 26, 4864. [Google Scholar] [CrossRef]
- Su, X.; Zhu, Z.-h.; Zhang, L.; Wang, Q.; Xu, M.-m.; Lu, C.; Zhu, Y.; Zeng, J.; Duan, J.-A.; Zhao, M. Anti-inflammatory property and functional substances of Lonicerae Japonicae Caulis. J. Ethnopharmacol. 2021, 267, 113502. [Google Scholar] [CrossRef]
- Zheng, S.; Liu, S.; Hou, A.; Wang, S.; Na, Y.; Hu, J.; Jiang, H.; Yang, L. Systematic review of Lonicerae Japonicae Flos: A significant food and traditional Chinese medicine. Front. Pharmacol. 2022, 13, 1013992. [Google Scholar] [CrossRef]
- Li, H.; Yang, B.; Ge, W.; Cao, Z.; Cao, L.; Yu, Y.; Wang, Z.; Yao, X.; Xiao, W. Two new terpenoids from Reduning Injection. Chin. Herb. Med. 2020, 12, 183–187. [Google Scholar] [CrossRef]
- Cui, L.; Wang, L.; Xu, D.; Wang, Z.; Chen, Y.; Song, X.; Xu, F.; Gao, S.; Huang, L.; Tao, X.; et al. Pharmacokinetic study of the main components of Tanreqing capsules and Tanreqing injections in beagles by liquid chromatography–tandem mass spectrometry. Chin. Med. 2022, 17, 135. [Google Scholar] [CrossRef] [PubMed]
- Martínez, J.A.; Cutillas, V.; Manzano-Sanchez, L.; Fernández-Alba, A.R. Automation in food safety: Pressurized liquid extraction for pesticide analysis in coffee. Talanta 2026, 298, 128914. [Google Scholar] [CrossRef] [PubMed]
- Marco, A.; Pertusa, B.; Aguirre, M.Á.; Quijada, C.; Hidalgo, M. Sensitive elemental analysis of edible oil samples using a hydrophilic eutectic mixture as green solvent in electrochemically controlled liquid-liquid microextraction. Anal. Chim. Acta 2025, 344785. [Google Scholar] [CrossRef]
- Wang, L.; Liu, H.; Zhang, J.; Li, J.; Zhang, Y. Simultaneous Determination of Eight Active Components in Lonicera japonica by Quantitative Analysis of Multi-Components by Single Marker and External Standard Method. China J. Exp. Tradit. Med. Formulae 2014, 20, 57–61. [Google Scholar] [CrossRef]
- Bian, L. Brief Analysis of EIA-485 Communication in Automatic Control Systems. Green Build. Intell. Archit. 2024, 07, 108–114. [Google Scholar]
- Gong, X.; Huang, S.; Jiao, R.; Pan, J.; Li, Y.; Qu, H. The determination of dissociation constants for active ingredients from herbal extracts using a liquid–liquid equilibrium method. Fluid Phase Equilibria 2016, 409, 447–457. [Google Scholar] [CrossRef]
- Gonda, K.; Miyachi, S.; Fukuda, S. Stage Efficiency for Mixer-Settlers Process with Chemical Reactions. J. Nucl. Sci. Technol. 1986, 23, 279–281. [Google Scholar] [CrossRef]
- Wang, W.; Zheng, B.; Wu, J.; Lv, W.; Lin, P.; Gong, X. Determination of the Dissociation Constants of 16 Active Ingredients in Medicinal Herbs Using a Liquid–Liquid Equilibrium Method. Separations 2021, 8, 49. [Google Scholar] [CrossRef]
- Tang, B.; Huang, Y.; Ma, X.; Liao, X.; Wang, Q.; Xiong, X.; Li, H. Multispectroscopic and docking studies on the binding of chlorogenic acid isomers to human serum albumin: Effects of esteryl position on affinity. Food Chem. 2016, 212, 434–442. [Google Scholar] [CrossRef] [PubMed]
- Matsutani, T.; Sasaki, Y.; Katsuta, S. Separation of Light and Middle Lanthanides Using Multistage Extraction with Diglycolamide Extractant. Anal. Sci. 2021, 37, 1603–1609. [Google Scholar] [CrossRef] [PubMed]
- Zhejiang University. Continuous Multistage Extraction Efficiency Calculation Software V1.0 [CP]; MathWorks Inc.: Natick, MA, USA, 2022. [Google Scholar]
Disclaimer/Publisher’s Note: The statements, opinions and data contained in all publications are solely those of the individual author(s) and contributor(s) and not of MDPI and/or the editor(s). MDPI and/or the editor(s) disclaim responsibility for any injury to people or property resulting from any ideas, methods, instructions or products referred to in the content. |
© 2025 by the authors. Licensee MDPI, Basel, Switzerland. This article is an open access article distributed under the terms and conditions of the Creative Commons Attribution (CC BY) license (https://creativecommons.org/licenses/by/4.0/).