Abstract
Microcystins (MCs) and nodularins (NODs) are cyanotoxins that can be found in water bodies during cyanobacterial harmful algal blooms (cyanoHABs). Consumption of water contaminated with cyanotoxins leads to health risks for humans and animals. Herein, corncob-based biochar and activated carbon (AC) were initially investigated for the sorption of six common MC congeners (MC-RR, MC-YR, MC-LR, MC-LA, MC-LW, and MC-LF) and nodularin-R (NOD-R) from spiked water. Biochar was prepared by refluxing commercial corncob with HCl and heating it to 250, 300, or 350 °C. AC was prepared by chemical activation of corncob with H3PO4 at 500 °C under a nitrogen atmosphere. Low-temperature nitrogen adsorption measurements confirmed that H3PO4-AC has a higher specific surface area (≈1100 m2/g) and total pore volume (≈0.75 cm3/g) than biochar and commercial AC. H3PO4-AC showed the maximum efficacy, among all corncob-based sorbents, to remove MCs and NOD-R from water as confirmed by experiments that involved sample analyses by ultrahigh-pressure liquid chromatography-mass spectrometry (UHPLC-MS). The effect of natural organic matter (NOM) on the adsorption of MCs was checked by incubating sorbents with Lake Erie water collected during cyanoHABs from 2020 to 2022. The total concentration (extracellular and intracellular) of studied MC congeners ranged from 1.37 µg/L to 438.51 µg/L and 50 mg of H3PO4-AC completely removed them from 3 mL of lake water. The effect of water pH on cyanotoxin adsorption was studied at pH values of 5.5, 7.0, and 8.5 at both a lower (10 μg/L each) and a higher (50 μg/L each) toxin concentration. Removal was influenced by solution pH at both concentrations when using biochar, while only at higher toxin concentration when using H3PO4-AC. At higher MC and NOD-R concentrations, competitive adsorption was prominent, and overall, the adsorption increased at acidic pH (5.5). The study results suggest that processed corncobs can remove a significant amount of MCs and NOD-R from water, and the measured sorption capacity of H3PO4-AC was ~20 mg of MC-LR and NOD-R per g of this sorbent.
1. Introduction and Background
As a result of anthropogenic activities, nutrient loading into the water environment has increased. This has caused the eutrophication of aquatic bodies and has intensified the prevalence of HABs in marine, fresh, and brackish water [1]. Among environmental variables that can promote the occurrence of HABs are nutrient concentration, light intensity, water movement, temperature, salinity, and stagnation [2,3]. HABs affect aquatic systems as well as human health, and cyanobacteria are the major contributors to cyanoHABs. Cyanobacteria produce hepatotoxins, such as microcystins (MCs) and nodularins (NODs), as secondary metabolites [4]. The most widespread regularly found cyanobacterial toxins in freshwater blooms are the cyclic heptapeptides microcystins [5]. NODs are cyclic pentapeptides with closely related structures [6].
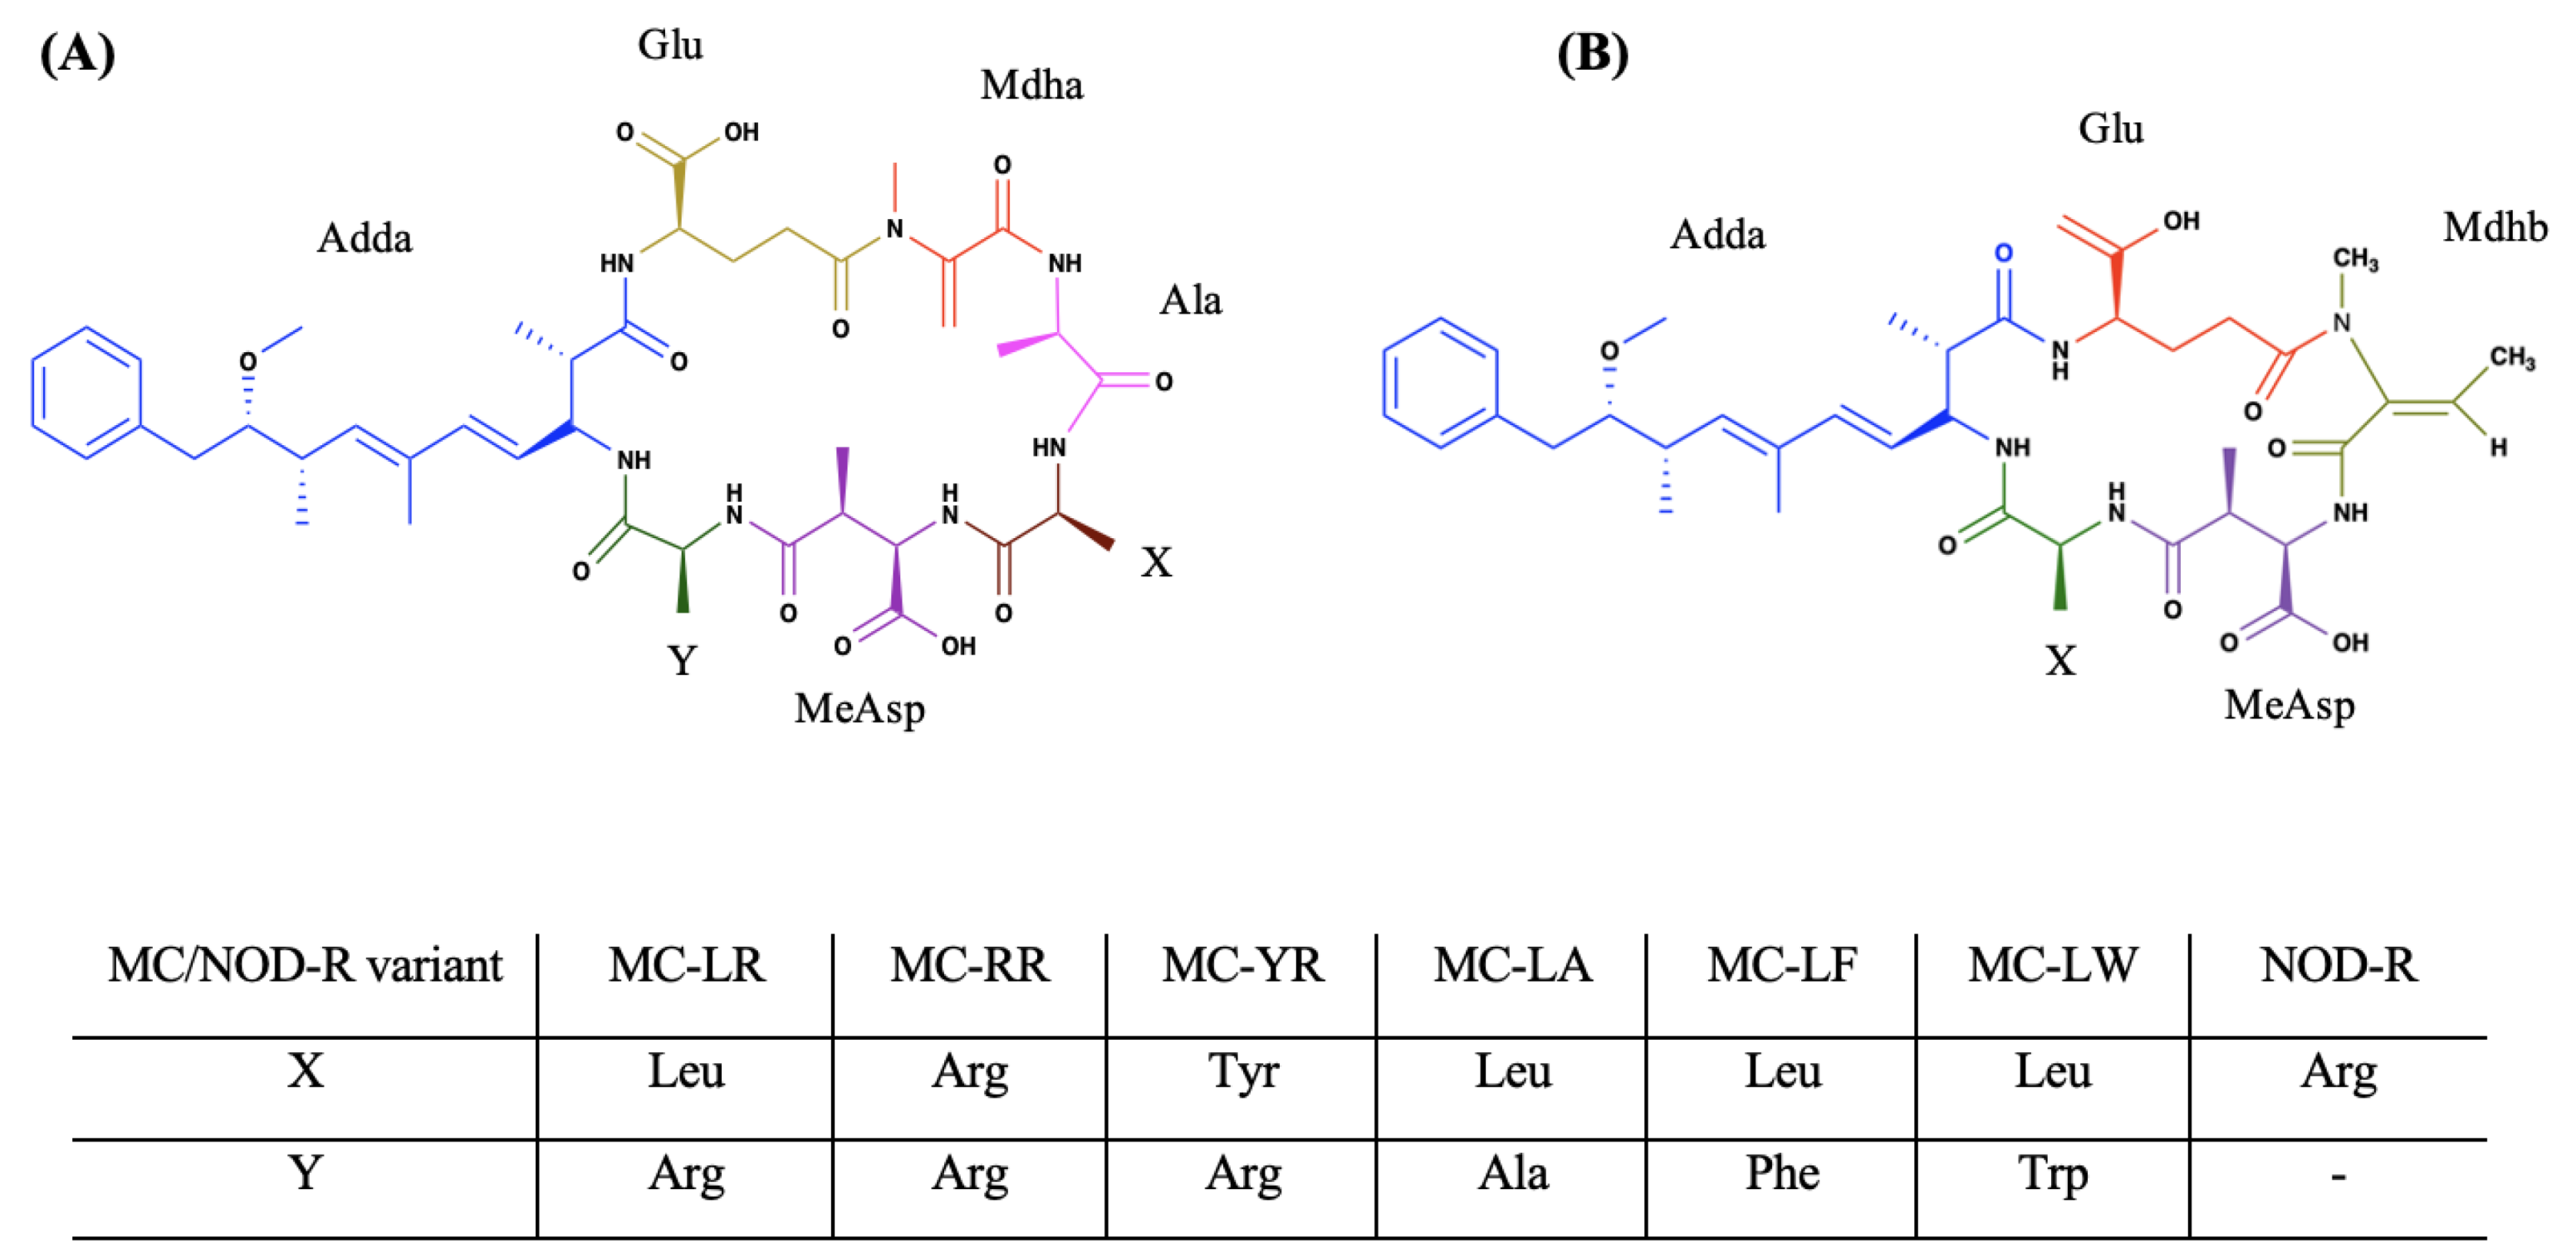
MCs contain two variable amino acids (in positions 2 and 4) and five mostly conserved amino acids (Figure 1A) and have molecular masses from 900 to 1200 Da. Due to the modifications of side chains and variability of amino acids in the MC structure, more than 300 MC congeners have been identified [7,8]. MC-LR, which has leucine in the second position and arginine in the fourth position, is the most prominent in HAB-contaminated aquatic environments, but other MC congeners, including MC-RR, MC-LA, and MC-YR, were predominant forms in some blooms [9,10]. Both MCs and NODs (Figure 1B) contain unusual 3-amino-9-methoxy-2,6,8-trimethyl-10-phenyldeca-4,6-dienoic acid (Adda) and d-erythro-β-methylaspartic acid (D-MeAsp) [11]. NOD contains a 2-(methylamino)-2-dehydrobutyric acid (Mdhb) residue, while MCs have a methyl dehydroalanine (Mdha) residue. So far, more than 16 NOD congeners have been identified, and NOD-R, which has arginine in the variable amino acid position, is the most abundant in natural blooms [7,12]. The toxicity of both MCs and NODs is mostly due to their characteristic Adda moiety [6]. These cyclic heptapeptides and pentapeptides are inhibitors of serine/threonine-specific protein phosphatases 1 and 2A and act as tumor promoters [13].
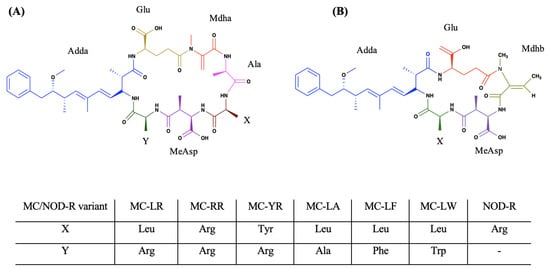
Figure 1.
General structures of (A) microcystin and (B) nodularin with their variable amino acids shown in the table.
Consumption of cyanotoxin-contaminated water, fish, and shellfish or inhalation and/or ingestion during recreational activities at lakes and rivers affected by HABs can promote health risks for humans [14]. Therefore, the United States Environmental Protection Agency (US EPA) has established a safe drinking water guidance value for pre-school age children as 0.3 µg/L for total MCs [15]. During the summer of 2014, HABs dominated by MC-producing cyanobacterium Microcystis aeruginosa contaminated the Western Lake Erie Basin, which is the source of drinking water for the City of Toledo. Since the total MC level was recorded as 2.5 µg/L even after water treatment, the City of Toledo issued a three-day “do not drink” water advisory and declared a state of emergency [16].
Water treatment facilities use several advanced methods to remove MCs and other cyanotoxins from drinking water. Some conventional methods include coagulation, sedimentation, and filtration [17,18,19]. These methods can generally remove intact cyanobacterial cells, which contain intracellular cyanotoxins. In addition, the large molecular size, high stability, and cyclic structures of MCs make these methods less efficient in removing MCs from water [20]. Extracellular cyanotoxin removal can be done by using techniques such as advanced oxidation processes (e.g., O3/H2O2, UV/O3, H2O2/Fe2+), chlorination, ultraviolet decomposition, and biodegradation [21]. However, the toxicities of possible by-products from the above methods have not been investigated adequately [22]. Adsorption is one of the most convenient and effective treatment methods for cyanotoxin-contaminated water. Most water treatment facilities use AC, sand, or clay as adsorbents [22]. Among them, AC has been shown to be the most efficient adsorbent due to its large surface area and high porosity [23,24,25]. Therefore, several types of carbon precursors, which are not renewable or whose exploitation is damaging to the environment, have been used for AC preparation, such as wood, coal, peat, and coconut [26,27,28]. AC can be used in powdered form (PAC) or granular form (GAC). GAC is used in filter columns or beds and can be regenerated at a high cost [29]. PAC is mixed with the sludge when recovered and it is not typically regenerated [30]. Moreover, due to the lack of availability, increasing production costs, and unbalanced demand and supply, the price of AC has increased. Those factors also may restrict its large-scale application [31]. As a consequence, several studies have been reported which include the production of adsorbents or AC from agricultural waste such as rice husk, peanut hull, almond shells, Kentucky blue grass, and Bermuda grass [32,33,34,35,36,37,38,39,40]. This shows that cheap materials with low inorganic and high carbon content are effective precursors to produce biochar and AC.
Corn, also known as maize, is one of the most widely cultivated crops around the world, and corncobs are generated during corn processing. For every 100 kg of corn grains, approximately 18 kg of corncobs are produced [41]. Corncobs are mostly unused and are usually discarded or burnt [42]. Such practices contribute to air pollution [43,44]. Corncobs contain high-carbon compounds in the forms of cellulose (40–45%), hemicellulose (30–35%), and lignin (10–20%) [45]. Previous studies have shown that chemically or physically modified corncobs can be used to remove heavy metals, oil, and synthetic dyes from water [46,47]. With the amount of corn produced in the United States, it would be beneficial to use corncob agricultural waste, which is widely available in Lake Erie and Midwest regions, for the removal of cyanobacterial toxins.
In this study, the preparation of biochar and powdered AC from raw corncob is described first. In the process of AC preparation, chemical activation, which offers several advantages over physical activation, was used. The most important advantage of chemical activation is that the process results in high carbon yield and high surface area. During the process of chemical activation, raw materials are impregnated with an activation agent (KOH, NaOH, Na2CO3, ZnCl2, H3PO4, or H2SO4) and then heat-treated under an inert atmosphere. Herein, H3PO4 acid was used for the activation of corncobs since it presents itself as a low-cost and environment-friendly activation agent [48]. Moreover, H3PO4 is easy to recover by washing with water after the carbonization [49]. Changes in surface chemical and physical properties of carbonized corncobs were characterized and analyzed.
Secondly, the simultaneous removal of six common MC congeners (MC-RR, MC-YR, MC-LR, MC-LA, MC-LW, and MC-LF) and NOD-R from water by adsorption on charred corncobs and corncob-derived activated carbon is described. The effect of NOM and water pH on removal is also studied. Adsorption isotherms and kinetics of MC-LR, the most common MC variant, and NOD-R on the AC are studied to investigate the adsorption performance. Overall, the application of carbonized corncobs for the removal of MCs and NOD-R from water is reported for the first time.
2. Materials and Methods
2.1. Reagents and Materials
Raw corncob (M40DZ) was obtained from The Andersons Inc. (Maumee, OH, USA). MCs (MC-RR, MC-YR, MC-LR, MC-LA, MC-LW, and MC-LF) and NOD-R standards in solid form were purchased from Enzo Life Sciences (Farmingdale, NY, USA, 95% purity). HPLC-grade water, acetonitrile, methanol, Optima LC-MS-grade water, acetonitrile, ACS-grade hydrochloric acid (38% w/v), LC-MS grade formic acid, Falcon tubes (50 mL), and surfactant-free cellulose acetate (SFCA) membrane filters (25 mm diameter, 0.2 μm pore size) were purchased from Fisher Scientific (Pittsburg, PA, USA). Sep-Pak C18 cartridges (130 mg sorbent bed) were purchased from Waters (Milford, MA, USA). Glass vials (2 mL), inserts and ACS-grade phosphoric acid (85 wt%) were purchased from Sigma (St. Louis, MO, USA). Glass vials (20 mL) were purchased from DWK Life Sciences (Millville, NJ, USA). BD slip-tip syringes (3 and 10 mL) were purchased from Fisher Scientific. Commercial AC (WPH 600, Calgon Carbon) was supplied by Toledo Water Treatment plant (Toledo, OH, USA).
2.2. Instrumentation
Thermogravimetric analysis (TGA) was conducted with an SDT Q600 instrument (TA Instruments, New Castle, DE, USA). A JEOL JSM-7500F scanning electron microscope (SEM; JEOL USA, Peabody, MA, USA) with a Bruker XFlash 5010 series energy-dispersive X-ray spectroscopy (EDS) detector (Billerica, MA, USA) was used to obtain SEM and EDS data. Powder X-ray diffraction (PXRD) was conducted using a PANalytical X’Pert Pro diffractometer (Almelo, The Netherlands). Surface area and pore volume measurements were completed on a Micrometrics 3Flex manometric adsorption analyzer (Norcross, GA, USA) equipped with a micropore option. The pH of solutions was measured using a Thermo Scientific Orion Star Benchtop pH meter (Chelmsford, MA, USA).
The chromatographic separation of six MCs and NOD-R was performed using a Thermo Vanquish ultra-high-performance liquid chromatograph (UHPLC; San Jose, CA, USA) with a Waters Acquity UPLC HSS T3 column (3.0 × 50 mm, 1.8 μm) and a guard column (2.1 × 5 mm, 1.8 μm). An Orbitrap Fusion mass spectrometer (Thermo, San Jose, CA, USA) with a heated electrospray ionization (ESI) source was used for the ionization and mass analysis of cyanotoxins. The heated vacuum concentrator was from Eppendorf (Hamburg, Germany).
2.3. Sorbent Preparation
2.3.1. Biochar Preparation
A total of 30 g of raw corncob (sorbent S-1), was refluxed with 750 mL of HCl (5% w/v) at 132 °C for 90 min. Refluxed corncob was rinsed with deionized (DI) water until neutral pH was reached and dried at room temperature. The dried product was divided into three parts and heat-treated to 250, 300, and 350 °C (sorbents S-2, S-3, and S-4, respectively) using a muffle furnace. All sorbents were passed through a 250 μm sieve [50].
2.3.2. AC Preparation
Raw corncob (23.52 g) was mixed with 14.7 mL of 85% (w%) solution of H3PO4 at a ratio of 1:1 by weight and left overnight at 80 °C. The acid-impregnated corncob was then placed in a quartz boat in a tube furnace and heated at a heating rate of 5 °C min−1 up to 500 °C under nitrogen flow. Thermal treatment lasted 4 h, and the cooled product was boiled and washed with DI water several times until the pH of the washings was ≈7. Finally, the washed product was dried at 110 °C [51].
2.4. Characterization of the Surface Area and the Pore Structure
Specific surface area (in m2/g) and total pore volume (in cm3/g) of biochar, H3PO4-AC, and commercial AC were obtained from N2 adsorption/desorption isotherms measured at 77 K. Before the measurements, samples were degassed at 200 °C under vacuum for 4 h. The specific surface areas of the sorbents were calculated by the Brunauer–Emmet–Teller (BET) method and the non-local density functional theory (NLDFT) model implemented in Micromeritics SAIEUS software (version 3.0) [52]. Total pore volume (VT) was obtained from the amount of N2 adsorbed at relative pressure p/p0 ≈ 0.98, where p and p0 are the equilibrium and saturation pressures of the adsorbate, respectively. Micropore volume (Vmicro) was derived from the t-plot method [53].
2.5. Determination of Point of Zero Charge (pHPZC)
The solid addition method was used to determine the pHPZC of sorbents. Initially, an aqueous solution of NaCl at a concentration of 0.01 M was prepared. Then, using a solution of 0.1 M NaOH or 0.1 M HCl, the initial pH was adjusted to obtain solutions with pHs ranging from 2 to 10. Next, 0.1 g of the sorbent was added to a 150 mL conical flask containing 50 mL of solutions at different pH values and the flask was sealed with parafilm sealing tapes to exclude CO2 from the system. After a contact time of 24 h under continuous stirring at 1000 rpm, the pH of each solution was measured. A graph was plotted between the pHfinal vs. pHinitial. The value where pHfinal = pHinitial was taken as pHPZC of the sorbent [54].
2.6. Preliminary Sorption Experiments
A standard stock solution containing six MCs (MC-RR, MC-LR, MC-YR, MC-LA, MC-LF, and MC-LW) and NOD-R, 100 μg/L each in methanol, was prepared. This stock solution was diluted with HPLC-grade water to prepare solutions with appropriate concentrations for experiments. Preliminary sorption experiments were performed at neutral pH, using both suspension and filter modes to find the sorbent preparation technique that gives the maximum MC/NOD-R adsorption. In suspension mode experiments, 50 mg of the sorbent was added into a 2 mL glass vial containing 1 mL solution of 10 μg/L of each MC and NOD-R. An adsorbent concentration of 50 mg/mL was chosen to compare the sorption performances of different sorbents, including raw corncobs and carbonized materials. The mixture was stirred at 350 rpm at room temperature for 1 h and passed through an SFCA filter. In filter mode experiments, 50 mg of the sorbent was packed in an empty glass column and 1 mL of the standard solution containing 10 μg/L of each MC and NOD-R was passed through the packed column using a vacuum manifold. The flow rate was ~1 mL/min.
2.7. Sample Preparation by Solid-Phase Extraction (SPE), Analysis by UHPLC-MS, and Determination of Percent Removal
All collected samples and controls were prepared using a previously published SPE method [55]. After the SPE, the amounts of MCs and NOD-R in samples and controls were identified and quantified using previously published UHPLC-ESI-MS and HCD-MS/MS methods [56]. Methods used for SPE and UHPLC-MS are described in the Supplementary Materials (Page S3). The quantification of MCs and NOD-R was performed using an LC-MS external calibration protocol [55]. The calibration curve was plotted in the concentration range from 0.25 to 100 μg/L. Controls were prepared by passing the MCs and NOD-R solution through an SFCA filter. The percent removal (R) of MCs and NOD-R at time t was calculated using Equation (1),
where C0 is the initial MCs/NOD-R concentration in the solution (μg/L) and Ct is the MCs/NOD-R concentration at time t.
2.8. Effect of NOM
The competitive effect of NOM on cyanotoxin adsorption was tested using Lake Erie water samples collected during HABs in 2020, 2021, and 2022. Samples were stored in 20 mL glass vials at −20 °C, and before the experiment, they were thawed to room temperature and sonicated for 30 min to lyse cyanobacteria. Sonicated samples were passed through SFCA membrane filters and 1 mL of the sample was analyzed to determine the concentration of MCs [10,56]. A total of 3 mL of the lake water sample was added to 50 mg of adsorbents and stirred at 350 rpm for 1 h at room temperature. The samples were filtered through SFCA membrane filters.
2.9. Effect of pH
The effect of pH on the removal of MCs and NOD-R was investigated by incubating biochar (S-3 and S-4) and H3PO4-AC in solutions with different pH values. In addition to studying cyanotoxin adsorption at pH 7, the percent removal of MCs and NOD-R was investigated using solutions with pH 5.5 and pH 8.5. To adjust the solution pH, 0.1 M HCl or 0.1 M NaOH was used, and the final pH was measured using a pH meter. Thereafter, 50 mg of the sorbent was incubated in HPLC-grade water spiked with a mixture of six MCs and NOD-R (10 μg/L each) to investigate the percent removal under conditions of high sorbent amount and low toxin concentrations. To observe the percent removal under lower sorbents and higher toxin concentrations, 0.5 mg of a sorbent was incubated with a solution of six MCs and NOD-R (50 μg/L each). All mixtures were stirred in capped glass vials at 350 rpm and at room temperature for 1 h. Finally, each mixture was passed through an SFCA filter to separate the solution from the sorbent. The amount of MCs and NOD-R removed by each sorbent was calculated.
2.10. Effect of Ions
The effect of ions on the removal of MCs and NOD-R by H3PO4-AC was investigated by incubating 0.5 mg of the sorbent with a mixture of MCs and NOD-R prepared in HPLC-grade water as well as 0.3 M KCl or 0.3 M CaCl2 solutions. Removal of MCs/NOD-R in the presence of ions was tested at two different concentrations (250 and 500 μg/L of each MC and NOD-R). H3PO4-AC was incubated in a 1 mL mixture of MCs/NOD-R and stirred at 350 rpm for 1 h at room temperature. Finally, mixtures were passed through an SFCA filter to separate the solution from the sorbent. The amount of MCs and NOD-R removed by H3PO4-AC in the presence of ions was calculated.
2.11. Adsorption Kinetics
Kinetic experiments were conducted using the most prominent MC congener, MC-LR, and NOD-R [57]. A total of 0.5 mg of H3PO4-AC was incubated with 10 mL of a standard solution of MC-LR and NOD-R (2000 μg/L of each). The mixture was stirred at 350 rpm in a 25 mL beaker for 32 h at room temperature. At predetermined time intervals, samples were collected by withdrawing 0.5 mL from the mixture with a 3 mL syringe and passing through an SFCA filter. Collected samples were used to determine the residual MC-LR and NOD-R concentrations in the aqueous phase. The amount of MC-LR and NOD-R adsorbed by the sorbent was calculated using Equation (2),
where qe is the equilibrium adsorption capacity of MC-LR/NOD-R per gram of sorbent (μg/g), Ce is the equilibrium concentration of MC-LR/NOD-R in the solution (μg/L), C0 is the initial MC-LR/NOD-R concentration in the solution (μg/L), V is the volume of solution (L), and m is the mass of the sorbent (g) [58].
The kinetics experimental data were then characterized by the pseudo-second-order equation (Equation (3)), where qt is the amount of MC-LR/NOD-R adsorbed at time t per mass of the sorbent (μg/g), and k2 is the second-order rate constant (g μg−1 min−1)).
Experimental data was also fitted directly to the non-linear pseudo-second-order kinetic model (Equation (4)) by minimization of the average relative difference between the experimental and calculated values.
2.12. Adsorption Isotherms
A batch adsorption system was used to determine the adsorption isotherms for MC-LR, and NOD-R. 0.25 mg of AC was placed in 20 mL glass vials and 5 mL aliquots of standard solution with different MC-LR and NOD-R concentrations were added into the glass vials. The solutions had concentrations of 200, 400, 500, 600, 800, 1000, 1200, and 1400 μg/L of MC-LR and NOD-R. The total concentrations of MC-LR and NOD-R ranged from 400 to 2800 μg/L. The mixtures were stirred at 350 rpm at room temperature for 5 h and filtered through an SFCA filter.
The isotherm data were then characterized by the Langmuir model (Equation (5)), where Ce is the MC-LR/NOD-R concentration at equilibrium (μg/L), qe is the equilibrium adsorption capacity of MC-LR/NOD-R per gram of sorbent (μg/g), qm is maximum adsorption capacity (μg/g), and kL is the constant related to the energy of adsorption (L/μg) [58].
3. Results and Discussion
3.1. Characterization of the Pore Structure
The most significant property of a sorbent material is its adsorption capacity, which generally relates to the specific surface area and pore volume of the sorbent. These parameters can be improved by activation, improving the adsorption capacity in the process. In accordance with the 2015 International Union of Pure and Applied Chemistry (IUPAC classification), pores are classified into three groups: micropores (width (w) < 2 nm), mesopores (2 nm < w < 50 nm), and macropores (w > 50 nm) (IUPAC 2015). Micropores are classified as primary micropores (w < 0.7 nm) and secondary micropores (0.7 < w < 2 nm) [59]. Meanwhile, the length of MC-LR lies between 1.33 and 2.94 nm, and the maximum length of NOD-R is ~1.7 nm [60]. Therefore, when choosing proper sorbents for MC and NOD-R removal, it is crucial to determine the volumes of mesopores and secondary micropores that sorbent contains [28,61].
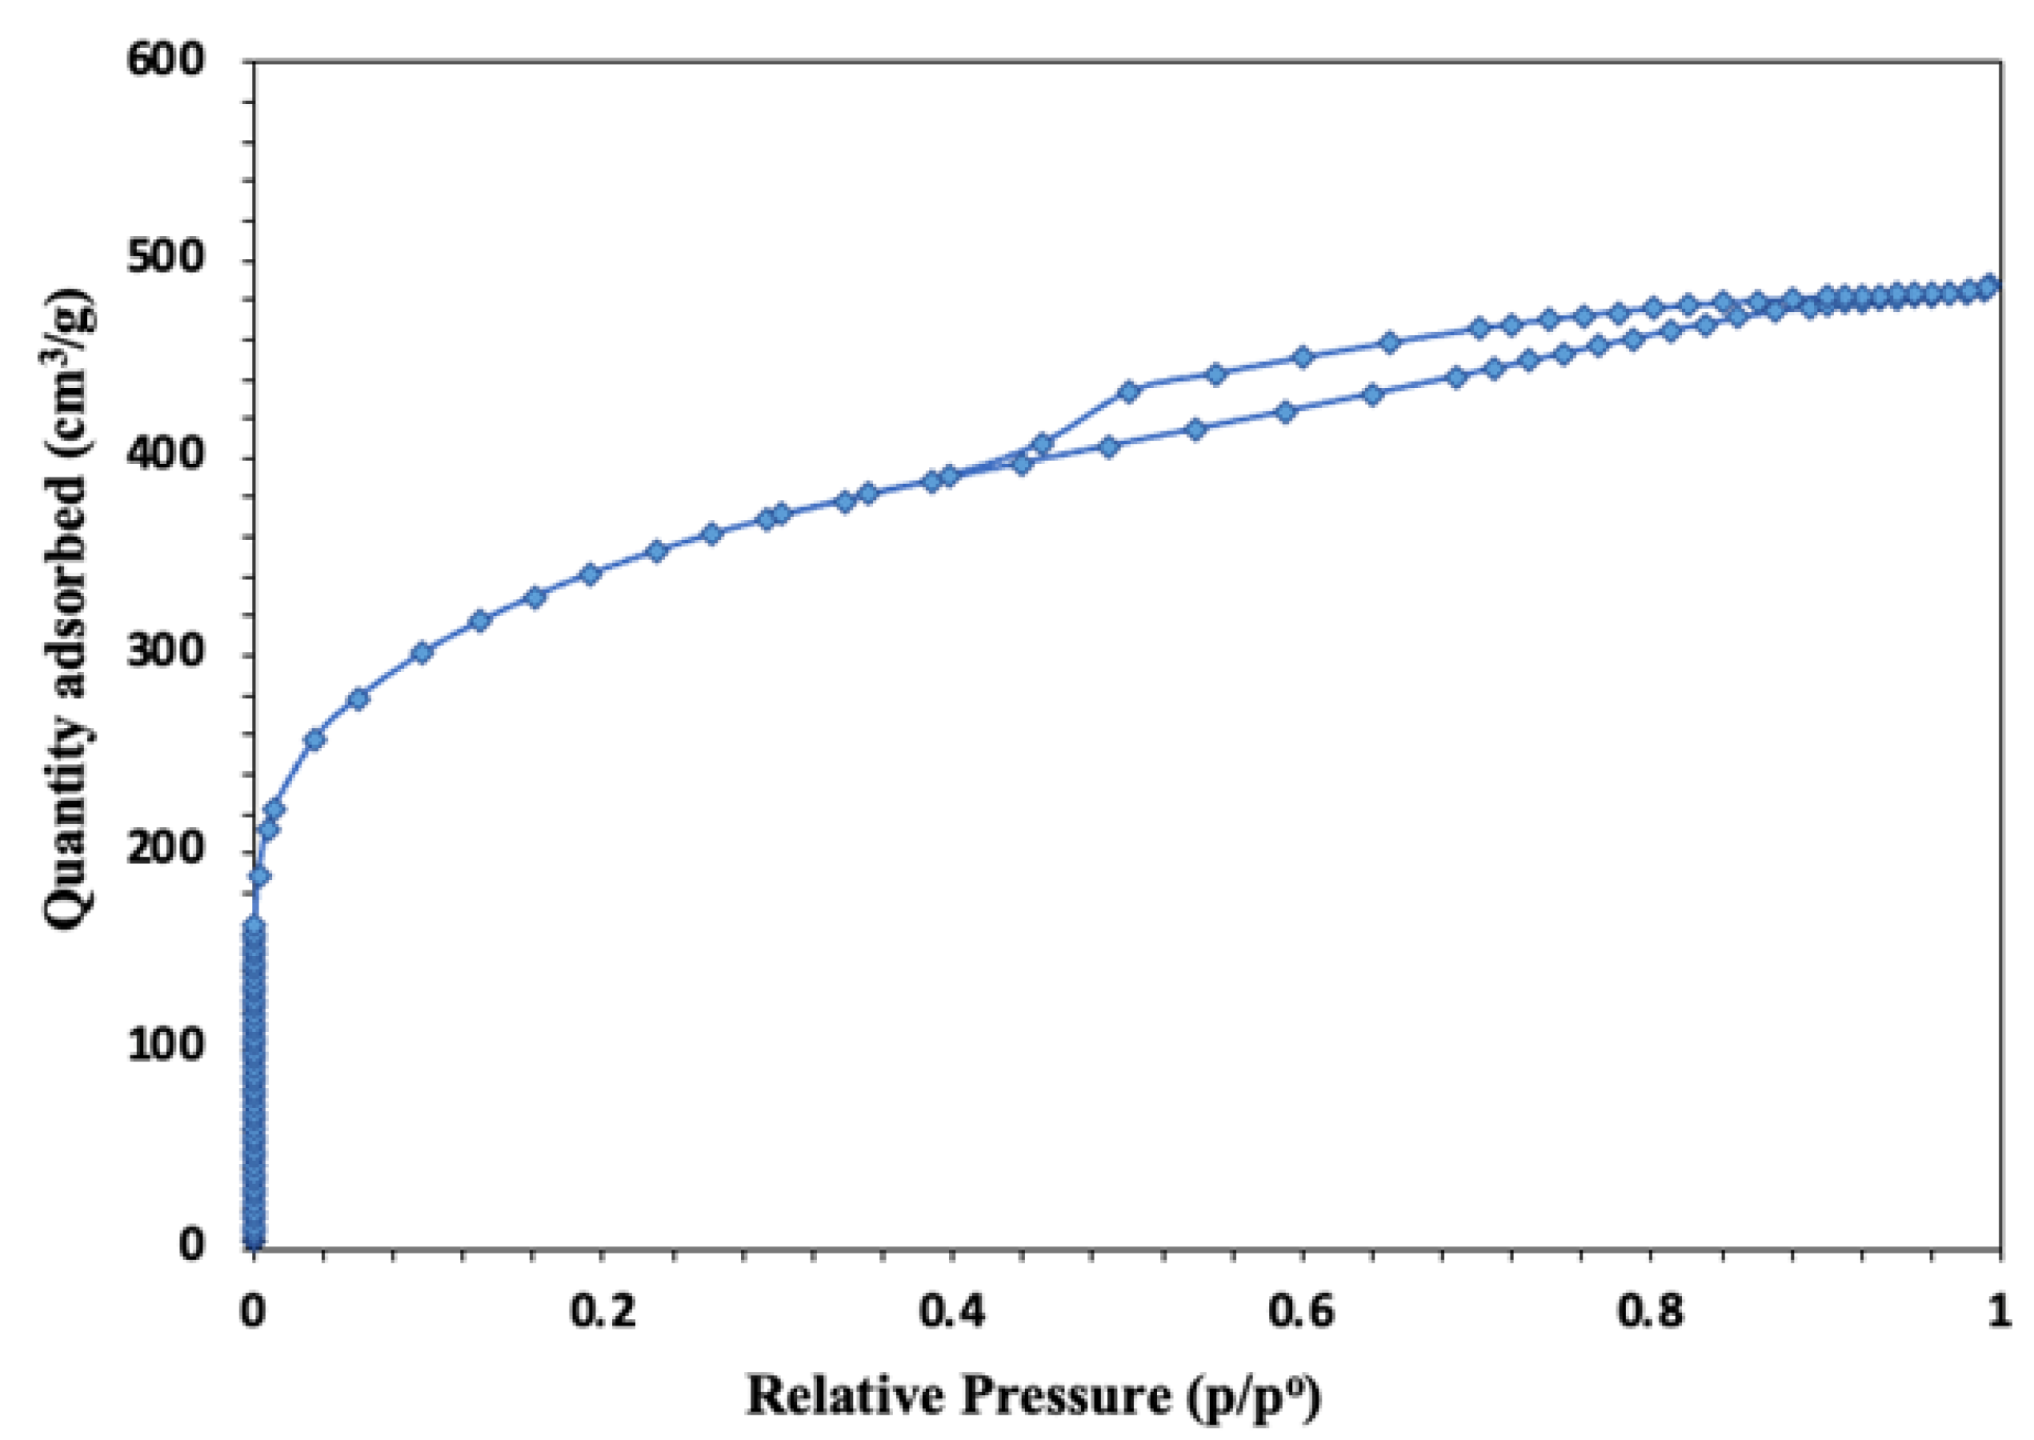
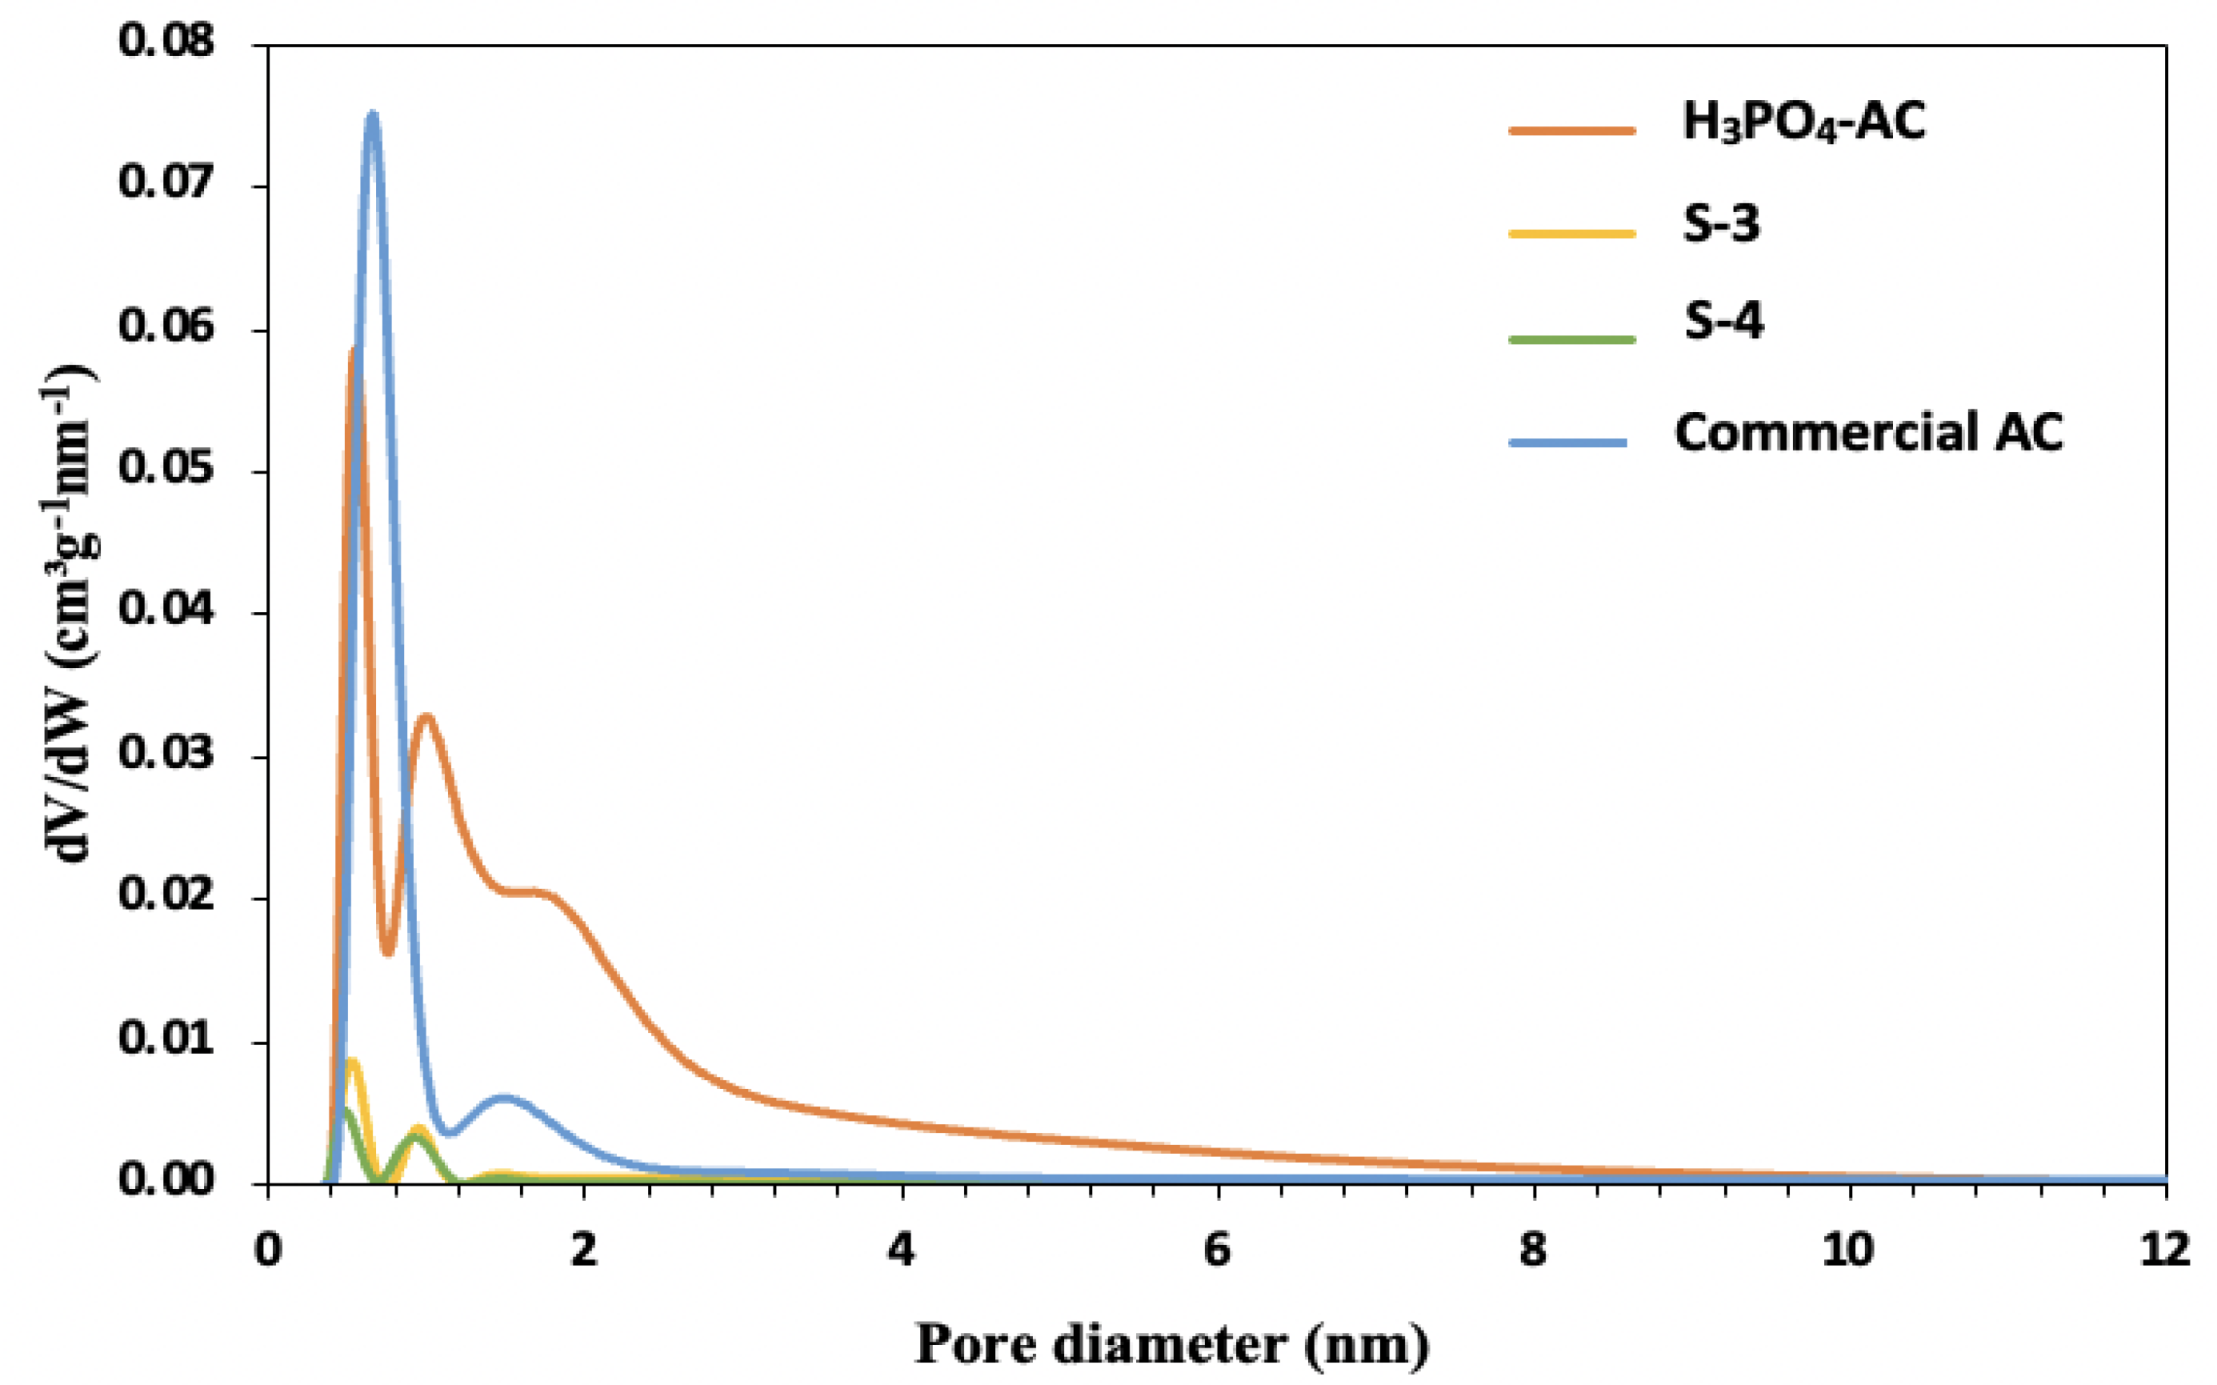
Table 1 shows pore surface areas and pore volumes of biochar, H3PO4-AC, and commercial AC. Based on the results, S-1 and S-2 can be considered as non-porous materials. S-3 and S-4 feature low specific surface area and total pore volumes compared to H3PO4-AC and commercial AC. The micropore and mesopore volumes of all sorbents were obtained by calculating the pore size distribution using NLDFT. H3PO4-AC has a higher surface area of 1100 m2/g and a pore volume of 0.75 cm3/g. The commercial AC, which is produced by steam activation using bituminous coal, features a specific surface area of ≈760 m2/g and a total pore volume of 0.40 cm3/g. Compared to commercial AC, corncob-based AC has almost 50% larger surface area and the pore volume is almost twice as large. Figure 2 shows the nitrogen adsorption/desorption isotherm of H3PO4-AC and according to the IUPAC classification, it is a composite of Type I (b) and Type IV (a). Type I (b) isotherms are for microporous materials but with larger micropores and often broad pore size distributions [59]. Type IV (a) is identified by the presence of a hysteresis loop that is indicative of mesopores and the distinct H4 hysteresis loop is mostly found in micro–mesoporous carbons [59]. Thus, H3PO4-AC features both micropores and mesopores and its total pore volume reflects the sum of the micropore and mesopore volumes. Nitrogen adsorption/desorption isotherms were also obtained for S-3, S-4, and commercial AC, as shown in Figure S1. Figure 3 shows the typical pore size distributions of S-3, S-4, H3PO4-AC, and commercial AC. H3PO4-AC contains mesopores in the size range between 2 and 8 nm. Moreover, the secondary micropore and mesopore size distributions for the H3PO4-AC can be seen to be higher than the commercial AC, and commercial AC is mostly microporous with a small fraction of mesopores.

Table 1.
Surface area and pore volumes of synthesized carbons and commercial AC.
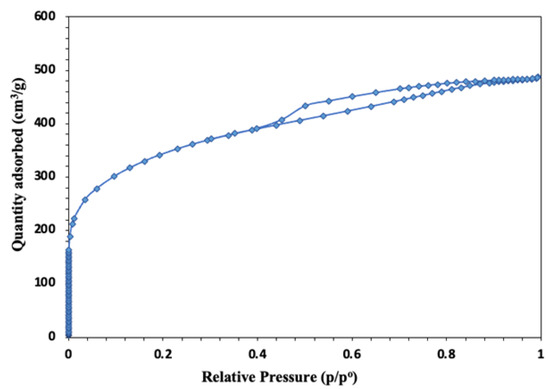
Figure 2.
N2 adsorption-desorption isotherm of H3PO4-AC.
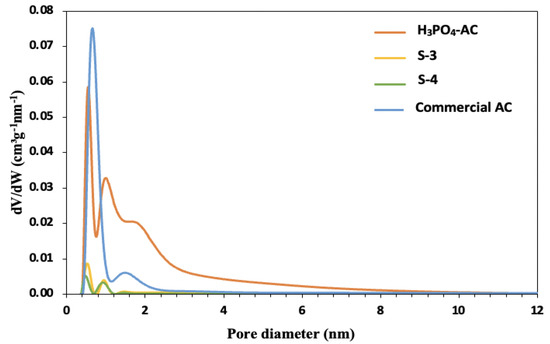
Figure 3.
Pore size distribution of H3PO4-AC, S-3, S-4, and commercial AC.
3.2. Determination of Point of Zero Charge (pHPZC)
The pHPZC for a given sorbent surface is the pH at which that surface has a net neutral charge [62]. If the solution pH < pHPZC, the treated corncob surface is positively charged and more favorable for anion adsorption while the treated corncob surface is negatively charged and more favorable for cation adsorption if the solution pH is above the pHPZC. According to the experimental results, it was found that S-3 and S-4 have a pHPZC of 3.3 and H3PO4-AC has a pHPZC of 3.7 (Figure S2). According to previous studies, the pHPZC of commercial AC (WPH 600) is 8.36 [63]. In sorption experiments, information about pHPZC can be used to predict possible interactions between the adsorbent and the adsorbate. All MCs and NOD-R contain two carboxyl groups that are negatively charged at neutral pH. However, according to their variable amino acid groups, they have different net charges (Table S1). MC-RR has a net charge of 0, MC-LR and NOD-R have a net charge of −1, and MC-LA, MC-LW, and MC-LF contain a net charge of −2 [64].
3.3. Thermogravimetric Analysis
Thermogravimetric analysis (TGA) was performed to observe the characteristic decomposition pattern and thermal stability of raw corncob (Figure S3A), HCl-refluxed corncob (Figure S3B), and H3PO4-impregnated corncob (Figure S3C). Around 10 mg of the sample was placed in an alumina crucible and heated to a higher temperature under a controlled atmosphere of air (for HCl-refluxed corncob) or N2 (for H3PO4-impregnated and raw corncob) from 25 °C to 1200 °C at a constant heating rate of 10 °C/min.
As shown in Figure S3B, when the temperature is increased from 25 °C to 100 °C in HCl-refluxed corncob, around 5% weight loss can be observed. This may be due to the elimination of moisture and volatile matter. A rapid decomposition is observed from 250 °C to 400 °C and this can be assigned to the decomposition of cellulose and hemicellulose [65]. Lignin is full of aromatic rings and the decomposition of lignin occurs in a wide temperature range, mostly from 250 °C to 500 °C [66]. These observations confirm that S-3 and S-4 still contain some organic compounds and they may promote the binding of MCs and NOD-R onto biochar [50,67].
Figure S3C shows the TG curve for H3PO4-impregnated corncob under the N2 atmosphere. The decomposition takes place in four stages. When the temperature is increased from 25 °C to 100 °C, a mass loss of 10.3% can be observed and this represents the desorption of physically bound water. The mass loss of 32% in the second stage, ranging from 100 °C to 450 °C, represents the pyrolysis of the organic matter in the precursor material and dehydration of the phosphoric acid [68]. Jagtoyen and Derbyshire Field [69] reported that during this stage, H3PO4 acid initially attacks hemicellulose and lignin. The aforesaid reactions result in a loss of aliphatic character with a simultaneous increment in aromaticity [70]. When the activation temperature increased from 450 °C to 600 °C, a mass loss of around 13% can be observed. During this stage, H3PO4 acid and its derivatives such as polyphosphoric acids combine with organic species to form phosphate and polyphosphate esters [69]. These phosphate linkages expand the volumetric structure of the biomass due to the pore formation and provide more surface area to the material [68,71]. When the activation temperature increases from 600 °C to 1100 °C, a significant mass loss can be observed. This mass loss can be attributed to the volatilization of phosphorous compounds that provide more pores to the carbon structure with a high surface area [68]. The above results show that pyrolysis temperature plays an important role in product distribution, yield, and characteristics of AC.
In addition to the above characterization techniques, S-3, S-4, and H3PO4-AC were characterized by SEM (to observe the surface morphology), EDS (for the elemental analysis), and PXRD (for the structure analysis) as shown in Figures S4–S6 and discussed in corresponding figure captions.
3.4. Preliminary Sorption Experiments
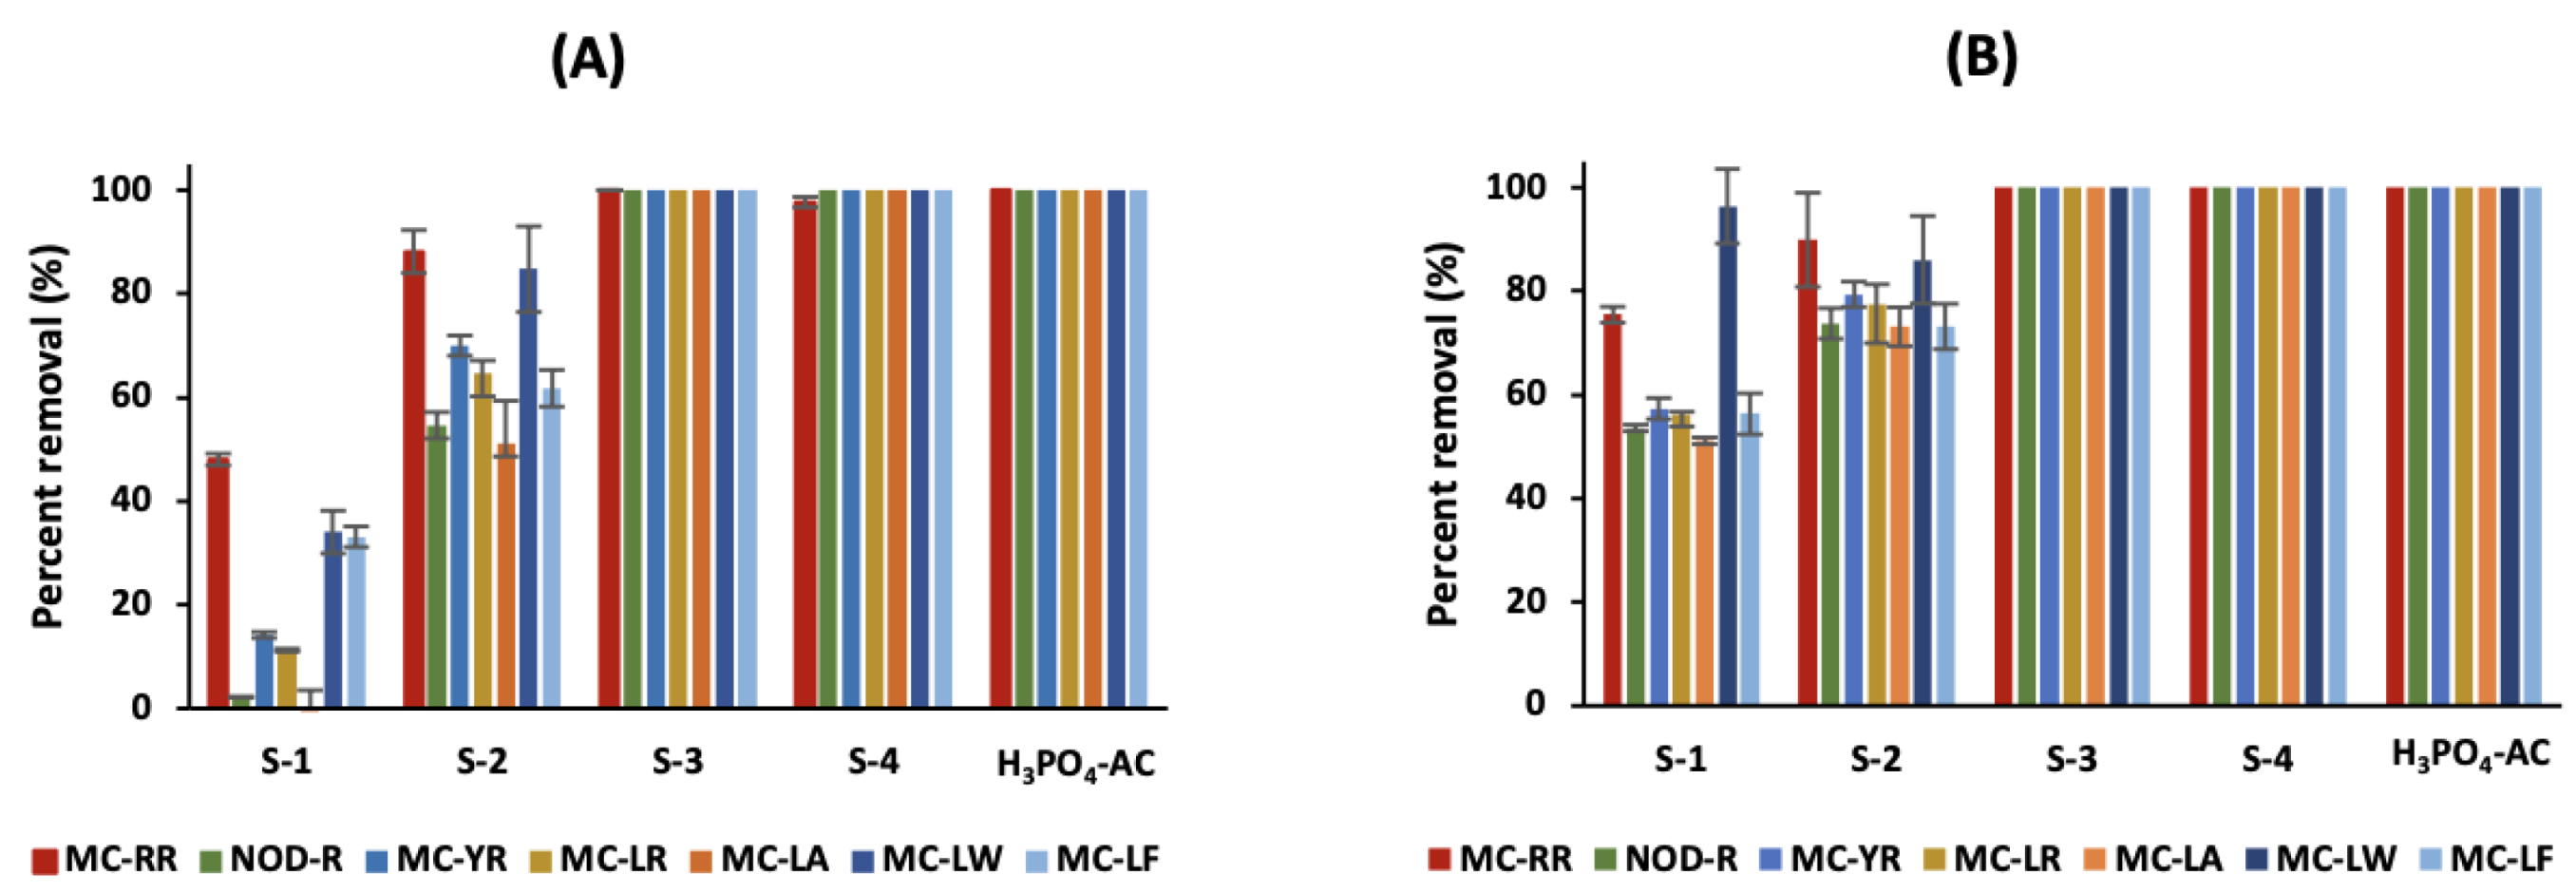
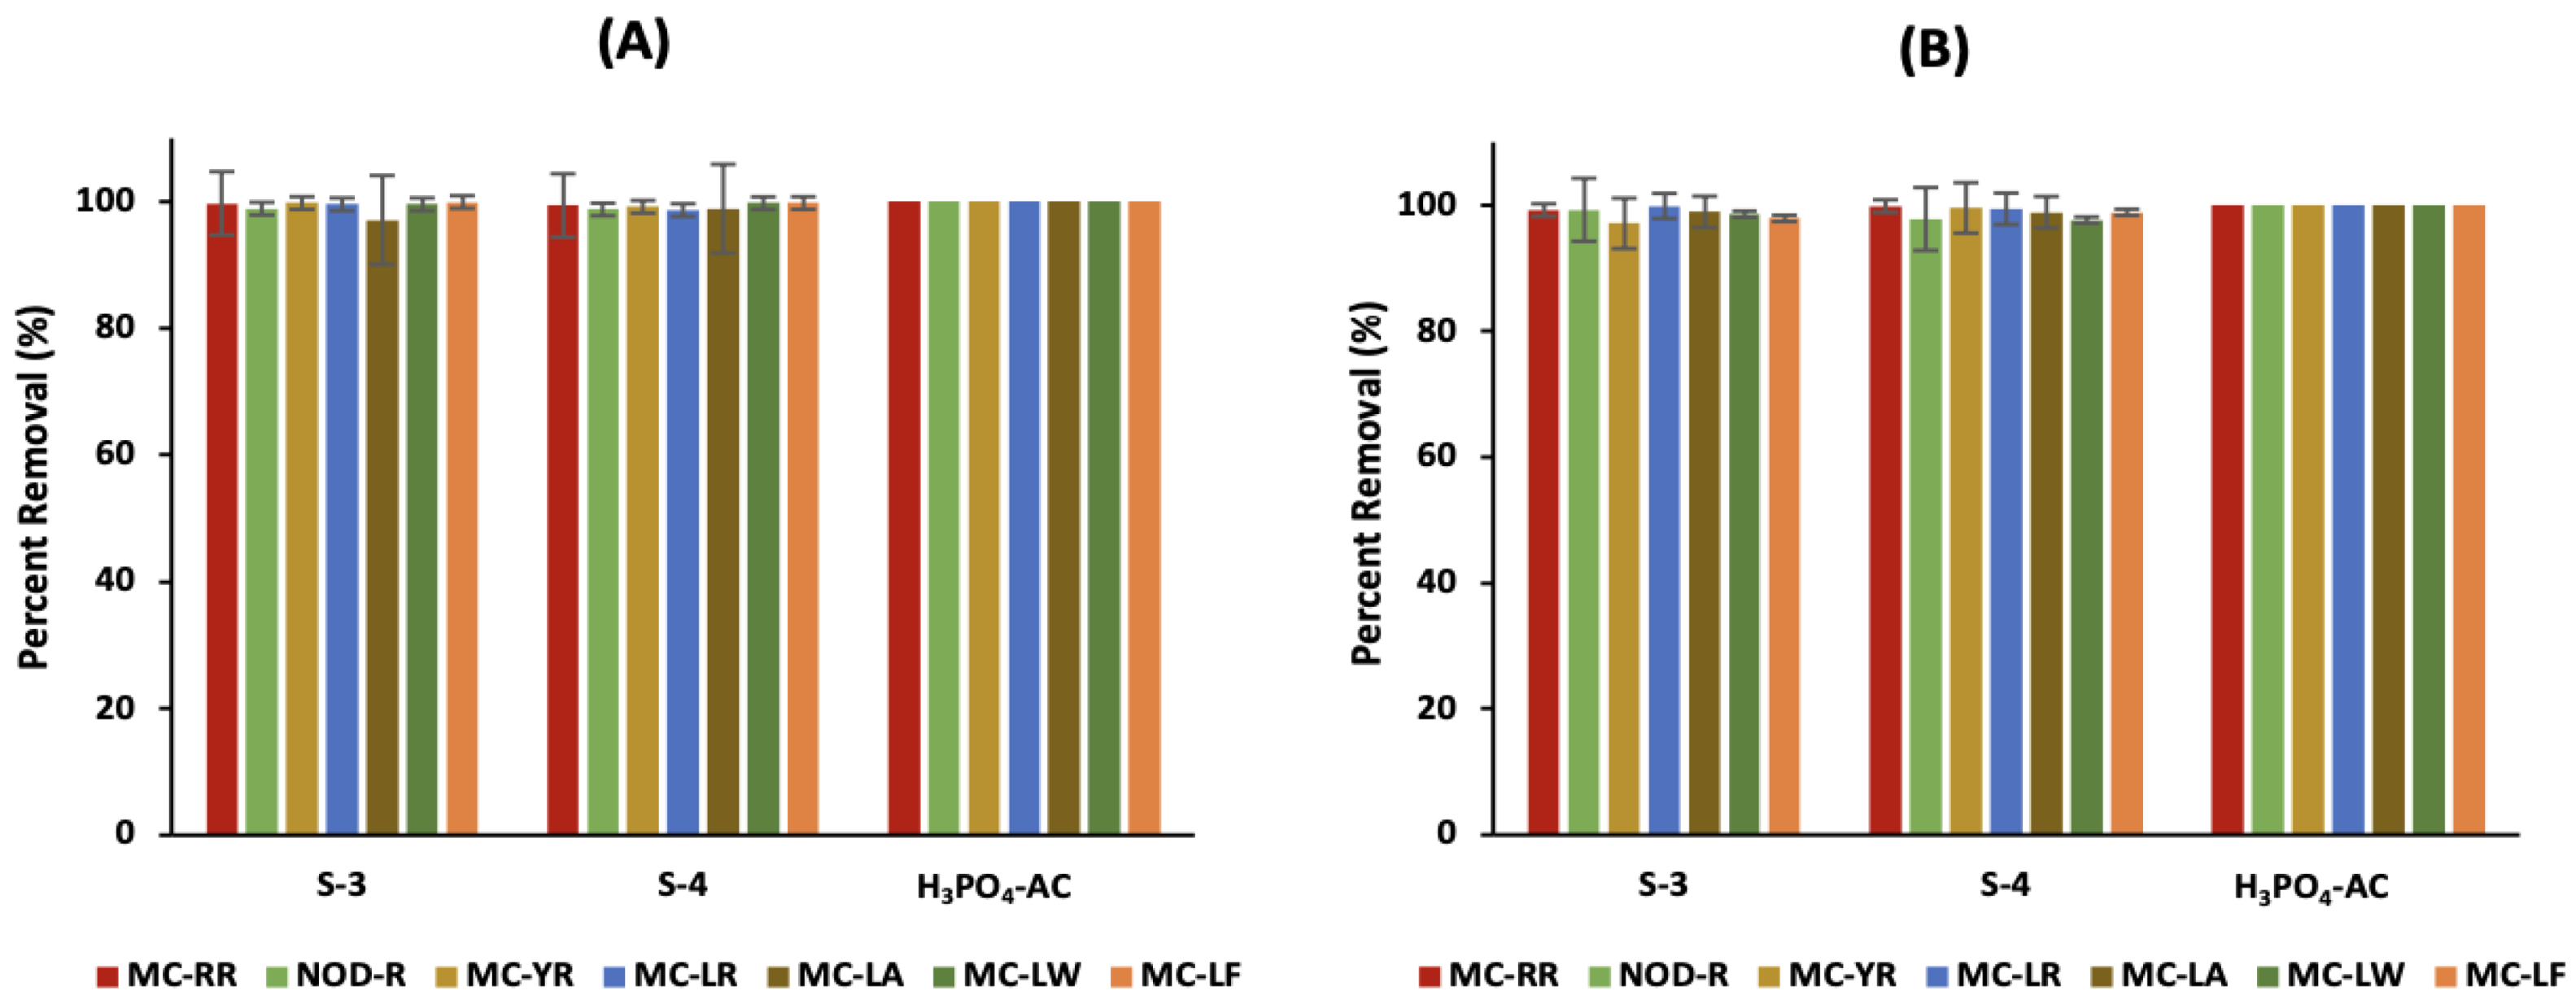
Raw and differently treated corncobs (biochar and H3PO4-AC) were used as sorbent materials for the removal of MCs and NOD-R from water, in both suspension and filter modes. Subsequently, the influence of various sorbent preparation conditions for the adsorption of MCs and NOD-R onto corncob was investigated. According to a previous study, the total (extracellular and intracellular) MC concentrations in Lake Erie water ranged from 0.06 to 14.88 μg/L (HAB in 2016) and 0.05 to 10.15 μg/L (HAB in 2017) [10]. Hence, a mixture of six MCs and NOD-R with a concentration of 10 μg/L each was used in preliminary sorption experiments. The removal percentage (Equation (1)) was calculated by comparing UHPLC-MS monoisotopic peak areas of MCs/NOD-R ions in tested samples to those peak areas in the control samples. Figure 4 shows the percent removal of MCs/NOD-R from water by untreated and treated corncobs in suspension and filter modes. In suspension mode, S-1 (raw corncob) showed the lowest percent removal (less than 50% for each analyte, Figure 4A) compared to other sorbents. These results show that even without any treatments, raw corncob can remove some amount of MCs and NOD-R. The highest adsorption performance (100% removal for all analytes) resulted from biochar S-3 and H3PO4-AC. For S-4, the percent removal of MC-RR was 97.9%, while other analytes were completely removed. Among the six MCs, MC-RR is the most hydrophilic. The reason behind the lower adsorption of MC-RR onto S-4 may be due to the smaller amount of polar organic compounds remaining after heating to a higher temperature (compared to S-3), which makes the sorbent less favorable for adsorption of the most hydrophilic MCs, such as MC-RR. Even though the contact time between sorbates and adsorbent is shorter than in suspension mode (1 vs. 60 min), the overall removal of cyanotoxins was higher in filter mode. Sorbents S-3, S-4, and H3PO4-AC removed all analytes completely in filter mode while sorbents S-1 and S-2 showed >50% removal (Figure 4B). The higher removal in filter mode compared to suspension mode could be due to the strong interactions between molecules and the porous medium when they are passed through a densely packed glass column [50]. Overall, high cyanotoxin removal using S-3, S-4, and H3PO4-AC shows that the removal of MCs/NOD-R increases as the corncob is acid-treated and heated to higher temperatures. For further determination of the adsorption performance of H3PO4-AC and S-3, the concentration of the mixture of analytes was increased from 10 μg/L each to 1000 μg/L each, and percent removal was studied in suspension mode. Even after increasing the concentration 100 times, H3PO4-AC was able to remove all analytes completely, and biochar S-3 could not remove all analytes completely (Figure S7). Preliminary adsorption experiments showed that H3PO4-AC works better in removing MCs and NOD-R from water when compared to biochar.
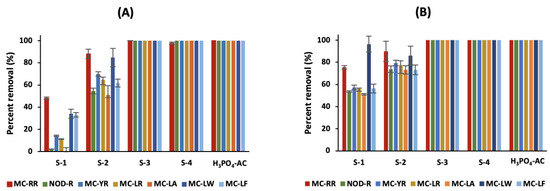
Figure 4.
Percent removal of six MCs and NOD-R from water (pH ~ 7) using (A) suspension mode and (B) filter mode (n = 3) The initial concentration of each MC and NOD-R, sorbent amount, and solution volume were 10 μg/L, 50 mg, and 1 mL, respectively.
3.5. Removal of MCs and NOD-R Using Biochar and H3PO4-AC
As mentioned before, the adsorption of MCs and NOD-R is considerably enhanced when corncob is acid and heat-treated. During the acid reflux, HCl hydrolyzes the organic material by removing some lignin and wax that covers the corncob surface. This enhances the surface coarseness of the corncob, and MCs and NOD-R molecules can be readily trapped inside the corncob structure [50]. In addition, the acid treatment creates surface hydroxyl groups on corncob, which improves their adsorption properties for MC and NOD-R removal. After acid treatment, when the corncob is heat-treated, biomass carbon converts into a solid carbonaceous residue. These carbonaceous materials contain a porous structure with an improved surface area, which enhances the percent removal of MCs and NOD-R.
Corncob-based AC showed a higher sorption capacity compared to biochar. This could be due to its high porosity, which provides a high surface area, as well as due to increased carbon content in the sorbent material. Pyrolysis of the precursor material at a higher temperature (500 °C) improved the carbon content in corncob. Also, the impregnation of raw corncob with H3PO4 acid facilitates the hydrolysis of lignin, which increases the carbon content [72]. BET surface area analysis also confirmed that H3PO4-AC contains a ≈14 times larger surface area compared to S-3. The higher surface area will provide more adsorption sites for MCs and NOD-R to interact with the carbonaceous surface.
MCs and NOD-R interact with treated corncob in multiple ways. All MCs and NOD-R contain the aromatic Adda moiety, and the benzene group in Adda (Figure 1) can interact with aromatic units in carbonized corncobs via π-π staking interactions. MC-LW and MC-LF have additional aromatic functional groups that provide more chances for π-π interactions. In addition, alanine and leucine can create hydrophobic interactions with the carbon surface [57]. Hydrophilic interactions can also be involved during the binding of MCs and NOD-R onto treated corncob using polar functional groups in molecules and on the sorbent surface. Depending on the pH, D-glutamate, beta-methylaspartate, and guanidine groups can form hydrophilic interactions with polar functional groups on the treated corncob surface, such as hydroxyl [60,73]. In preliminary adsorption experiments, six MCs and NOD-R showed a similar percent removal by H3PO4-AC. Therefore, it can be assumed that hydrophobic interactions were the primary driving force leading to the adsorption of MCs and NOD-R as they all contain aromatic Adda moiety in their structures.
3.6. Effect of NOM on Adsorption of MCs Found in cyanoHAB Samples
Lake Erie does not contain only MCs and other cyanobacterial metabolites. It also contains dissolved NOM and other impurities. NOM is also favorable in adsorbing onto mesoporous in powdered AC and competes for the adsorption sites with cyanotoxins [74,75,76]. NOM inhibits MC adsorption by pore blockage and/or direct competition for adsorption sites [77]. To test this phenomenon and as a proof-of-concept experiment, biochar (S-3 and S-4) and H3PO4-AC were used to remove MCs from the lake water. Out of the six studied MCs, only four congeners (MC-RR, MC-YR, MC-LR, and MC-LA) were detected in control lake water samples in the years 2020 and 2022 (Tables S2 and S4). In 2021, the HAB intensity in Lake Erie was less compared to other years, and only MC-RR and MC-LR were detected in collected cyanoHAB samples (Table S3). The concentrations of MCs in lake water samples ranged from 1.30 to 276.53 µg/L for MC-RR, 0.07 to 131.50 µg/L for MC-LR, and 25.64 to 42.78 µg/L for MC-YR, and it was ≈4.5 µg/L for MC-LA. Total concentrations (extracellular and intracellular) of most abundant MC congeners in 2020, 2021, and 2022 were ≈438.51 µg/L, 1.37 µg/L, and 413.96 µg/L, respectively. S-3 and S-4 removed MCs completely from lake water samples collected in 2020 and 2021. For samples collected in 2022, the presence of NOM and other impurities in the lake water has been shown to cause a reduction in the adsorption capacity of biochar for MC-YR, MC-LR, and MC-LA. A reduction in both MC-LR and MC-LA adsorption by powdered AC from natural water with higher concentrations of NOM was observed previously [78]. The highest MC removal was obtained for H3PO4-AC (100% removal of all four congeners) and the results confirmed that its overall adsorption performance was not altered in the presence of NOM. This experiment was done in parallel with commercial AC and the removal percentages obtained for all MC variants were similar to laboratory-synthesized AC (Tables S2–S4).
3.7. Effect of pH
In water treatment facilities, powdered AC can be fed at different points during the treatment process [79]. According to the AC application point, several factors can affect the removal of MCs/NOD-R, and the pH of water is one of the prominent factors [80]. For example, if AC is applied prior to coagulation/filtration, adsorption occurs at a basic pH. On the other hand, if AC is applied after coagulation/filtration, the adsorption occurs at an acidic pH as the pH of water drops to around 5.0 [81,82]. Therefore, the solution pH can affect the adsorption of MCs and NOD-R onto sorbents by changing the net surface charge of the sorbent or net charge and hydrophilicity of MCs/NOD-R [83]. Hence, the effect of solution pH on MC and NOD-R removal was tested at environmentally relevant low MC/NOD-R concentrations as well as at high MC/NOD-R concentrations. At lower toxin concentrations, when the pH was decreased to 5.5 or increased to 8.5, the percent removal of six MCs and NOD-R by H3PO4-AC was similar as at neutral pH and it slightly decreased for biochar (Figure 5 vs. Figure 4A). Still, the percent removal of all analytes by the biochar was higher than 97%. At higher toxin concentrations, competitive adsorption was observed at all pH conditions (Figure S8). As biochars S-3 and S-4 contain low surface area and pore volumes, the overall percent removal was less compared to H3PO4-AC. Moreover, at all pH conditions, the highest percent removal by the biochar was observed for MC-RR, followed by MC-YR. When using H3PO4-AC, all MCs with arginine in their structures and NOD-R showed higher percent removals compared to others. This can be explained using the pHPZC of the sorbents. As the pHPZC of S-3 and S-4 is 3.3 and H3PO4-AC is 3.7, these sorbents contain a net negative surface charge in the above pH conditions. Hence, during the competitive adsorption, MC-RR, MC-YR, MC-LR, and NOD-R molecules that contain positive charges from the guanidinium side chain in the arginine show a higher percent removal compared to other molecules. However, in biochar, the percent removal of NOD-R is lower compared to MC-LR even though they have similarities in charge and size. This could be due to the absence of alanine and leucine, which are involved in hydrophobic interactions [60].
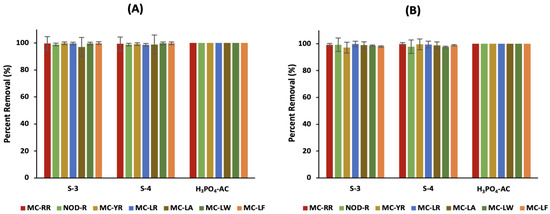
Figure 5.
Percent removal of six MCs and NOD-R at (A) pH 5.5 and (B) pH 8.5, using different sorbents (n = 3) The initial concentration of each MC and NOD-R, sorbent amount, and solution volume were 10 μg/L, 50 mg, and 1 mL, respectively.
Considering the overall adsorption at different pH values, the highest sorption onto biochar and H3PO4-AC was observed at pH 5.5, and the lowest was observed at pH 8.5. With an increase in pH, MCs exhibit increased hydrophilicity, and, therefore, molecules tend to remain in the aqueous phase rather than being adsorbed onto the sorbent [84].
3.8. Effect of Ions
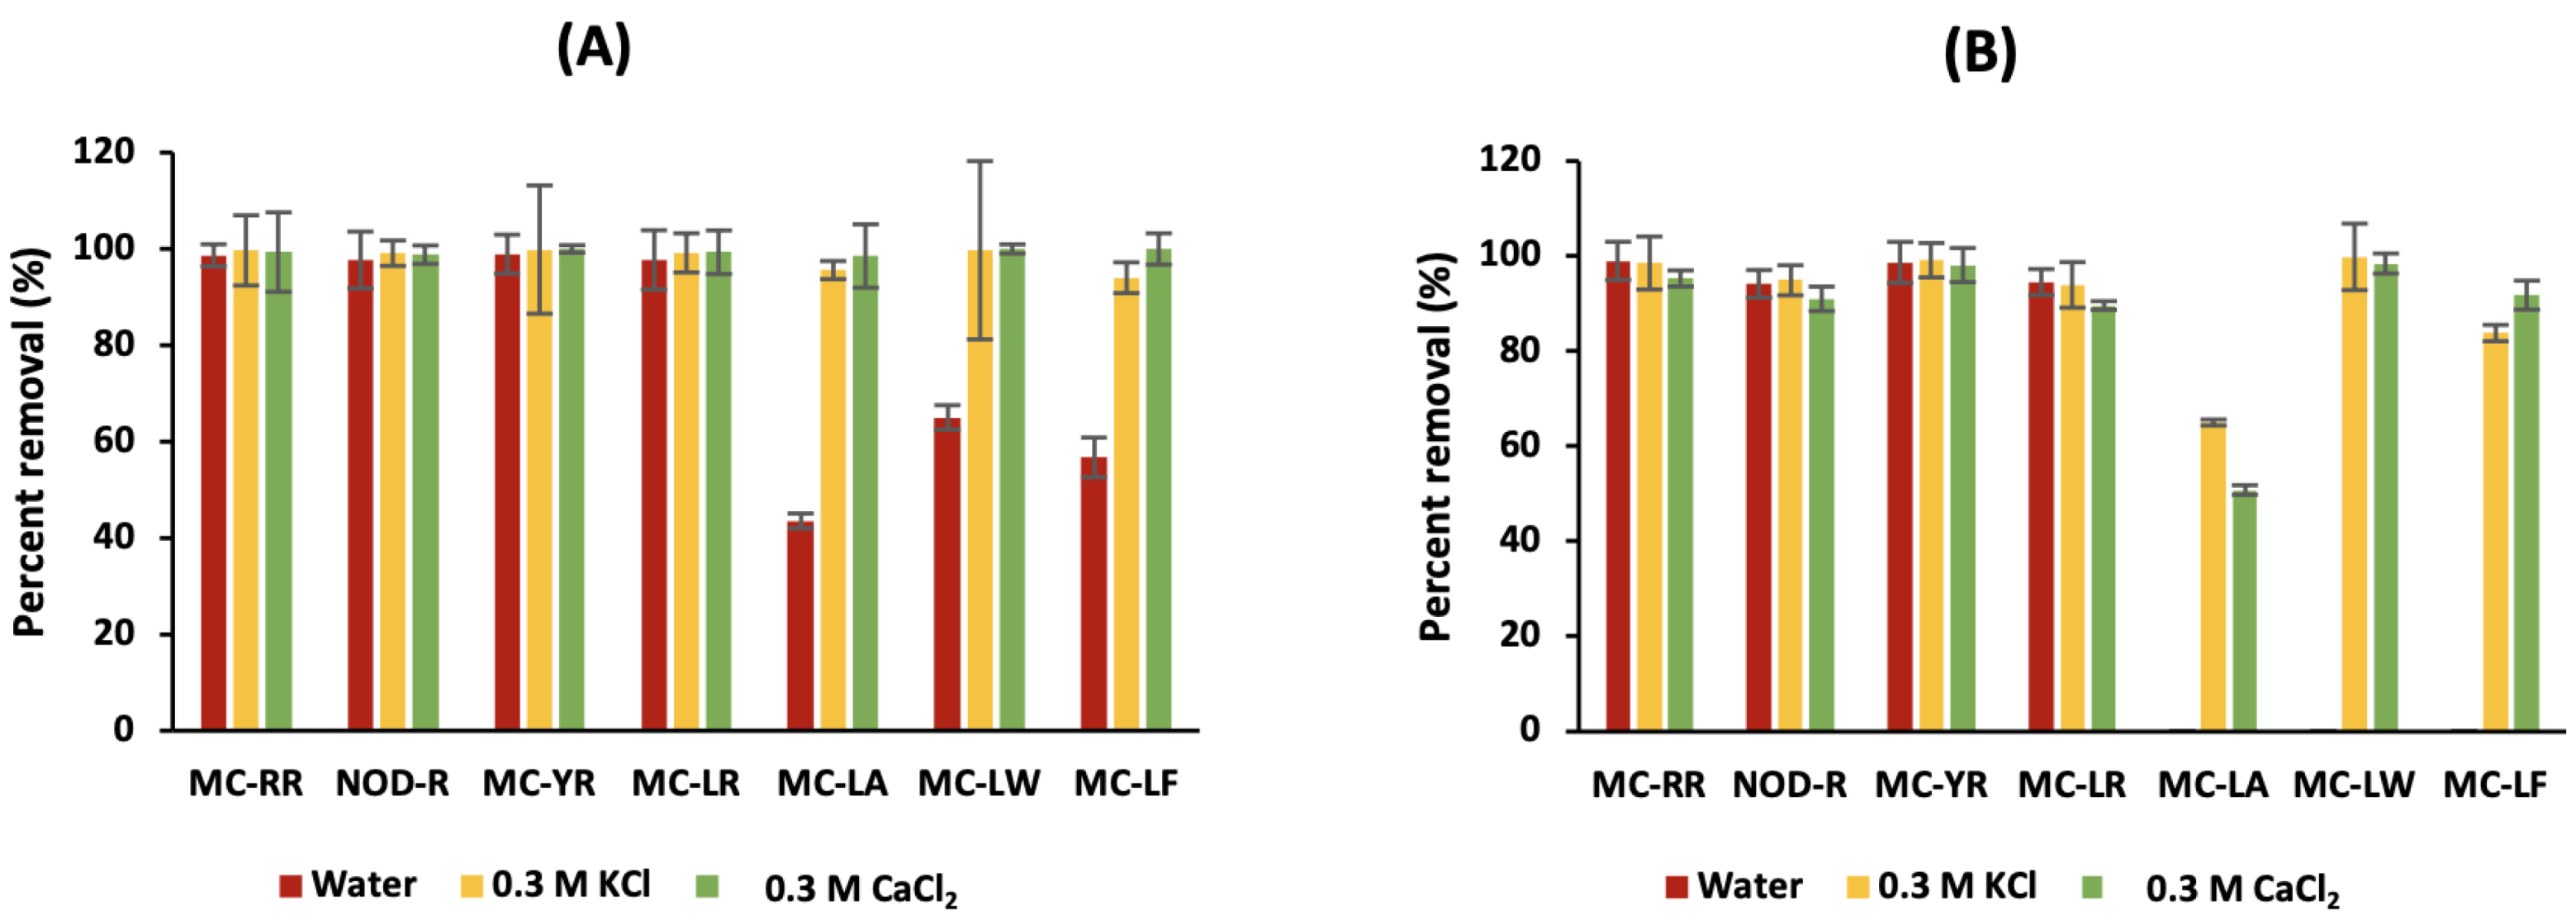
As described previously, the adsorption of MCs and NOD-R onto the H3PO4-AC surface can occur through electrostatic forces as well as non-electrostatic forces. Therefore, the presence of ions plays a vital role in MC and NOD-R removal since ions affect electrostatic interactions between analytes and the sorbent surface. Herein, KCl and CaCl2 were used to identify the dominant type of interaction by screening electrostatic interactions during the adsorption process. Salts can screen all electrostatic interactions and these interactions can either be attractive or repulsive [85]. If non-electrostatic interactions govern the adsorption process, analytes still adsorb even after the addition of salts. If the adsorption is governed by attractive electrostatic interactions, adsorption decreases upon the addition of salts. Correspondingly, if the adsorption is governed by repulsive electrostatic interactions, adsorption increases upon the addition of salts [86,87]. As shown in Figure 6, at higher toxin concentrations, the removal of MC-LA, MC-LW, and MC-LF was low compared to other MCs and NOD-R. In addition, when the toxin concentration is 500 μg/L each, the removal of MC-LA, MC-LW, and MC-LF was negligible. Since the pHPZC of H3PO4-AC is 3.7, the sorbent contains a net negative surface charge while MC-LA, MC-LW, and MC-LF are negatively charged (z = −2) at neutral pH. They compete for adsorption sites with neutral MC-RR as well as with less negatively charged (z = −1) MC-YR, MC-LR, and NOD-R. It appears that MC-LA, MC-LW, and MC-LF with an overall charge of −2 are repulsed by the negatively charged surface of H3PO4-AC and are not good competitors for the adsorption when limited adsorption sites are available. Upon introducing salts to the water, changes in MCs and NOD-R adsorption onto H3PO4-AC were observed. At the highest cyanotoxin concentration (500 μg/L each), percent adsorption slightly decreased for MC-YR, MC-LR, and NOD-R (Figure 6B), in CaCl2-containing solutions potentially because Ca2+ ions screened attractive interactions between the analytes and the sorbent surface. Meanwhile, the addition of KCl or CaCl2 enhanced the percent adsorption of MC-LA, MC-LW, and MC-LF since salts have screened the repulsive interactions of these congeners with the AC surface or adsorbed MC molecules. When comparing different concentrations (250 vs. 500 μg/L) of MC-LA, MC-LW, and MC-LF, the changes in percent adsorptions upon salt addition were higher when the initial analyte concentration was 500 μg/L. Moreover, the strength of salt screening on adsorption was higher when adding a divalent metal salt (CaCl2), than when adding a monovalent metal salt (KCl). Compared to potassium cation, calcium cation has more pronounced effects on interactions, which can enable new adsorption sites and/or increase shielding effects on intra- and intermolecular repulsions [88]. These results indicate that electrostatic forces govern the adsorption process at higher toxin concentrations.
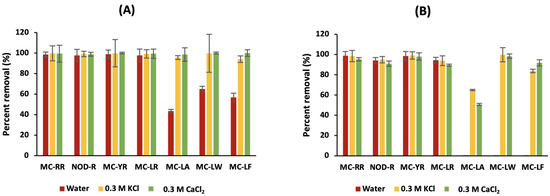
Figure 6.
Percent removal of (A) 250 μg/L and (B) 500 μg/L each for MC-RR, NOD-R, MC-YR, MC-LR, MC-LA, MC-LW, and MC-LF on 0.5 mg H3PO4-AC in water, 0.3 M KCl, and 0.3 M CaCl2. Average values and error bars (±one standard deviation) were calculated after triplicate LC-MS analyses.
3.9. Adsorption Kinetics of MC-LR and NOD-R Onto H3PO4-AC
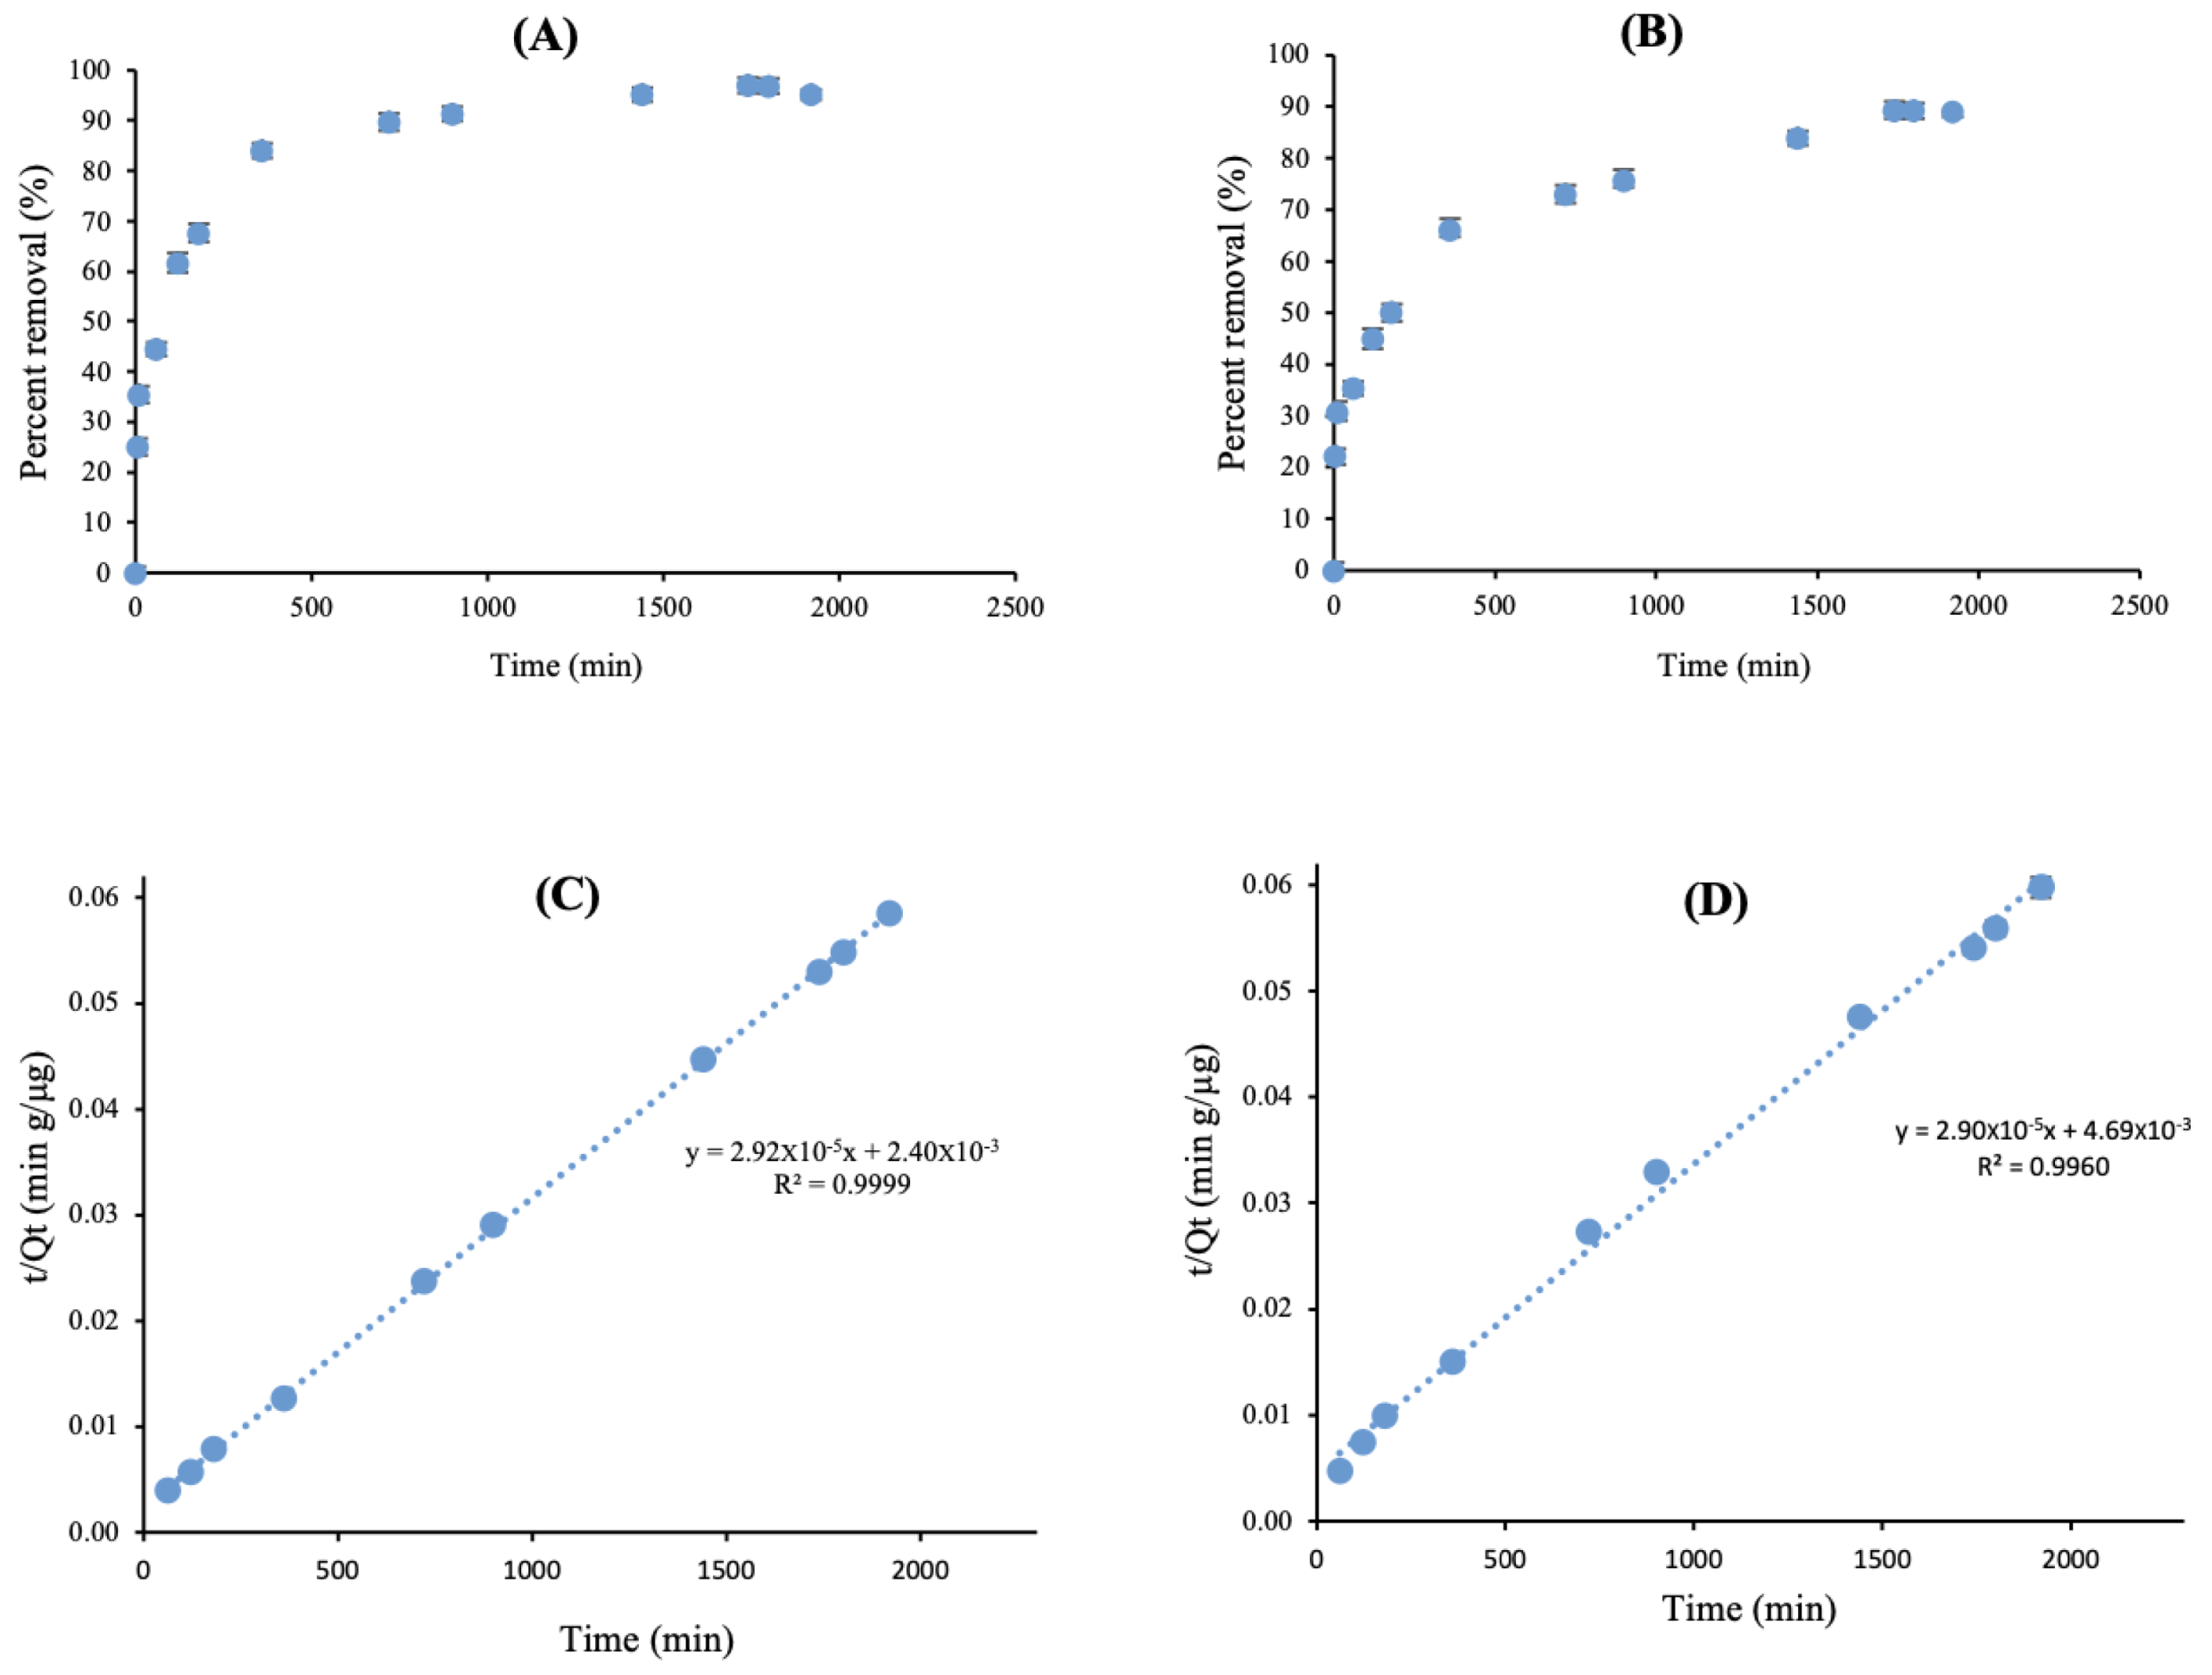
Preliminary sorption experiments confirmed that H3PO4-AC is more effective in removing MCs and NOD-R from water compared to biochar. Therefore, in further experiments, the adsorption of MC-LR and NOD-R onto H3PO4-AC was considered. Kinetics plays a vital role during the adsorption process, and it provides insights into the mechanisms of sorption. The kinetics experiment was done by spiking MC-LR and NOD-R (2000 μg/L each) into the water so the total cyanotoxin concentration (4000 μg/L) was much larger than in HAB samples. The amount of MC-LR and NOD-R adsorbed onto 0.5 mg of H3PO4-AC was investigated by varying contact time from 0 to 32 h. According to the experimental data, ≈25% of MC-LR (Figure 7A) and ≈22% of NOD-R (Figure 7B) were adsorbed from water within the first 5 min. Percent removal was enhanced when the incubation time was increased and maximum removal (>97% for MC-LR and >89% for NOD-R) was obtained after 32 h. The experimental data were modeled using pseudo-second-order kinetics to understand the MC and NOD-R interactions with corncob-derived AC during sorption. The linear fitting plots of t/qt vs. time for MC-LR (Figure 7C) and NOD-R (Figure 7D) yield straight lines with R2 ≥ 0.9958, confirming that sorption kinetics were well represented by the pseudo-second-order kinetics (Equation (3)). Sorption kinetics data were also fitted using the non-linear fit of pseudo-second-order models, as shown in Figure S9. All steps in adsorption, including external film diffusion, adsorption, and internal particle diffusion, are considered in this model [89].
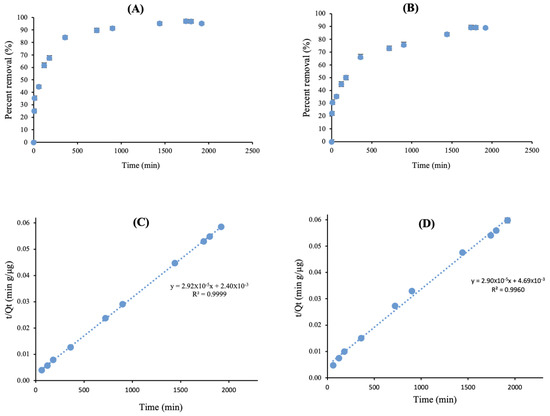
Figure 7.
Sorption kinetics of (A) MC-LR, (B) NOD-R, and linear pseudo-second-order models for the sorption of (C) MC-LR and (D) NOD-R onto H3PO4-AC. Error bars represent ± one standard deviation (n = 3). The initial concentrations, amount of sorbent, and volume of solution were 2000 μg/L, 0.5 mg, and 10 mL, respectively.
Nonlinear fittings of pseudo-second-order kinetics for MC-LR and NOD-R adsorption onto H3PO4-AC are shown in Figure S9. In addition, the adsorption kinetics of six MCs and NOD-R were studied at lower toxin concentrations as shown in Figure S10 and discussed in the Supplementary Materials.
3.10. Adsorption Isotherm Modeling of MC-LR and NOD-R on H3PO4-AC
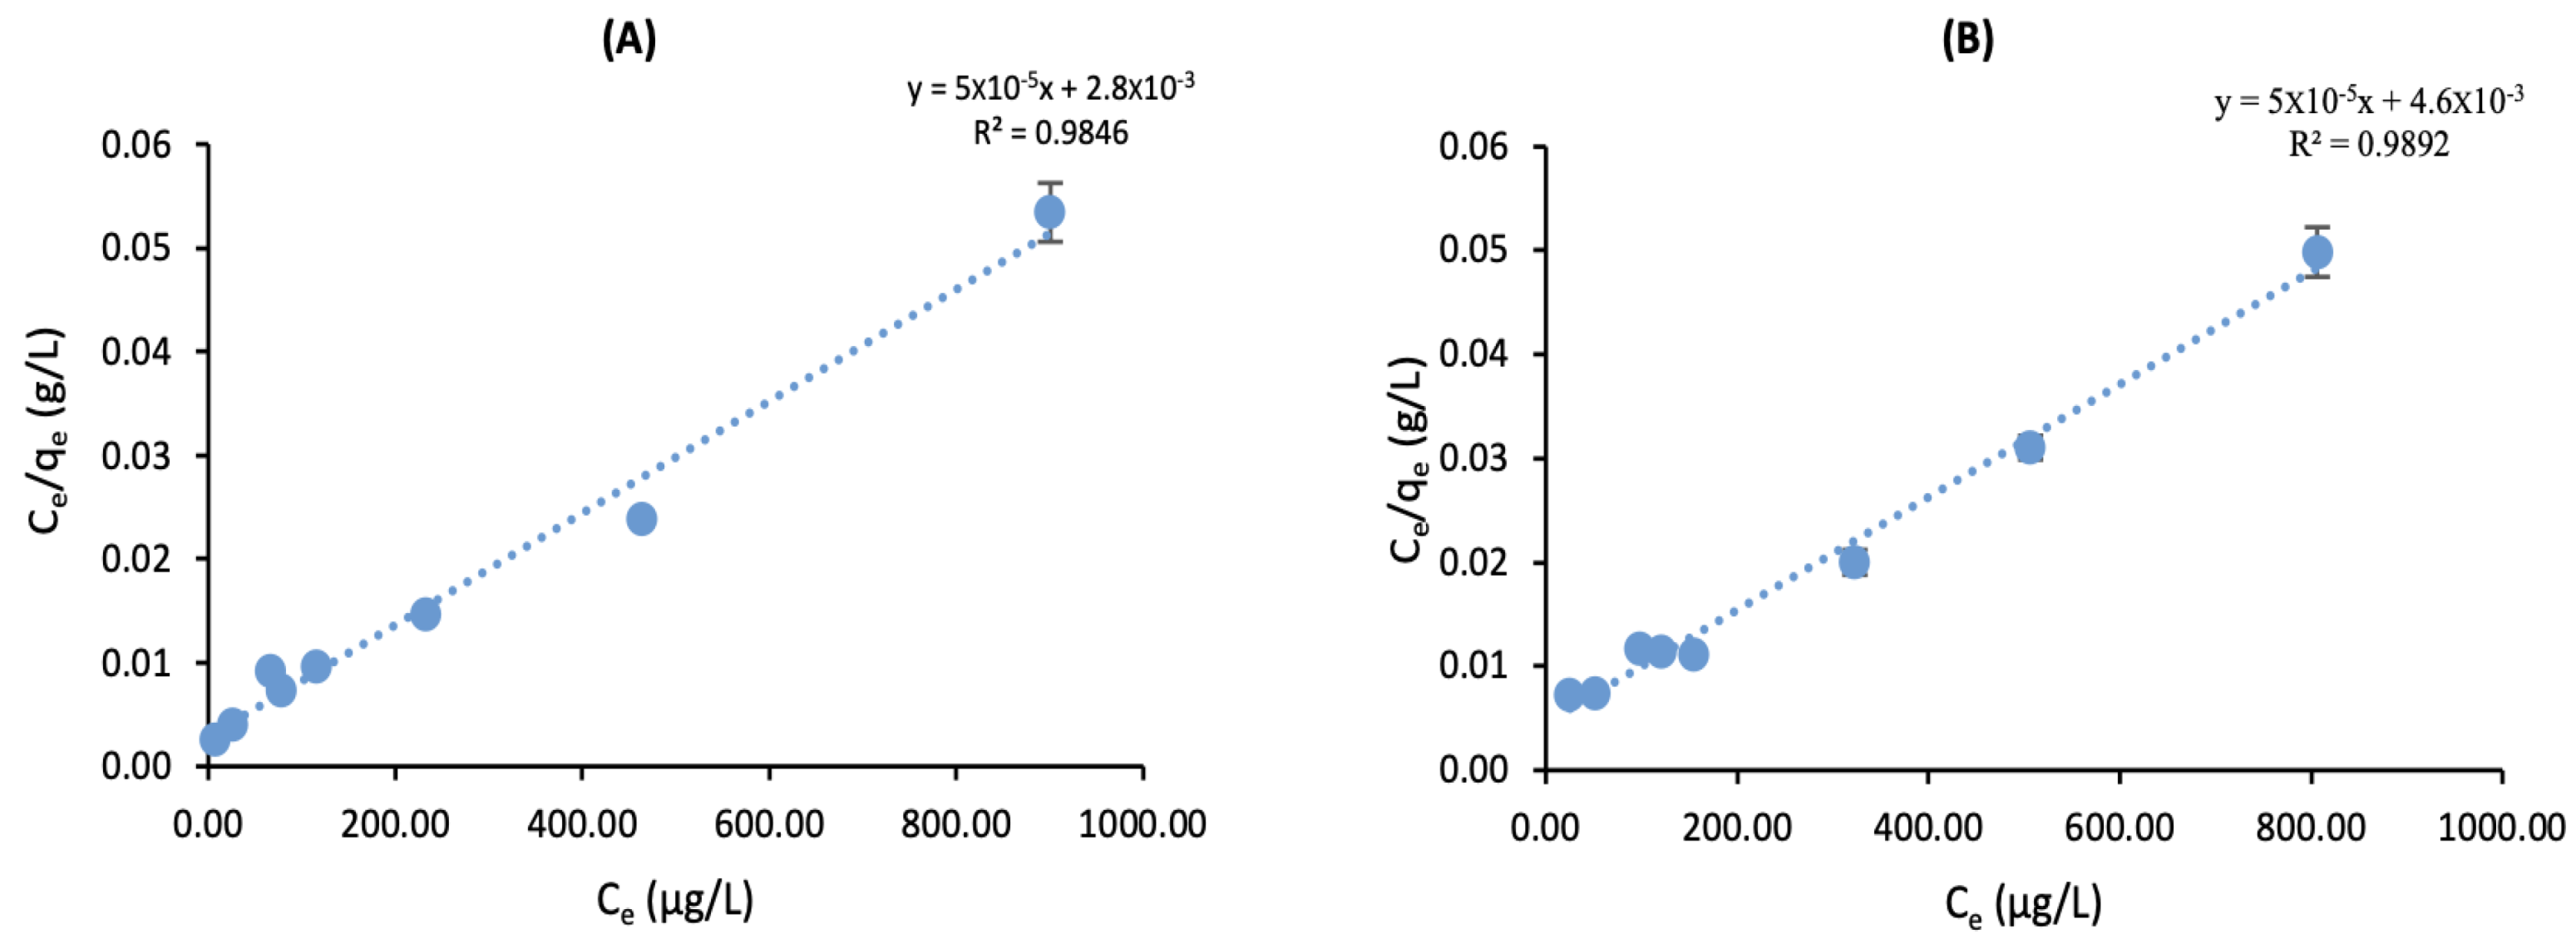
All adsorption isotherm modeling experiments were performed with a mixture of MC-LR and NOD-R in solution. The experimental data were modeled using the Langmuir isotherm model and both plots contain R2 ≥ 0.9846 (Figure 8). The squares of correlation coefficients (R2) suggest that MC-LR and NOD-R adsorption onto H3PO4-AC is well represented by the Langmuir model. The theoretical maximum adsorption capacities for both MC-LR and NOD-R were found to be 20 mg/g. The Langmuir isotherm assumes monolayer adsorption that occurs on homogeneous adsorbent surfaces with no lateral interactions between adsorbed molecules [90]. Furthermore, as described in the model, the specific surface and sorption capacity of H3PO4-AC was limited, rather than the exponentially increasing sorption process assumed by other models, such as the Freundlich model. The Langmuir isotherm model has been used in previous studies to describe MC adsorption on ACs [28,88].
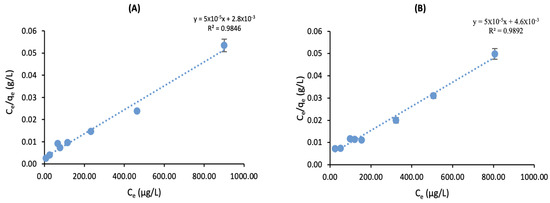
Figure 8.
Langmuir adsorption isotherms acquired for sorption of (A) MC-LR and (B) NOD-R onto H3PO4-AC at room temperature. qe is the equilibrium adsorption capacity and Ce is the equilibrium concentration of MC-LR or NOD-R in solution. Error bars represent ± one standard deviation (n = 3).
Previous studies have also reported the adsorption capacities of various types of AC for MC-LR (Table S5). Wood-based powdered AC showed a maximum adsorption capacity of 280 mg/g. Charcoal-based powdered ACs have adsorption capacities of 116, 75, and 70 mg/g, and coconut shell-based powdered AC has adsorption capacity of 40 mg/g [91]. Compared to those values, the determined sorption capacity of corncob-based AC for MC-LR and NOD-R (~20 mg per g of AC) is lower, but it could be improved by optimizing corncob treatment during the preparation of AC.
4. Conclusions
Continuous human exposure to cyanotoxins through drinking water can cause severe health issues. To minimize this risk of exposure, it is necessary to develop efficient and effective water treatment methods for the removal of cyanotoxins from drinking water. Treated corncob can remove a significant amount of MCs (MC-RR, MC-YR, MC-LR, MC-LA, MC-LW, and MC-LF) and NOD-R from water, and H3PO4-AC has a higher sorption capacity compared to biochar. The sorption of these molecules onto carbonaceous surfaces can occur through the sorbent’s porous structure and hydrophobic and hydrophilic interactions. The adsorption of MC-LR and NOD-R follows the Langmuir isotherm model and a pseudo-second-order kinetic model. The effect of NOM on the adsorption of MCs was evaluated by removing MCs from Lake Erie water collected during cyanoHABs from 2020 to 2022. Even in the presence of NOM, the removal of MCs by H3PO4-AC was complete, but it decreased for biochar. The effect of pH on MC and NOD-R removal was studied at both environmentally relevant low toxin concentrations and high toxin concentrations. For biochar, the removal was affected even at low concentrations of toxins. Changing pH affected the sorption of cyanotoxins by H3PO4-AC only at high concentrations of toxins. An adjustment of the pH of the water to low pH resulted in enhanced adsorption of MCs and NOD-R. Overall, this study confirmed that corncob-based carbonaceous materials could be useful sorbent materials to remove MCs and NOD-R from water.
Supplementary Materials
The following supporting information can be downloaded at: https://www.mdpi.com/article/10.3390/separations11030084/s1, Figure S1: Surface area and porosity measurements of S-3, S-4, and commercial AC, Figure S2: pHPZC of H3PO4-AC, S-3, and S-4, Figure S3: TGA of S-1, HCl-refluxed corncob, and H3PO4-impregnated corncob, Figure S4: SEM images of S-1, HCl-refluxed corncobs, S-3, S-4, H3PO4-AC, Figure S5: SEM-EDS spectra of H3PO4-AC and S-3, Figure S6: PXRD of S-3, S-4, H3PO4-AC, Figure S7: Percent removal of MCs and NOD-R (1000 μg/L each) using S-3 and H3PO4-AC in suspension mode, Figure S8: Percent removal of six MCs and NOD-R (50 μg/L each) at different pH conditions using S-3, S-4, and H3PO4-AC, Figure S9: Non-linear plots of pseudo-second-order kinetics models for the adsorption of MC-LR and NOD-R onto H3PO4-AC, Figure S10: Sorption kinetics of six MCs and NOD-R at lower toxin concentration, Table S1: Net charges of MCs and NOD-R at neutral pH, Table S2 to S4: Concentrations of MCs in lake water collected during HAB and their percent removal using carbonized corncobs and commercial AC, Table S5: Adsorption capacities reported by previous work, Page S3: Sample preparation by SPE and analysis by UHPLC-MS.
Author Contributions
Conceptualization, H.S.K., S.I.T., N.P., M.M. and D.I.; methodology, H.S.K., S.I.T., N.P., M.M. and D.I.; validation, H.S.K. and M.M.K.; formal analysis, H.S.K.; investigation, H.S.K., M.M.K. and M.M.; resources, N.P., M.M. and D.I.; data curation, H.S.K.; writing—original draft preparation, H.S.K., M.M. and D.I.; writing—review and editing, H.S.K., M.M. and D.I.; visualization, H.S.K.; supervision, M.M. and D.I.; project administration, D.I.; funding acquisition, N.P. and D.I. All authors have read and agreed to the published version of the manuscript.
Funding
The authors would like to acknowledge funding from the Harmful Algal Bloom Research Initiative grants from the Ohio Department of Higher Education (ODHE), The Air Force Office of Scientific Research (DURIP 14RT0605) for the acquisition of Orbitrap Fusion instrument, and The University of Toledo Research and Fellowship Program.
Institutional Review Board Statement
Not applicable.
Informed Consent Statement
Not applicable.
Data Availability Statement
Data will be made available upon request.
Acknowledgments
The authors would like to acknowledge Jeff Calmes from the City of Toledo Water Treatment for providing commercial AC (Calgon), and Jennifer Gadient from the Instrumentation Center for acquiring SEM images of the sorbents.
Conflicts of Interest
The authors declare no conflict of interest.
References
- Lee, G.F.; Rast, W.; Jones, R.A. Water Report: Eutrophication of water bodies: Insights for an age old problem. Environ. Sci. Technol. 1978, 12, 900–908. [Google Scholar] [CrossRef]
- Merel, S.; Walker, D.; Chicana, R.; Snyder, S.; Baurès, E.; Thomas, O. State of knowledge and concerns on cyanobacterial blooms and cyanotoxins. Environ. Int. 2013, 59, 303–327. [Google Scholar] [CrossRef]
- Oberhaus, L.; Briand, J.F.; Leboulanger, C.; Jacquet, S.; Humbert, J.F. Comparative effects of the quality and quantity of light and temperature on the growth of Planktothrix agardhii and P. rubescens1. J. Phycol. 2007, 43, 1191–1199. [Google Scholar] [CrossRef]
- Bláha, L.; Babica, P.; Maršálek, B. Toxins produced in cyanobacterial water blooms—toxicity and risks. Interdiscip. Toxicol. 2009, 2, 36–41. [Google Scholar] [CrossRef]
- Žegura, B.; Štraser, A.; Filipič, M. Genotoxicity and potential carcinogenicity of cyanobacterial toxins—a review. Mutat. Res. Mutat. Res. 2011, 727, 16–41. [Google Scholar] [CrossRef]
- Rinehart, K.L.; Harada, K.; Namikoshi, M.; Chen, C.; Harvis, C.A.; Munro, M.H.G.; Blunt, J.W.; Mulligan, P.E.; Beasley, V.R. Nodularin, microcystin, and the configuration of Adda. J. Am. Chem. Soc. 1988, 110, 8557–8558. [Google Scholar] [CrossRef]
- Jones, M.R.; Pinto, E.; Torres, M.A.; Dörr, F.; Mazur-Marzec, H.; Szubert, K.; Tartaglione, L.; Dell’Aversano, C.; Miles, C.O.; Beach, D.G.; et al. CyanoMetDB, a comprehensive public database of secondary metabolites from cyanobacteria. Water Res. 2021, 196, 117017. [Google Scholar] [CrossRef]
- Carmichael, W.W. Jussi Meriluoto, Lisa Spoof, and Geoffrey A. Codd (Eds.): Handbook of cyanobacterial monitoring and cyanotoxin analysis. Anal. Bioanal. Chem. 2018, 410, 1405–1406. [Google Scholar] [CrossRef]
- Loftin, K.A.; Graham, J.L.; Hilborn, E.D.; Lehmann, S.C.; Meyer, M.T.; Dietze, J.E.; Griffith, C.B. Cyanotoxins in inland lakes of the United States: Occurrence and potential recreational health risks in the EPA National Lakes Assessment 2007. Harmful Algae 2016, 56, 77–90. [Google Scholar] [CrossRef] [PubMed]
- Palagama, D.S.; Baliu-Rodriguez, D.; Snyder, B.K.; Thornburg, J.A.; Bridgeman, T.B.; Isailovic, D. Identification and quantification of microcystins in western Lake Erie during 2016 and 2017 harmful algal blooms. J. Gt. Lakes Res. 2020, 46, 289–301. [Google Scholar] [CrossRef]
- Namikoshi, M.; Choi, B.W.; Sakai, R.; Sun, F.; Rinehart, K.L.; Carmichael, W.W.; Evans, W.R.; Cruz, P.; Munro, M.H.G.; Blunt, J.W. New Nodularins: A General Method for Structure Assignment. J. Org. Chem. 1994, 59, 2349–2357. [Google Scholar] [CrossRef]
- Chen, Y.; Shen, D.; Fang, D. Nodularins in poisoning. Clin. Chim. Acta 2013, 425, 18–29. [Google Scholar] [CrossRef]
- Campos, A.; Vasconcelos, V. Molecular Mechanisms of Microcystin Toxicity in Animal Cells. Int. J. Mol. Sci. 2010, 11, 268–287. [Google Scholar] [CrossRef]
- He, J.; Li, G.; Chen, J.; Lin, J.; Zeng, C.; Chen, J.; Deng, J.; Xie, P. Prolonged exposure to low-dose microcystin induces nonalcoholic steatohepatitis in mice: A systems toxicology study. Arch. Toxicol. 2017, 91, 465–480. [Google Scholar] [CrossRef]
- EPA. Drinking Water Health Advisories for Cyanotoxins|US EPA. Available online: https://www.epa.gov/cyanohabs/epa-drinking-water-health-advisories-cyanotoxins (accessed on 10 May 2023).
- Jetoo, S.; Grover, V.I.; Krantzberg, G. The Toledo Drinking Water Advisory: Suggested Application of the Water Safety Planning Approach. Sustainability 2015, 7, 9787–9808. [Google Scholar] [CrossRef]
- Lambert, T.W.; Holmes, C.F.B.; Hrudey, S.E. Microcystin class of toxins: Health effects and safety of drinking water supplies. Environ. Rev. 1994, 2, 167–186. [Google Scholar] [CrossRef]
- Şengül, A.B.; Ersan, G.; Tüfekçi, N. Removal of intra- and extracellular microcystin by submerged ultrafiltration (UF) membrane combined with coagulation/flocculation and powdered activated carbon (PAC) adsorption. J. Hazard. Mater. 2018, 343, 29–35. [Google Scholar] [CrossRef]
- Zhang, Y.; Tian, J.; Nan, J.; Gao, S.; Liang, H.; Wang, M.; Li, G. Effect of PAC addition on immersed ultrafiltration for the treatment of algal-rich water. J. Hazard. Mater. 2011, 186, 1415–1424. [Google Scholar] [CrossRef] [PubMed]
- Zhang, X.; Jiang, L. Fabrication of novel rattle-type magnetic mesoporous carbon microspheres for removal of microcystins. J. Mater. Chem. 2011, 21, 10653. [Google Scholar] [CrossRef]
- Westrick, J.A.; Szlag, D.C.; Southwell, B.J.; Sinclair, J. A review of cyanobacteria and cyanotoxins removal/inactivation in drinking water treatment. Anal. Bioanal. Chem. 2010, 397, 1705–1714. [Google Scholar] [CrossRef]
- He, X.; Liu, Y.-L.; Conklin, A.; Westrick, J.; Weavers, L.K.; Dionysiou, D.D.; Lenhart, J.J.; Mouser, P.J.; Szlag, D.; Walker, H.W. Toxic cyanobacteria and drinking water: Impacts, detection, and treatment. Harmful Algae 2016, 54, 174–193. [Google Scholar] [CrossRef]
- Ampiaw, R.E.; Yaqub, M.; Lee, W. Adsorption of microcystin onto activated carbon: A review. Membr. Water Treat. 2019, 10, 405–415. [Google Scholar] [CrossRef]
- Frota, A.M.; Pinheiro, T.L.; Ibraim, E.; Pak, T.; Capelo-Neto, J. Understanding the properties of activated carbon and biochar for the adsorption and removal of cyanotoxins: A systematic review. An. Acad. Bras. Ciênc. 2024, 95, e20230061. [Google Scholar] [CrossRef] [PubMed]
- Rorar, J.; Garcia, L.D.; Cutright, T. Removal of saxitoxin and anatoxin-a by PAC in the presence and absence of microcystin-LR and/or cyanobacterial cells. J. Environ. Sci. 2023, 128, 161–170. [Google Scholar] [CrossRef] [PubMed]
- Frišták, V.; Laughinghouse, H.D.; Bell, S.M. The Use of Biochar and Pyrolysed Materials to Improve Water Quality through Microcystin Sorption Separation. Water 2020, 12, 2871. [Google Scholar] [CrossRef]
- Ho, L.; Lambling, P.; Bustamante, H.; Duker, P.; Newcombe, G. Application of powdered activated carbon for the adsorption of cylindrospermopsin and microcystin toxins from drinking water supplies. Water Res. 2011, 45, 2954–2964. [Google Scholar] [CrossRef] [PubMed]
- Pendleton, P.; Schumann, R.; Wong, S.H. Microcystin-LR Adsorption by Activated Carbon. J. Colloid Interface Sci. 2001, 240, 1–8. [Google Scholar] [CrossRef] [PubMed]
- Pathak, U.; Das, P.; Banerjee, P.; Datta, S. Treatment of Wastewater from a Dairy Industry Using Rice Husk as Adsorbent: Treatment Efficiency, Isotherm, Thermodynamics, and Kinetics Modelling. J. Thermodyn. 2016, 2016, 3746316. [Google Scholar] [CrossRef]
- Ania, C.; Parra, J.; Menéndez, J.; Pis, J. Effect of microwave and conventional regeneration on the microporous and mesoporous network and on the adsorptive capacity of activated carbons. Microporous Mesoporous Mater. 2005, 85, 7–15. [Google Scholar] [CrossRef]
- Kim, S.; Won, S.W.; Cho, C.-W.; Yun, Y.-S. Valorization of Escherichia coli waste biomass as a biosorbent for removing reactive dyes from aqueous solutions. Desalination Water Treat. 2016, 57, 20084–20090. [Google Scholar] [CrossRef]
- Girgis, B.S.; Yunis, S.S.; Soliman, A.M. Characteristics of activated carbon from peanut hulls in relation to conditions of preparation. Mater. Lett. 2002, 57, 164–172. [Google Scholar] [CrossRef]
- Gratuito, M.; Panyathanmaporn, T.; Chumnanklang, R.-A.; Sirinuntawittaya, N.; Dutta, A. Production of activated carbon from coconut shell: Optimization using response surface methodology. Bioresour. Technol. 2008, 99, 4887–4895. [Google Scholar] [CrossRef]
- Menya, E.; Olupot, P.; Storz, H.; Lubwama, M.; Kiros, Y. Production and performance of activated carbon from rice husks for removal of natural organic matter from water: A review. Chem. Eng. Res. Des. 2018, 129, 271–296. [Google Scholar] [CrossRef]
- Song, H.J.; Gurav, R.; Bhatia, S.K.; Bin Lee, E.; Kim, H.J.; Yang, Y.-H.; Kan, E.; Kim, H.H.; Lee, S.H.; Choi, Y.-K. Treatment of microcystin-LR cyanotoxin contaminated water using Kentucky bluegrass-derived biochar. J. Water Process Eng. 2021, 41, 102054. [Google Scholar] [CrossRef]
- Wei, L.; Lu, J. Adsorption of microcystin-LR by rice straw biochars with different pyrolysis temperatures. Environ. Technol. Innov. 2021, 23, 101609. [Google Scholar] [CrossRef]
- Zeng, S.; Kan, E. Adsorption and regeneration on iron-activated biochar for removal of microcystin-LR. Chemosphere 2021, 273, 129649. [Google Scholar] [CrossRef] [PubMed]
- Hena, S.; Ismail, N.; Isaam, A.M.; Ahmad, A.; Bhawani, S.A. Removal of microcystin-LR from aqueous solutions using % burn-off activated carbon of waste wood material. J. Water Supply Res. Technol.-Aqua 2014, 63, 332–341. [Google Scholar] [CrossRef]
- de Albuquerque Júnior, E.C.; Méndez, M.O.A.; Coutinho, A.d.R.; Franco, T.T. Removal of cyanobacteria toxins from drinking water by adsorption on activated carbon fibers. Mater. Res. 2008, 11, 371–380. [Google Scholar] [CrossRef]
- Liu, G.; Zheng, H.; Zhai, X.; Wang, Z. Characteristics and mechanisms of microcystin-LR adsorption by giant reed-derived biochars: Role of minerals, pores, and functional groups. J. Clean. Prod. 2018, 176, 463–473. [Google Scholar] [CrossRef]
- Tsai, W.T.; Chang, C.Y.; Lee, S.L.; Wang, S.Y. Thermogravimetric Analysis of Corn Cob Impregnated With Zinc Chloride for Preparation of Activated Carbon. J. Therm. Anal. Calorim. 2001, 63, 351–357. [Google Scholar] [CrossRef]
- Pingali, P.L.; Pandey, S. Part 1 Meeting World Maize Needs: Technological Opportunities and Priorities for the Public Sector; International Maize and Wheat Improvement Center (CIMMYT): Texcoco, Mexico, 2000. [Google Scholar]
- Giri, B.S.; Gun, S.; Pandey, S.; Trivedi, A.; Kapoor, R.T.; Singh, R.P.; Abdeldayem, O.M.; Rene, E.R.; Yadav, S.; Chaturvedi, P.; et al. Reusability of brilliant green dye contaminated wastewater using corncob biochar and Brevibacillus parabrevis: Hybrid treatment and kinetic studies. Bioengineered 2020, 11, 743–758. [Google Scholar] [CrossRef]
- Vafakhah, S.; Bahrololoom, M.; Bazarganlari, R.; Saeedikhani, M. Removal of copper ions from electroplating effluent solutions with native corn cob and corn stalk and chemically modified corn stalk. J. Environ. Chem. Eng. 2014, 2, 356–361. [Google Scholar] [CrossRef]
- Selvakumar, P.; Adane, A.; Zelalem, T.; Hunegnaw, B.; Karthik, V.; Kavitha, S.; Jayakumar, M.; Karmegam, N.; Govarthanan, M.; Kim, W. Optimization of binary acids pretreatment of corncob biomass for enhanced recovery of cellulose to produce bioethanol. Fuel 2022, 321, 124060. [Google Scholar] [CrossRef]
- Berber-Villamar, N.K.; Netzahuatl-Muñoz, A.R.; Morales-Barrera, L.; Chávez-Camarillo, G.M.; Flores-Ortiz, C.M.; Cristiani-Urbina, E. Corncob as an effective, eco-friendly, and economic biosorbent for removing the azo dye Direct Yellow 27 from aqueous solutions. PLoS ONE 2018, 13, e0196428. [Google Scholar] [CrossRef]
- Khan, M.N.; Wahab, M.F. Characterization of chemically modified corncobs and its application in the removal of metal ions from aqueous solution. J. Hazard. Mater. 2007, 141, 237–244. [Google Scholar] [CrossRef] [PubMed]
- Jawad, A.H.; Sabar, S.; Ishak, M.A.M.; Wilson, L.D.; Norrahma, S.S.A.; Talari, M.K.; Farhan, A.M. Microwave-assisted preparation of mesoporous-activated carbon from coconut (Cocos nucifera) leaf by H3PO4 activation for methylene blue adsorption. Chem. Eng. Commun. 2017, 204, 1143–1156. [Google Scholar] [CrossRef]
- Liu, Q.-S.; Zheng, T.; Li, N.; Wang, P.; Abulikemu, G. Modification of bamboo-based activated carbon using microwave radiation and its effects on the adsorption of methylene blue. Appl. Surf. Sci. 2010, 256, 3309–3315. [Google Scholar] [CrossRef]
- Palagama, D.S.; Devasurendra, A.M.; Baliu-Rodriguez, D.; Kirchhoff, J.R.; Isailovic, D. Treated rice husk as a recyclable sorbent for the removal of microcystins from water. Sci. Total Environ. 2019, 666, 1292–1300. [Google Scholar] [CrossRef]
- El-Hendawy, A.-N.A.; Samra, S.E.; Girgis, B.S. Adsorption characteristics of activated carbons obtained from corncobs. Colloids Surf. Physicochem. Eng. Asp. 2001, 180, 209–221. [Google Scholar] [CrossRef]
- Brunauer, S.; Emmett, P.H.; Teller, E. Adsorption of Gases in Multimolecular Layers. J. Am. Chem. Soc. 1938, 60, 309–319. [Google Scholar] [CrossRef]
- Haul, R. SJ Gregg, KSW Sing: Adsorption, Surface Area and Porosity. 2. Auflage; Academic Press: London, UK, 1982; Volume 86, p. 957. [Google Scholar] [CrossRef]
- Liu, B.; Gu, J.; Zhou, J. High surface area rice husk-based activated carbon prepared by chemical activation with ZnCl2 -CuCl2 composite activator. Environ. Prog. Sustain. Energy 2016, 35, 133–140. [Google Scholar] [CrossRef]
- Palagama, D.S.W.; West, R.E., III; Isailovic, D. Improved solid-phase extraction protocol and sensitive quantification of six microcystins in water using an HPLC-orbitrap mass spectrometry system. Anal. Methods 2017, 9, 2021–2030. [Google Scholar] [CrossRef]
- Baliu-Rodriguez, D.; Peraino, N.J.; Premathilaka, S.H.; Birbeck, J.A.; Baliu-Rodriguez, T.; Westrick, J.A.; Isailovic, D. Identification of Novel Microcystins Using High-Resolution MS and MSn with Python Code. Environ. Sci. Technol. 2022, 56, 1652–1663. [Google Scholar] [CrossRef] [PubMed]
- Park, J.-A.; Kang, J.-K.; Jung, S.-M.; Choi, J.-W.; Lee, S.-H.; Yargeau, V.; Kim, S.-B. Investigating Microcystin-LR adsorption mechanisms on mesoporous carbon, mesoporous silica, and their amino-functionalized form: Surface chemistry, pore structures, and molecular characteristics. Chemosphere 2020, 247, 125811. [Google Scholar] [CrossRef]
- Teng, W.; Wu, Z.; Feng, D.; Fan, J.; Wang, J.; Wei, H.; Song, M.; Zhao, D. Rapid and Efficient Removal of Microcystins by Ordered Mesoporous Silica. Environ. Sci. Technol. 2013, 47, 8633–8641. [Google Scholar] [CrossRef]
- Thommes, M.; Kaneko, K.; Neimark, A.V.; Olivier, J.P.; Rodriguez-Reinoso, F.; Rouquerol, J.; Sing, K.S.W. Physisorption of gases, with special reference to the evaluation of surface area and pore size distribution (IUPAC Technical Report). Pure Appl. Chem. 2015, 87, 1051–1069. [Google Scholar] [CrossRef]
- Thenuwara, S.I.; Kiridena, H.S.; Kirchhoff, J.R.; Isailović, D. Evaluation of the mechanisms of adsorption of microcystins and nodularin-R onto rice husk-based biochar. Environ. Adv. 2022, 9, 100314. [Google Scholar] [CrossRef]
- Pivokonsky, M.; Kopecka, I.; Cermakova, L.; Fialova, K.; Novotna, K.; Cajthaml, T.; Henderson, R.K.; Pivokonska, L. Current knowledge in the field of algal organic matter adsorption onto activated carbon in drinking water treatment. Sci. Total Environ. 2021, 799, 149455. [Google Scholar] [CrossRef]
- Lee, S.; Zhang, Z.; Wang, X.; Pfefferle, L.D.; Haller, G.L. Characterization of multi-walled carbon nanotubes catalyst supports by point of zero charge. Catal. Today 2011, 164, 68–73. [Google Scholar] [CrossRef]
- Faulconer, E.K.; Mazyck, D.W. Influence of activated carbon surface oxygen functionality on elemental mercury adsorption from aqueous solution. J. Environ. Chem. Eng. 2017, 5, 2879–2885. [Google Scholar] [CrossRef]
- Newcombe, G.; Cook, D.; Brooke, S.; Ho, L.; Slyman, N. Treatment options for microcystin toxins: Similarities and differences between variants. Environ. Technol. 2003, 24, 299–308. [Google Scholar] [CrossRef]
- Yang, H.; Yan, R.; Chen, H.; Lee, D.H.; Zheng, C. Characteristics of hemicellulose, cellulose and lignin pyrolysis. Fuel 2007, 86, 1781–1788. [Google Scholar] [CrossRef]
- Wanitwattanarumlug, B.; Luengnaruemitchai, A.; Wongkasemjit, S. Characterization of Corn Cobs from Microwave and Potassium Hydroxide Pretreatment. Int. J. Chem. Mol. Nucl. Mater. Metall. Eng. 2012, 6, 354–358. [Google Scholar]
- Yasmin, R.; Aftab, K.; Kashif, M. Removal of microcystin-LR from aqueous solution using Moringa oleifera Lam. seeds. Water Sci. Technol. 2019, 79, 104–113. [Google Scholar] [CrossRef]
- Nahil, M.A.; Williams, P.T. Pore characteristics of activated carbons from the phosphoric acid chemical activation of cotton stalks. Biomass Bioenergy 2012, 37, 142–149. [Google Scholar] [CrossRef]
- Jagtoyen, M.; Derbyshire, F. Activated carbons from yellow poplar and white oak by H3PO4 activation. Carbon 1998, 36, 1085–1097. [Google Scholar] [CrossRef]
- Liou, T.-H. Development of mesoporous structure and high adsorption capacity of biomass-based activated carbon by phosphoric acid and zinc chloride activation. Chem. Eng. J. 2010, 158, 129–142. [Google Scholar] [CrossRef]
- Castro, J.B.; Bonelli, P.R.; Cerrella, E.G.; Cukierman, A.L. Phosphoric Acid Activation of Agricultural Residues and Bagasse from Sugar Cane: Influence of the Experimental Conditions on Adsorption Characteristics of Activated Carbons. Ind. Eng. Chem. Res. 2000, 39, 4166–4172. [Google Scholar] [CrossRef]
- Fonseca-Correa, R.; Giraldo, L.; Moreno-Piraján, J.C. Trivalent chromium removal from aqueous solution with physically and chemically modified corncob waste. J. Anal. Appl. Pyrolysis 2013, 101, 132–141. [Google Scholar] [CrossRef]
- Li, J.; Cao, L.; Yuan, Y.; Wang, R.; Wen, Y.; Man, J. Comparative study for microcystin-LR sorption onto biochars produced from various plant- and animal-wastes at different pyrolysis temperatures: Influencing mechanisms of biochar properties. Bioresour. Technol. 2018, 247, 794–803. [Google Scholar] [CrossRef]
- Abbas, T.; Kajjumba, G.W.; Ejjada, M.; Masrura, S.U.; Marti, E.J.; Khan, E.; Jones-Lepp, T.L. Recent Advancements in the Removal of Cyanotoxins from Water Using Conventional and Modified Adsorbents—A Contemporary Review. Water 2020, 12, 2756. [Google Scholar] [CrossRef]
- Li, Q.; Snoeyink, V.L.; Campos, C.; Mariñas, B.J. Displacement Effect of NOM on Atrazine Adsorption by PACs with Different Pore Size Distributions. Environ. Sci. Technol. 2002, 36, 1510–1515. [Google Scholar] [CrossRef]
- Zhang, L.; Tang, S.; Jiang, S. Immobilization of Microcystin by the Hydrogel–Biochar Composite to Enhance Biodegradation during Drinking Water Treatment. ACS EST Water 2023, 3, 3044–3056. [Google Scholar] [CrossRef]
- Campinas, M.; Viegas, R.M.; Rosa, M.J. Modelling and understanding the competitive adsorption of microcystins and tannic acid. Water Res. 2013, 47, 5690–5699. [Google Scholar] [CrossRef]
- Cook, D.; Newcombe, G. Comparison and Modeling of the Adsorption of Two MIcrocystin Analogues onto Powdered Activated Carbon. Environ. Technol. 2008, 29, 525–534. [Google Scholar] [CrossRef]
- Bajracharya, A.; Liu, Y.-L.; Lenhart, J.J. The influence of natural organic matter on the adsorption of microcystin-LR by powdered activated carbon. Environ. Sci. Water Res. Technol. 2019, 5, 256–267. [Google Scholar] [CrossRef]
- Najm, I.N.; Snoeyink, V.L.; Lykins, B.W., Jr.; Adams, J.Q. Using Powdered Activated Carbon: A Critical Review. J. Am. Water Works Assoc. 1991, 83, 65–76. [Google Scholar] [CrossRef]
- Verspagen, J.M.H.; Van de Waal, D.B.; Finke, J.F.; Visser, P.M.; Van Donk, E.; Huisman, J. Rising CO2 Levels Will Intensify Phytoplankton Blooms in Eutrophic and Hypertrophic Lakes. PLoS ONE 2014, 9, e104325. [Google Scholar] [CrossRef] [PubMed]
- Zhao, Z.; Sun, W.; Ray, M.B. Adsorption isotherms and kinetics for the removal of algal organic matter by granular activated carbon. Sci. Total Environ. 2022, 806, 150885. [Google Scholar] [CrossRef]
- Huang, W.-J.; Cheng, B.-L.; Cheng, Y.-L. Adsorption of microcystin-LR by three types of activated carbon. J. Hazard. Mater. 2007, 141, 115–122. [Google Scholar] [CrossRef] [PubMed]
- Pavagadhi, S.; Tang, A.L.L.; Sathishkumar, M.; Loh, K.P.; Balasubramanian, R. Removal of microcystin-LR and microcystin-RR by graphene oxide: Adsorption and kinetic experiments. Water Res. 2013, 47, 4621–4629. [Google Scholar] [CrossRef]
- Stuart, M.; Fleer, G.; Lyklema, J.; Norde, W.; Scheutjens, J. Adsorption of Ions, Polyelectrolytes and Proteins. Adv. Colloid Interface Sci. 1991, 34, 477–535. [Google Scholar] [CrossRef]
- Newcombe, G.; Drikas, M. Adsorption of NOM onto activated carbon: Electrostatic and non-electrostatic effects. Carbon 1997, 35, 1239–1250. [Google Scholar] [CrossRef]
- Van de Steeg, H.G.M.; Stuart, M.A.C.; De Keizer, A.; Bijsterbosch, B.H. Polyelectrolyte adsorption: A subtle balance of forces. Langmuir 1992, 8, 2538–2546. [Google Scholar] [CrossRef]
- Campinas, M.; Rosa, M.J. The ionic strength effect on microcystin and natural organic matter surrogate adsorption onto PAC. J. Colloid Interface Sci. 2006, 299, 520–529. [Google Scholar] [CrossRef]
- Ho, Y.S.; McKay, G. Pseudo-second order model for sorption processes. Process Biochem. 1999, 34, 451–465. [Google Scholar] [CrossRef]
- Jawad, A.H.; Bardhan, M.; Islam, A.; Islam, A.; Syed-Hassan, S.S.A.; Surip, S.; Alothman, Z.A.; Khan, M.R. Insights into the modeling, characterization and adsorption performance of mesoporous activated carbon from corn cob residue via microwave-assisted H3PO4 activation. Surf. Interfaces 2020, 21, 100688. [Google Scholar] [CrossRef]
- Donati, C.; Drikas, M.; Hayes, R.; Newcombe, G. Microcystin-LR adsorption by powdered activated carbon. Water Res. 1994, 28, 1735–1742. [Google Scholar] [CrossRef]
Disclaimer/Publisher’s Note: The statements, opinions and data contained in all publications are solely those of the individual author(s) and contributor(s) and not of MDPI and/or the editor(s). MDPI and/or the editor(s) disclaim responsibility for any injury to people or property resulting from any ideas, methods, instructions or products referred to in the content. |
© 2024 by the authors. Licensee MDPI, Basel, Switzerland. This article is an open access article distributed under the terms and conditions of the Creative Commons Attribution (CC BY) license (https://creativecommons.org/licenses/by/4.0/).

