Article

Comparison of Acid- and Base-Modified Biochar Derived from Douglas Fir for Removal of Copper (II) from Wastewater

by
Beatrice Arwenyo
1,2,
Prashan M. Rodrigo
1,
Olalekan A. Olabode
1,3,
Hashani P. Abeysinghe
1,
Jessie N. Tisdale
1,
Rose C. Azuba
4 and
Todd E. Mlsna
1,*
1
Department of Chemistry, Mississippi State University, Starkville, MS 39762, USA
2
Department of Chemistry, Gulu University, Gulu P.O. Box 166, Uganda
3
Department of Pure and Applied Chemistry, Osun State University, Osogbo 230212, Osun State, Nigeria
4
College of Veterinary Medicine, Animal Resources and Biosecurity, Makerere University, Kampala P.O. Box 7062, Uganda
*
Author to whom correspondence should be addressed.
Separations 2024, 11(3), 78; https://doi.org/10.3390/separations11030078
Submission received: 22 January 2024 / Revised: 22 February 2024 / Accepted: 26 February 2024 / Published: 1 March 2024
(This article belongs to the Special Issue Adsorption Technique for Water Purification)

Abstract

:
Copper is a non-biodegradable heavy metal, and high levels in water bodies cause serious environmental and health issues. Douglas fir biochar has a higher number of carboxylic, phenolic, and lactonic groups, which provide suitable active sites for copper removal. Douglas fir biochar (BC) was modified using 20% solutions of KOH (KOH/BC), H2SO4, (H2SO4/BC), and Na2CO3 (Na2CO3/BC). All materials were characterized using SEM, SEM-EDS, FTIR, TGA, XRD, BET, and elemental analysis. These modifications were done to compare the activations of those sites by measuring copper removal efficiencies. KOH/BC, H2SO4/BC, and Na2CO3/BC materials gave surface areas of 389.3, 326.7, and 367.9 m2 g−1, respectively, compared with pristine biochar with a surface area of 578.9 m2 g−1. The maximum Langmuir adsorption capacities for Na2CO3/BC, KOH/BC, BC, and H2SO4/BC were 24.79, 18.31, 17.38, and 9.17 mg g−1, respectively. All three modifications gave faster kinetics at 2 mg/L initial copper concentrations (pH 5) compared with pristine BC. The copper removal efficiency was demonstrated in four different spiked real water matrices. The copper removals of all four water matrices were above 90% at 2 mg/L initial concentration with a 2 g/L biochar dosage. The competitive effects of Pb2+, Zn2+, Cd2+, and Mg2+ were studied at equimolar concentrations of Cu2+ and competitive ions for all four materials.

Graphical Abstract

1. Introduction

Heavy metal presence in water remains a critical pollution problem across the globe. Even at low concentrations, heavy metals accumulate in the environment and can be transferred to humans from plants and animals via the food chain [1]. These non-degradable metals are toxic and have serious health risks. Copper, though essential to both plants and animals at low concentrations [2,3], causes anemia, kidney damage, stomach and intestinal distress, coma, and eventual death if the threshold limit is exceeded [4,5]. Continuous copper accumulation in the environment results from human activities, including industrialization, waste from copper mines, and poor waste management of copper-containing materials such as from electric wires, analytical reagents, and electroplating [6]. The United States Environment Protection Agency has recommended maximum drinking water copper concentration limits of 1.3 mg L−1 [7,8].
Various treatment methods, including ion exchange, precipitation, adsorption, and solvent extraction, have been used for heavy metal removal from aqueous solutions [9,10]. However, technologies such as ion exchange, precipitation, and solvent extraction not only create other problems such as metal-bearing sludge, but are costly [11]. Adsorption is a relatively inexpensive treatment method. This, however, depends on the adsorbents used. Activated carbon, biochar, and clay are some of the common adsorbents used for water treatment [7,12]. Both activated carbon and biochar are characterized by large surface areas and surface functional groups that aid the removal of contaminants. Compared with activated carbon, biochar is less expensive and easier to make [10]. In addition, biochar adsorption ability can be further improved by modification [13].
Recently, interest in developing low-cost and eco-friendly adsorbents has grown. Different cheap adsorbents have been used to remove metal ions from wastewater, including pine fruit [14], wheat straw, rice hulls and lentil shells [15], peat, marine algae, clays, maize cob, bagasse, and palm fruit bunch. Pavan Kumar et al. used groundnut seed cake, sesame seed cake, and coconut seed cake powders as biosorbents to remove Cu2+ from an aqueous solution and attained maximum adsorption capacities of 4.82, 4.24, and 4.32 mg g−1, respectively [16]. Shah et al. reported a maximum Cu2+ adsorption capacity of 28.75 mg/g from an aqueous solution using a copolymer obtained by grafting cassava starch with 5-chloromethyl-8-hydroxyquinoline [5]. Information regarding commercially available adsorbents, including Douglas fir biochar, is currently limited and lacks comprehensive documentation.
In this work, the use of commercially available Douglas fir biochar was investigated as an economical and available adsorbent to remove copper from aqueous solutions. Douglas fir biochar is a byproduct of syngas production by Biochar Supreme Company. Our major focus was to investigate the effects of post-treatment on Douglas fir biochar Cu2+sorption capacity. Moreover, we focused on activating lactones, phenols, and carboxylic groups present in Douglas fir biochar using acid and base modifications [17]. Different treatment reagents, including KOH, Na2CO3, and H2SO4, were used for the post-treatment. Several characterization studies, including SEM, EDX, XRD, and TGA, were performed.

2. Materials and Methods

2.1. Chemicals

Analytical grade materials, including (KOH (≥85%), NaOH (≥97%), Na2CO3 (≥99.5%), HCl (~37%), H2SO4 (95–98%), HNO3 (~70%), CuSO4·5H2O (≥98%), Pb(NO3)2 (≥99%), Zn(NO3)2·6H2O (≥98%), Mg(NO3)2·6H2O (≥99%), Cd(NO3)2·4H2O (≥98%), and NaCl (≥99%), were purchased from Sigma Aldrich (Saint Louis, MO, USA).

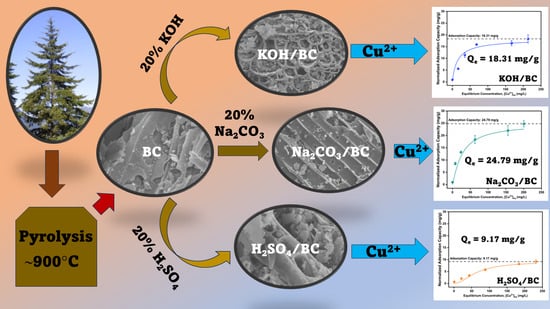
2.2. Preparation of Douglas Fir Biochar

Douglas fir biochar (BC) is obtained as a byproduct from bio-syngas production. It is a commercial product (Black Owl Biochar Environment Ultra) from Biochar Supreme Inc. (Everson, WA, USA) The biochar preparation method involved the introduction of green Douglas fir wood chips into an air-fed updraft wood gasifier at ~900–1000 °C for a residence time of ~10−30 s. This method was previously reported by Bombuwala et al. [18].

2.3. Modification of Douglas Fir Biochar (BC)

Douglas fir biochar (BC) of particle size ≤ 420 µm was treated with 20% solutions of KOH, H2SO4, and Na2CO3, respectively, with 20 g of Douglas fir biochar mixed with 100 mL of each solution and the slurry stirred for 24 h with a magnetic stirrer at a speed of 400 rpm at ~25 °C. After standing for another 24 h, the supernatant was filtered through Whatman No. 1 filter paper using a vacuum filter, and the residues were washed three times each with 200 mL of deionized water (DI H2O) before oven-drying (105 °C) to a constant weight. The untreated and KOH-, H2SO4-, and Na2CO3-treated Douglas fir biochar was designated as BC, KOH/BC, H2SO4/BC, and Na2CO3/BC, respectively.

2.4. Characterization of Douglas Fir Biochar and Modified Douglas Fir Biochar

The surface area and pore size analyses of the BC, KOH/BC, H2SO4/BC, and Na2CO3/BC were carried out based on the BET (Brunauer, Emmet, and Teller) method using N2 at 77.30 K with a Micromeritics Tristar II Plus Version 2.03 Plus surface area analyzer. Prior to the analysis, the samples were degassed for at least 6 h at 180 °C. The morphology of the samples was analyzed with scanning electron microscopy (JEOL JSM-6500F FE-SEM (Peabody, MA, USA) operated at 5 kV) and the mineral content was determined using scanning electron microscopy-electron diffraction energy (SEM-EDX) spectroscopy and Powder X-ray diffraction techniques (Rigaku Ultima III qualx 2.0 software with POWcod database), with an X-ray diffraction system using Cu-Kα (λ = 1.54 Å) radiation at 45 kV and 40 mA. The XRD patterns were measured by scanning 2θ from 0° to 90° at 4° min−1.
Fourier transform infrared spectroscopy (FT-IR) analysis of Douglas fir biochar and activated Douglas fir biochar was performed using a Nicolet 6700 FT-IR spectrometer (Thermo Fisher Scientific, Inc., Waltham, MA USA) fitted with an attenuated total reflectance (ATR) accessory. FTIR spectra for 400 scans with 8 cm−1 resolution were obtained in the wavenumber range of 500–4000 cm−1.
Thermogravimetric analysis (TGA) of biochar samples was carried out using a TGA Q50 V20.13 Build 39 analyzer (TA instrument, New Castle, DE, USA). The biochar was heated from ambient temperature to 1000 °C at a heating rate of 10 °C/min. The instrument was programmed to ramp at 10 °C/min from ambient temperature to 30 °C in nitrogen (N2) at a flow rate of 50 mL min−1, hold at 30 °C for 5 min, then rise from 30 to 1000 °C. The derivative of the thermogravimetry curves (DTG, wt. %/min) was calculated by differentiating the TGA (wt. %) data.

2.5. PH Point of Zero Charge (pHpzc)

The solution pH at which the net surface charge on the absorbent BC, KOH/BC, H2SO4/BC, and Na2CO3/BC is zero (pHpzc) was determined by adding 25 mL of 0.01 M NaCl solution to each sample (~50 mg) placed in a 50 mL polypropylene tube [19,20]. This was followed by agitating the mixture (rpm = 200) for 24 h at 25 °C. The resultant supernatant was filtered through Whatman no. 1 filter paper. The final pH of the filtrates was measured using a Hanna pH meter for the initial pH values of 0.7, 3.3, 5.1, 7.5, 9.0, 11.2, and 13.1. The solution pH was adjusted to the desired pH values using either 10 M NaOH or 10 M HCl solutions. Then, ∆pH (initial-final pH) values were plotted against the initial solution pH from which the pHpzc was obtained.

2.6. Sorption of Copper onto BC, KOH/BC, Na2CO3/BC, and H2SO4/BC

A 1000 mg L−1 Cu2+ stock solution was prepared by dissolving 3.96 g of (CuSO4.5H2O) 99% and diluting to 1 L with DI water. Working solutions of various concentrations were prepared from the stock solution after appropriate dilutions.

2.6.1. Effect of Initial pH on Copper Sorption onto KOH/BC, Na2CO3/BC, and H2SO4/BC

The study of the effect of initial solution pH values on copper adsorption was performed by adding 25 mL of 250 mg L−1 Cu2+ solution to 50 mg of each adsorbent placed into a 50 mL polypropylene tube. The initial solution pH values were adjusted to 1, 2, 3, 4, 5, and 6 using either 0.1 M NaOH or 0.1 M HNO3. Then, samples were agitated for 3 h at 25 °C. The supernatant was then filtered through Whatman no. 1 filter paper. The concentration of copper remaining in the filtrates was obtained using an Atomic Absorption Spectrometer SHIMADZU AA7000 (Kyoto, Japan) at a wavelength of 222.6 nm. The percentage of copper adsorbed was calculated from
%   Cu 2 +   absorbed = C o C f C o × 100 %
where Co and Cf are the initial and final solution Cu2+ concentrations.
The pH and electrical conductivity of the filtrates were determined using a Hanna pH meter and electrical conductivity meters.

2.6.2. Adsorption Kinetic

The kinetics study was carried out at room temperature. To 50 mg of each biochar sample placed in a 50 mL polypropylene tube, 25 mL of 2 mg L−1 Cu2+ solution was added. Then, these mixtures were shaken for a predetermined time interval (5–360 min) at 200 rpm. The mixtures were then filtered through Whatman no. 1 filter paper, and the filtrates Cu2+ concentrations were analyzed using ICP-MS (model ELAN DRC II).

2.6.3. Adsorption Isotherm

The adsorption isotherm was obtained using a copper concentration range of 2–250 mg L−1 at pH 5. To 50 mg of adsorbent placed in a 50 mL polypropylene tube, 25 mL of each solution was added, followed by 3 h agitation at 200 rpm at 25 °C. The suspensions were then filtered through Whatman no.1 filter paper and the filtrate copper concentrations were determined as described in Section 2.6.1. The copper amount adsorbed (qe; mg g−1) was obtained from the expression below [21,22].
q e = C i C e × V w
where Ci and Ce are the initial and equilibrium concentrations of copper in the solution. V is solution volume (L) and w is the mass of adsorbent (g).
Langmuir adsorption capacities were calculated from the equation below [23].
q e = q max K L C e 1 + K L C e
where qmax, KL, and Ce are the maximum adsorption capacity, Langmuir constant, and equilibrium concentration, respectively.

2.6.4. Real Lake Water Sample Study

Three water sources—Bluff Lake (33.283072, −88.776972), Briar Lake (33.432870, −88.767551), and Loakfoma Lake (33.263047, −88.778497)—were used to test the effectiveness of Cu2+ adsorption from real contaminated lake water onto BC, KOH/BC, Na2CO3/BC, and H2SO4/BC. Each water sample was spiked to make 2 mg L−1 Cu2+, and 25 mL of each spiked water sample was added to 50 mg of BC, KOH/BC, Na2CO3/BC, and H2SO4/BC placed in a 50 mL polypropylene tube. The mixtures were shaken at 300 rpm for 3 h at room temperature, then filtered through Whatman no. 1 filter paper. The filtrates were analyzed for Cu2+ concentrations, as in Section 2.6.1.

3. Results and Discussion

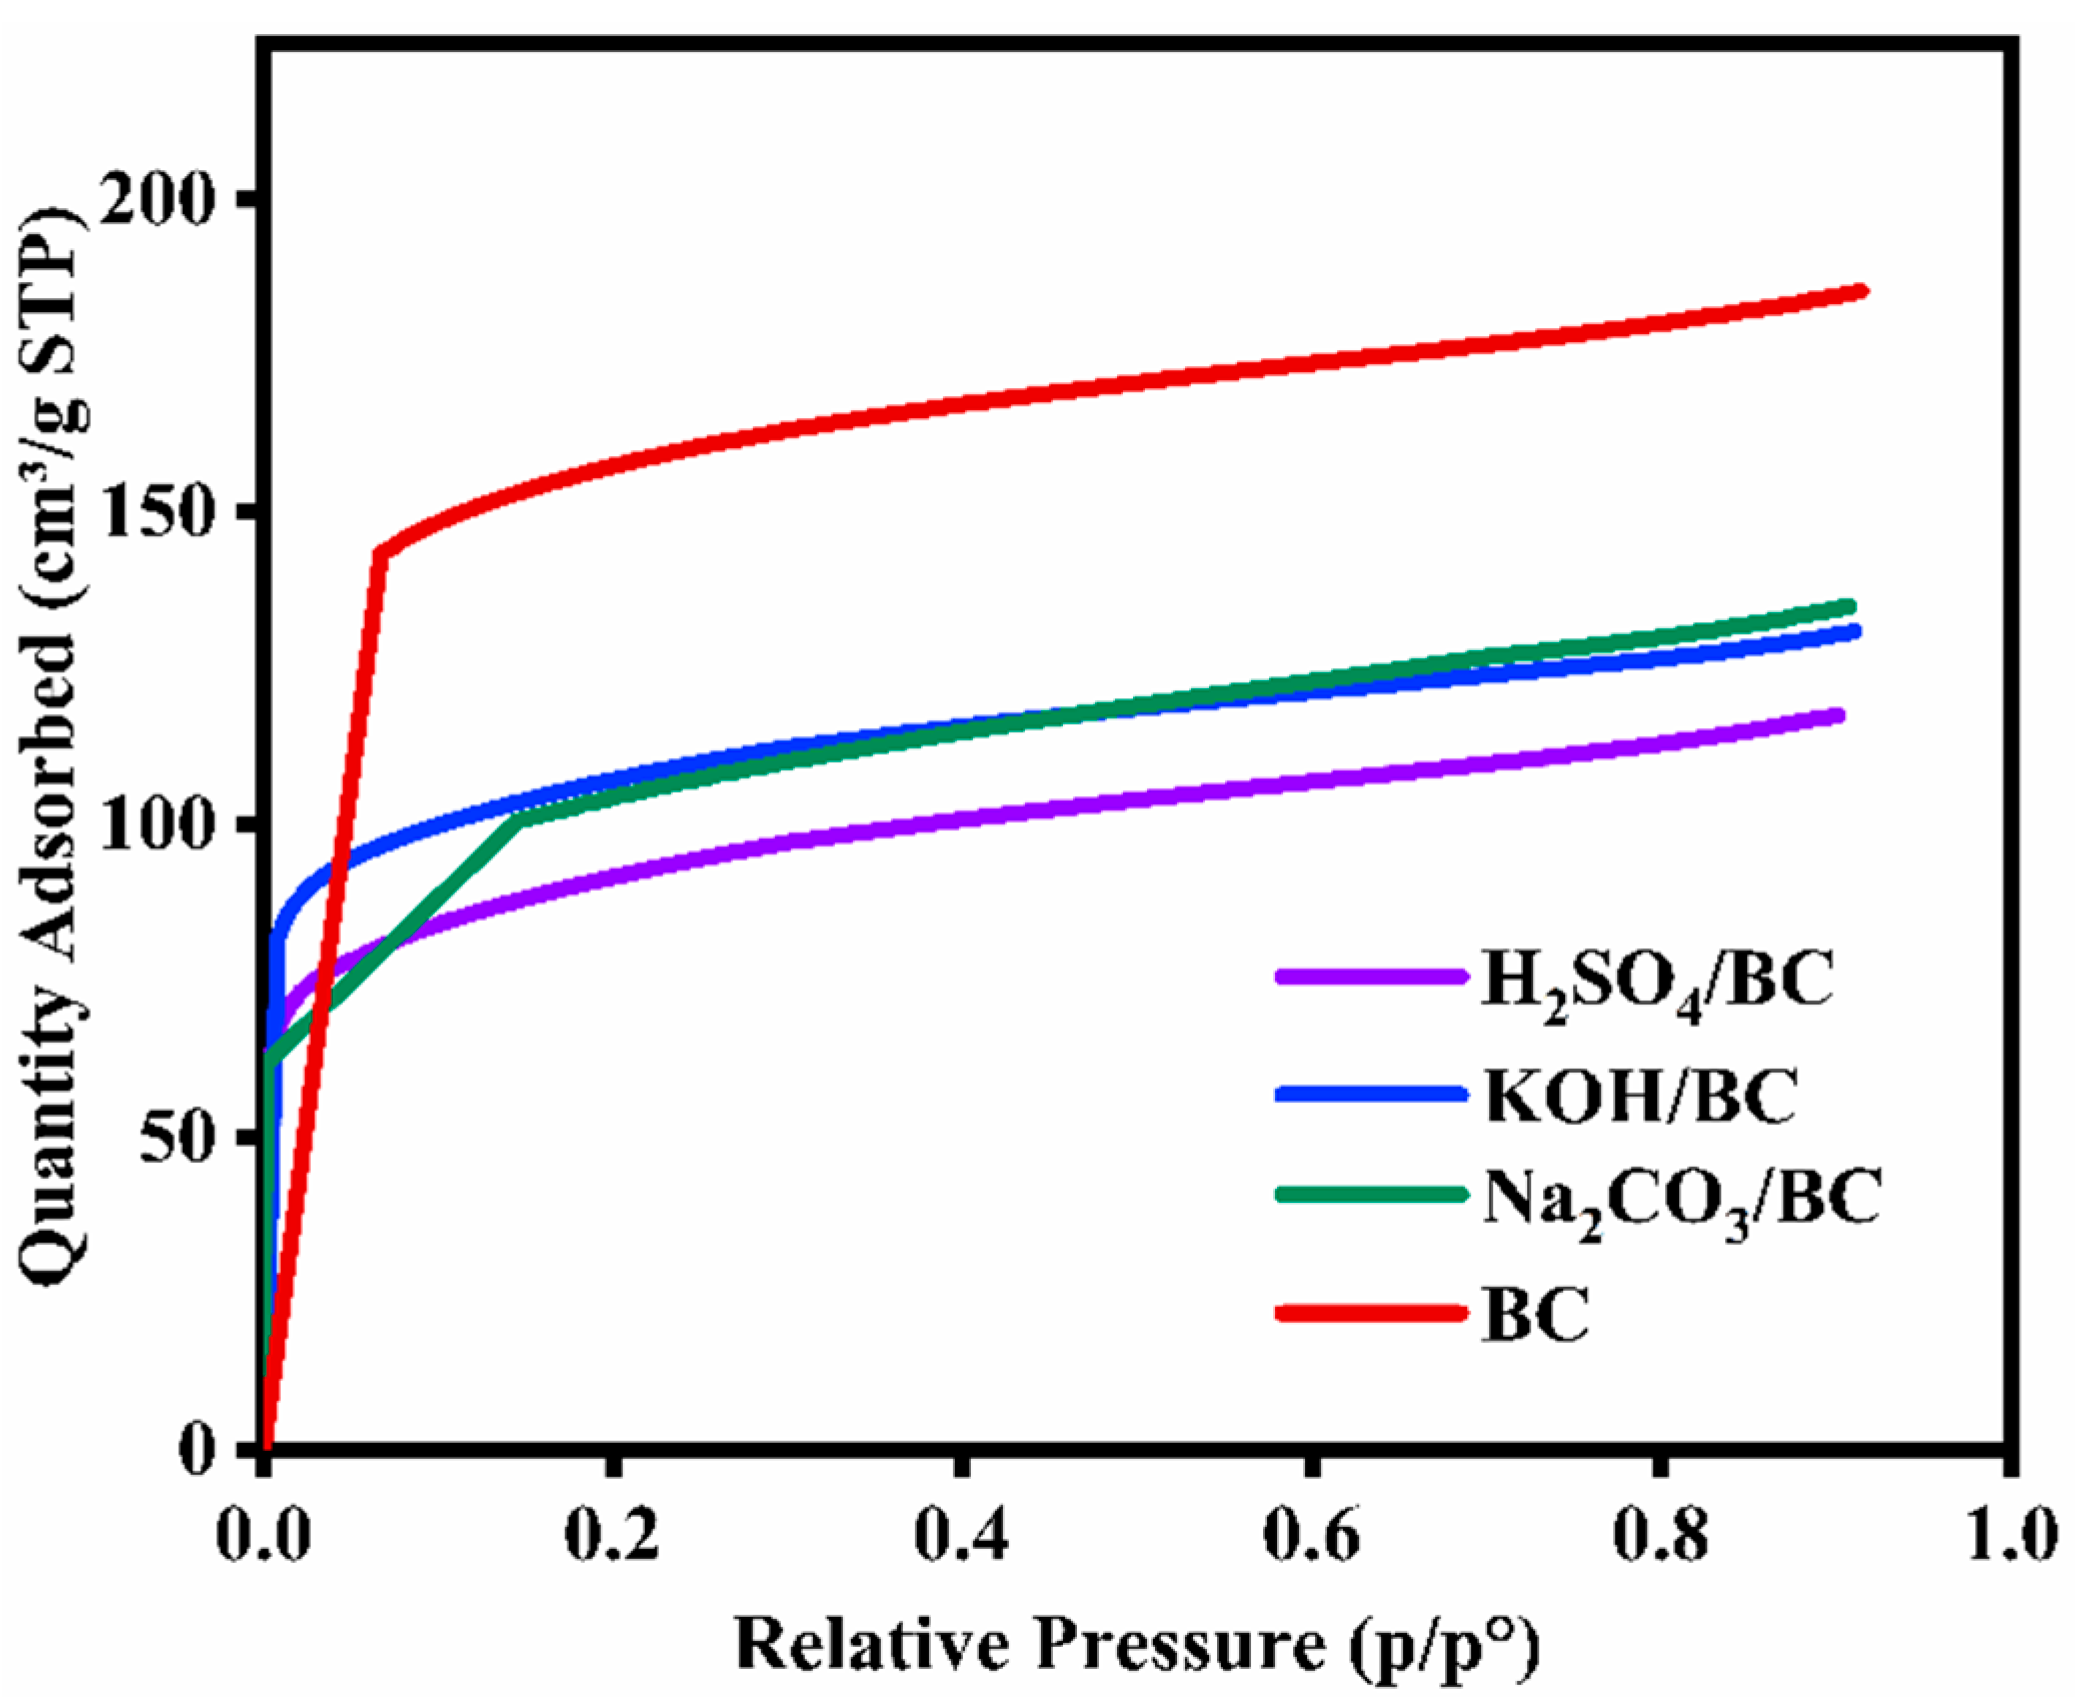
3.1. Surface Area, Pore Volume, and Pore Size Diameter

Regardless of the treatment reagent, the surface area decreased upon modifying BC with 20% KOH (KOH/BC), 20% H2SO4 (H2SO4/BC), and 20% (Na2CO3/BC) solutions (Table 1).
In contrast, both the pore size volume and pore diameter increased after modifying BC to KOH/BC, H2SO4/BC, and Na2CO3/BC. The largest reduction in surface area (578.9 to 326.7 m2/g) was attained after modifying BC with 20% H2SO4 solution. The reduction in surface area following treatment with 20% KOH and 20% Na2CO3 solutions was from 578.9 to 389.3 and 367.9 m2 g−1, respectively. The BET nitrogen adsorption curves (Figure 1) indicated BC exhibited a type I isotherm before and after modifying to KOH/BC, Na2CO3/BC, and H2SO4/BC. Type I isotherm is often associated with the formation of micropores.
The nitrogen adsorption capacities of BC, KOH/BC, Na2CO3/BC, and H2SO4/BC rose rapidly at relative pressure between 0 and 0.2 p/p°. The rise in adsorption capacities at low relative pressure is attributed to monolayer adsorption. The small slopes exhibited between relative pressures of 0.2 and 0.9 could be due to multilayer adsorption. These results agree with those reported after modifying rice straw biochar with H2SO4 and HNO3. The surface area reduction is caused by micropore destruction by modifying agents creating additional meso- and macropore fractions.

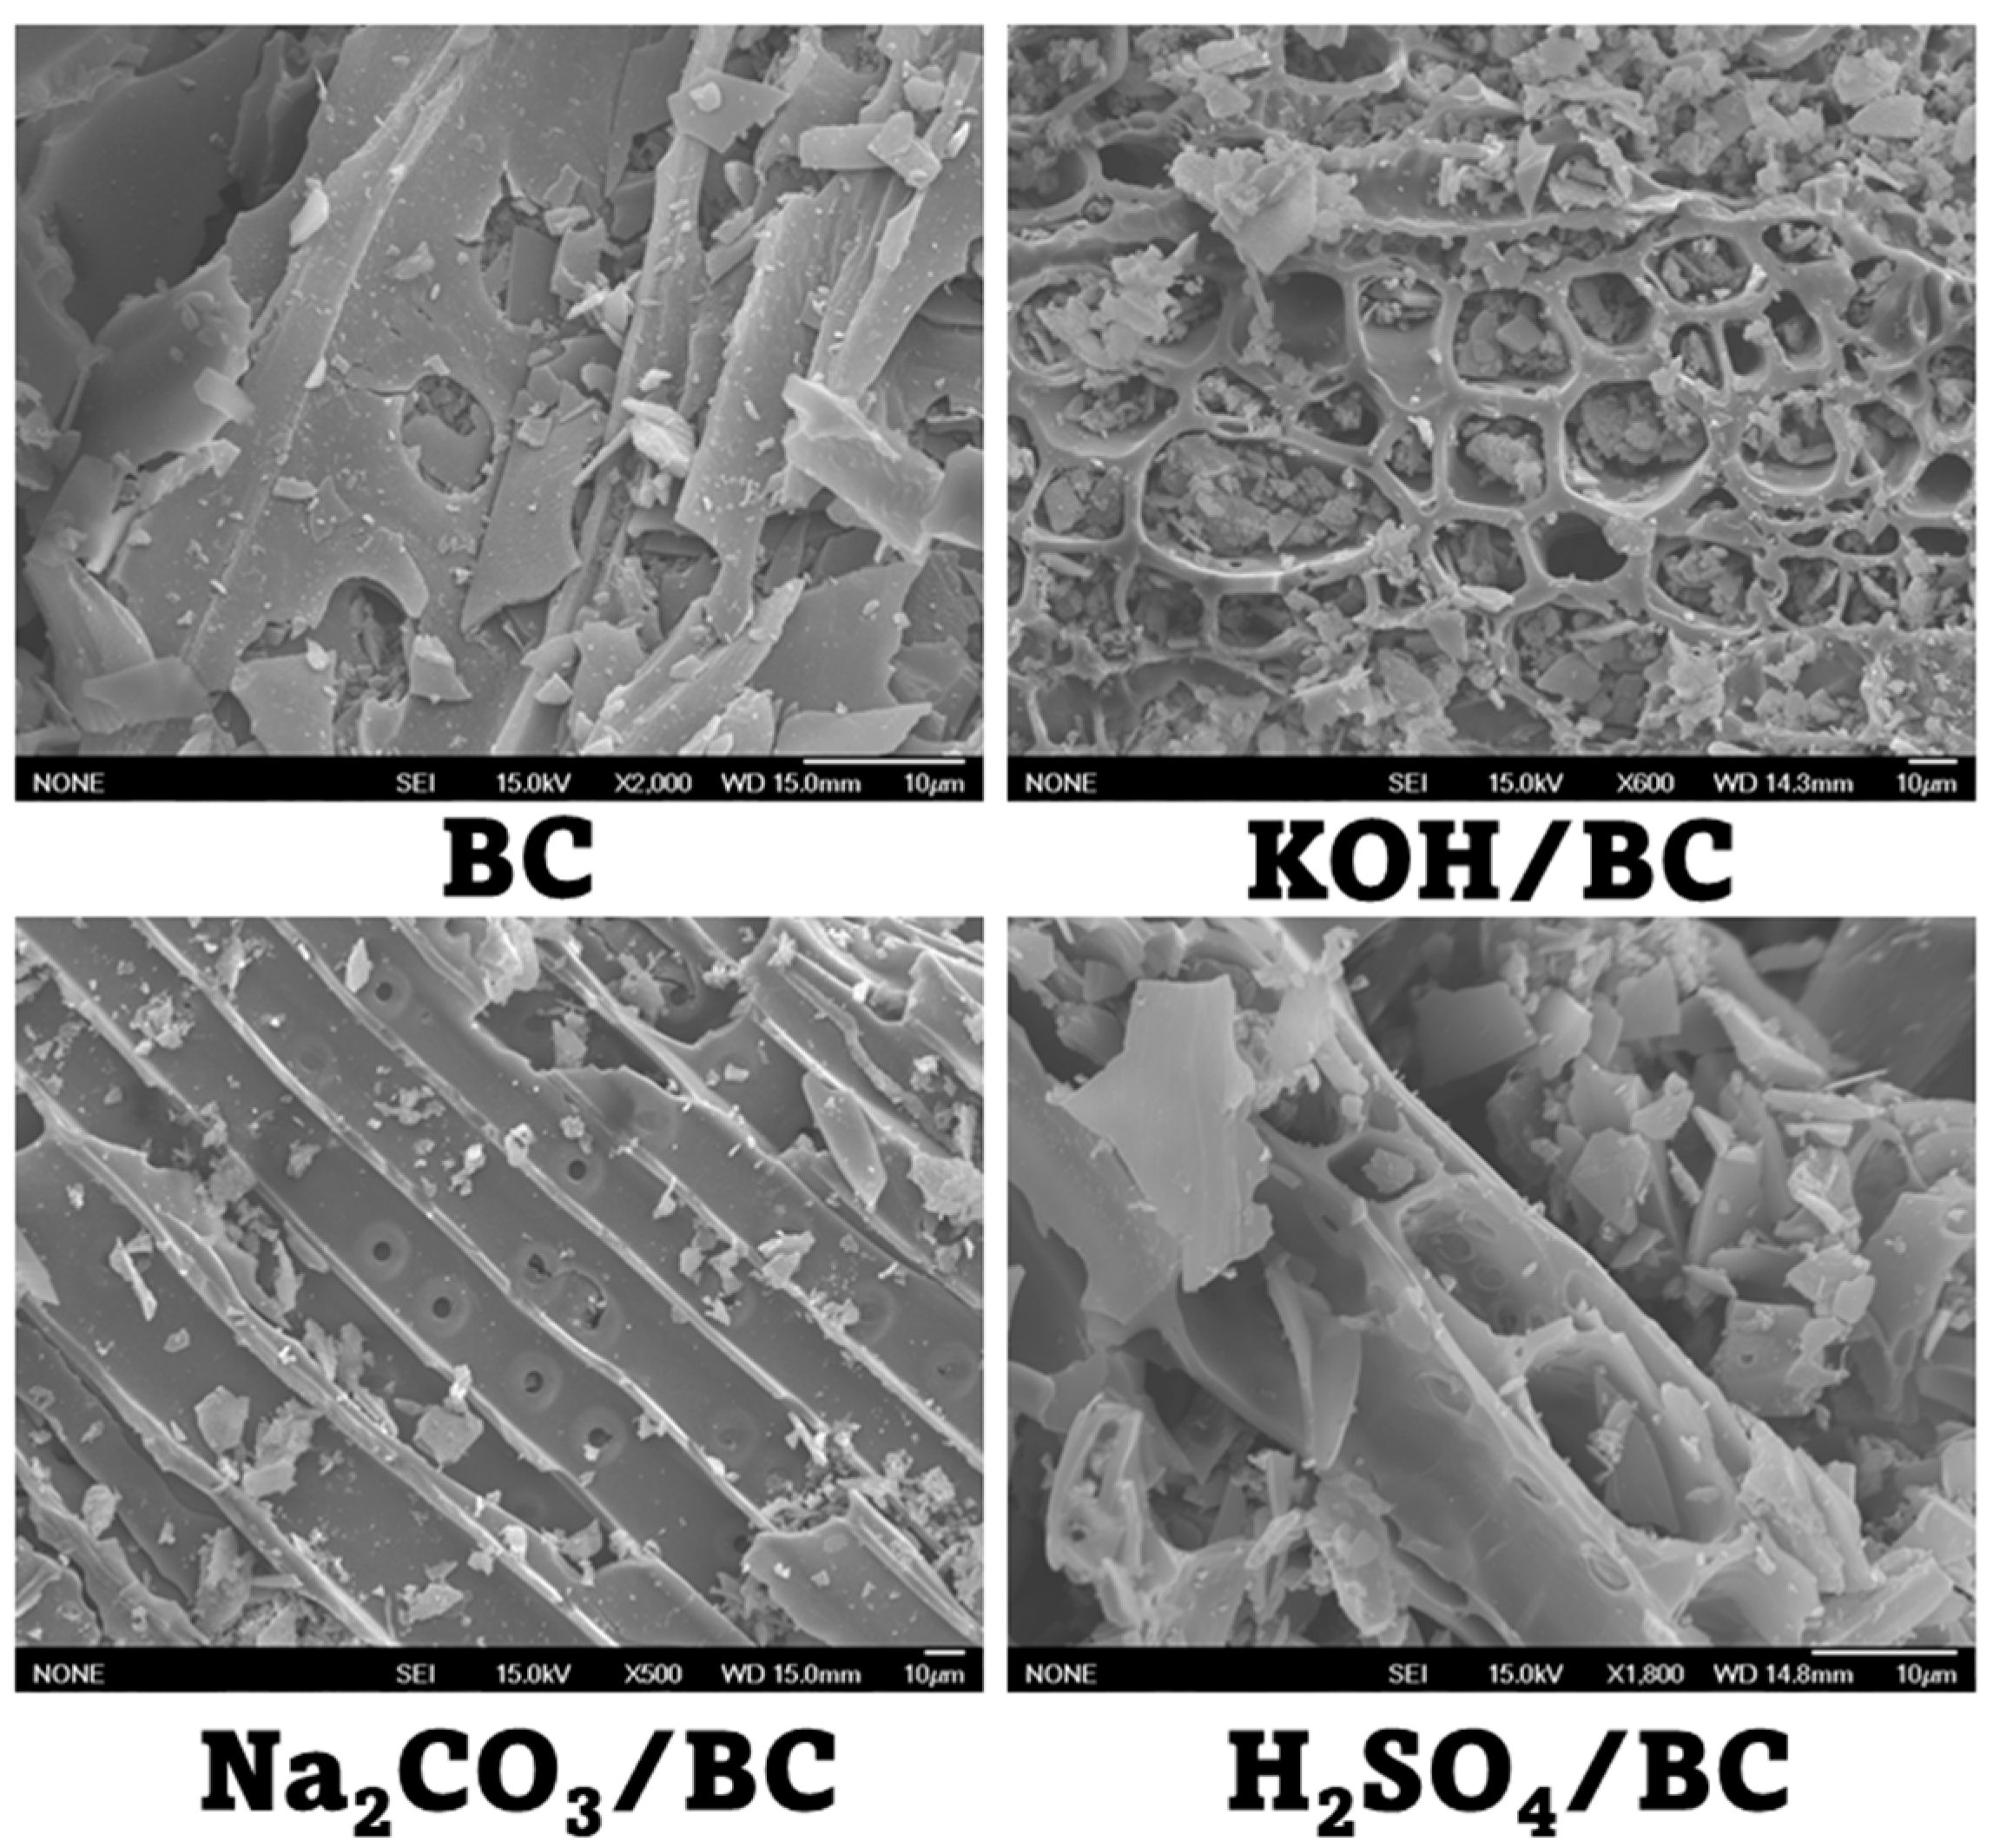
3.2. Surface Morphology and Elemental Compositions
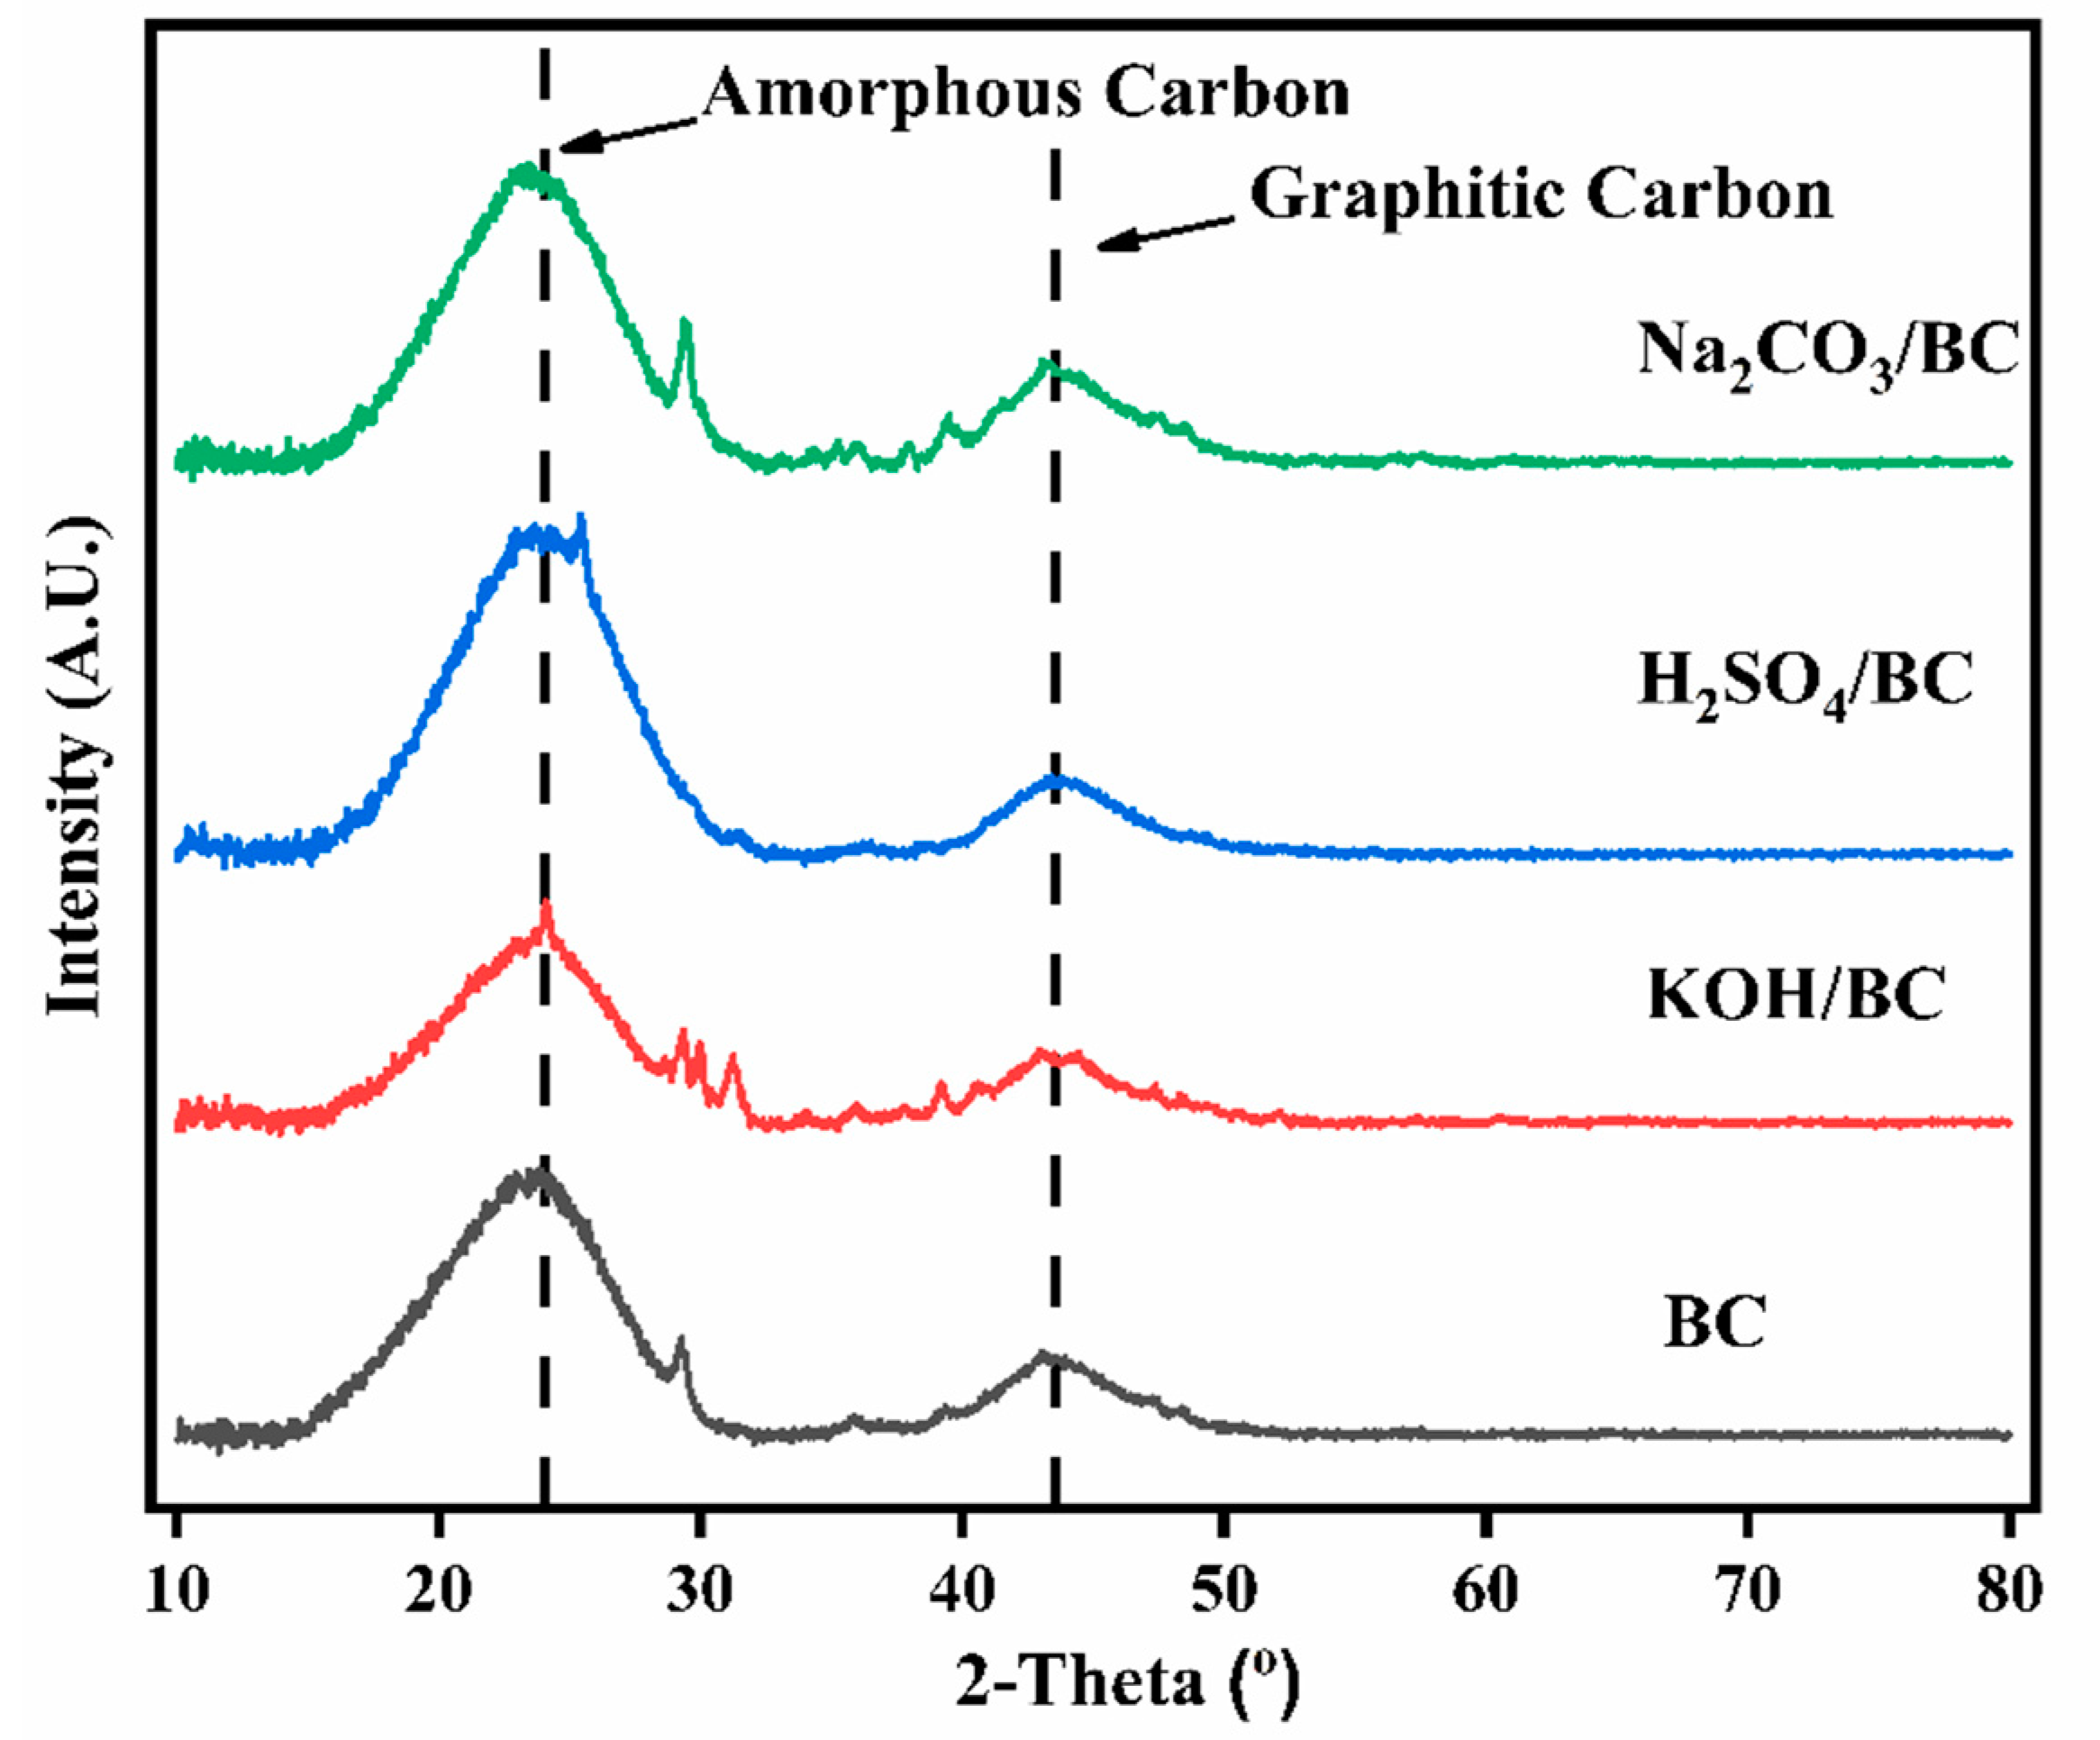
The scanning electron microscopy (SEM) micrographs of BC, KOH/BC, H2SO4/BC, and Na2CO3/BC are shown in Figure 2. BC surface morphology changed after being modified to KOH/BC, H2SO4/BC, and Na2CO3/BC. After modification, the biochar pore structure appeared more developed and fragmented. Before treatment, BC had a smooth surface whose pores were hardly observed. After KOH and Na2CO3 treatment, the carbon material surface developed large pores. However, the H2SO4-treated biochar resulted in the collapse of the pore structure, lowering the surface area. The collapse of the pore structure is most likely due to corrosion by the acid. This observation is consistent with the BET surface area analysis results (Table 1 and Figure 1), indicating a lowering of the surface area. The collapse of the pore structure is most likely due to corrosion by the acid. This observation is consistent with the BET surface area analysis results (Table 1 and Figure 1).
The X-ray energy dispersion spectroscopy (EDS) results are shown in Figure 3. Pt was used as the coating material for the biochar during the analysis. As expected, the presence of elements was largely dependent on the treatment material.
The chemical components of biochar were greatly altered upon modifying BC to KOH/BC, Na2CO3/BC, and H2SO4/BC. The %C decreased from ~92.3% in BC to ~81.6%, ~87.6%, and ~76.4% in KOH/BC, Na2CO3/BC, and H2SO4/BC, respectively. In contrast, the %O rose from ~4.8% in BC to ~11.0%, ~6.8%, and ~16.1% in KOH/BC, Na2CO3/BC, and H2SO4/BC, respectively (Table 2).

3.3. XRD Analysis

The X-ray diffraction patterns of BC, KOH/BC, H2SO4/BC, and Na2CO3/BC are shown in Figure 4.
Generally, two broad peaks appeared at 2 θ = ~ 23.0° and ~ 43.4°, like those of amorphous and graphitic carbon, respectively [24]. These peaks correspond to the (002) and (100) carbon material crystal planes. The crystallinity of BC was ~21.6%. The crystallinity of Na2CO3 and KOH-modified BC increased to ~24.7% and ~27.5%, respectively, after the modifications. However, the crystallinity of H2SO4-modified BC was reduced to ~19.6% due to the collapse of pore structures inside the biochar matrix. The macroscopic carbon structure amorphousness can be attributed to low graphitization at the activation conditions [25].

3.4. FTIR Analysis

Figure S1 shows the FTIR spectra of BC, KOH/BC, Na2CO3/BC, and H2SO4/BC. The broad bands at wavenumbers 3500–4000 cm−1 and 2818–2981 cm−1 are attributed to the –OH stretching vibration of water and –CH2 asymmetric stretching vibrations, respectively [26]. The peak between 975 and 750 cm−1 is ascribed to out-of-plane aromatic C–H bending vibration [27]. The bands between 1040 and 1090 cm−1 are due to the C–O stretching from the formation of singly bonded C–O moieties in lactones and phenols [28]. The peaks from 1861 to 1675 cm−1 and 1405 to 1300 cm−1 are attributed to aromatic C=C stretching and C-H deformation, respectively, in lignin [29]. After modifying BC to KOH/BC, Na2CO3/BC, and H2SO4/BC, both -OH and -CH2 aliphatic bands decreased. These declines in -OH and -CH2 bands might have resulted from the dehydration and deterioration in polar functional groups, respectively.

3.5. Thermogravimetric Analysis

Figure S2 shows the TGA curves for BC, KOH/BC, Na2CO3/BC, and H2SO4/BC. The biochars had varied degrees of thermal stability. In all cases, the first weight loss occurred between 50 and 100 °C, with weight losses of approximately 4.1, 3.0, 1.4, and 3.1% for BC, KOH/BC, Na2CO3/BC, and H2SO4/BC, respectively. These weight losses are attributed to the desorption of physically bound moisture. A gradual weight loss of ~34.4% occurred in KOH/BC between 250 and 1000 °C. The weight losses of BC, Na2CO3/BC, and H2SO4/BC are ~5.4, ~6.3, and ~4.6%, respectively, occurring between 250 and 600 °C, due to the pyrolysis of cellulose, hemicellulose, and portion of lignin. The final weight loss occurred between 650 and 1000 °C for BC (~10.2%), Na2CO3/BC (~2.0%), and H2SO4/BC (~12.6%). This weight loss at elevated temperatures is attributed to biomass thermo-oxidative degradation, such as lignin and inorganic material decomposition.

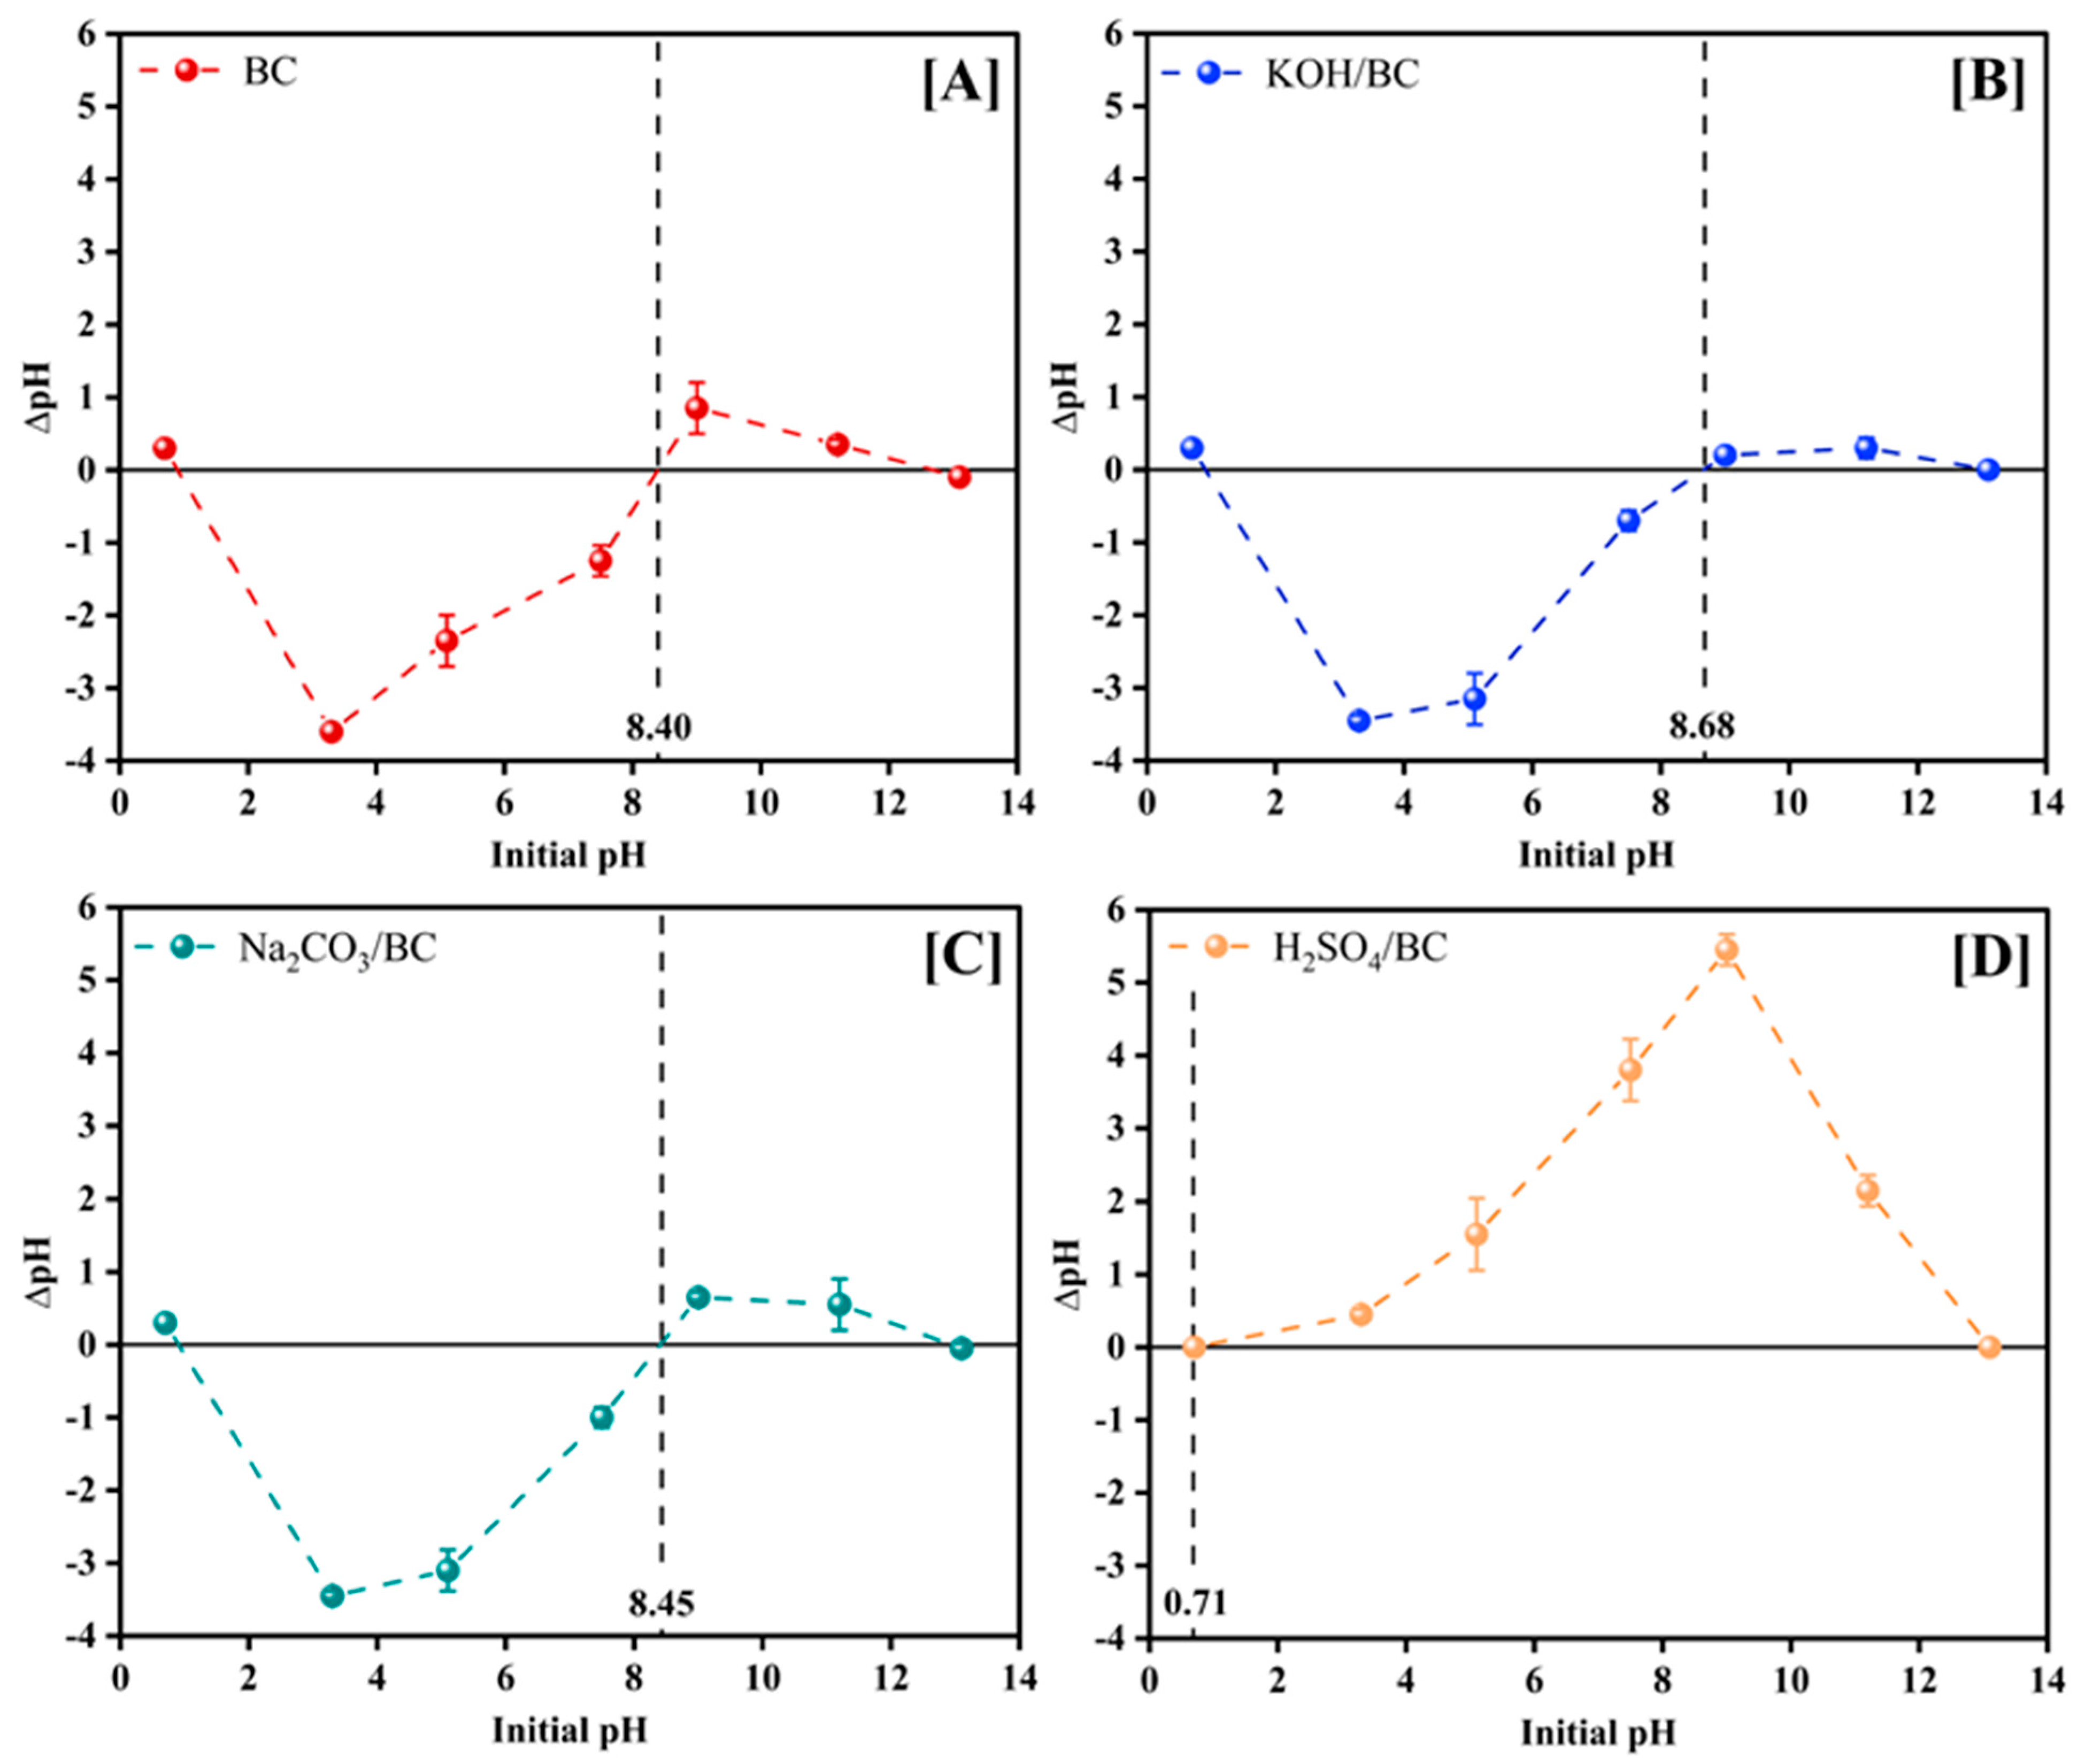
3.6. The point of Zero Charge (pHpzc)

The pHpzc values for BC before and after modification to KOH/BC, Na2CO3/BC, and H2SO4/BC are shown in Figure 5.
The pHpzc defines the pH value at which the adsorbent net surface charge equals zero. When pH > pHpzc, the adsorbent surface is negatively charged, and adsorption of cationic species is favored. At solution pH < pHpzc, the adsorbent surface is positively charged, which makes the adsorption of anions such as PO43− on it favorable. The pristine biochar (BC) had a pHpzc of 8.40, which increased to 8.68 and 8.45 with modification to KOH/BC and Na2CO3/BC, respectively. However, the pHpzc decreased to 0.71 upon H2SO4 modification. During pyrolysis with KOH, the lactonic, carboxylic, and phenolic groups present are converted to negatively charged carboxylate and phenolate species, capable of releasing hydroxyl ions when in contact with water. However, in the presence of Na2CO3, only carboxylic and phenolic groups transform into their deprotonated species, resulting in lower basicity during the hydrolysis of water. But in the presence of H2SO4, most functional groups become protonated and release H+ into the medium upon contact with water.

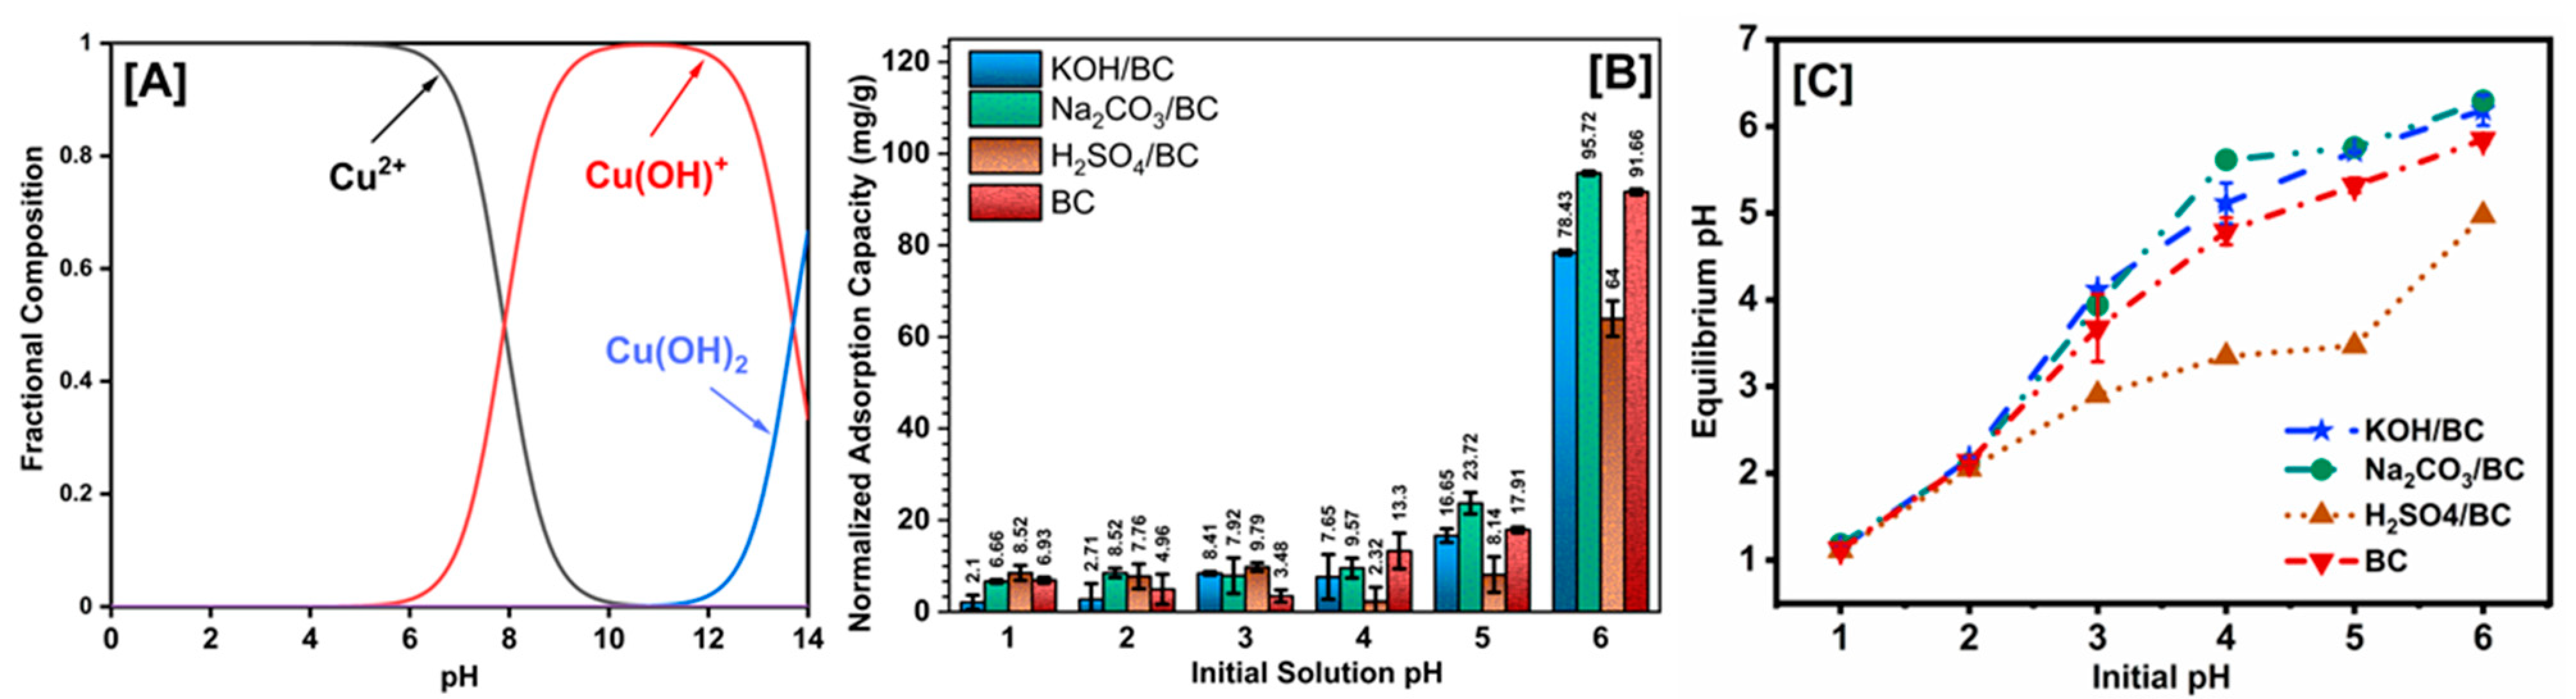
3.7. Effects of Initial Solution pH

A pH dependence study was carried out between pH 1 and 6 because Cu2+ begins to precipitate at Cu(OH)2 above pH 6 (Figure 6A). Figure 6 shows the adsorption capacities of Cu2+ on BC, KOH/BC, Na2CO3/BC, and H2SO4/BC as a function of the initial solution pH.
The highest sorption capacities of 95.72 ± 0.47, 91.66 ± 0.62, 78.43 ± 0.54, and 64.00 ± 3.88 mg/g corresponded to Na2CO3/BC, BC, KOH/BC, and H2SO4/BC, respectively, at pH 6. This is due to increased precipitation of Cu(OH)2 at pH 6. Moreover, at the higher pH, deprotonation of carboxylic groups to carboxylate groups occurs, which can also increase the capacity of Cu2+. As expected, the results indicate low adsorption at low solution pH because Cu2+ competes with H+ for binding sites on the adsorbent surface. Moreover, at low pH values, pH < pHPZC, and the overall adsorbent surface becomes positively charged, which can repel the positively charged Cu2+ ions, thereby reducing adsorption. The results indicate low adsorption at lower solution pH values.
The plot of equilibrium pH measured after adsorption vs. the solution’s initial pH is shown in Figure 6C. For highly acidic solutions (pH < 3), little or no difference in pH was observed after adsorption. At these pH values, Cu2+ adsorption onto the adsorbents was low (Figure 6C). Since pH did not increase, it is unlikely that hydrogen ion was released from the adsorbents; thus, the mechanism for adsorption at this pH does not act as a strong cation exchanger. The low absorption could have resulted from physisorption or chemisorption.
For initial solution pH values (pH > 3), the equilibrium solution pH values were less acidic for BC, KOH/BC, and Na2CO3/BC (Figure 6C). In contrast, the equilibrium solutions’ pH tended to become more acidic after modification with H2SO4/BC due to the release of H+. For BC, KOH/BC, and Na2CO3/BC, the increase in solution pH is likely attributed to the release of OH, which increases Cu2+ uptake. For H2SO4/BC, the H+ released when Cu2+ binds to it remains in the solution, resulting in a pH decrease. This observation also suggests that cation exchange is likely to be the adsorption mechanism at these pH ranges. For H2SO4/BC, the H+ ion released when Cu2+ binds to it remains in the solution, resulting in a pH decrease.

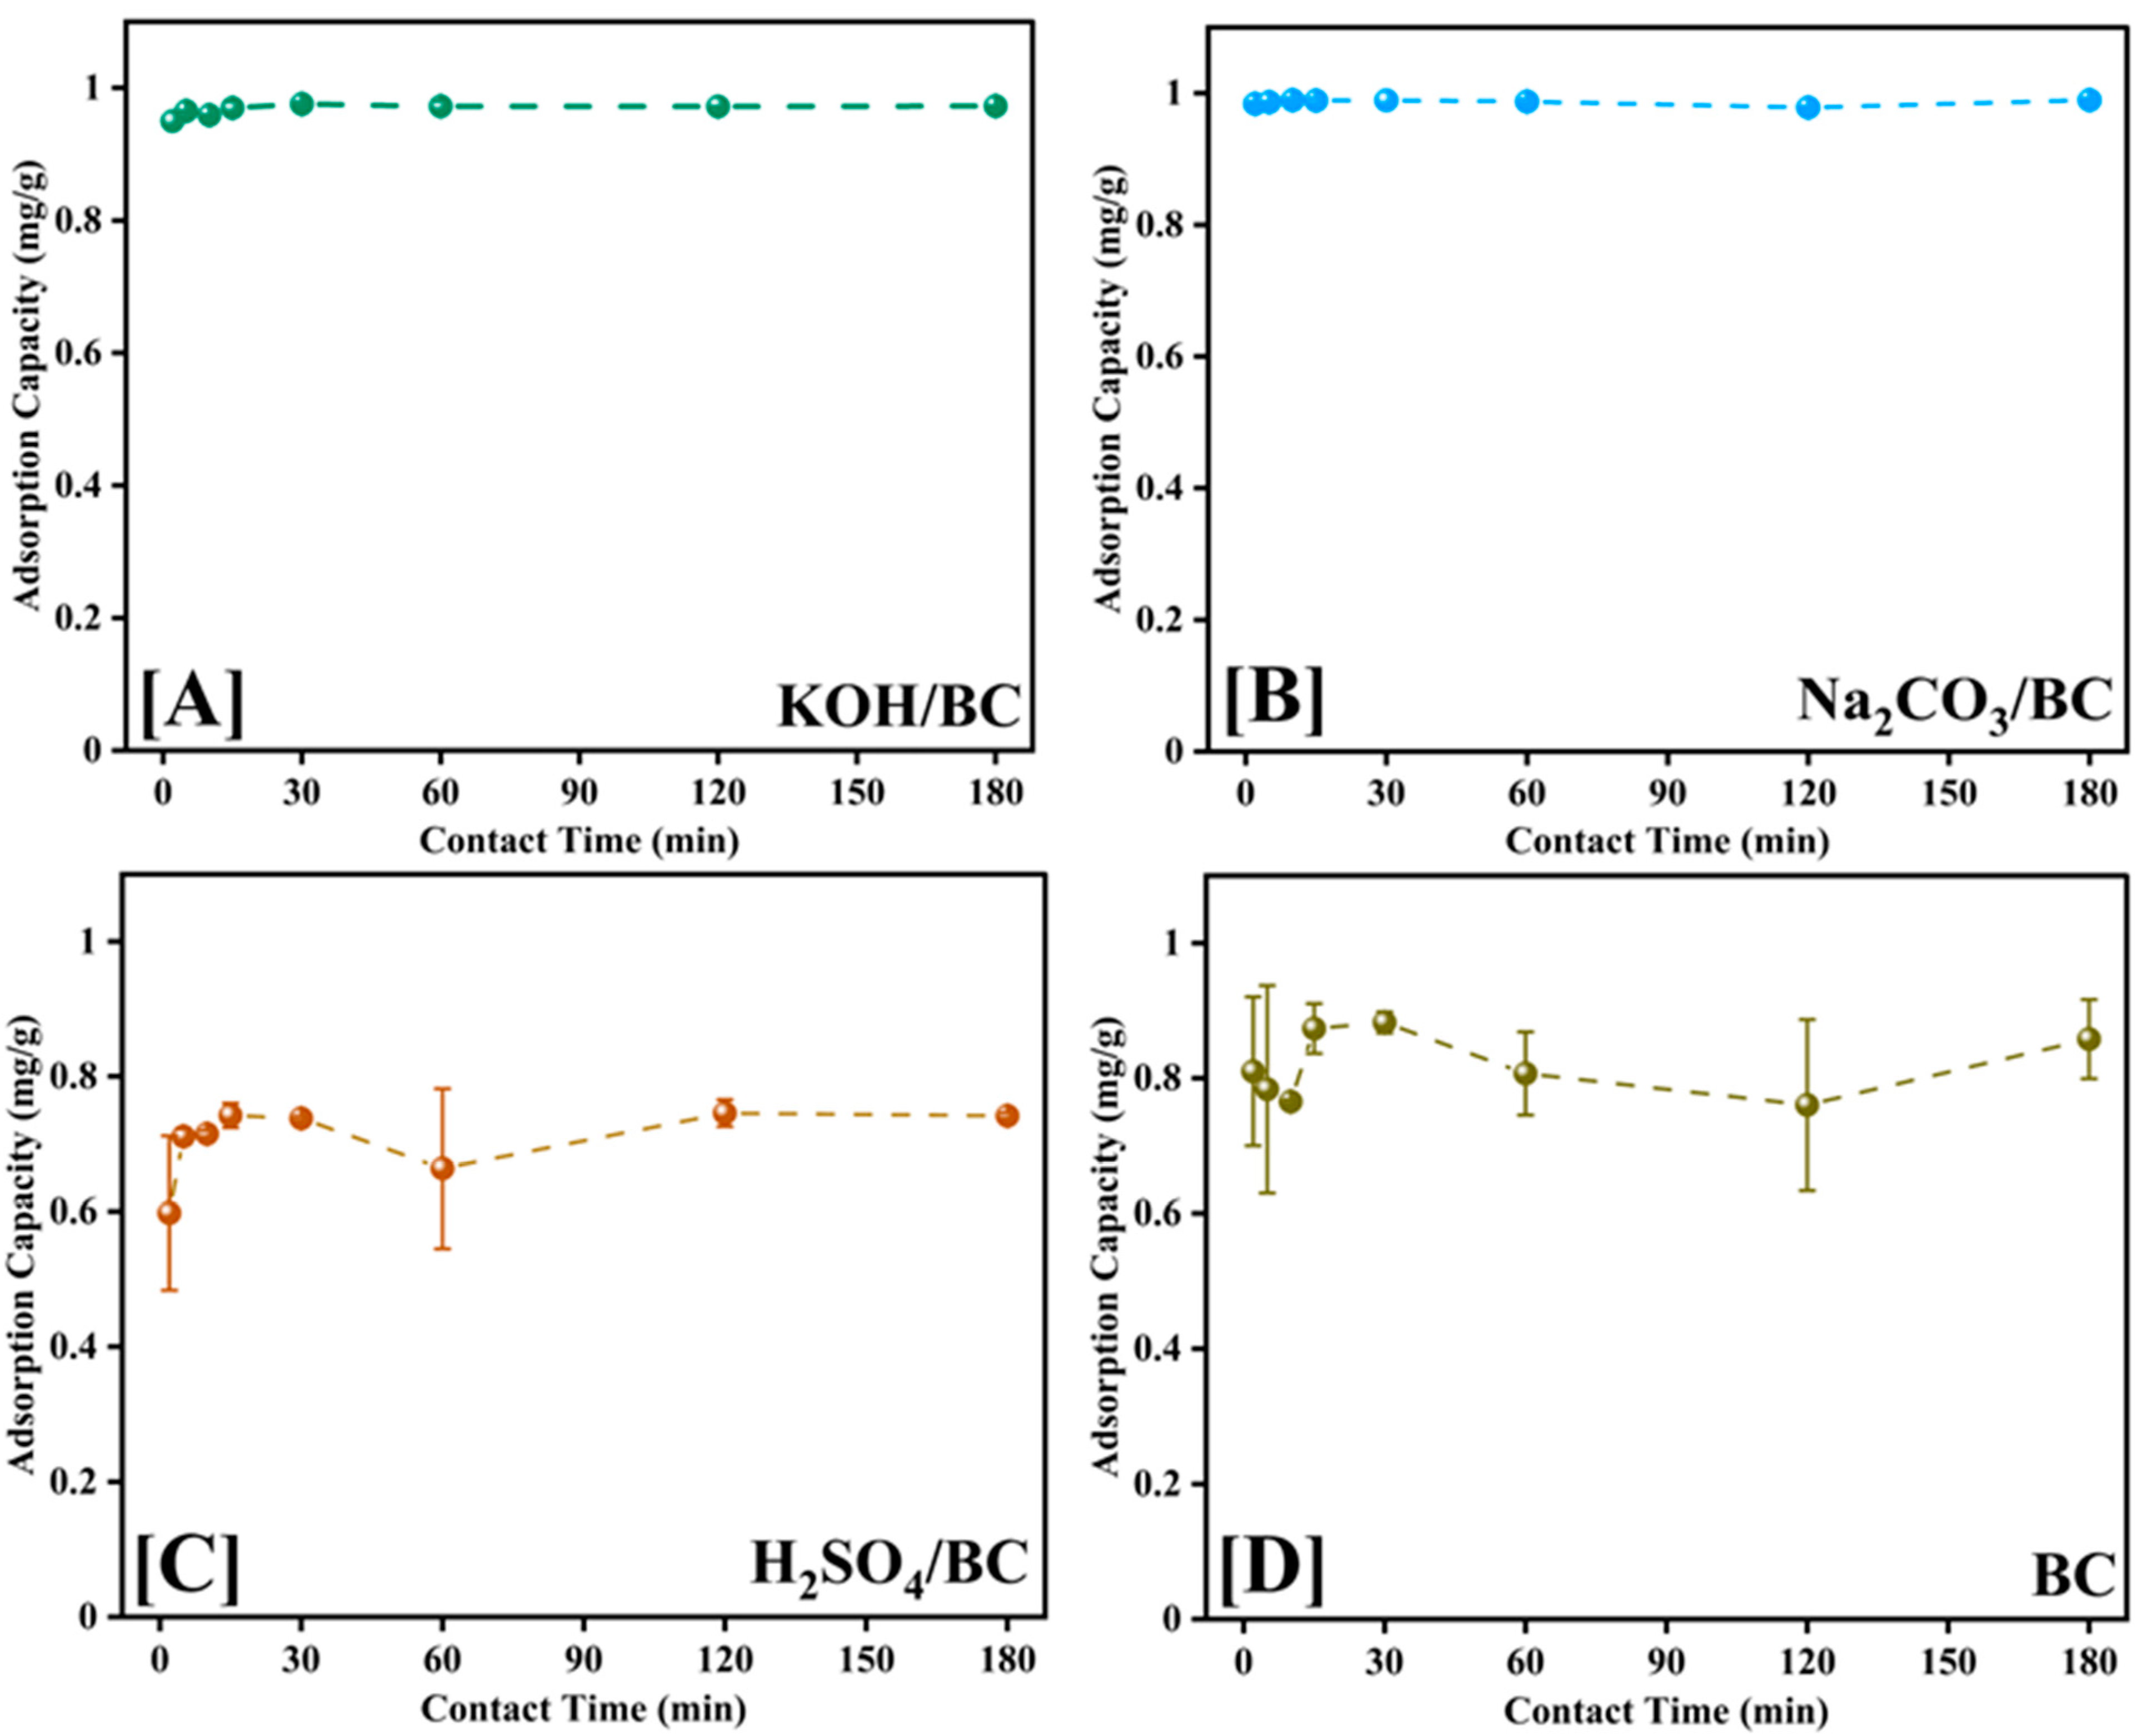
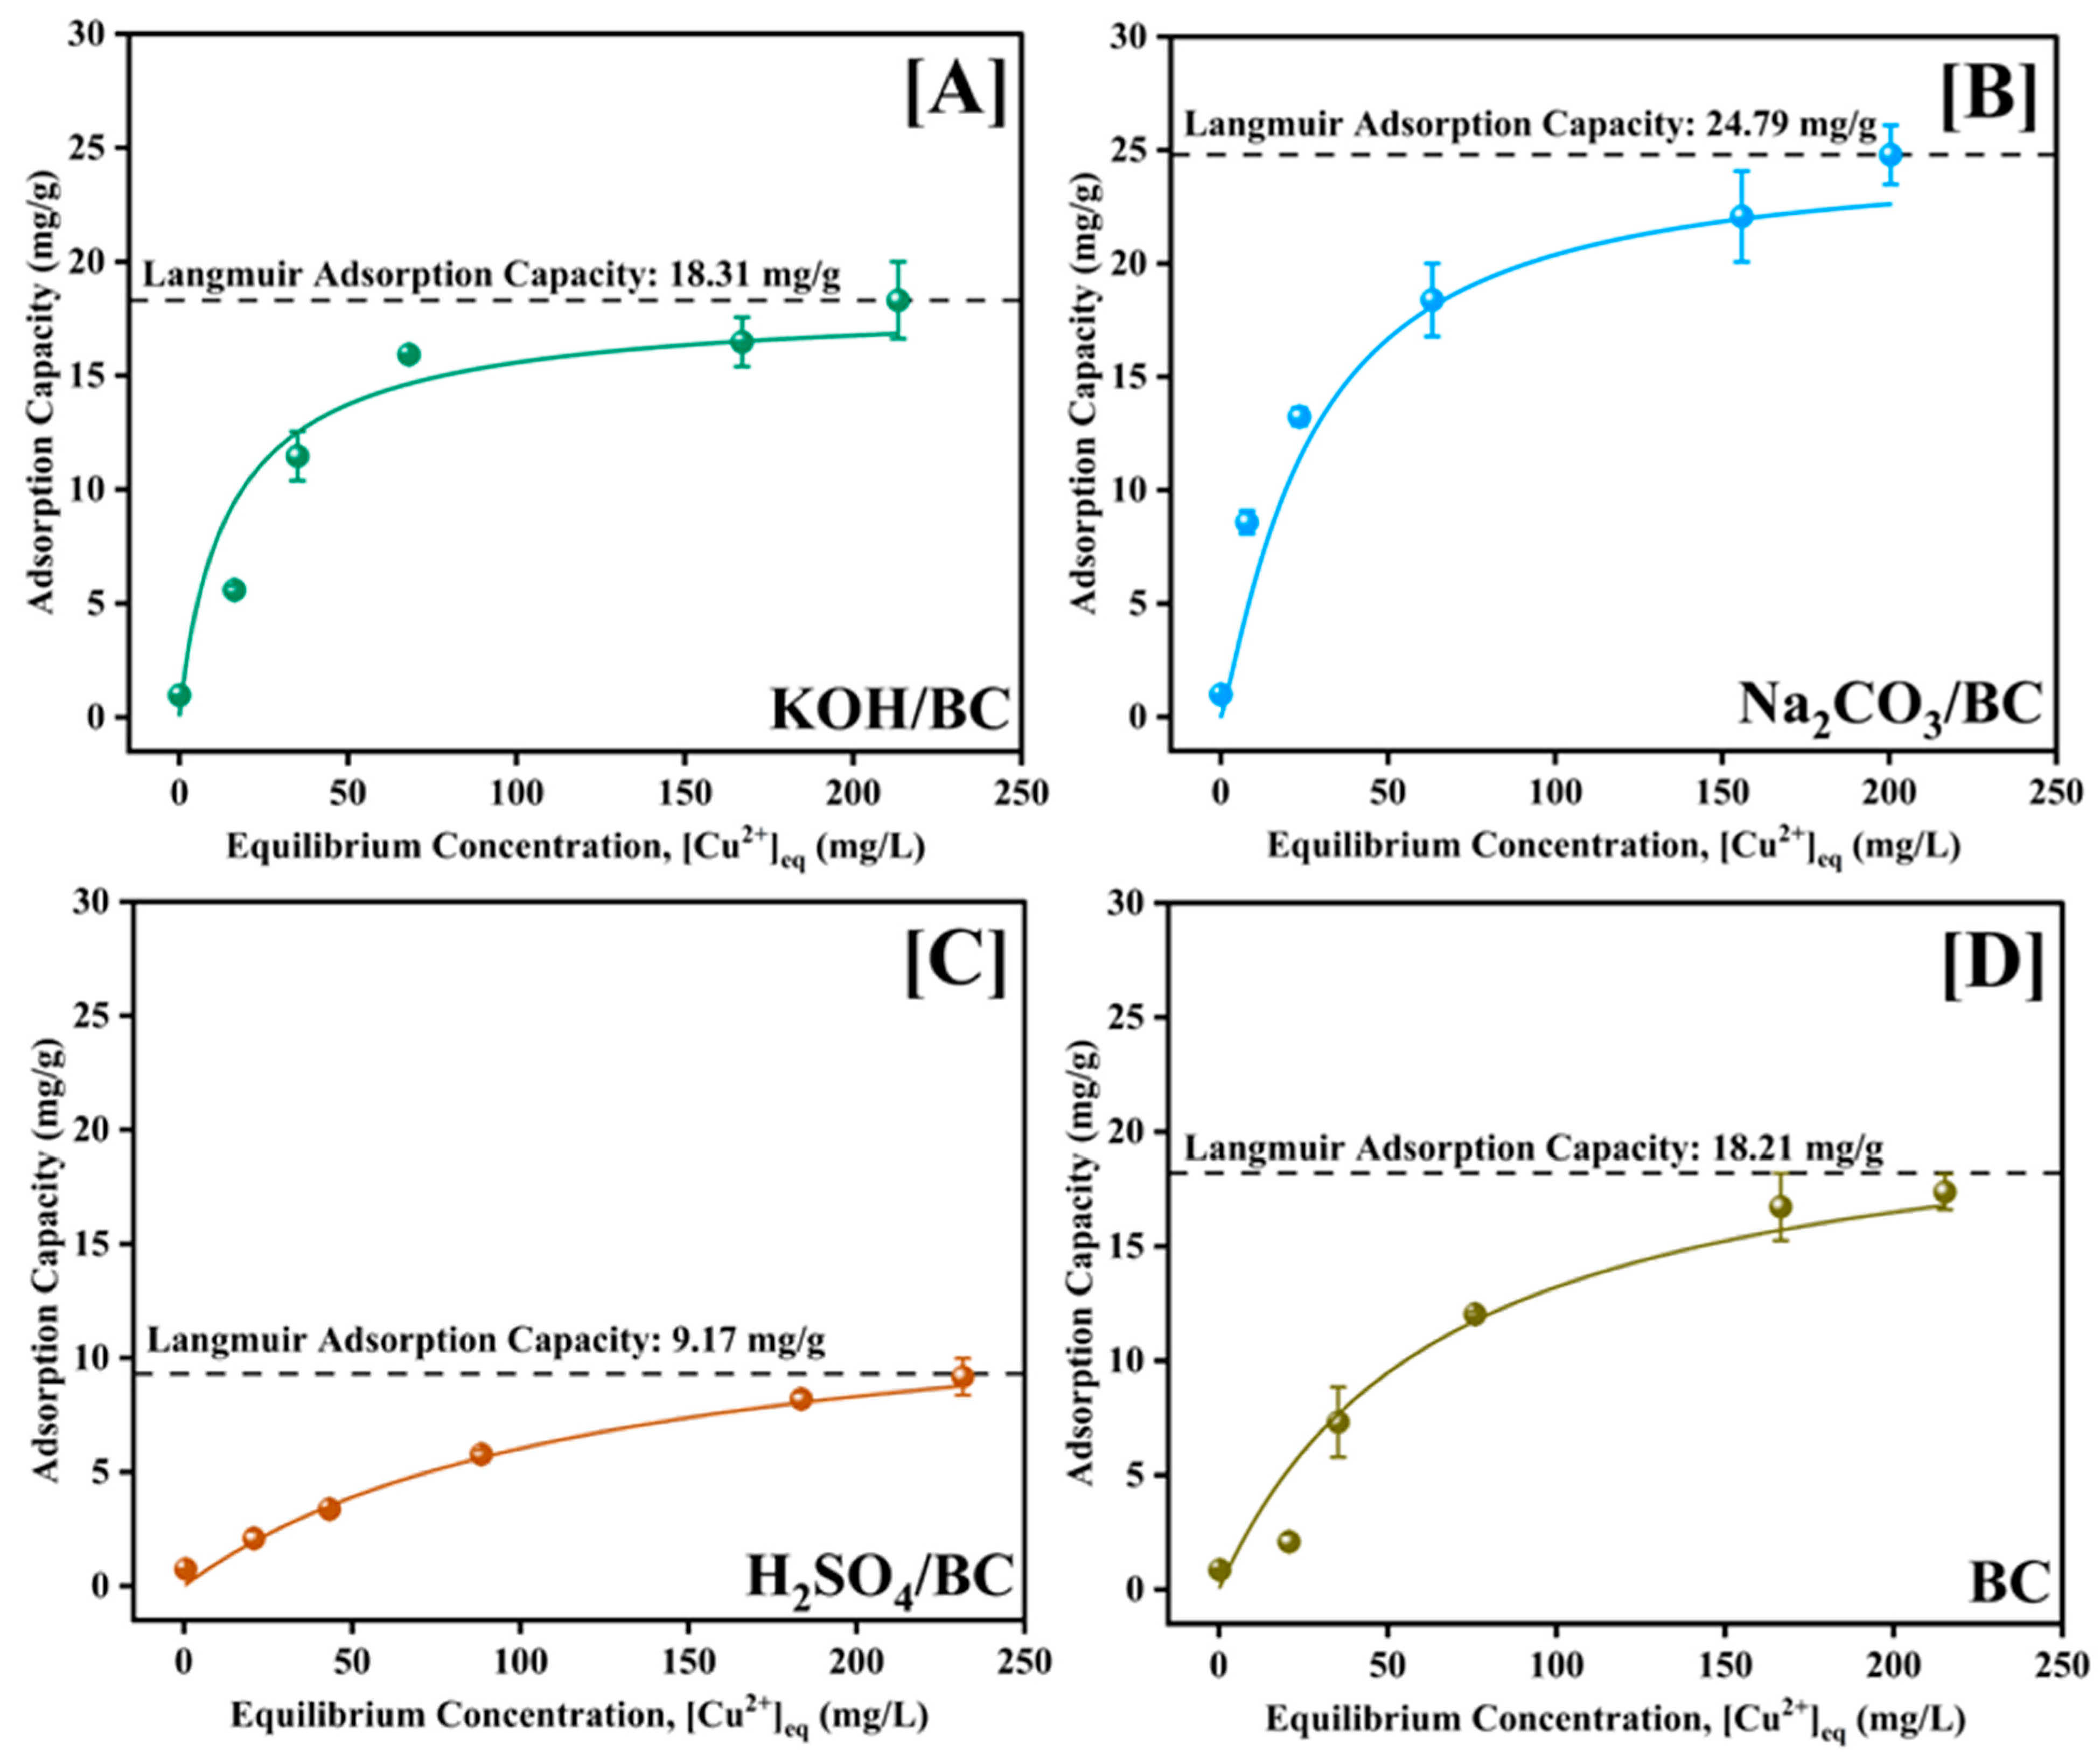
3.8. Effect of Contact Time and Isotherm Study on Cu2+ Sorption onto BC, KOH/BC, Na2CO3/BC, and H2SO4/BC

Results for the effect of equilibrium time on Cu2+ sorption onto BC, KOH/BC, Na2CO3/BC, and H2SO4/BC are shown in Figure 7. Cu2+ adsorption onto the biochars was relatively fast (≤30 min).
The fast ion uptake by the biochars might be ascribed to their large surface area for Cu2+ sorption onto the binding sites. Regardless of the adsorbent, Cu2+ removal rose with increased contact time. Further contact time increases, however, did not improve Cu2+ uptake, due to the saturation of the available adsorbent material’s adsorption sites.
Cu2+ sorption capacities onto BC, KOH/BC, Na2CO3/BC, and H2SO4/BC studied at pH 5 and 25 °C are presented in Figure 8A–D. Cu2+ removal capacities increased with initial solution Cu2+ concentrations.
The maximum Langmuir adsorption capacities were 18.31, 24.79, 9.17, and 18.21 mg g−1 for, KOH/BC, Na2CO3/BC, H2SO4/BC, and BC, respectively. The adsorption isotherm fits well to the two-parameter Langmuir model, with correlation coefficients of 0.92, 0.95, 0.99, and 0.93, respectively for KOH/BC, Na2CO3/BC, H2SO4/BC, and BC.

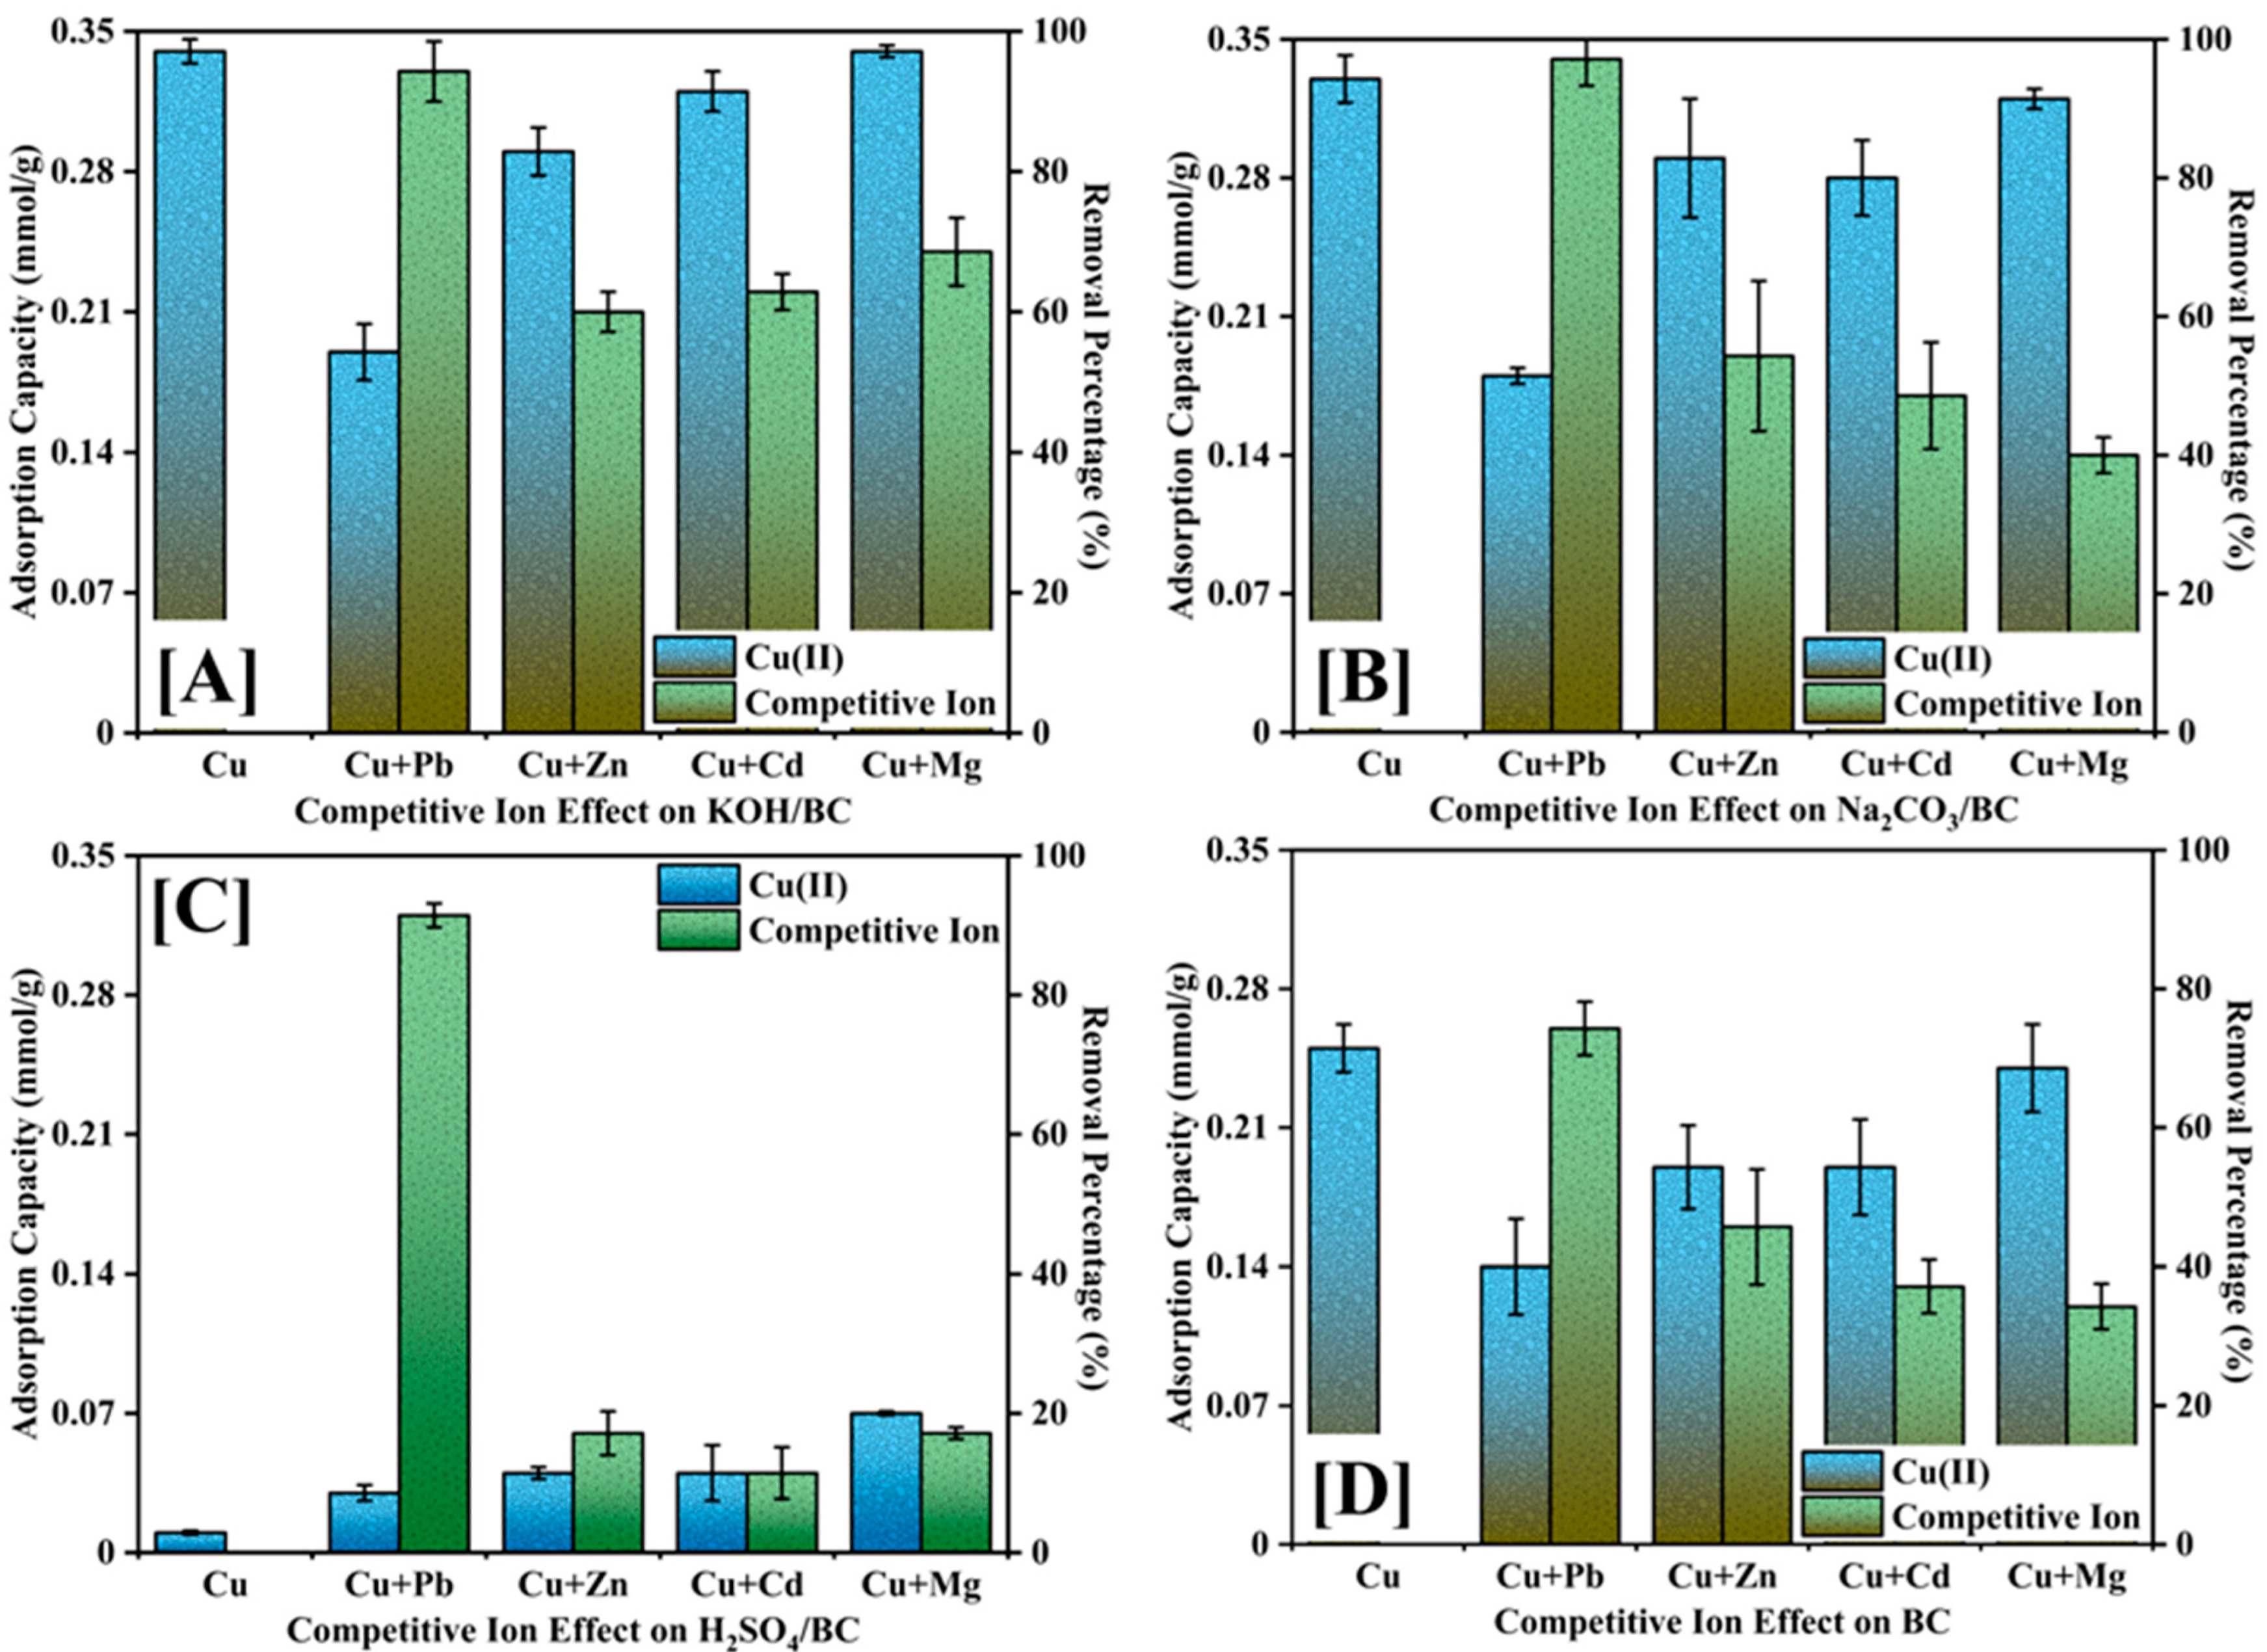
3.9. Effect of Competitive Ions

The competitiveness of ions depends on the pH, concentration, and ionic strength of the medium. This competitiveness for Cu2+ was studied using lead, zinc, cadmium, and magnesium ions. Equimolar concentrations (0.7 mM) of Cu2+ and competitive ions were studied at pH 5 (Figure 9).
Cu2+ showed adsorption capacities of 0.34 ± 0.01, 0.33 ± 0.01, 0.01 ± 0.00, and 0.25 ± 0.12 mmol/g for KOH/BC, Na2CO3/BC, H2SO4/BC, and BC, respectively, with no competitive ion. In the presence of Pb2+, Cu2+ showed capacities of 0.19 ± 0.01, 0.18 ± 0.00, 0.03 ± 0.00, and 0.14 ± 0.02 mmol/g, respectively, for KOH/BC, Na2CO3/BC, H2SO4/BC, and BC. Pb2+ gave higher selectivity compared with Cu2+ due to the formation of Pb(OH)2 on biochar surfaces. This occurred because Pb(OH)2 precipitates at a lower pH than Cu(OH)2 [30]. Compared with Zn2+, Cd2+, and Mg2+, all four biochar variants were more selective towards Cu2+. In KOH/BC, the selectivity of the competitive ions increased in the order of Zn2+ < Cd2+ < Mg2+. However, in BC, Na2CO3/BC, and H2SO4/BC, an inverse of this trend was observed (Zn2+ > Cd2+ > Mg2+).

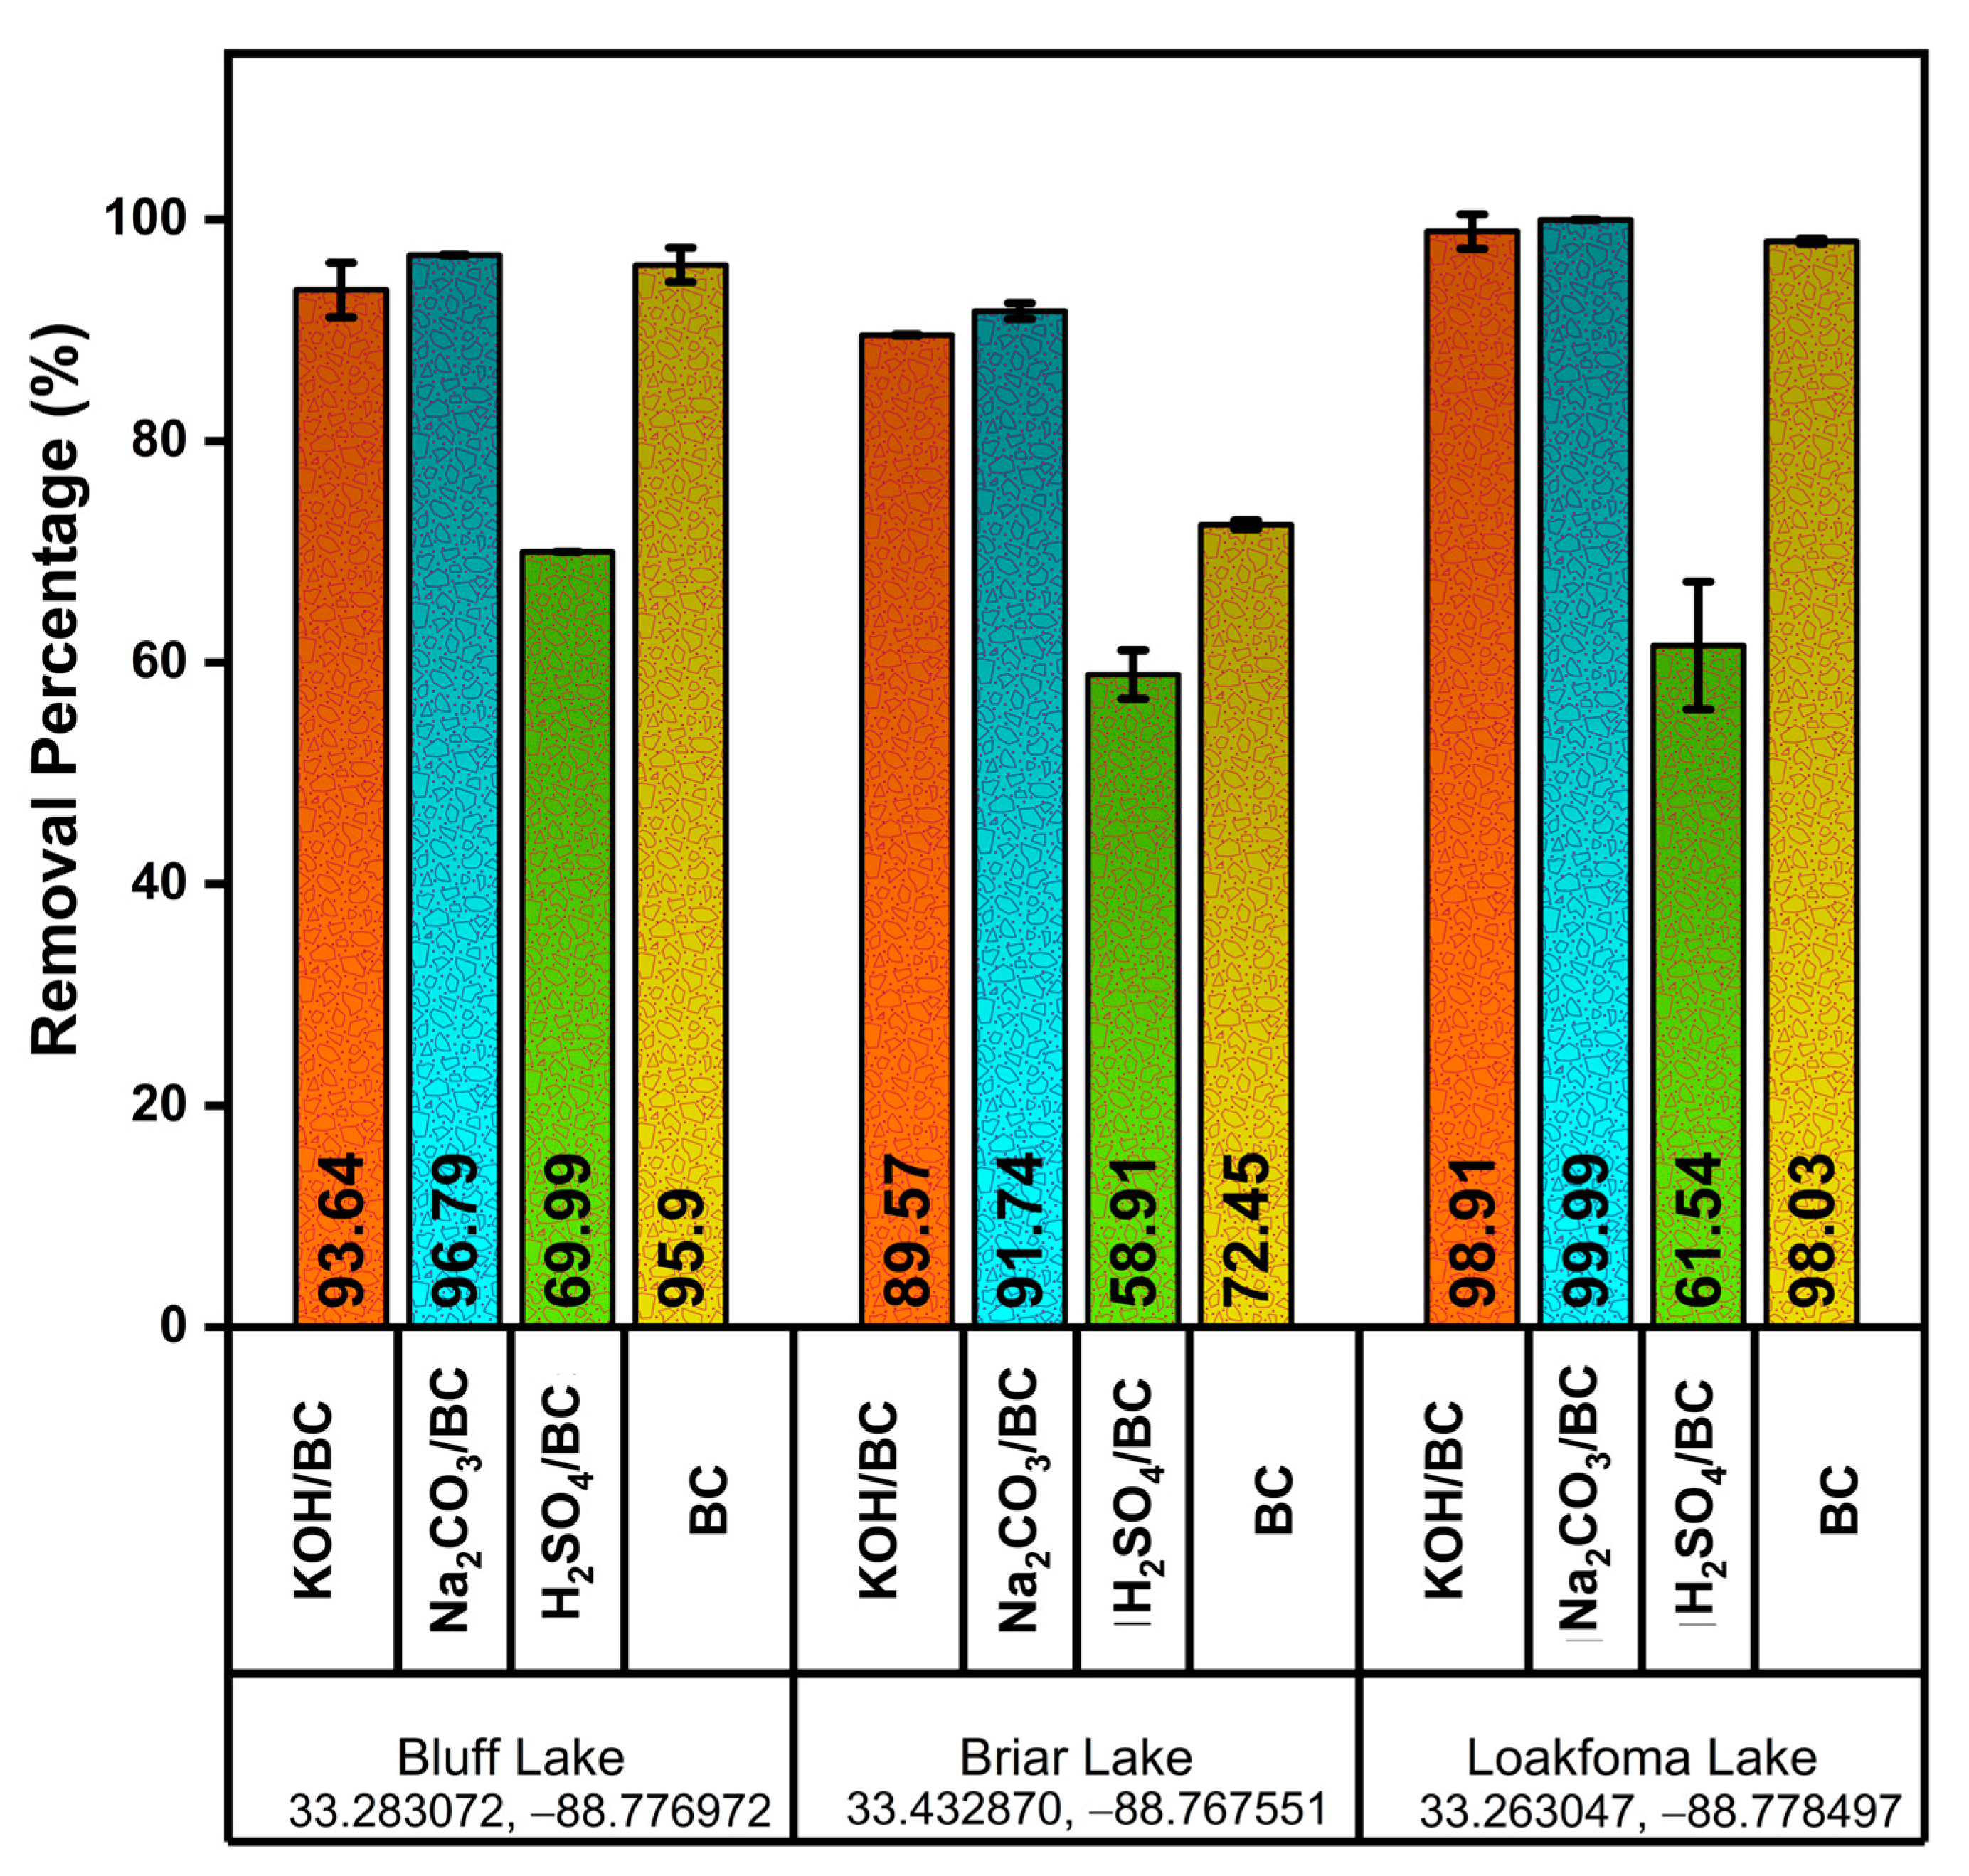
3.10. Effect of Real Water Matrices

It is evident from the data that Na2CO3/BC is more efficient at removing Cu2+ from aqueous solutions (Figure 10).
The removal percentages of Cu2+ were 95.5, 72.45, and 98.03% in Bluff, Briar, and Loakfoma Lakes. Similarly, removal percentages of 93.64, 89.57, and 98.91% were observed for KOH/BC, and 96.79, 91.74, and 99.99% for Na2CO3/BC across Bluff, Briar, and Loakfoma Lakes. H2SO4/BC had the lowest percentage removal, of 69.99, 58.91, and 61.34% for Bluff, Briar, and Loakfoma Lake water samples, respectively. With the biochar variants, the highest removal percentage was achieved with the Loakfoma water samples, except in the case of H2SO4/BC. In contrast, the lowest removal percentages were observed with Briar water samples, regardless of the adsorbents. The low Cu2+ removal exhibited in the Briar water sample is likely due to competition for sorption sites on the adsorbent by Ca2+. The Ca2+ concentrations in lake water samples were 23,154, 5432, and 3944 mg L−1, respectively, for Briar, Bluff, and Loakfoma water samples, (Table S1). The low removal percentage achieved by H2SO4/BC for all water samples confirms that Cu2+ competes with H+ for binding sites onto the adsorbent surface.

4. Conclusions

Cu2+ removal from aqueous solution was investigated using Douglas fir biochar (BC) and BC modified with 20% solutions of KOH (KOH/BC), H2SO4 (H2SO4/BC), and Na2CO3 (Na2CO3/BC). Despite the modification, BC exhibited a higher specific surface area (578.9 m2 g−1) than KOH/BC (389.3 m2 g−1), Na2CO3/BC (367.9 m2 g−1), and H2SO4/BC (326.7 m2 g−1). The Cu2+ removal capacities were in the order Na2CO3/BC > KOH/BC > BC > H2SO4/BC, with maximum adsorption capacities of 24.79, 18.31, 18.21, and 9.17 mg g−1, respectively. Cu2+ sorption from Loakfoma, Bluff, and Briar Lake water samples further demonstrated that Na2CO3/BC was more efficient than KOH/BC, BC, and H2SO4/BC. The corresponding Cu2+ removal percentages by Na2CO3/BC were 99.99, 96.79, and 91.74%, respectively, for Loakfoma, Bluff, and Briar Lake water samples. The percentages of removal by KOH/BC were 98.91, 98.03, and 93.64 and the removal percentage from BC were 95.9, 89.57 and 72.45%, for Loakfoma, Bluff, and Briar Lake water samples, respectively.

Supplementary Materials

The following supporting information can be downloaded at: https://www.mdpi.com/article/10.3390/separations11030078/s1, Figure S1: FTIR spectra of BC, KOH/BC, H2SO4/BC, and Na2CO3/BC; Figure S2: Thermogravimetric curve for BC, KOH/BC, Na2CO3/BC, and H2SO4/BC in nitrogen for temperature range from 25–1000 °C; Table S1: Initial physiochemical properties of Bluff, Briar, and Loakfoma lake water samples.

Author Contributions

B.A.: conceptualization, methodology, data analysis, writing original draft; P.M.R.: conceptualization, methodology, data analysis, writing original draft; O.A.O.: methodology, writing original draft; H.P.A.: methodology, writing original draft; J.N.T.: methodology; R.C.A.: conceptualization; T.E.M.: conceptualization, funding acquisition, review, and editing. All authors have read and agreed to the published version of the manuscript.

Funding

This work was supported by the USDA NIFA (361404) and Mississippi State University.

Data Availability Statement

Data is contained within the article and Supplementary Materials.

Acknowledgments

Mississippi State University, the Department of Chemistry, the Fulbright Organization, and the US Department of State are thanked for the scholarship awarded to Beatrice Arwenyo.

Conflicts of Interest

The authors declare no conflicts of interest.

References

  1. Sulaiman, F.R.; Hamzah, H.A. Heavy metals accumulation in suburban roadside plants of a tropical area (Jengka, Malaysia). Ecol. Process. 2018, 7, 28. [Google Scholar] [CrossRef]
  2. Boquete, M.T.; Lang, I.; Weidinger, M.; Richards, C.L.; Alonso, C. Patterns and mechanisms of heavy metal accumulation and tolerance in two terrestrial moss species with contrasting habitat specialization. Environ. Exp. Bot. 2021, 182, 104336. [Google Scholar] [CrossRef]
  3. Taylor, A.A.; Tsuji, J.S.; Garry, M.R.; McArdle, M.E.; Goodfellow, W.L.; Adams, W.J.; Menzie, C.A. Critical review of exposure and effects: Implications for setting regulatory health criteria for ingested copper. Environ. Manag. 2020, 65, 131–159. [Google Scholar] [CrossRef] [PubMed]
  4. Kerr, S.; Bonczek, R.; McGinn, C.; Land, M.; Bloom, L.; Sample, B.; Dolislager, F. The Risk Assessment Information System; Oak Ridge National Lab. (ORNL): Oak Ridge, TN, USA, 1998. [Google Scholar]
  5. Shah, P.U.; Raval, N.P.; Shah, N.K. Adsorption of copper from an aqueous solution by chemically modified cassava starch. J. Mater. Environ. Sci. 2015, 6, 2573–2582. [Google Scholar]
  6. Kavitha, C.; Vijayasarathi, P.; Tamizhdurai, P.; Mythily, R.M.R.; Mangesh, V.L. Retraction notice to “Elimination of Lead by Biosorption on Parthenium stem powder using Box-Behnken Design”. S. Afr. J. Chem. Eng. 2022, 42, 270–279. [Google Scholar] [CrossRef]
  7. Râpă, M.; Ţurcanu, A.A.; Matei, E.; Predescu, A.M.; Pantilimon, M.C.; Coman, G.; Predescu, C. Adsorption of copper (II) from aqueous solutions with alginate/clay hybrid materials. Materials 2021, 14, 7187. [Google Scholar] [CrossRef]
  8. Martin, R. Lead and Copper Rule Revisions: A Case Study in Identifying and Tracking Lead Water Service Lines with ArcGIS Field Maps; The University of Arizona: Tucson, AZ, USA, 2022. [Google Scholar]
  9. Qasem, N.A.; Mohammed, R.H.; Lawal, D.U. Removal of heavy metal ions from wastewater: A comprehensive and critical review. Npj Clean. Water 2021, 4, 36. [Google Scholar] [CrossRef]
  10. Thompson, K.A.; Shimabuku, K.K.; Kearns, J.P.; Knappe, D.R.; Summers, R.S.; Cook, S.M. Environmental comparison of biochar and activated carbon for tertiary wastewater treatment. Environ. Sci. Technol. 2016, 50, 11253–11262. [Google Scholar] [CrossRef] [PubMed]
  11. Lima, E.C. Removal of emerging contaminants from the environment by adsorption. Ecotoxicol. Environ. Saf. 2018, 150, 1–17. [Google Scholar]
  12. Fuentes, A.L.B.; Arwenyo, B.; Nanney, A.L.; Ramirez, A.; Jamison, H.; Venson, B.; Mohan, D.; Mlsna, T.E.; Navarathna, C. Application of biochar for the removal of actinides and lanthanides from aqueous solutions. In Sustainable Biochar for Water and Wastewater Treatment, Elsevier: Amsterdam, The Netherlands, 2022; pp. 321–359.
  13. Yaashikaa, P.; Kumar, P.S.; Varjani, S.; Saravanan, A. A critical review on the biochar production techniques, characterization, stability and applications for circular bioeconomy. Biotechnol. Rep. 2020, 28, e00570. [Google Scholar] [CrossRef]
  14. Najim, T.S.; Elais, N.J.; Dawood, A.A. Adsorption of copper and iron using low cost material as adsorbent. J. Chem. 2009, 6, 161–168. [Google Scholar] [CrossRef]
  15. Aydın, H.; Bulut, Y.; Yerlikaya, Ç. Removal of copper (II) from aqueous solution by adsorption onto low-cost adsorbents. J. Environ. Manag. 2008, 87, 37–45. [Google Scholar] [CrossRef]
  16. Pavan Kumar, G.; Malla, K.A.; Yerra, B.; Srinivasa Rao, K. Removal of Cu (II) using three low-cost adsorbents and prediction of adsorption using artificial neural networks. Appl. Water Sci. 2019, 9, 44. [Google Scholar] [CrossRef]
  17. Smith, M.; Ha, S.; Amonette, J.E.; Dallmeyer, I.; Garcia-Perez, M. Enhancing cation exchange capacity of chars through ozonation. Biomass Bioenergy 2015, 81, 304–314. [Google Scholar] [CrossRef]
  18. Dewage, N.B.; Liyanage, A.S.; Pittman Jr, C.U.; Mohan, D.; Mlsna, T. Fast nitrate and fluoride adsorption and magnetic separation from water on α-Fe2O3 and Fe3O4 dispersed on Douglas fir biochar. Bioresour. Technol. 2018, 263, 258–265. [Google Scholar] [CrossRef] [PubMed]
  19. Karunanayake, A.G.; Todd, O.A.; Crowley, M.; Ricchetti, L.; Pittman Jr, C.U.; Anderson, R.; Mohan, D.; Mlsna, T. Lead and cadmium remediation using magnetized and nonmagnetized biochar from Douglas fir. Chem. Eng. J. 2018, 331, 480–491. [Google Scholar] [CrossRef]
  20. Rodrigo, P.M.; Navarathna, C.; Pham, M.T.; McClain, S.J.; Stokes, S.; Zhang, X.; Perez, F.; Gunatilake, S.R.; Karunanayake, A.G.; Anderson, R. Batch and fixed bed sorption of low to moderate concentrations of aqueous per-and poly-fluoroalkyl substances (PFAS) on Douglas fir biochar and its Fe3O4 hybrids. Chemosphere 2022, 308, 136155. [Google Scholar] [CrossRef] [PubMed]
  21. Karunaratne, T.N.; Nayanathara, R.O.; Navarathna, C.M.; Rodrigo, P.M.; Thirumalai, R.V.; Pittman Jr, C.U.; Kim, Y.; Mlsna, T.; Zhang, J.; Zhang, X. Pyrolytic synthesis of graphene-encapsulated zero-valent iron nanoparticles supported on biochar for heavy metal removal. Biochar 2022, 4, 70. [Google Scholar] [CrossRef]
  22. Chu, Y.; Zhu, S.; Wang, F.; Lei, W.; Xia, M.; Liao, C. Tyrosine-immobilized montmorillonite: An efficient adsorbent for removal of Pb2+ and Cu2+ from aqueous solution. J. Chem. Eng. Data 2019, 64, 3535–3546. [Google Scholar] [CrossRef]
  23. Karunaratne, T.N.; Rodrigo, P.M.; Oguntuyi, D.O.; Mlsna, T.E.; Zhang, J.; Zhang, X. Unraveling biochar surface area on structure and heavy metal removal performances of carbothermal reduced nanoscale zero-valent iron. J. Bioresour. Bioprod. 2023, 8, 388–398. [Google Scholar] [CrossRef]
  24. Aravamuthan, S.R.; Srinivasan, S.; Shukla, A.K. An in Situ Graphite-Grafted Alkaline Iron Electrode for Iron-Based Accumulators. In ECS Meeting Abstracts; IOP Publishing: Bristol, UK, 2013; p. 284. [Google Scholar]
  25. Chai, W.S.; Cheun, J.Y.; Kumar, P.S.; Mubashir, M.; Majeed, Z.; Banat, F.; Ho, S.-H.; Show, P.L. A review on conventional and novel materials towards heavy metal adsorption in wastewater treatment application. J. Clean. Prod. 2021, 296, 126589. [Google Scholar] [CrossRef]
  26. Behazin, E.; Ogunsona, E.; Rodriguez-Uribe, A.; Mohanty, A.K.; Misra, M.; Anyia, A.O. Mechanical, chemical, and physical properties of wood and perennial grass biochars for possible composite application. BioResources 2016, 11, 1334–1348. [Google Scholar] [CrossRef]
  27. Zhang, C.; Zhang, N.; Xiao, Z.; Li, Z.; Zhang, D. Characterization of biochars derived from different materials and their effects on microbial dechlorination of pentachlorophenol in a consortium. RSC Adv. 2019, 9, 917–923. [Google Scholar] [CrossRef] [PubMed]
  28. Siipola, V.; Tamminen, T.; Lahti, R.; Romar, H. Effects of Biomass Type, Carbonization Process, and Activated Carbons. Bioresources 2018, 13, 5976–6002. [Google Scholar] [CrossRef]
  29. Huang, H.; Tang, J.; Gao, K.; He, R.; Zhao, H.; Werner, D. Characterization of KOH modified biochars from different pyrolysis temperatures and enhanced adsorption of antibiotics. RSC Adv. 2017, 7, 14640–14648. [Google Scholar] [CrossRef]
  30. Rojas, R. Copper, lead and cadmium removal by Ca Al layered double hydroxides. Appl. Clay Sci. 2014, 87, 254–259. [Google Scholar] [CrossRef]
Figure 1. N2 adsorption at 77.3 K of Douglas fir biochar (BC), BC treated with KOH (KOH/BC), BC treated with H2SO4 (H2SO4/BC), and BC treated with Na2CO3 (Na2CO3/BC).
Separations 11 00078 g001
Figure 2. SEM micrographs showing surface morphology for BC, KOH/BC, Na2CO3/BC, and H2SO4/BC.
Separations 11 00078 g002
Figure 3. SEM-EDX images and elemental compositions for BC, KOH/BC, Na2CO3/BC, and H2SO4/BC.
Separations 11 00078 g003
Figure 4. XRD patterns of BC, KOH/BC, H2SO4/BC, and Na2CO3/BC.
Separations 11 00078 g004
Figure 5. pH point of zero charge (pHpzc) for (A) BC, (B) 20% KOH (KOH/BC), (C) 20% Na2CO3 (Na2CO3/BC), and (D) 20% H2SO4 (H2SO4/BC) materials. ∆pH was calculated as ∆pH = Initial pH − Final pH.
Separations 11 00078 g005
Figure 6. (A) Fractional composition of Cu2+ and (B) adsorption capacities of Cu2+ onto BC, BC treatment with 20% KOH (KOH/BC), BC treatment with 20% Na2CO3 (Na2CO3/BC), and BC treatment with 20% H2SO4 (H2SO4/BC) as a function of initial solution pH, and (C) equilibrium pH.
Separations 11 00078 g006
Figure 7. The effect of contact time on Cu2+ sorption onto (A) KOH/BC, (B) Na2CO3/BC, (C) H2SO4/BC, and (D) BC (at 25 °C and pH 5).
Separations 11 00078 g007
Figure 8. Cu2+ sorption capacities and non-linear Langmuir fits on KOH/BC (A), Na2CO3/BC (B), H2SO4/BC (C), and BC (D) at pH 5 and 25 °C.
Separations 11 00078 g008
Figure 9. Effect of competitive ions (Pb2+, Zn2+, Cd2+, and Mg2+) on the uptake of Cu2+, where the Cu2+ and competitive ion concentrations were 0.7 mM, on (A) KOH/BC, (B) Na2CO3/BC, (C) H2SO4/BC, and (D) BC.
Separations 11 00078 g009
Figure 10. Removal percentages of Cu2+ in three different water matrices for KOH/BC, Na2CO3/BC, H2SO4/BC, and BC, respectively, at 2 mg/L initial Cu2+ concentrations.
Separations 11 00078 g010
Table 1. Surface area, pore volume, and pore size diameter of BC, KOH/BC, Na2CO3/BC, and H2SO4/BC.
Material aBET Surface Area (m2/g)Pore Volume (cm3/g)Pore Diameter (Å)
BC578.90 ± 3.210.0664.55
KOH/BC389.30 ± 0.390.12913.26
H2SO4/BC326.65 ± 0.340.10612.99
Na2CO3/BC367.92 ± 3.440.12713.76
a BC = untreated Douglas fir biochar, KOH/BC = BC treated with 20% KOH, H2SO4/BC = BC treated with 20% H2SO4, and Na2CO3/BC = BC treated with 20% Na2CO3 solution.
Table 2. Elemental compositions and ash contents of BC, KOH/BC, H2SO4/BC, and Na2CO3/BC.
MaterialC [%]H [%]O [%]N [%]S [%] Ash [%]
BC92.29 ± 1.320.69 ± 0.014.750.13 ± 0.010.02 ± 0.002.13 ± 0.54
KOH/BC81.62 ± 0.451.04 ± 0.0310.980.2 ± 0.040.01 ± 0.016.15 ± 0.85
H2SO4/BC76.39 ± 2.451.32 ± 0.0516.080.25 ± 0.023.62 ± 0.801.89 ± 0.28
Na2CO3/BC87.64 ± 0.870.83 ± 0.066.820.14 ± 0.070.05 ± 0.024.52 ± 0.49
Disclaimer/Publisher’s Note: The statements, opinions and data contained in all publications are solely those of the individual author(s) and contributor(s) and not of MDPI and/or the editor(s). MDPI and/or the editor(s) disclaim responsibility for any injury to people or property resulting from any ideas, methods, instructions or products referred to in the content.

