Article

A Sensitive, Green, and Fast LC–MS/MS Analytical Method for the Quantification of Ribociclib: Evaluation of the Metabolic Stability in HLMs

Department of Pharmaceutical Chemistry, College of Pharmacy, King Saud University, Riyadh 11451, Saudi Arabia
*
Author to whom correspondence should be addressed.
Separations 2023, 10(9), 472; https://doi.org/10.3390/separations10090472
Submission received: 13 August 2023 / Revised: 23 August 2023 / Accepted: 27 August 2023 / Published: 28 August 2023
(This article belongs to the Section Chromatographic Separations)

Abstract

:
Ribociclib (Kisqali®) is a pharmacological agent that has great selectivity as a cyclin-dependent kinase 4/6 inhibitor. It has received regulatory approval for its application in the treatment of breast cancer. The objective of the current study was to develop a rapid, green, highly sensitive, validated, and specific LC–MS/MS approach for the quantification of RCB in human liver microsomes (HLMs) over the linear range of 1–3000 ng/mL (LLOQ: 0.98 ng/mL). The inter- and intraday precision and accuracy exhibited values ranging from −0.31% to 3.16% and −5.67% to 5.46% correspondingly. The eco-scale technique (AGREE program) was employed to examine the environmental impact of the existing LC–MS/MS technology. The in vitro half-life and intrinsic clearance of RCB were determined to be 23.58 min and 34.39 mL/min/kg, respectively, which indicated the intermediate extraction ratio of RCB. The in silico P450 software (version 6.6) was used to confirm and validate the practical results. The metabolism of RBC was previously studied by our research group, indicating that the piperazine ring and N-dimethyl group are responsible for the metabolic instability of RCB. Drug discovery studies can be conducted taking into account this concept, allowing the development of new drugs with an enhanced safety profile and good metabolic stability.

1. Introduction

A malignant neoplasm is distinguished by the unregulated proliferation of malignant cells and the potential for metastasis to distant organs inside the body [1]. Breast cancer is widely recognised as the most often reported cancer among women globally, accounting for around 12% of all reported cases worldwide [2]. Breast cancer accounts for 22% of newly diagnosed cancer cases among women in Saudi Arabia [3]. Specific pharmaceutical agents exist that effectively modulate genetic aberrations within cancerous cells, hence impeding their proliferation and metastatic potential. Tyrosine kinases (TKs) are significant targets owing to their pivotal role in the regulation of growth factor signaling [4]. The regulation of TK activity within the cellular context plays a crucial role in governing various essential processes, including cellular proliferation, progression through the cell cycle, and programmed cell death [5].
Cyclin-dependent kinase 4 and 6 (CDK4/6) are recognised as a family of tyrosine kinase inhibitors (TKIs) that play a pivotal role in cellular proliferation. The inability to regulate the CDK4/6 pathway has had a significant impact on the biology of breast cancer [6]. In recent times, significant advancements have been made in the field of selective CDK4/6 inhibitors, which have demonstrated notable efficacy with manageable safety profiles. Breast cancer has been found to be effectively treated by three CDK4/6 inhibitors that have received approval from the U.S. Food and Drug Administration (FDA). These inhibitors are palbociclib (marketed as Ibrance®), abemaciclib (marketed as Verzenio®), and ribociclib (marketed as Kisqali®) [7].
RBC has been identified as a potent inhibitor of CDK4/6, demonstrating significant anticancer effects in both preclinical and clinical studies (Figure 1). The approval of RBC by the United States Food and Drug Administration (US-FDA) on 13 March 2017 pertains to its utilisation in the management of hormone receptor positive or advanced breast cancer with human epidermal growth factor receptor 2 negative metastasis in postmenopausal women. The prevailing adverse effects observed in a significant proportion of patients (20%) receiving RBC treatment included leukopenia, neutropenia, weariness, headache, alopecia, and back discomfort. Gastrointestinal symptoms such as nausea, diarrhoea, vomiting, and constipation were reported in the public domain [8]. RBC has also been observed to cause QT interval lengthening in individuals, with a prevalence of 7.5%. This effect exhibits a reliance on the concentration of RBCs. However, it is important to acknowledge that these observed adverse effects were significant and potentially hazardous, particularly when considering prolonged usage [7].
The importance of the current study lies in the development of a sensitive, environmentally friendly, and straightforward analytical approach for the measurement of RCB in various matrices. The accurate analysis of the targeted drug is essential for therapeutic drug monitoring (TDM) of a specific medicine (RCB in the current experiment). Furthermore, understanding the correlation between the concentration level and activity of RCB is crucial for ensuring safe administration to patients.
A few LC–MS/MS methods were reported for RBC quantification in different matrices, either alone or in combination with other drugs [9,10,11,12,13,14,15,16]. No single article has been published for the quantification of RBC in HLMs with the application to metabolic stability assessment. The current analytical LC–MS/MS method is more sensitive (1 ng/mL) if compared to other reported methods [9,10,11,12,13,16] and exhibits a wider range of linearity (1–3000 ng/mL) if compared to other reported methods [9,15,16]. The established method was also characterized by shorter running time, greenness, and was fully validated. To date, there is a lack of research documenting the assessment of in vitro RCB metabolic stability in HLMs utilising LC–MS/MS technology. The assessment of metabolic stability in human liver microsomes (HLMs) is of utmost importance for determining the rate of metabolism and excretion of a compound, which is essential for the drug development process. The metabolic stability of a drug refers to its vulnerability to undergo metabolism, and it is quantified by its in vitro half-life [t1/2] and intrinsic clearance [Clint]. The concept of half-life, denoted as t1/2, refers to the duration necessary for the metabolism of 50% of the original pharmacological substance. Intrinsic clearance, denoted as Clint, refers to the hepatic capacity to metabolise a medication present in the bloodstream via various metabolic routes.
The objective of this study was to establish an LC–MS/MS approach that is sensitive, rapid, and specific for determining the in vitro metabolic stability of RCB in HLMs. The validity of this methodology was confirmed by employing in silico metabolic software. The present LC–MS/MS methodology employed an isocratic mobile phase with a run time of 2.5 min (considered a rapid method) and operated at a flow rate of 0.2 mL (with a low concentration of organic solvent). This approach demonstrated the environmentally sustainable nature of the established analytical method, which exhibited a linear relationship within the concentration range of 1–3000 ng/mL. The significance of establishing an analytical approach for assessing metabolic stability was confirmed through the utilisation of the WhichP450 model within StarDrop’s software (version 6.6), enabling the efficient conservation of resources and time [17].The LC–MS/MS technology was employed to assess the Clint and in vitro t1/2 of RCB [18]. These measurements were then utilised in three distinct models (venous equilibrium, dispersion, and parallel tube) to calculate the in vivo rate of metabolism [19,20]. The t1/2 and Clint of RCB were determined using an in vitro t1/2′ technique based on the well-stirred model, a widely employed model in drug metabolism studies due to its straightforward nature [19,20]. The intermediate metabolic rate of RCB was shown to have a moderate duration of action and low bioavailability in vivo, as reported in previous studies [21,22,23,24,25].

2. Materials and Methods

2.1. Materials

The two analytes of interest, ribociclib (also known as LEE011) with a purity of 99.98% and ponatinib (also known as AP24534) with a purity of 99.43%, were obtained from MedChem Express, a firm based in Princeton, NJ, USA. The catalogue numbers for these analytes are HY-15777 and HY-12047, respectively. The chemicals used in this study, namely ammonium formate, acetonitrile (ACN), formic acid, and HLMs (20 mg/mL), were obtained from Sigma-Aldrich company located in St. Louis, MO, USA. All solid compounds and reference powders used in the study were of analytical (AR) quality, whereas all solvents employed were of high-performance liquid chromatography (HPLC) grade. The HLMs were transported using dry ice and stored in a refrigerator at a temperature of −78 °C until they were ready for subsequent utilisation.

2.2. Instruments

The Milli-Q Plus water purification device, obtained from the Millipore firm located in Billerica, MA, USA, was utilised to produce water of HPLC quality. The LC–MS/MS system employed in this study comprised the Acquity TQD MS (QBB1203) and Acquity UPLC (H10UPH) instruments. This system was utilised for the purpose of detecting and quantifying the analytical peaks of RCB and PNB following their extraction from an in vitro metabolic matrix. The LC–MS/MS system was operated using MassLynx 4.1 software (Version 4.1, SCN 805). The vacuum within the TQD analyser was created by means of a vacuum pump (Sogevac®; Murrysville, PA, USA). The MassLynx software package includes two important programs (QuanLynx and IntelliStart®).The data that was gathered was analysed and evaluated using the QuanLynx programme. The optimisation of mass spectrometry characteristics was achieved through the utilisation of the IntelliStart® software (Version 4.1, SCN 805). In order to facilitate the dissociation of parent ions into their matching daughter ions, a collision gas consisting of argon (99.999%) was employed within the collision cell of the TQD analyzer (Waters Acquity, Milford, MA, USA). In the evaporation process of the mobile phase droplets, nitrogen gas sourced from a Nitrogen generator (manufactured by Peak Scientific firm, located in Scotland, UK) was employed in the electrospray ionisation (ESI) source.

2.3. Adjustment of LC–MS/MS Features

The LC–MS/MS system parameters were optimised in order to achieve optimal sensitivity and efficient separation of the RCB and PNB chromatographic peaks, as outlined in Table 1. The chromatographic characteristics of liquid chromatography (LC), such as the stationary phase and mobile phase, were modified in order to achieve the suggested sensitivity and separation of the desired targets (RCB and PNB), as outlined in Table 1. As a result, the isocratic mobile phase comprised of 40% acetonitrile (ACN) and 0.1% formic acid (HCOOH) in water (60%; pH: 3.2), with a flow rate of 0.2 mL/min. The presence of a mobile phase with a pH greater than 3.2, specifically utilising a 10 mM NH4COOH solution with a pH of 4.5, resulted in the occurrence of peak tailing and an undesirably prolonged elution time during the RCB chromatographic process. An elevated ACN ratio exceeding 45% resulted in the occurrence of chromatographic peaks overlap between RCB and PNB. Conversely, a lower ratio led to an extended elution time. The positive electrospray ionisation (ESI) mode was employed to facilitate the protonation of the basic nitrogen atoms present in the chemical structures of RBC and PNB. This resulted in the formation of ions with a positive charge.
The IntelliStart® software (Version 4.1, SCN 805) was employed to optimise the analysis of the target analytes, RCB (with a molecular formula of C23H30N8O) and PNB (with a molecular formula of C29H27F3N6O). This optimisation was performed in the combined mode, which involves both infusion and mobile phase techniques. The concentration of the target analytes in the analyte stock solution was set at 10 µg/mL. The MRM analyser mode was employed to enhance the selectivity and sensitivity of the LC–MS/MS approach developed for the estimation of RCB and PNB. The dissociation of parent ions (RCB and PNB) into daughter ions was achieved by subjecting them to collisions with argon gas within the collision cell. The dwell period for the mass transitions of RCB and PNB was recorded at 0.025 s. Table 2 provides a comprehensive overview of the MRM features associated with RCB and PNB (IS).

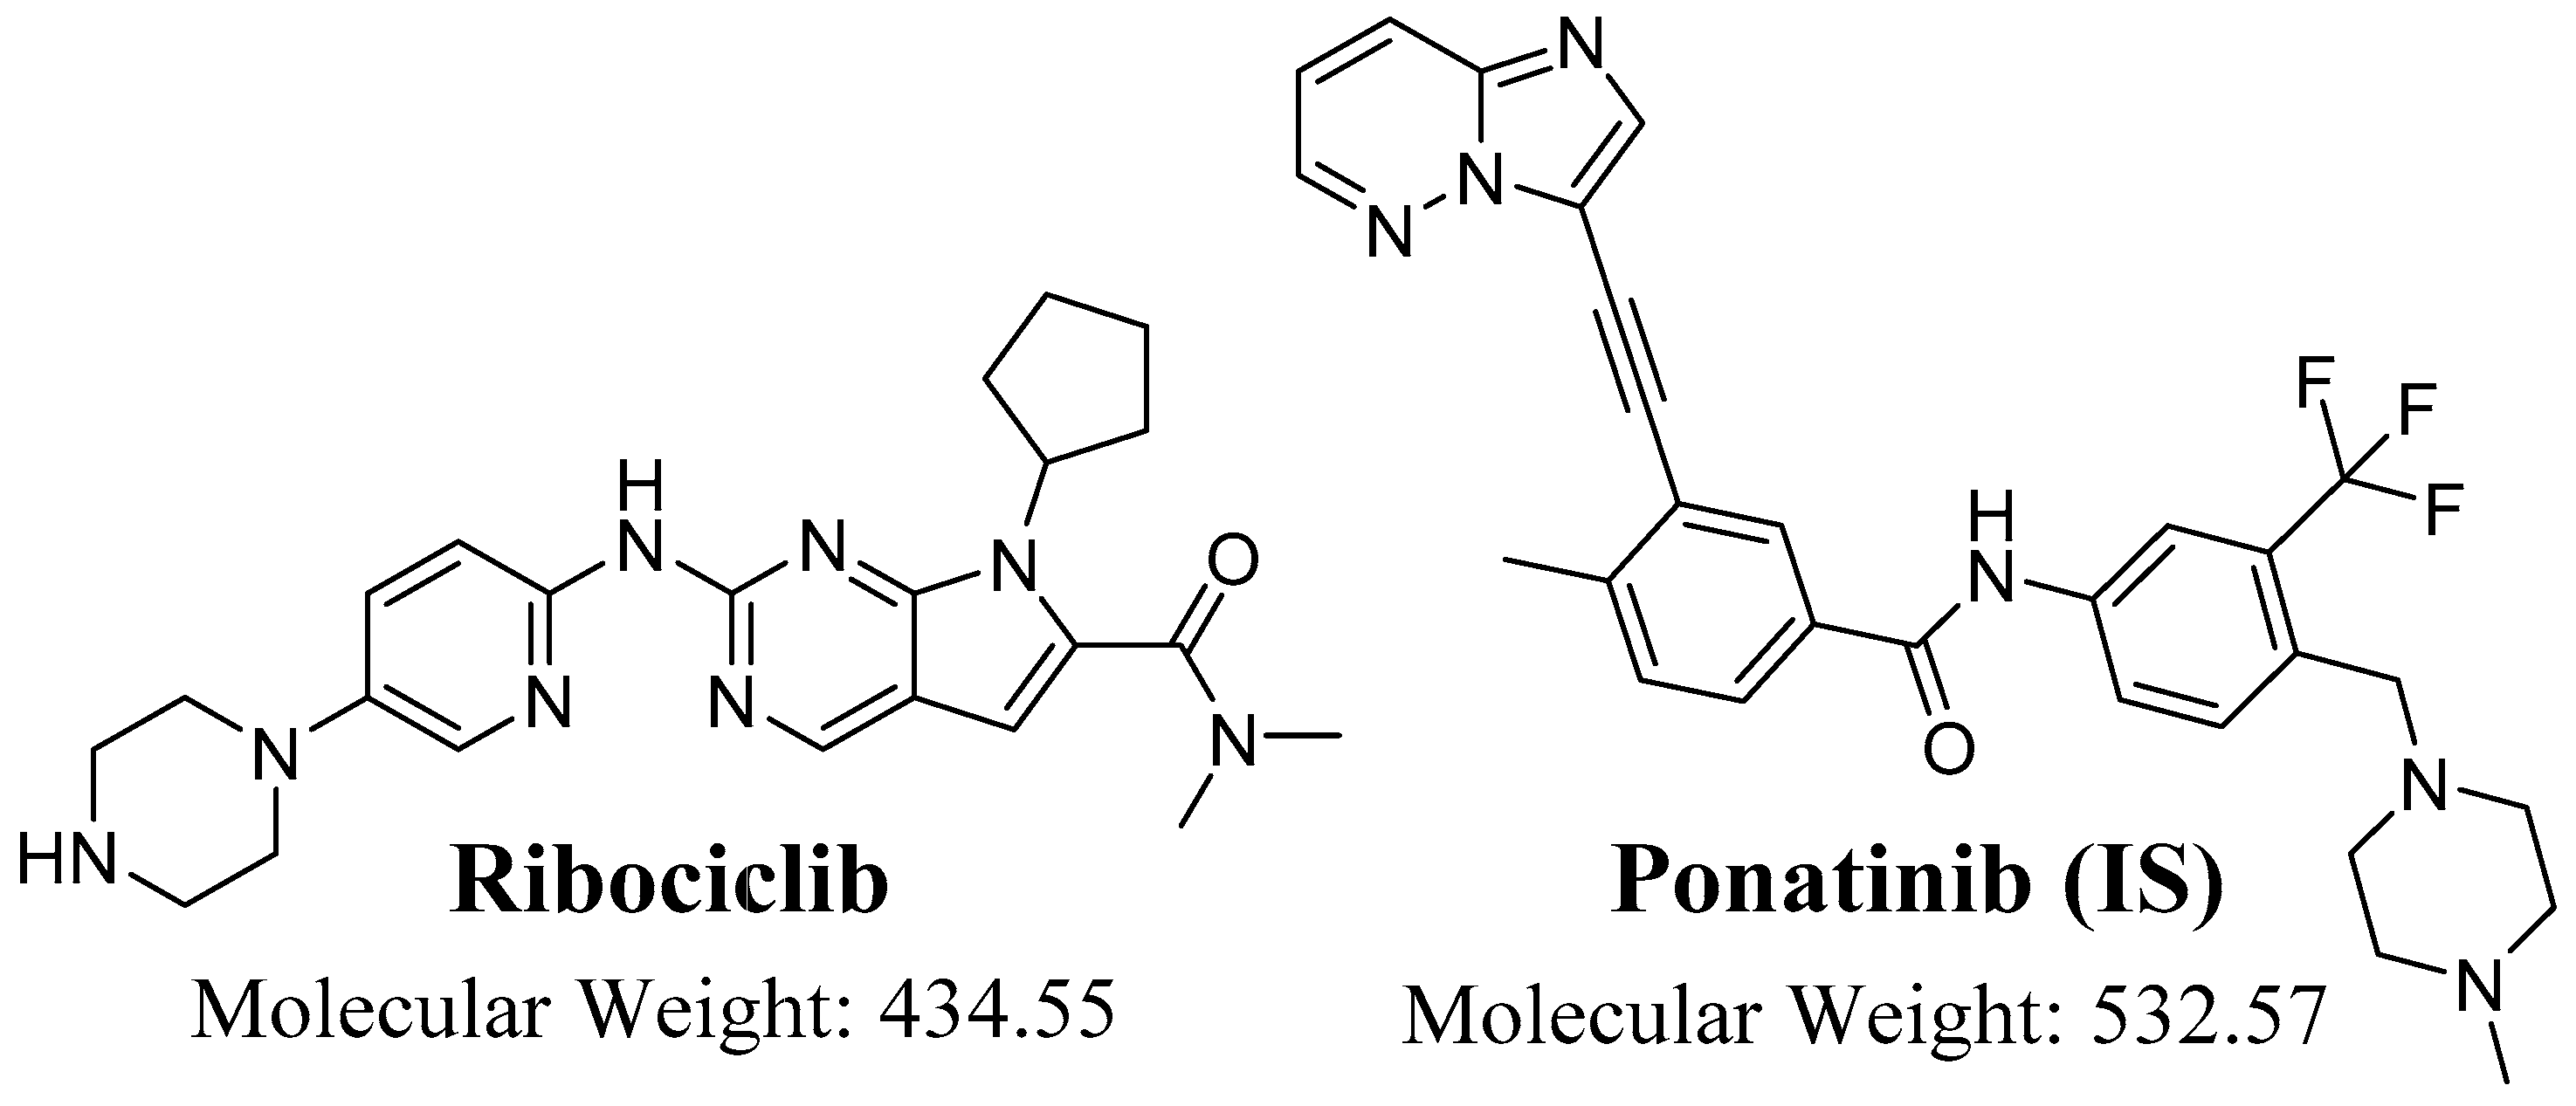
2.4. Working Solutions of RCB and PNB

The solubility ratio of RCB and PNB in dimethyl sulfoxide (DMSO) is 20 mg/mL (46.03 mM; requiring ultrasonic) and 50 mg/mL (93.89 mM; requiring ultrasonic), respectively. Therefore, the principal stock solutions of RCB and PNB (1 mg/mL) were prepared using DMSO. The experimental procedure involved conducting working solutions (WSs) of RCB at concentrations of 100 µg/mL, 10 µg/mL, and 1 µg/mL, as well as PNB at a concentration of 10 µg/mL. This was achieved by sequentially diluting the stock solutions of RCB and PNB, which were initially prepared at a concentration of 1 mg/mL, using the mobile phase as a diluent.

2.5. RCB Calibration Curve

Prior to commencing the validation procedures, which involved calibrating the RCB levels using RCB calibration levels (CLs), the HLMs were rendered inactive by utilising a 2% DMSO solution for a duration of 5 min at a temperature of 50 °C. This was performed to mitigate the potential impact of metabolism [26,27,28] on the target analytes, namely RCB and PNB. The HMLS matrix was prepared by diluting 30 µL of the deactivated HLMs with 1 mL of a solution consisting of 0.1 M sodium phosphate buffer (pH 7.4), 3.3 mM MgCl2, and 1 mM NADPH. This was done to replicate the metabolic in vitro incubation technique. In order to calibrate RCB, the RCB (WS2 and WS3) samples were diluted with deactivated HMLS matrix. This was carried out to achieve seven calibration levels (CLs) at concentrations of 1, 5, 50, 200, 500, 1500, and 3000 ng/mL. Additionally, four quality control samples (QCs) were prepared at concentrations of 1 ng/mL (lower limit of quantification, LLOQ), 3 ng/mL (lower QC, LQC), 900 ng/mL (medium QC, MQC), and 2400 ng/mL (higher QC, HQC). It was ensured that more than 90% of the diluted HMLS matrix was retained in order to eliminate the impact of dilution on the preparation of real samples. Quality controls (QCs) were processed and their concentrations were determined by using the regression equation derived from newly prepared reference calibration curves (RCB CLs). The QCs were handled as unknowns and their concentrations were back estimated accordingly. A solution of PNB (100 µL; 1000 ng/mL) in WK was introduced as an internal standard (IS) to all C Ls and QCs, with a volume of 1 mL.

2.6. Extraction of RCB and PNB from the HMLS Matrix

The extraction of RCB and PNB from the incubated samples was conducted using the protein precipitation process, which involved the use of acetonitrile (ACN) to precipitate proteins and quench the enzymatic reactions. As a result, a volume of 2 mL of ACN was introduced to both the RCB CLs and QCs. The samples were then subjected to continuous agitation for a duration of 5 min, facilitating the extraction process of the desired analytes, namely RCB and PNB. The samples that had been shaken were subjected to centrifugation at a speed of 14,000 rpm for a duration of 12 min. at a temperature of 4 °C in order to purify the supernatants. The supernatants were collected in 1 mL volumes and afterwards filtered using a 0.22 µm syringe to verify the purity of the collected samples. The filtered samples were then transferred into HPLC vials. The positive control and negative control were constructed using the same methodology as described previously. The positive control consisted of a mixture of HLMs’ matrix and PNB, while the negative control consisted of HLMs’ matrix alone. The aforementioned controls were employed to verify the absence of any interference from the constituents of the HMLS matrix during the specific retention durations of the target analytes, namely RCB and PNB. The calibration curve was constructed using the data of RCB CLs. This was achieved by graphing the peak area ratio of RCB to PNB on the y-axis against the RCB concentration values on the x-axis. The linear regression equation (y = ax + b; r2) and validation characteristics were employed to assess the extent of linearity in the established LC–MS/MS approach.

2.7. Validation of the LC–MS/MS Analytical Methodology

The validation steps for the LC–MS/MS methodology were achieved by quantifying various parameters including sensitivity, specificity, precision, linearity, stability, accuracy, extraction recovery, and matrix effect. These parameters were evaluated in accordance with the guidelines provided by the FDA and European Medicines Agency (EMA) for the validation of analytical methodologies [29,30].

2.7.1. Specificity

The current methodology of LC–MS/MS achieved specificity by injecting six blank batches of HMLS matrix, following the extraction process described in Section 2.7. The extracts were introduced into the LC–MS/MS system and analysed for the presence of any interfering peaks at the elution periods corresponding to the target analytes, namely RCB or PNB. The obtained data was then compared to that of spiked HMLS matrix samples containing the target analytes, RCB and PNB. The MRM mass analyser mode was employed to mitigate the carryover effects of the RCB and PNB in the TQD mass detector. This was demonstrated by injecting negative control HLMs (lacking RCB and PNB).

2.7.2. Sensitivity and Linearity

The linearity and sensitivity of the LC–MS/MS analytical methodology were estimated by injecting 12 newly prepared calibration plots (consisting of seven levels) of RCB in a matrix of human liver microsomes (HLMs) on a single day. The unknown concentrations were then determined by back-calculating using the linear regression equation derived from each established calibration plot. The determination of the limit of detection (LOD) and limit of quantitation (LOQ) was conducted following the guidelines provided in the Pharmacopoeia. These guidelines involve computing the slope and standard deviation (SD) of the intercept of the calibration curve created. Equations (1) and (2) were used to calculate the LOD and LOQ, respectively.
L O D = 3.3     S D   o f   t h e   i n t e r c e p t S l o p e
L O Q = 10     S D   o f   t h e   i n t e r c e p t S l o p e
The linearity of the current LC–MS/MS methodology was assessed by employing the coefficient of variation (R2) and the least squares statistical method (y = ax + b).

2.7.3. Accuracy and Precision

The accuracy and precision of the LC–MS/MS analytical methodology were evaluated by injecting six replicates of RCB quality controls (QCs) across three consecutive days to assess inter-day performance, and by injecting twelve replicates on a single day to assess intra-day performance. The present study evaluated the accuracy and precision of the LC–MS/MS approach. Precision was determined as the percentage relative standard deviation (% RSD) using Equation (3), while Accuracy was quantified as the percentage error (%E) using Equation (4).
%   R S D = S D M e a n
%   E r r o r = ( A v e r a g e   c a l c u l a t e d   c o n c .     S u p p o s e d   c o n c . ) S u p p o s e d   c o n c .   ×   100

2.7.4. Matrix Effect and Extraction Recovery

The impact of the matrix constituent of HLMs on the ionisation degree of the target analytes (RCB or PNB) was assessed by dividing the samples into two distinct groups. The matrix of HLMs (group 1) was supplemented with RCB LQC at a concentration of 3 ng/mL, along with the Internal Standard (IS) known as PNB (1000 ng/mL). On the other hand, group 2 was prepared by using the HMLS matrix instead of the mobile phase. The estimation of the normalised ME for the IS was performed utilizing Equation (5), while the ME for the target analytes (RCB and PNB) was determined utilizing Equation (6).
I S   n o r m a l i z e d   M E = M E   o f   R C B M E   o f   P N B   ( I S )
M E   o f   R C B   o r   P N B = m e a n   p e a k   a r e a   r a t i o   S e t 1 S e t 2   ×   100
The assessment of the extraction recovery ratio of RCB from the HMLS matrix and the influence of HLMs on the ionisation extent of the target analyte (RCB) was carried out by the injection of the four QCs. The efficacy of protein precipitation utilising acetonitrile (ACN) for the extraction of RCB and PNB was validated by injecting six replicates of the four QCs in HMLS matrix (B), and afterwards comparing the resultant data with the four QCs that were prepared in the mobile phase (A). The determination of the extraction recoveries for the target analytes, RCB and PNB, involved the calculation of the ratio B/A, which was afterwards multiplied by 100.

2.7.5. Stability

The stability of RCB in the matrix under investigation, namely HLMs, as well as in the stock preparations dissolved in DMSO, was assessed by subjecting the samples to various laboratory conditions that mimic those encountered during actual analysis. These conditions included different storage conditions (such as auto sampler, long-term, and short-term storage) as well as subjecting the samples to three freeze–thaw cycles.

2.8. In Vitro Estimation of the RCB Metabolic Stability

The Clint and in vitro half-life (t1/2) of red blood cells (RCB) were determined by assessing the remaining percentage of RCB during metabolic incubation with human liver microsomes (HLMs) supplemented with various additives (MgCl2 and NADPH) to mimic the impact of actual metabolic processes. To condition metabolic reactions, a pre-incubation step was performed by combining 1 µL of RCB (4.35 mg/mL) with HLMs (without NADPH) and allowing it to incubate at 37 °C for 10 min. This pre-incubation step ensured that the metabolic pathways were at an optimal temperature. Subsequently, the metabolic pathways were initiated by adding 1 mM NADPH, and the reactions were quenched at specific time intervals (0, 2.5, 7.5, 15, 20, 30, 40, 50, 60, and 70 min.) using 2 mL of ACN. Prior to terminating the metabolic reaction, 100 µL of the internal standard (PNB; 1000 ng/mL) was introduced in order to mitigate the potential influence of metabolism on the concentration of PNB. The extraction of the target analytes (RCB and PNB) from the incubation mixture was carried out using the identical procedures outlined in Section 2.7. A negative control sample was generated by subjecting RCB to incubation with HLMs in the absence of the metabolic co-factor NADPH. This was done to ascertain the impact of incubation conditions and matrix ingredients on the concentration of RCB during in vitro metabolic tests.
The determination of RCB concentration in the incubated samples was performed using the regression equation obtained from the parallel injection of RCB calibration curves. The construction of the RCB metabolic stability curve involved plotting the designated time intervals (x-axis) ranging from 0 to 70 min against the ratio of the remaining RCB concentration relative to the original concentration at time zero (100%) (y-axis). In addition, the linear portion of the metabolic stability curve, which encompasses the time range of 0 to 40 min, was employed to construct a logarithmic curve. This was achieved by graphing the natural logarithm (ln) of RCB concentrations against the period of metabolic incubation, ranging from 0 to 40 min. The determination of the rate constant for metabolic stability, referred to as the RCB rate constant, involves assessing the slope of the resulting curve. The slope is subsequently employed to determine the in vitro half-life (t1/2) by the utilisation of the equation: in vitro t1/2 = natural logarithm of 2 divided by the slope. The determination of the RCB Clint (mL/min/Kg) was conducted [31], considering the matrix value of HLMs (45 mg) per gramme of liver tissue and the liver tissue value (26 g) per kilogramme of body weight, as outlined in Equation (7) [32].
C l i n t , = 0.693 × 1 t ½ ( m i n . ) × m L   i n c u b a t i o n m g   p r o t e i n × m g   H L M s   p r o t e i n s g   o f   l i v e r   w e i g h t × g   l i v e r K g   b . w .

2.9. In Silico Assessment of the Greeness of the Established LC–MS/MS Analytical Method

In contemporary discourse, the concept of green analytical chemistry (GAC) has emerged as a significant scientific principle. Its primary objective is to mitigate or reduce the presence of hazardous chemicals, decrease waste generation, and minimize energy consumption across several analytical processes [33,34]. In order to address this particular aspect, several metric approaches such as the Red-Green-Blue (RGB), Analytical Eco-Scale (AES), Analytical Greenness Metric Approach (AGREE), National Environmental Methods Index (NEMI), and Green Analytical Procedures Index (GAPI) have been utilised to evaluate the environmental sustainability of various analytical determinations [33]. Among the aforementioned methods, AES, GAPI, NEMI, and RGB depend on a limited set of GAC values. Specifically, these methods employed the “AGREE” methodology for predicting greenness, which involved evaluating the greenness based on the scores of 12 GAC parameters.

2.10. In Silico Assessment of the RCB Metabolic Lability

The significance of conducting in vitro tests was assessed by employing an in silico P450 programme (StarDrop’s package) from Optibrium Ltd. (Cambridge, MA, USA) to evaluate the metabolic stability of RCB. The findings from the computational software demonstrated the metabolic instability of RCB, which was quantified as composite site lability (CSL). This parameter was considered a critical factor in assessing the metabolic stability of RCB prior to the development of an analytical method (LC–MS/MS) for quantifying RCB levels following in vitro metabolic incubation. The RCB SMILES format (CN(C)C(=O)c1cc2cnc(nc2n1C3CCCC3)Nc4ccc(cn4)N5CCNCC5) was inputted into the P450 in silico model for the purpose of calculating CSL. In order to evaluate the metabolic lability of RCB, the labilities of all atoms were collected to calculate the CSL. The overall metabolic lability of RCB was determined using the following Equation (8) [35,36,37]:
C S L = k t o t a l ( k t o t a l + k w )
where kw is the water formation rate constant.

3. Results and Discussions

3.1. Development of the Current LC–MS/MS Methodology

Various liquid chromatography (LC) columns were utilised, including hydrophilic interaction liquid chromatography (HILIC), which employs a multitude of stationary phases. Both RCB and PNB were found to be unresolved or not retained in the conventional stationary phase. However, the most favourable results were achieved while employing the C18 reversed phase column. Although the utilisation of a C8 reversed phase column in the LC–MS/MS analytical methodology for RCB and PNB was effective in retaining the target analytes, it was observed that the analytes exhibited inadequate separation of base peaks, peak tailing, and prolonged elution time. The utilisation of an Eclipse plus-C18 column (with a particle size of 1.8 μm, an inner diameter of 2.1 mm, and a length of 50 mm) resulted in favourable outcomes characterised by excellent peak shape and precise retention time. In the established LC–MS/MS analytical methods, the retention and resolution of RCB and PNB (IS) were achieved by employing an isocratic binary mobile phase system at a low flow rate of 0.2 mL/min and a short run period of 2.5 min. The calibration curve for RCB exhibited a linear relationship within the specified range of 1–3000 ng/mL. Table 3 presents refined data pertaining to a range of trials that aimed to optimise key analytical aspects, including separation, extraction, and detection parameters for the target analytes RCB and PNB.
To enhance the LC–MS/MS system sensitivity, the utilisation of the MRM mass analyzer as a detection mode was utilized for the determination and mass analysis of RCB and PNB. This was performed to eliminate any interference from the matrix constituents of HLMs, as depicted in Figure 2. Fragmentation of PNB (m/z: 533) generates three fragment ions at m/z 433, m/z 260, m/z 101 (Figure 2A). The IntelliStart® software (Version 4.1, SCN 805) selected the two most intense fragment ions at (m/z 260, m/z 101) (Figure 2B). In case of RCB, fragmentation of RCB (m/z: 435) generates three fragment ions at m/z 322, m/z 294, and m/z 252 (Figure 2C). The IntelliStart® software selected the two most intense fragment ions at (m/z 322 and m/z 252) as exhibited in Figure 2D.
PNB was designated as the internal standard (IS) during the development of the current LC–MS/MS method for the estimation of RCB, based on three specific factors. Initially, the protein precipitation extraction method was employed to successfully extract both target analytes, RCB and PNB, from the HMLS matrix. The extraction process yielded a high recovery rate of 100.83 ± 3.13% for RCB and 99.17 ± 1.93% for PNB. Additionally, the separation of RCB (retention time of 0.75 min) and PNB (retention time of 1.48 min) occurs within a short running time of 2.5 min, demonstrating the efficacy of the analytical approach employed (LC–MS/MS) in providing speedy results. Furthermore, it is not recommended to concurrently prescribe both RCB and PNB medications to a single patient. The LC–MS/MS analytical approach that has been developed can be utilised for conducting pharmacokinetic research and monitoring therapeutic medicines in the context of RCB. No carry-over was observed in the multiple reaction monitoring (MRM) chromatograms of the human liver microsomes (HLMs) positive and negative controls for RCB, as shown in Figure 3A,B. Figure 3C displays the overlaid MRM chromatograms of RCB CLs and PNB at 1–3000 ng/mL and 1000 ng/mL, correspondingly.

3.2. Validation Features of the LC–MS/MS Method

3.2.1. Specificity

The new LC–MS/MS technology demonstrated its specificity through the clear separation of chromatographic peaks of RCB and PNB, as depicted in Figure 3. Moreover, it was shown that the matrix components of the HLMs did not cause any interference with the target analytes, namely RCB and PNB. The presence of residual carry-over influence from RCB was not observed in either the negative or positive control MRM chromatograms.

3.2.2. Linearity and Sensitivity of the Current LC–MS/MS Method

The statistical analysis of the established LC–MS/MS analytical approach demonstrated its linearity over the range of 1–3000 ng/mL. This was determined through regression analysis, yielding the equation y = 0.699x + 2.091, and a coefficient of variation (R2) of 0.9986. The analysis involved injecting seven RCB CLs into the HMLS matrix and subsequently treating them as unknowns for back manipulation. The utilisation of weighting (1/x) for the produced calibration curve was implemented in response to the extensive range of linearity. The relative standard deviation (RSD) of the six replicates, including CLs and QCs, was less than 3.28% as shown in Table 4. The LOD and LOQ were computed to be 0.33 ng/mL and 0.98 ng/mL, respectively, as shown in Figure 4.

3.2.3. Accuracy and Precision of the Current LC–MS/MS Analytical Method

The accuracy and precision of the LC–MS/MS analytical method were assessed by performing 12 injections (including 4 QCs samples) on a single day, and 6 injections (including 4 QCs samples) on each of the subsequent 3 days. The data that were disclosed were found to fall within the acceptable range, as outlined in the FDA guidelines [29,38]. The inter-day and intra-day precision and accuracy of the LC–MS/MS analytical methods currently employed exhibited values ranging from −0.31% to 3.16% and −5.67% to 5.46%, respectively, as indicated in Table 5.

3.2.4. The Utilisation of HMLS Matrix Does Not Have Any Influence on the Recovery and Extraction of RCB in the LC–MS/MS Analytical Method Currently Employed

The effectiveness of the chosen extraction procedure, which involved protein precipitation using ACN, was validated by carrying out six repetitions (including four quality controls) in a matrix of human liver microsomes (HLMs). These findings were then compared with QCs prepared in the mobile phase. The data obtained from the experiment verified a significant extraction recovery ratio for RCB (100.83 ± 3.13% and RSD < 2.86%) as well as for PNB (99.17 ± 1.93%, and RSD < 3.67%). The analysis of data from two sets of injected samples containing HMLS matrix indicates that the incubation matrix does not have any significant effect on the generation of parent ions of the target analytes, namely RCB or PNB. The HMLS matrix containing RCB and PNB demonstrated a matrix effect (ME) of 98.97 ± 4.44% and 99.63 ± 2.98%, respectively. The normalised ME of the IS was determined to be 0.99, which falls within the acceptable range specified in the standards provided by the Food and Drug Administration (FDA). Based on the aforementioned findings, it can be concluded that the HMLS matrix does not exert any discernible influence on the ionisation of PNB or RCB.

3.2.5. The Stability of RCB Was Observed in Both the Incubation Matrix (HLMs) and the Stock Solution (DMSO)

The stability of RCB in the incubation matrix, specifically HLMs, and the resulting stock solution, which was prepared using dimethyl sulfoxide (DMSO), was determined to be acceptable when held at a temperature of −80 °C for a period of 28 days. The RSD percentages of all samples from the RCB were determined to be below 3.92% for various storage characteristics, as presented in Table 6. The evaluation of various parameters did not reveal any substantial decline in the concentration of RCB, suggesting that RCB has favourable stability.

3.3. Assessment of the Greenness of the Established LC–MS/MS Methodology through the Utilization of AGREE Program

The assessment of the sustainability of the suggested LC–MS/MS technique was carried out with the computational program AGREE (v.0.5 2020), which encompasses all twelve components of Green Analytical Chemistry (GAC) [33]. The software allocates weights from 0.0 to 1.0 to the various variables of the GAC system. The results are graphically depicted in a circular figure, which incorporates a wide range of colours spanning from red to dark green, representing 12 separate characteristics. Figure 5 illustrates the scaling curve of the LC–MS/MS technology in terms of its eco-friendliness. The scores corresponding to all 12 attributes were displayed in Table 7. The calculated score of 0.77 was derived from the many characteristics of the present methodology, serving as an indicator of the environmental sustainability of the LC–MS/MS analytical technique (with a higher number approaching 1.0 denoting a more environmentally friendly method). The LC–MS/MS method demonstrates a high level of eco-friendliness when eco-scale values fall within the range of 0.75 to 1.00.

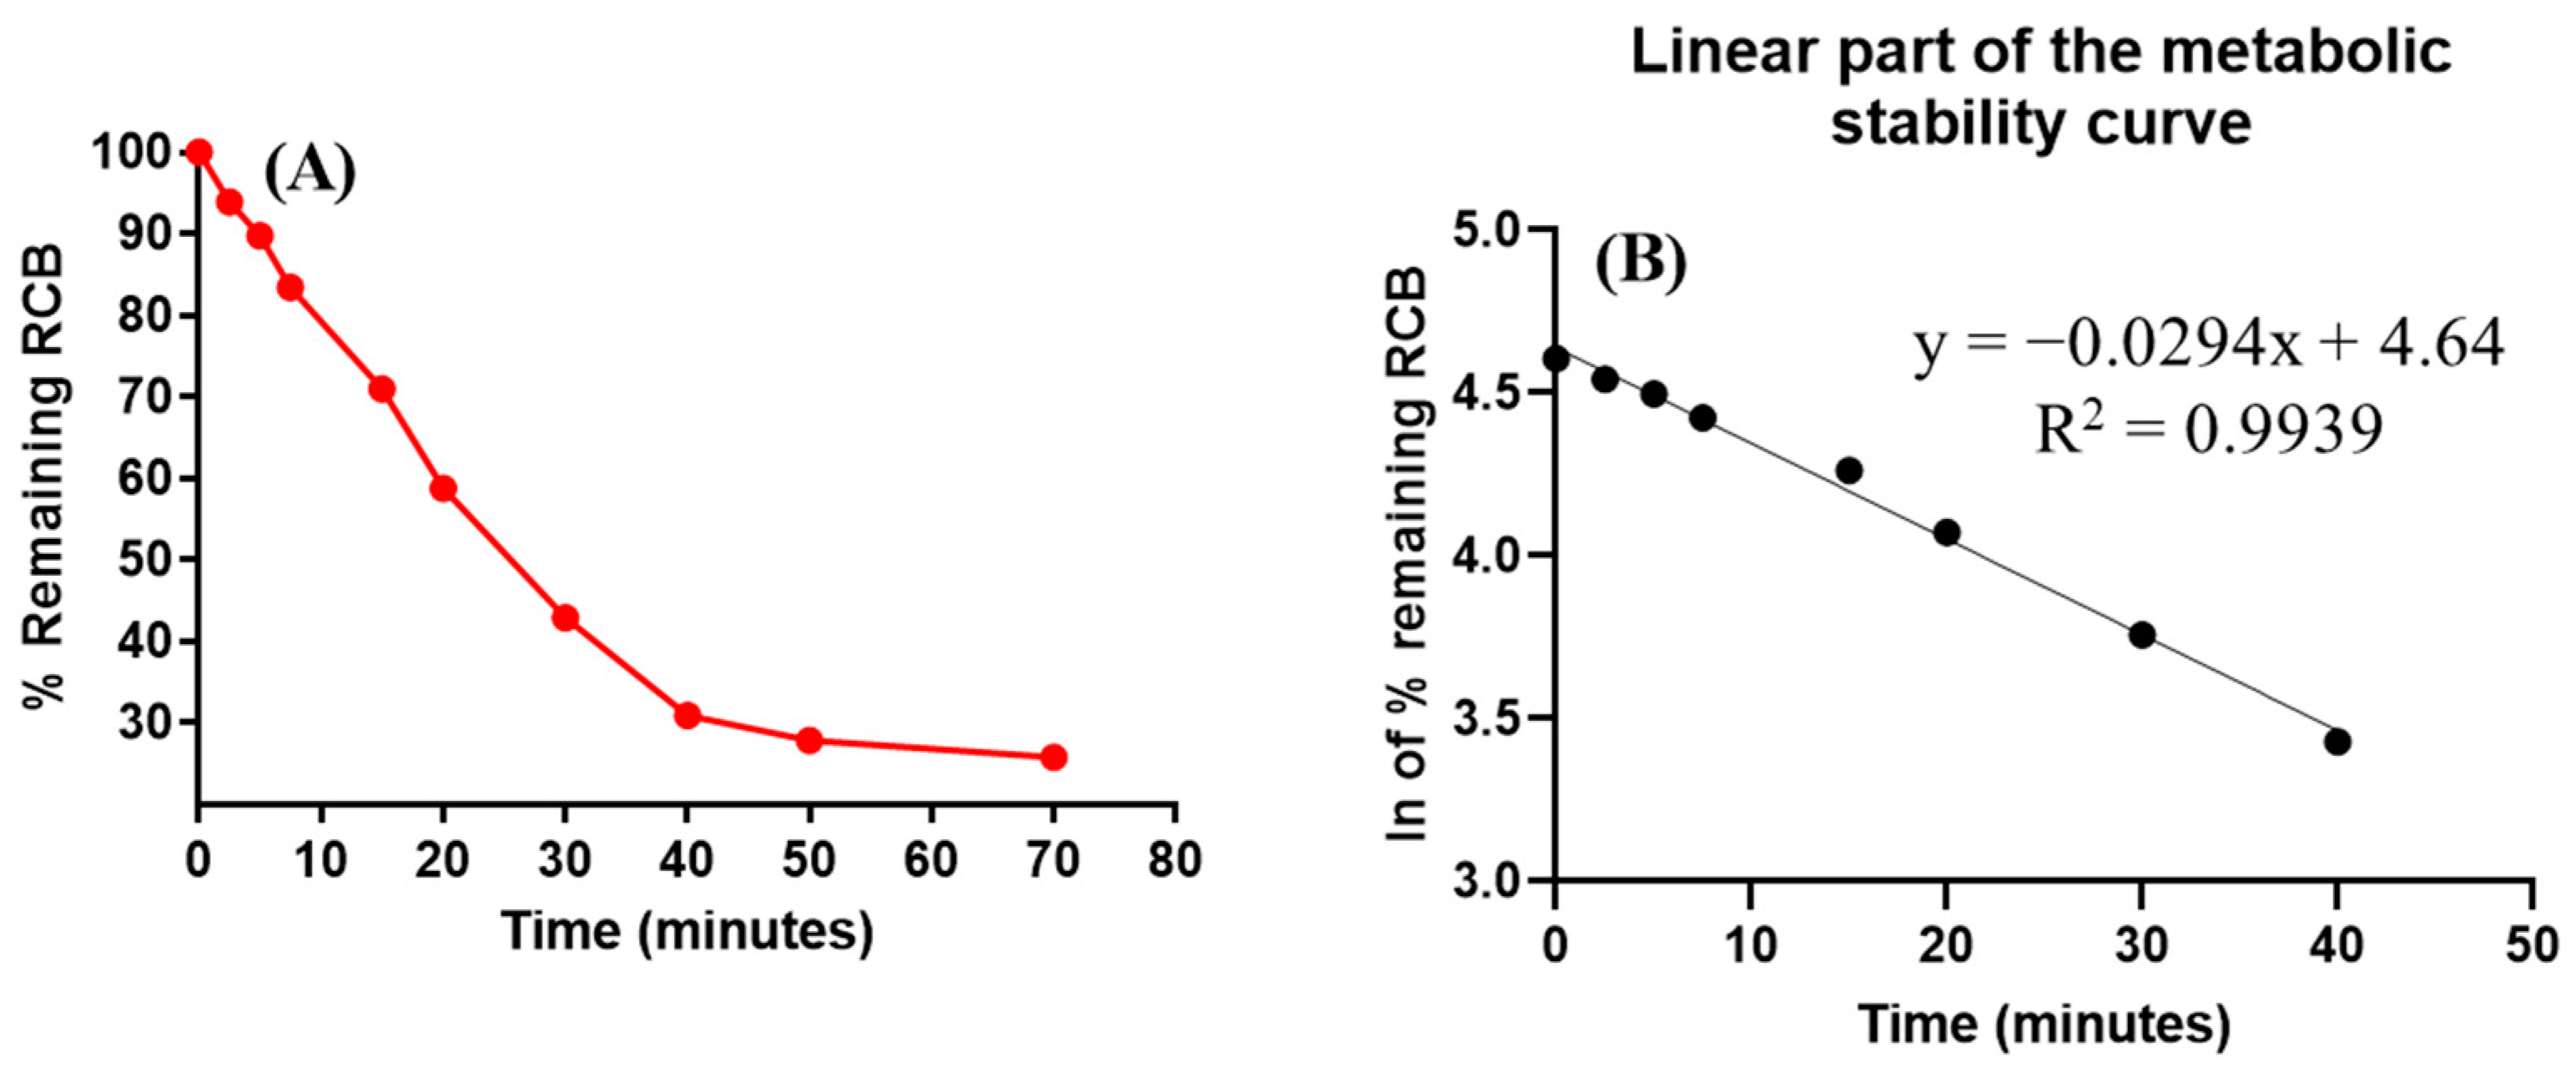
3.4. In Vitro Metabolic Stability Estimation of RCB

No decrease in the concentration of RCB was found during the incubation of negative control HLMs. In order to assess the metabolic stability of RCB, an in vitro incubation was conducted using HLMs. An in vitro metabolic experiment employing HLMs utilised a concentration of 1 µM/mL of RBC. The selection of this particular concentration was made in order to maintain a level below the Michaelis–Menten constant. This choice was made to ensure a linear and consistent correlation between the rate of RBC metabolism and the duration of the metabolic incubation period. To mitigate any potential nonspecific protein binding, a concentration of 1 mg/mL of HLMs protein was utilised. The establishment of the first metabolic stability curve of RCB involved the graphing of defined time intervals ranging from 0 to 70 min on the x-axis, and the corresponding percentage of remaining RCB on the y-axis (Figure 6A).
The newly included curve in Figure 6B illustrates the natural logarithm of the remaining percentage of RCB over the incubation time points within the specified time range of 0–40 min. The metabolic rate of RCB was calculated to be 0.0294, based on the linear regression equation y = −0.0294x + 4.64, with an R-squared value of 0.9939, as presented in Table 8. The calculation of the in vitro half-life (t1/2) can be determined by employing the formula ln2/slope. By utilising the aforementioned formula, the calculated half-life (t1/2) in an in vitro setting was determined to be 23.58 min. The calculated clearance of RCB Clint was found to be 34.39 mL/min/kg. According to the classification method devised by McNaney et al. [31], RCB has been categorised as a medication with moderate clearance. There has been a suggestion that RCB administration to patients has no danger of dosage accumulation. The investigation of in vivo pharmacokinetics of RCB may involve the usage of different techniques, such as Cloe PK software and simulation [39].

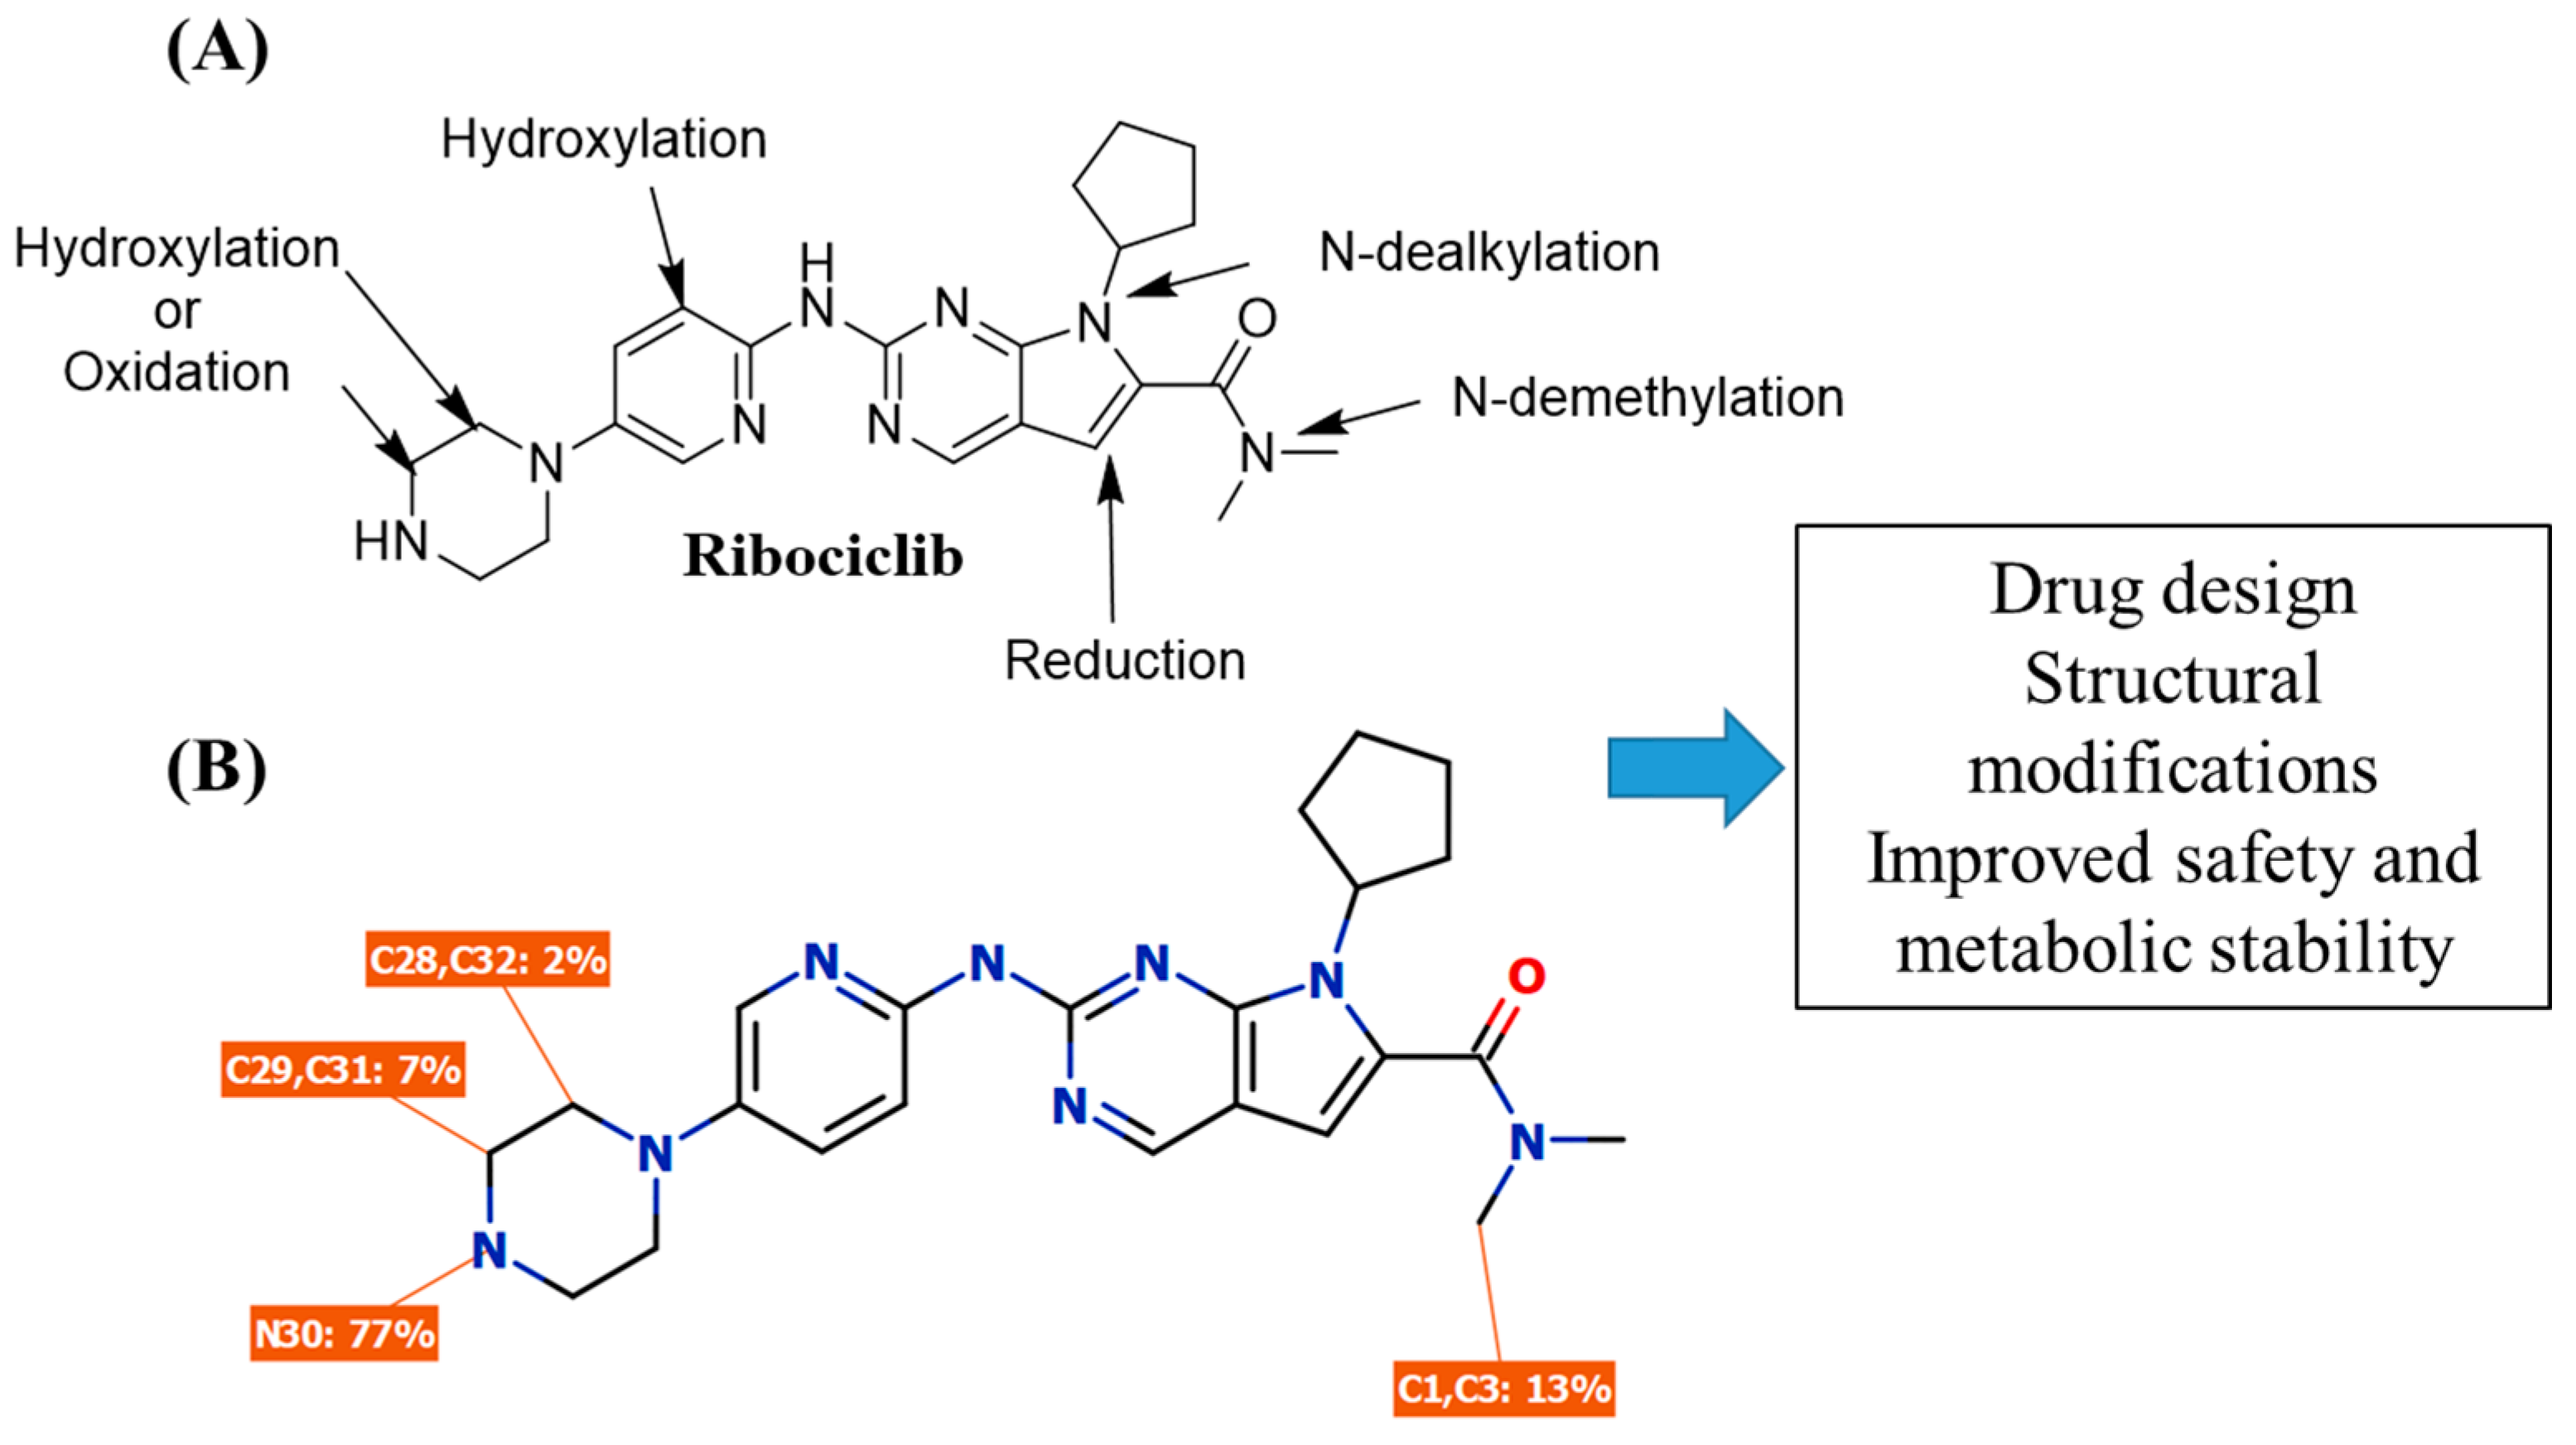
3.5. In Silico Estimation of RBC Metabolic Lability

The metabolic profile of RCB contributes to the expectation of metabolic instability in metabolically active regions within its chemical structure, which are sensitive to enzymatic metabolism by CYP3A4, as seen by the pie chart [40,41,42]. The composite site lability (CSL) score (Figure 7) indicated that RCB exhibited considerable metabolic lability. Therefore, the present study employed the LC–MS/MS methodology to assess the in vitro metabolic stability of RCB following incubation with HLMs. The observed high metabolic susceptibility of RCB can be attributed to the presence of specific functional groups, including the N-methyl piperazine group (N30, C28, C29, C31, and C32) and N-dimethyl group (C1 and C3). Additionally, the cyclopentyl ring (C17 and C18) and N-dimethyl group (N2) exhibit a moderate level of metabolic susceptibility. The metabolic instability of RCB was attributed to the presence of N-methyl piperazine and N-dimethyl groups, as determined by CSL analysis. This finding was further supported by the outcomes obtained from in silico P450 software (Figure 7; CSL: 0.9964), which indicated a high vulnerability to metabolism. These in silico findings agreed with the outcomes of the HLMs incubation study as described in Section 3.3.
The metabolism of RBC was previously studied by our research group [43,44]. Nine phase I metabolites were characterized, indicating that the piperazine ring and N-dimethyl group is responsible for the metabolic instability of RCB (Figure 8).

4. Conclusions

An analytical method using LC–MS/MS was developed and validated to quantify RCB in the HMLS matrix that was employed for RCB metabolic stability assessment. The established LC–MS/MS approach demonstrated excellent sensitivity, selectivity, and a high recovery ratio of PNB and RCB from the HMLS matrix utilising protein precipitation (ACN) as the extraction method. Based on an evaluation of environmental impact using the AGREE software (v.0.5 2020), it has been determined that the LC–MS/MS method exhibits eco-friendly characteristics and may be deemed suitable for the regular analysis of SVB without any adverse effects on the environment. The in silico P450 software (version 6.6) results were consistent with the in vitro metabolic incubations findings that proposed a moderate clearance rate (34.39 mL/min/kg) and intermediate in vitro half-life (23.58 min). Hence, it is postulated that RCB administration to patients will not result in dosage accumulation. The results obtained from in vitro incubation experiments and in silico software analysis of RCB demonstrate the significance of utilising in silico software for conducting metabolic lability (CSL) assessments, as it offers a more efficient and resource-saving approach. Drug discovery studies can be conducted taking into account this concept, allowing the development of new drugs with enhanced safety profile and good metabolic stability.

Author Contributions

M.W.A., A.S.A. and A.A.K. establish the experimental steps. M.W.A. and A.S.A. wrote the first draft of the manuscript and performed the laboratory practical work. A.S.A. and A.A.K. helped designing the methodology and software applications. All experimental results were made in-house and no paper mill was used. All authors have read and agreed to the published version of the manuscript.

Funding

The authors extend their appreciation to the Deputyship for Research & Innovation, Ministry of Education in Saudi Arabia for funding this research work through the project No. (IFKSUOR3-252-3).

Institutional Review Board Statement

The use of HLMs that were procured commercially from Sigma company exempts it from the necessity of ethical approval.

Data Availability Statement

All data are available within the manuscript.

Acknowledgments

The authors extend their appreciation to the Deputyship for Research and Innovation, “Ministry of Education” in Saudi Arabia for funding this research (IFKSUOR3-252-3).

Conflicts of Interest

The authors declare no conflict of interest.

References

  1. American Cancer Society. Available online: http://www.cancer.org/acs/groups/cid/documents/webcontent/003090-pdf.pdf (accessed on 23 February 2023).
  2. McGuire, A.; Brown, J.A.; Malone, C.; McLaughlin, R.; Kerin, M.J. Effects of age on the detection and management of breast cancer. Cancers 2015, 7, 908–929. [Google Scholar] [CrossRef] [PubMed]
  3. National Campaign for Breast Cancer Awareness. Available online: http://www.moh.gov.sa/en/HealthAwareness/Campaigns/Breastcancer/Pages/stat.aspx (accessed on 23 February 2023).
  4. Takeuchi, K.; Ito, F. Receptor tyrosine kinases and targeted cancer therapeutics. Biol. Pharm. Bull. 2011, 34, 1774–1780. [Google Scholar] [CrossRef] [PubMed]
  5. Traxler, P. Tyrosine kinases as targets in cancer therapy–successes and failures. Expert. Opin. Ther. Targets 2003, 7, 215–234. [Google Scholar] [CrossRef] [PubMed]
  6. Kwapisz, D. Cyclin-dependent kinase 4/6 inhibitors in breast cancer: Palbociclib, ribociclib, and abemaciclib. Breast Cancer Res. Treat. 2017, 166, 41–54. [Google Scholar] [CrossRef]
  7. Bilgin, B.; Sendur, M.A.N.; Şener Dede, D.; Akıncı, M.B.; Yalçın, B. A current and comprehensive review of cyclin-dependent kinase inhibitors for the treatment of metastatic breast cancer. Curr. Med. Res. Opin. 2017, 33, 1559–1569. [Google Scholar] [CrossRef] [PubMed]
  8. Shohdy, K.S.; Lasheen, S.; Kassem, L.; Abdel-Rahman, O. Gastrointestinal adverse effects of cyclin-dependent kinase 4 and 6 inhibitors in breast cancer patients: A systematic review and meta-analysis. Ther. Adv. Drug Saf. 2017, 8, 337–347. [Google Scholar] [CrossRef] [PubMed]
  9. Sahu, A.K.; Jadav, T.; Rajput, N.; Sharma, M.K.; Sengupta, P. Bioanalysis by LC-MS/MS and preclinical pharmacokinetic interaction study of ribociclib and oleanolic acid. Bioanalysis 2022, 14, 1051–1065. [Google Scholar] [CrossRef]
  10. Turković, L.; Bočkor, L.; Ekpenyong, O.; Silovski, T.; Lovrić, M.; Crnković, S.; Nigović, B.; Sertić, M. Development and Validation of a Novel LC-MS/MS Method for the Simultaneous Determination of Abemaciclib, Palbociclib, Ribociclib, Anastrozole, Letrozole, and Fulvestrant in Plasma Samples: A Prerequisite for Personalized Breast Cancer Treatment. Pharmaceuticals 2022, 15, 614. [Google Scholar] [CrossRef] [PubMed]
  11. Kala, A.; Patel, Y.T.; Davis, A.; Stewart, C.F. Development and validation of LC-MS/MS methods for the measurement of ribociclib, a CDK4/6 inhibitor, in mouse plasma and Ringer’s solution and its application to a cerebral microdialysis study. J. Chromatogr. B Anal. Technol. Biomed. Life Sci. 2017, 1057, 110–117. [Google Scholar] [CrossRef]
  12. Habler, K.; Kalla, A.S.; Rychlik, M.; Vogeser, M.; Teupser, D. Therapeutic drug monitoring in breast cancer therapy—LC-MS/MS method for quantification of the CDK4/6 inhibitors abemaciclib, palbociclib, ribociclib, and major metabolites abemaciclib M20 and M2 in human serum. J. Pharm. Biomed. Anal. 2023, 225, 115211. [Google Scholar] [CrossRef]
  13. Posocco, B.; Buzzo, M.; Poetto, A.S.; Orleni, M.; Gagno, S.; Zanchetta, M.; Iacuzzi, V.; Guardascione, M.; Puglisi, F.; Basile, D.; et al. Simultaneous quantification of palbociclib, ribociclib and letrozole in human plasma by a new LC-MS/MS method for clinical application. PLoS ONE 2020, 15, e0228822. [Google Scholar] [CrossRef]
  14. Burke, S.M.; Kamal, M.; Goey, A.K.L. Development and Validation of a Quantitative LC-MS/MS Method for CDK4/6 Inhibitors Palbociclib, Ribociclib, Abemaciclib, and Abemaciclib-M2 in Human Plasma. Ther. Drug Monit. 2023, 45, 327–436. [Google Scholar] [CrossRef]
  15. Bao, X.; Wu, J.; Sanai, N.; Li, J. Determination of total and unbound ribociclib in human plasma and brain tumor tissues using liquid chromatography coupled with tandem mass spectrometry. J. Pharm. Biomed. Anal. 2019, 166, 197–204. [Google Scholar] [CrossRef]
  16. Martínez-Chávez, A.; Rosing, H.; Hillebrand, M.; Tibben, M.; Schinkel, A.H.; Beijnen, J.H. Development and validation of a bioanalytical method for the quantification of the CDK4/6 inhibitors abemaciclib, palbociclib, and ribociclib in human and mouse matrices using liquid chromatography-tandem mass spectrometry. Anal. Bioanal. Chem. 2019, 411, 5331–5345. [Google Scholar] [CrossRef] [PubMed]
  17. Tyzack, J.D.; Kirchmair, J. Computational methods and tools to predict cytochrome P450 metabolism for drug discovery. Chem. Biol. Drug Des. 2019, 93, 377–386. [Google Scholar] [CrossRef] [PubMed]
  18. Marothu Vamsi, K.; Kantamaneni, P.; Gorrepati, M. In vitro Metabolic Stability of Drugs and Applications of LC-MS in Metabolite Profiling. In Drug Metabolism; Katherine, D., Ed.; IntechOpen: Rijeka, Croatia, 2021; Chapter 5. [Google Scholar]
  19. Houston, J.B. Utility of in vitro drug metabolism data in predicting in vivo metabolic clearance. Biochem. Pharmacol. 1994, 47, 1469–1479. [Google Scholar] [CrossRef] [PubMed]
  20. Obach, R.S.; Baxter, J.G.; Liston, T.E.; Silber, B.M.; Jones, B.C.; MacIntyre, F.; Rance, D.J.; Wastall, P. The prediction of human pharmacokinetic parameters from preclinical and in vitro metabolism data. J. Pharmacol. Exp. Ther. 1997, 283, 46–58. [Google Scholar]
  21. Amer, S.M.; Kadi, A.A.; Darwish, H.W.; Attwa, M.W. LC–MS/MS method for the quantification of masitinib in RLMs matrix and rat urine: Application to metabolic stability and excretion rate. Chem. Cent. J. 2017, 11, 136. [Google Scholar] [CrossRef]
  22. Attwa, M.W.; Abdelhameed, A.S.; Alsibaee, A.M.; Kadi, A.A. A Rapid and Sensitive UPLC-MS/MS Method for Quantifying Capmatinib in Human Liver Microsomes: Evaluation of Metabolic Stability by In Silico and In Vitro Analysis. Separations 2023, 10, 247. [Google Scholar] [CrossRef]
  23. Attwa, M.W.; AlRabiah, H.; Alsibaee, A.M.; Abdelhameed, A.S.; Kadi, A.A. An UPLC–ESI–MS/MS Bioanalytical Methodology for the Quantification of Gilteritinib in Human Liver Microsomes: Application to In Vitro and In Silico Metabolic Stability Estimation. Separations 2023, 10, 278. [Google Scholar] [CrossRef]
  24. Attwa, M.W.; AlRabiah, H.; Kadi, A.A. Development and Validation of a Rapid LC-MS/MS Method for Quantifying Alvocidib: In Silico and In Vitro Metabolic Stability Estimation in Human Liver Microsomes. Molecules 2023, 28, 2368. [Google Scholar] [CrossRef] [PubMed]
  25. Attwa, M.W.; Mostafa, G.A.E.; AlRabiah, H.; Kadi, A.A. An LC–MS/MS Analytical Method for Quantifying Tepotinib in Human Liver Microsomes: Application to In Vitro and In Silico Metabolic Stability Estimation. Separations 2023, 10, 330. [Google Scholar] [CrossRef]
  26. Busby, W.F., Jr.; Ackermann, J.M.; Crespi, C.L. Effect of methanol, ethanol, dimethyl sulfoxide, and acetonitrile on in vitro activities of cDNA-expressed human cytochromes P-450. Drug Metab. Dispos. 1999, 27, 246–249. [Google Scholar]
  27. Störmer, E.; Roots, I.; Brockmöller, J. Benzydamine N-oxidation as an index reaction reflecting FMO activity in human liver microsomes and impact of FMO3 polymorphisms on enzyme activity. Br. J. Clin. Pharmacol. 2000, 50, 553–561. [Google Scholar] [CrossRef] [PubMed]
  28. Fouin-Fortunet, H.; Tinel, M.; Descatoire, V.; Letteron, P.; Larrey, D.; Geneve, J.; Pessayre, D. Inactivation of cytochrome P-450 by the drug methoxsalen. J. Pharmacol. Exp. Ther. 1986, 236, 237–247. [Google Scholar] [PubMed]
  29. U.S. Department of Health and Human Services; Food and Drug Administration; Center for Drug Evaluation and Research (CDER); Center for Veterinary Medicine (CVM). Bioanalytical Method Validation. Guidance for Industry; U.S. Department of Health and Human Services: Washington, DC, USA, 2018.
  30. Smith, G. European Medicines Agency guideline on bioanalytical method validation: What more is there to say? Bioanalysis 2012, 4, 865–868. [Google Scholar] [CrossRef] [PubMed]
  31. McNaney, C.A.; Drexler, D.M.; Hnatyshyn, S.Y.; Zvyaga, T.A.; Knipe, J.O.; Belcastro, J.V.; Sanders, M. An automated liquid chromatography-mass spectrometry process to determine metabolic stability half-life and intrinsic clearance of drug candidates by substrate depletion. Assay. Drug Dev. Technol. 2008, 6, 121–129. [Google Scholar] [CrossRef] [PubMed]
  32. Słoczyńska, K.; Gunia-Krzyżak, A.; Koczurkiewicz, P.; Wójcik-Pszczoła, K.; Żelaszczyk, D.; Popiół, J.; Pękala, E. Metabolic stability and its role in the discovery of new chemical entities. Acta Pharm. 2019, 69, 345–361. [Google Scholar] [CrossRef] [PubMed]
  33. Pena-Pereira, F.; Wojnowski, W.; Tobiszewski, M. AGREE—Analytical GREEnness Metric Approach and Software. Anal. Chem. 2020, 92, 10076–10082. [Google Scholar] [CrossRef]
  34. Duan, X.; Liu, X.; Dong, Y.; Yang, J.; Zhang, J.; He, S.; Yang, F.; Wang, Z.; Dong, Y. A Green HPLC Method for Determination of Nine Sulfonamides in Milk and Beef, and Its Greenness Assessment with Analytical Eco-Scale and Greenness Profile. J. AOAC Int. 2020, 103, 1181–1189. [Google Scholar] [CrossRef]
  35. Alrabiah, H.; Kadi, A.A.; Attwa, M.W.; Abdelhameed, A.S. A simple liquid chromatography-tandem mass spectrometry method to accurately determine the novel third-generation EGFR-TKI naquotinib with its applicability to metabolic stability assessment. RSC Adv. 2019, 9, 4862–4869. [Google Scholar] [CrossRef] [PubMed]
  36. Kadi, A.A.; Darwish, H.W.; Abuelizz, H.A.; Alsubi, T.A.; Attwa, M.W. Identification of reactive intermediate formation and bioactivation pathways in Abemaciclib metabolism by LC-MS/MS: In vitro metabolic investigation. R. Soc. Open Sci. 2019, 6, 181714. [Google Scholar] [CrossRef] [PubMed]
  37. Attwa, M.W.; Kadi, A.A.; Abdelhameed, A.S.; Alhazmi, H.A. Metabolic stability assessment of new parp inhibitor talazoparib using validated lc–ms/ms methodology: In silico metabolic vulnerability and toxicity studies. Drug Des. Devel Ther. 2020, 14, 783–793. [Google Scholar] [CrossRef] [PubMed]
  38. González, O.; Alonso, R.M. Chapter 6—Validation of bioanalytical chromatographic methods for the quantification of drugs in biological fluids. In Handbook of Analytical Separations; Hempel, G., Ed.; Elsevier Science B.V.: Amsterdam, The Netherlands, 2020; Volume 7, pp. 115–134. [Google Scholar]
  39. Leahy, D.E. Integrating invitro ADMET data through generic physiologically based pharmacokinetic models. Expert. Opin. Drug Metab. Toxicol. 2006, 2, 619–628. [Google Scholar] [CrossRef]
  40. Tan, L.; Kirchmair, J. Software for metabolism prediction. In Drug Metabolism Prediction; Wiley-VCH Verlag GmbH & Co. KGaA: Weinheim, Germany, 2014; pp. 27–52. [Google Scholar]
  41. Hunt, P.A.; Segall, M.D.; Tyzack, J.D. WhichP450: A multi-class categorical model to predict the major metabolising CYP450 isoform for a compound. J. Comput. Aided Mol. Des. 2018, 32, 537–546. [Google Scholar] [CrossRef] [PubMed]
  42. G Shin, Y.; Le, H.; Khojasteh, C.; ECA Hop, C. Comparison of metabolic soft spot predictions of CYP3A4, CYP2C9 and CYP2D6 substrates using MetaSite and StarDrop. Comb. Chem. High. Throughput Screen. 2011, 14, 811–823. [Google Scholar] [CrossRef] [PubMed]
  43. Alsubi, T.A.; Attwa, M.W.; Darwish, H.W.; Abuelizz, H.A.; Kadi, A.A. Piperazine ring toxicity in three novel anti-breast cancer drugs: An in silico and in vitro metabolic bioactivation approach using olaparib as a case study. Naunyn-Schmiedeberg’s Arch. Pharmacol. 2023, 396, 1435–1450. [Google Scholar] [CrossRef]
  44. Alsubi, T.A.; Attwa, M.W.; Bakheit, A.H.; Darwish, H.W.; Abuelizz, H.A.; Kadi, A.A. In silico and in vitro metabolism of ribociclib: A mass spectrometric approach to bioactivation pathway elucidation and metabolite profiling. RSC Adv. 2020, 10, 22668–22683. [Google Scholar] [CrossRef] [PubMed]
Figure 1. Chemical structure of ribociclib and ponatinib (internal standard; IS).
Separations 10 00472 g001
Figure 2. The provided figures display the MRM mass spectra of ribociclib (RCB; [M + H]+) (A), product ion mass spectrum of RCB (m/z 435) (B), MRM mass spectrum of ponatinib (PNB; [M + H]+) (C), and product ion mass spectrum of PNB (m/z 533) (D). The anticipated patterns of dissociation are posited.
Separations 10 00472 g002
Figure 3. (A) The HMLS matrix did not show any interference at the retention time of ribociclib (RCB) and ponatinib (PNB). (B) The MRM chromatogram of the positive control consisted of Blank HLMs plus PNB. (C) The overlaid MRM chromatograms of the RCB calibration levels (1, 15, 50, 200, 500, 1500, and 3000 ng/mL) and the three quality controls (3, 900, and 2400 ng/mL) revealed the RCB peaks at 0.75 min and the PNB peak at 1.48 min with a concentration of 1000 ng/mL.
Separations 10 00472 g003
Figure 4. The LC–MS/MS approach demonstrates its sensitivity via the detection of the RCB chromatographic peak at a concentration of 1 ng/mL (A), which is the limit of quantification (LOQ). Additionally, the PNB chromatographic peak is observed at a concentration of 1000 ng/mL (B).
Separations 10 00472 g004
Figure 5. The utilisation of AGREE software (v.0.5 2020) allowed for the demonstration of the eco-friendly scale profile of the LC–MS/MS approach. The outcomes are visually exhibited in the form of a circular diagram, showcasing a varied spectrum of colours alternating from red (indicating the absence of greenness methodology) to dark green (marking the highest level of greenness). These colours correspond to 12 distinct features, as illustrated in the accompanying image.
Separations 10 00472 g005
Figure 6. (A) The ribociclib (RCB) metabolic stability curve in HLMs exhibited a linearity in the range from 0–40 min; (B) Logarithm (ln) calibration curve generating the linear regression equation (y = −0.0294x + 4.64).
Separations 10 00472 g006
Figure 7. The CSL of RCB was determined to be 0.9964, indicating a notable degree of metabolic lability. The assessment of outcomes was conducted with the in silico P450 model software, specifically the package provided by StarDrop (version 6.6).
Separations 10 00472 g007
Figure 8. Metabolic pathways for RCB (A) and in silico pathways for RCB (B) revealing the major pathways for RCB metabolism involving piperazine ring and N-dimethyl group.
Separations 10 00472 g008
Table 1. Analytical features of LC–MS/MS system.
Acquity UPLC (H10UPH)Acquity TQD MS (QBB1203)
Isocratic mobile phase0.1% HCOOH in H2O (40%; pH: 3.2)ESINitrogen (drying gas; 350 °C) at 100 L/H flow rate
ACN (60%)Positive ESI
Injection volume: 5.0 μLCapillary voltage: 4 KV
Flow rate: 0.2 mL/min.The RF lens voltage: 0.1 (V)
Eclipse plus-C18 column50.0 mm longThe extractor voltage: 3.0 (V)
1.8 μm particle sizeCone gas: 100 L/H flow rate
2.1 mm i.d.ModeMRM
T: 22.0 ± 2.0 °CCollision cellArgon gas (collision gas) at 0.14 mL/min flow rate
Table 2. MRM features of the target analytes (RCB and PNB).
TimeRetention TimeMRM Transitions
Mass spectra segment0.0 to 1.25 minRCB (0.75 min)435.22 → 322.13 (CE a: 32 and CV b: 12)
435.22 → 252.10 (CE: 50 and CV: 12)
1.25 to 2.5 minPNB (IS; 1.48 min)533.25 → 260.09 (CE: 20 and CV: 34)
533.25 → 101.01 (CE: 30 and CV: 34)
a Collision energy (eV), b Cone voltage (V).
Table 3. Data of various experiments targeted optimizing the analytical resolution of RCB and PNB peaks.
AnalytesMethanolACNSolid Phase
Extraction
Protein
Precipitation
C8 ColumnC18 Column
RCB1.15 min0.75 minLow recoveryHigh recovery0.68 min0.75 min
Tailed peaksGood peak shapeNot precisePrecise resultsTailed peakPerfect peak shape
PNB1.39 min1.48 minLow recoveryHigh recovery1.68 min1.48 min
OverlappedGood peak shapeNot precisePrecise resultsPerfect peak shapePerfect peak shape
RCB, Ribociclib; PNB, Ponatinib; ACN, Acetonitrile.
Table 4. Back-calculation of six replicates (CLs) of ribociclib (RCB).
RCB (ng/mL)MeanSDRSD (%)Accuracy (%)Recovery
10.940.010.61−5.6794.33
54.970.142.74−0.5399.47
5051.661.693.283.32103.32
200204.476.092.982.23102.23
500515.508.371.623.10103.10
15001526.397.790.511.76101.76
30003047.5530.040.991.58101.59
% Recovery 100.83 ± 3.13
Table 5. Accuracy and precision of the current LC–MS/MS analytical method.
RCB (ng/mL)Inter-Day AssayIntra-Day Assay
QCs1.03.0900.02400.01.03.0900.02400.0
Average0.943.05908.202393.461.063.05897.232435.20
SD0.010.1714.8722.480.100.1015.9850.36
% Accuracy−5.671.670.91−0.275.671.67−0.311.47
Precision (%RSD)0.615.461.640.949.193.161.782.07
Recovery (%)94.33101.67100.9199.73105.67101.6799.69101.47
Table 6. Stability parameters of RCB.
Stability Features3.02400.03.02400.03.02400.03.02400.0
MeanSDRSD (%)Accuracy (%)
Auto-sampler Stability
(24 h at 15 °C)
3.092403.160.0518.041.530.752.890.13
Freeze–Thaw Stability (three cycles at −80 °C)2.972396.130.1118.123.700.76−0.89−0.16
Short-Term Stability (4 h at room temperature)2.922385.830.0510.921.730.46−2.78−0.59
Long-Term Stability (28 d at −80 °C)3.062402.260.1222.143.920.922.110.09
Table 7. Report sheet for the LC–MS/MS technique prepared to assess the greenness of the method based on individual scores according to the Green Analytical Chemistry (GAC) guidelines. The score column background was alternating from red (indicating the absence of greenness methodology) to dark green (marking the highest level of greenness).
CriteriaScoreWeight
1. To mitigate the need for sample treatment, it is advisable to employ direct analytical techniques.0.32
2. The objectives are to achieve a low sample size and a minimal number of samples.0.752
3. Ideally, it is recommended to conduct measurements in situ, if feasible.0.66
4. Integration of analytical processes and operations saves energy and reduces the use of reagents.1.02
5. The integration of analytical procedures and activities has been found to result in energy conservation and a reduction in the consumption of reagents.0.753
6. It is advisable to refrain from employing derivatization techniques.1.02
7. It is imperative to minimize the generation of a substantial quantity of analytical waste and ensure the implementation of effective management practises for such trash.1.03
8. The preference lies with multi-analyte or multi-parameter approaches as opposed to single-analyte methods.1.02
9. Efforts should be made to minimise the utilisation of energy.0.02
10. It is advisable to prioritise the utilisation of reagents derived from renewable sources.0.52
11. The elimination or replacement of toxic reagents is crucial.1.03
12. There is a need to enhance the safety measures for operators.1.02
Table 8. Metabolic stability of ribociclib (RCB).
Time (min.)Average a (ng/mL)X bLN XLinearity Features
0.0572.35100.004.61Regression equation:
y = −0.0294x + 4.64
2.5537.2693.874.54
5.0513.8689.784.50R2 = 0.9939
7.5477.6383.454.42
15.0406.2570.984.26Slope: −0.0294
20.0336.2658.754.07
30.0245.3742.873.76t1/2: 23.58 min and
40.0176.6830.873.43Clint: 34.39 mL/min/kg
50.0159.3427.843.33
70.0147.3825.753.25
a Mean of three repeats, b X: Mean of the % remaining of RCB in three repeats.
Disclaimer/Publisher’s Note: The statements, opinions and data contained in all publications are solely those of the individual author(s) and contributor(s) and not of MDPI and/or the editor(s). MDPI and/or the editor(s) disclaim responsibility for any injury to people or property resulting from any ideas, methods, instructions or products referred to in the content.

