


Development and Validation of Liquid Chromatography-Tandem Mass Spectrometry Method for Simultaneous Determination of Tramadol and Its Phase I and II Metabolites in Human Urine

 , , , , , ,

Abstract
1. Introduction
2. Materials and Methods
2.1. Chemicals and Reagents
2.2. Urine Sampling
2.3. Sample Collection
2.4. Preparation of Standard and Quality Control Samples
2.5. Sample Preparation and Extraction Procedure
2.6. Analytical Conditions
2.6.1. Instrumental Conditions
2.6.2. Chromatographic Conditions
2.6.3. Pharmacokinetic Analysis of TD in Human Urine
2.7. Method Validation
3. Results and Discussion
3.1. Discussion on TD
3.2. Method Validation
3.2.1. Optimization of LC Conditions
3.2.2. Optimization of Mass Conditions
3.2.3. Optimization of the Extraction Procedure
3.2.4. Method Validation
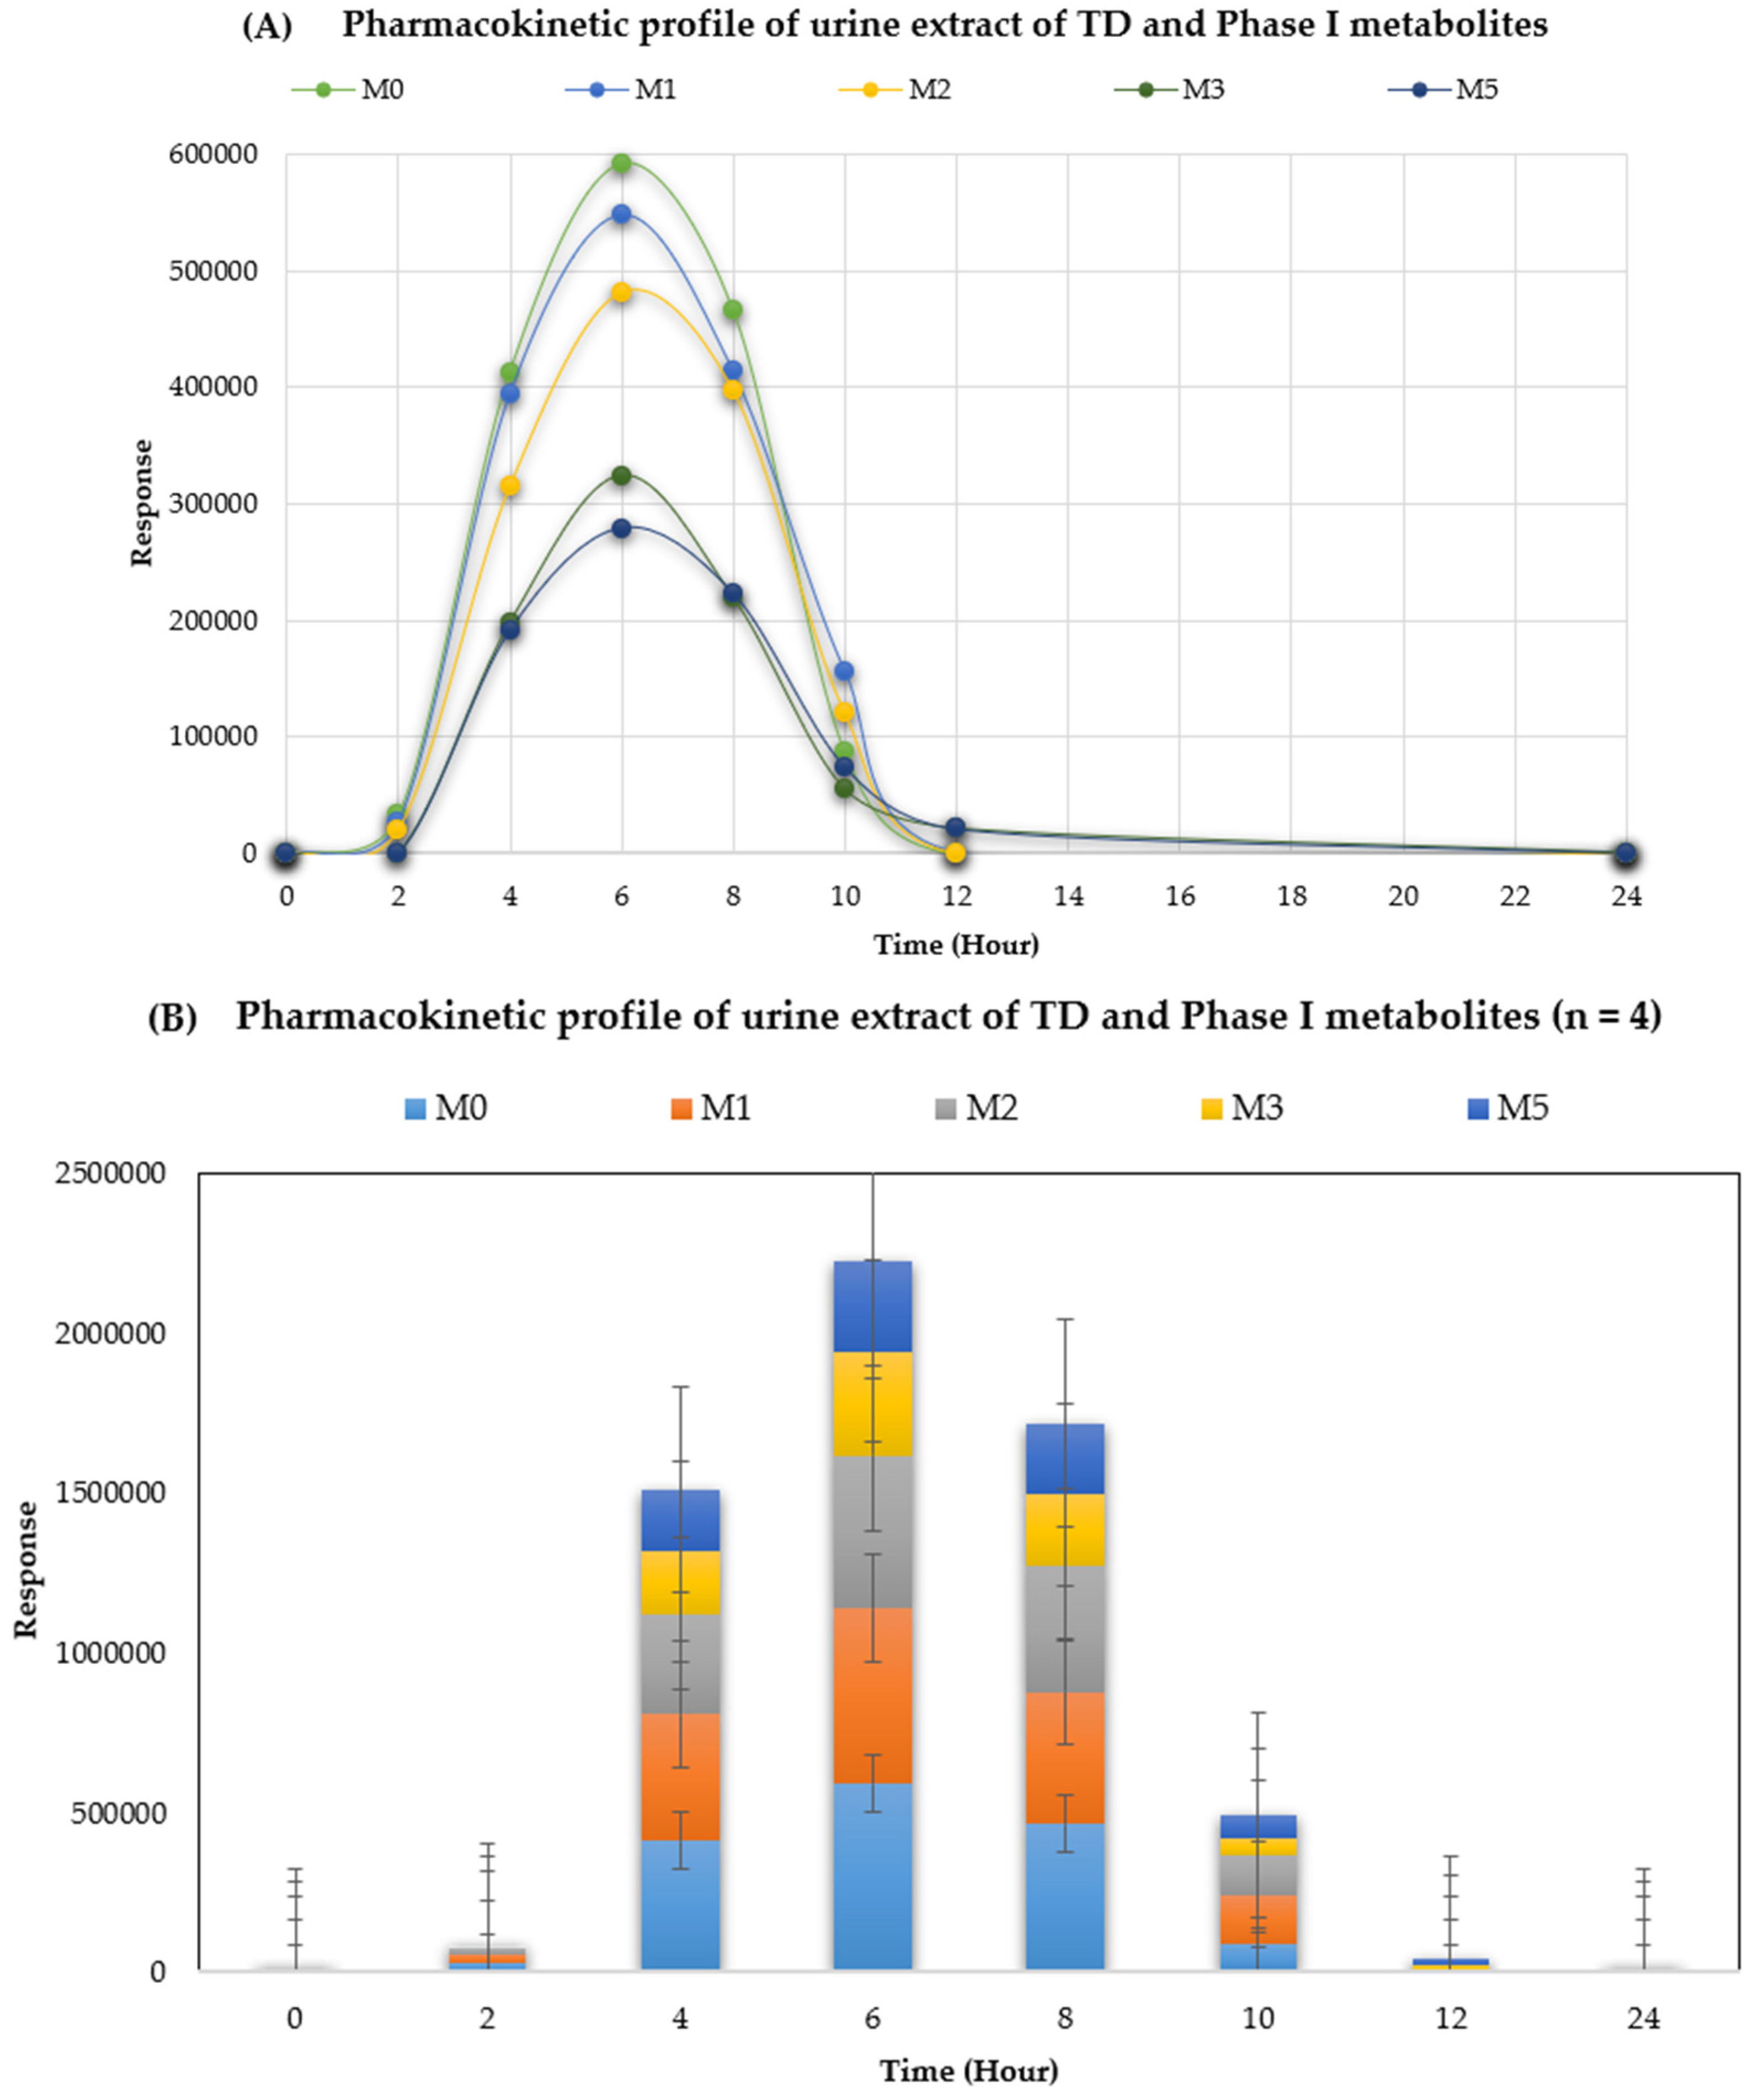
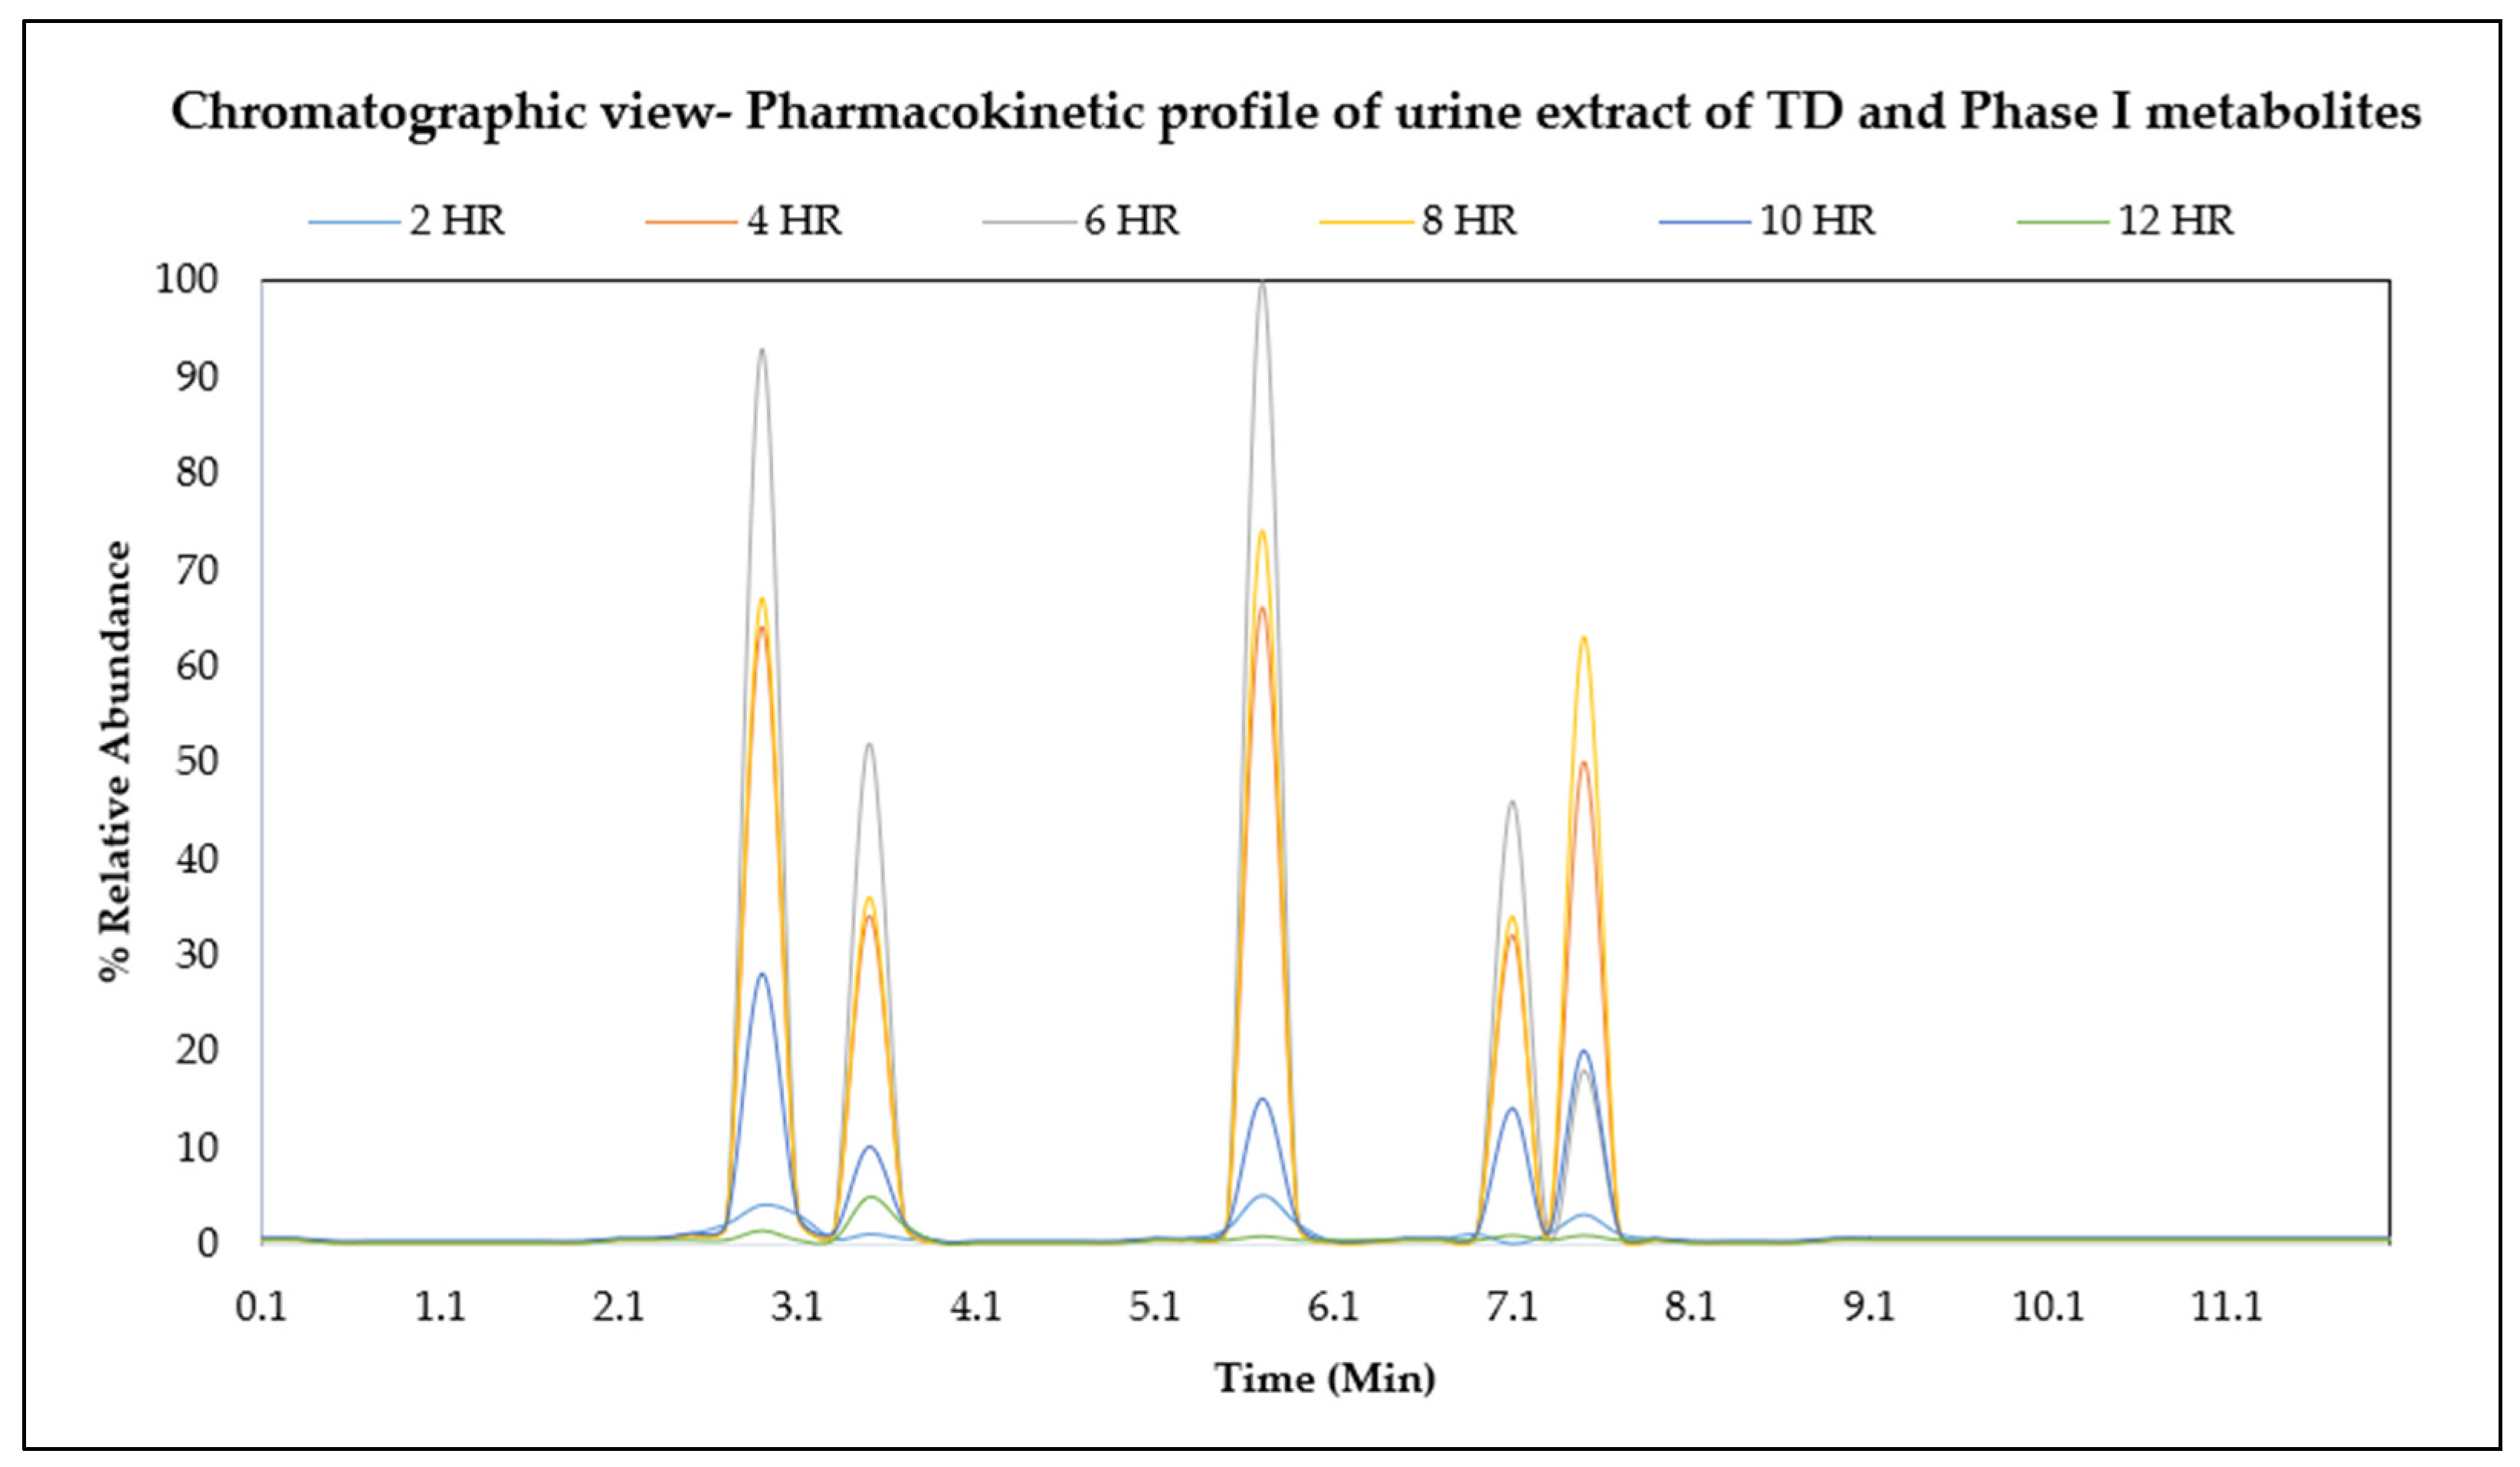
3.3. Application Method
4. Conclusions
Supplementary Materials
Author Contributions
Funding
Institutional Review Board Statement
Informed Consent Statement
Data Availability Statement
Acknowledgments
Conflicts of Interest
References
- Gibson, T.P. Pharmacokinetics, Efficacy, and Safety of Analgesia with a Focus on Tramadol HCl. Am. J. Med. 1996, 101, 47S–53S. [Google Scholar] [CrossRef] [PubMed]
- Shipton, E.A. Tramadol—Present and Future. Anaesth. Intensive Care 2000, 28, 363–374. [Google Scholar] [CrossRef] [PubMed]
- Cooper, R.J. Over-the-Counter Medicine Abuse—A Review of the Literature. J. Subst. Use 2013, 18, 82–107. [Google Scholar] [CrossRef]
- Alm, E.; Holmstedt, A.; Håkansson, A. Addictive Behaviors Reports Tramadol Misuse in Treatment-Seeking Adolescents and Young Adults with Problematic Substance Use—Prediction of Treatment Retention. Addict. Behav. Rep. J. 2022, 16, 100446. [Google Scholar] [CrossRef]
- Miotto, K.; Cho, A.K.; Khalil, M.A.; Blanco, K.; Sasaki, J.D.; Rawson, R. Trends in Tramadol: Pharmacology, Metabolism, and Misuse. Anesth. Analg. 2017, 124, 44–51. [Google Scholar] [CrossRef]
- Grond, S.; Sablotzki, A. Clinical Pharmacology of Tramadol. Clin. Pharmacokinet. 2004, 43, 879–923. [Google Scholar] [CrossRef]
- Almalki, A.H.; Ali, N.A.; Elroby, F.A.; El Ghobashy, M.R.; Emam, A.A.; Naguib, I.A. ESI–LC–MS/MS for Therapeutic Drug Monitoring of Binary Mixture of Pregabalin and Tramadol: Human Plasma and Urine Applications. Separations 2021, 8, 21. [Google Scholar] [CrossRef]
- Magny, R.; Auzeil, N.; Lefrère, B.; Mégarbane, B.; Houzé, P.; Labat, L. Molecular Network-Based Identification of Tramadol Metabolites in a Fatal Tramadol Poisoning. Metabolites 2022, 12, 665. [Google Scholar] [CrossRef]
- Rouini, M.; Hosseinzadeh, Y.; Soltani, F.; Aboul-enein, H.Y.; Foroumadi, A. Development and Validation of a Rapid HPLC Method for Simultaneous Determination of Tramadol, and Its Two Main Metabolites in Human Plasma. J. Chromatogr. B 2006, 830, 207–211. [Google Scholar] [CrossRef]
- Tao, Q.; Stone, D.J.J.; Borenstein, M.R.; Jean-Bart, V.; Codd, E.E.; Coogan, T.P.; Desai-Krieger, D.; Liao, S.; Raffa, R.B. Gas Chromatographic Method Using Nitrogen-Phosphorus Detection for the Measurement of Tramadol and Its O-Desmethyl Metabolite in Plasma and Brain Tissue of Mice and Rats. J. Chromatogr. B Biomed. Sci. Appl. 2001, 763, 165–171. [Google Scholar] [CrossRef]
- Hadidi, K.A.; Almasad, J.K.; Al-Nsour, T.; Abu-Ragheib, S. Determination of Tramadol in Hair Using Solid Phase Extraction and GC-MS. Forensic Sci. Int. 2003, 135, 129–136. [Google Scholar] [CrossRef] [PubMed]
- Nobilis, M.; Kopecký, J.; Kvetina, J.; Chládek, J.; Svoboda, Z.; Vorísek, V.; Perlík, F.; Pour, M.; Kunes, J. High-Performance Liquid Chromatographic Determination of Tramadol and Its O-Desmethylated Metabolite in Blood Plasma. Application to a Bioequivalence Study in Humans. J. Chromatogr. A 2002, 949, 11–22. [Google Scholar] [CrossRef]
- Elsing, B.; Blaschke, G. Achiral and Chiral High-Performance Liquid Chromatographic Determination of Tramadol and Its Major Metabolites in Urine after Oral Administration of Racemic Tramadol. J. Chromatogr. 1993, 612, 223–230. [Google Scholar] [CrossRef] [PubMed]
- Liu, P.; Liang, S.; Wang, B.-J.; Guo, R.-C. Development and Validation of a Sensitive LC-MS Method for the Determination of Tramadol in Human Plasma and Urine. Eur. J. Drug Metab. Pharmacokinet. 2009, 34, 185–192. [Google Scholar] [CrossRef]
- Javanbakht, M.; Attaran, A.M.; Namjumanesh, M.H.; Esfandyari-Manesh, M.; Akbari-Adergani, B. Solid-Phase Extraction of Tramadol from Plasma and Urine Samples Using a Novel Water-Compatible Molecularly Imprinted Polymer. J. Chromatogr. B Anal. Technol. Biomed. Life Sci. 2010, 878, 1700–1706. [Google Scholar] [CrossRef] [PubMed]
- Sha, Y.F.; Shen, S.; Duan, G.L. Rapid Determination of Tramadol in Human Plasma by Headspace Solid-Phase Microextraction and Capillary Gas Chromatography-Mass Spectrometry. J. Pharm. Biomed. Anal. 2005, 37, 143–147. [Google Scholar] [CrossRef]
- Ardakani, Y.H.; Rouini, M.-R. Improved Liquid Chromatographic Method for the Simultaneous Determination of Tramadol and Its Three Main Metabolites in Human Plasma, Urine and Saliva. J. Pharm. Biomed. Anal. 2007, 44, 1168–1173. [Google Scholar] [CrossRef]
- Chauhan, V.; Manisha; Shukla, S.K.; Munjal, P. Current Analytical Trends of Abuse of Tramadol and Its Forensic Significance. Toxicol. Environ. Health Sci. 2022, 14, 111–129. [Google Scholar] [CrossRef]
- Tecimer, N. The Dangerous Opioid from India; Center for Strategic and International Studies: Washington, DC, USA, 2016. [Google Scholar]
- Patel, B.N.; Sharma, N.; Sanyal, M.; Shrivastav, P.S. An Accurate, Rapid and Sensitive Determination of Tramadol and Its Active Metabolite O-Desmethyltramadol in Human Plasma by LC-MS/MS. J. Pharm. Biomed. Anal. 2009, 49, 354–366. [Google Scholar] [CrossRef]
- Silva, C.; Ribeiro, C.; Maia, A.S.; Gonçalves, V.; Tiritan, M.E.; Afonso, C. Enantiomeric Separation of Tramadol and Its Metabolites: Method Validation and Application to Environmental Samples. Symmetry 2017, 9, 170. [Google Scholar] [CrossRef]
- Godoy, A.L.P.C.; De Moraes, N.V.; Martinez, E.Z.; Carvalho, T.M.D.J.P.; Marques, M.P.; Lanchote, V.L. Simultaneous Analysis of Tramadol, O-Desmethyltramadol, and N-Desmethyltramadol Enantiomers in Rat Plasma by High-Performance Liquid Chromatography-Tandem Mass Spectrometry: Application to Pharmacokinetics. Chirality 2011, 23, 287–293. [Google Scholar] [CrossRef] [PubMed]
- Chytil, L.; Matousková, O.; Cerná, O.; Pokorná, P.; Vobruba, V.; Perlík, F.; Slanar, O. Enantiomeric Determination of Tramadol and O-Desmethyltramadol in Human Plasma by Fast Liquid Chromatographic Technique Coupled with Mass Spectrometric Detection. J. Chromatogr. B Anal. Technol. Biomed. Life Sci. 2010, 878, 481–486. [Google Scholar] [CrossRef] [PubMed]
- Ceccato, A.; Vanderbist, F.; Pabst, J.-Y.; Streel, B. Enantiomeric Determination of Tramadol and Its Main Metabolite O-Desmethyltramadol in Human Plasma by Liquid Chromatography–Tandem Mass Spectrometry. J. Chromatogr. B Biomed. Sci. Appl. 2000, 748, 65–76. [Google Scholar] [CrossRef] [PubMed]
- Yilmaz, B.; Erdem, A.F. Simultaneous Determination of Tramadol and Its Metabolite in Human Urine by the Gas Chromatography–Mass Spectrometry Method. J. Chromatogr. Sci. 2015, 53, 1037–1043. [Google Scholar] [CrossRef]
- Paar, W.D.; Frankus, P.; Dengler, H.J. High-Performance Liquid Chromatographic Assay for the Simultaneous Determination of Tramadol and Its Metabolites in Microsomal Fractions of Human Liver. J. Chromatogr. B Biomed. Appl. 1996, 686, 221–227. [Google Scholar] [CrossRef]
- Valle, M.; Pavón, J.M.; Calvo, R.; Campanero, M.A.; Trocóniz, I.F. Simultaneous Determination of Tramadol and Its Major Active Metabolite O-Demethyltramadol by High-Performance Liquid Chromatography with Electrochemical Detection. J. Chromatogr. B Biomed. Sci. Appl. 1999, 724, 83–89. [Google Scholar] [CrossRef]
- Saccomanni, G.; Del Carlo, S.; Giorgi, M.; Manera, C.; Saba, A.; Macchia, M. Determination of Tramadol and Metabolites by HPLC-FL and HPLC-MS/MS in Urine of Dogs. J. Pharm. Biomed. Anal. 2010, 53, 194–199. [Google Scholar] [CrossRef]
- Ebrahimzadeh, H.; Yamini, Y.; Sedighi, A.; Rouini, M.R. Determination of Tramadol in Human Plasma and Urine Samples Using Liquid Phase Microextraction with Back Extraction Combined with High Performance Liquid Chromatography. J. Chromatogr. B Anal. Technol. Biomed. Life Sci. 2008, 863, 229–234. [Google Scholar] [CrossRef]
- Rudaz, S.; Veuthey, J.L.; Desiderio, C.; Fanali, S. Simultaneous Stereoselective Analysis by Capillary Electrophoresis of Tramadol Enantiomers and Their Main Phase I Metabolites in Urine. J. Chromatogr. A 1999, 846, 227–237. [Google Scholar] [CrossRef]
- Ahmad, W.; Al-Sibaai, A.A.; Bashammakh, A.S.; Alwael, H.; El-Shahawi, M.S. Recent Advances in Dispersive Liquid-Liquid Microextraction for Pesticide Analysis. TrAC Trends Anal. Chem. 2015, 72, 181–192. [Google Scholar] [CrossRef]
- Wu, W.N.; McKown, L.A.; Liao, S. Metabolism of the Analgesic Drug ULTRAM (Tramadol Hydrochloride) in Humans: API-MS and MS/MS Characterization of Metabolites. Xenobiotica 2002, 32, 411–425. [Google Scholar] [CrossRef] [PubMed]
- Perez Jimenez, T.E.; Mealey, K.L.; Grubb, T.L.; Greene, S.A.; Court, M.H. Tramadol Metabolism to O-Desmethyl Tramadol (M1) and N-Desmethyl Tramadol (M2) by Dog Liver Microsomes: Species Comparison and Identification of Responsible Canine Cytochrome P-450s (CYPs). Drug Metab. Dispos. 2016, 44, 1963–1972. [Google Scholar] [CrossRef] [PubMed]


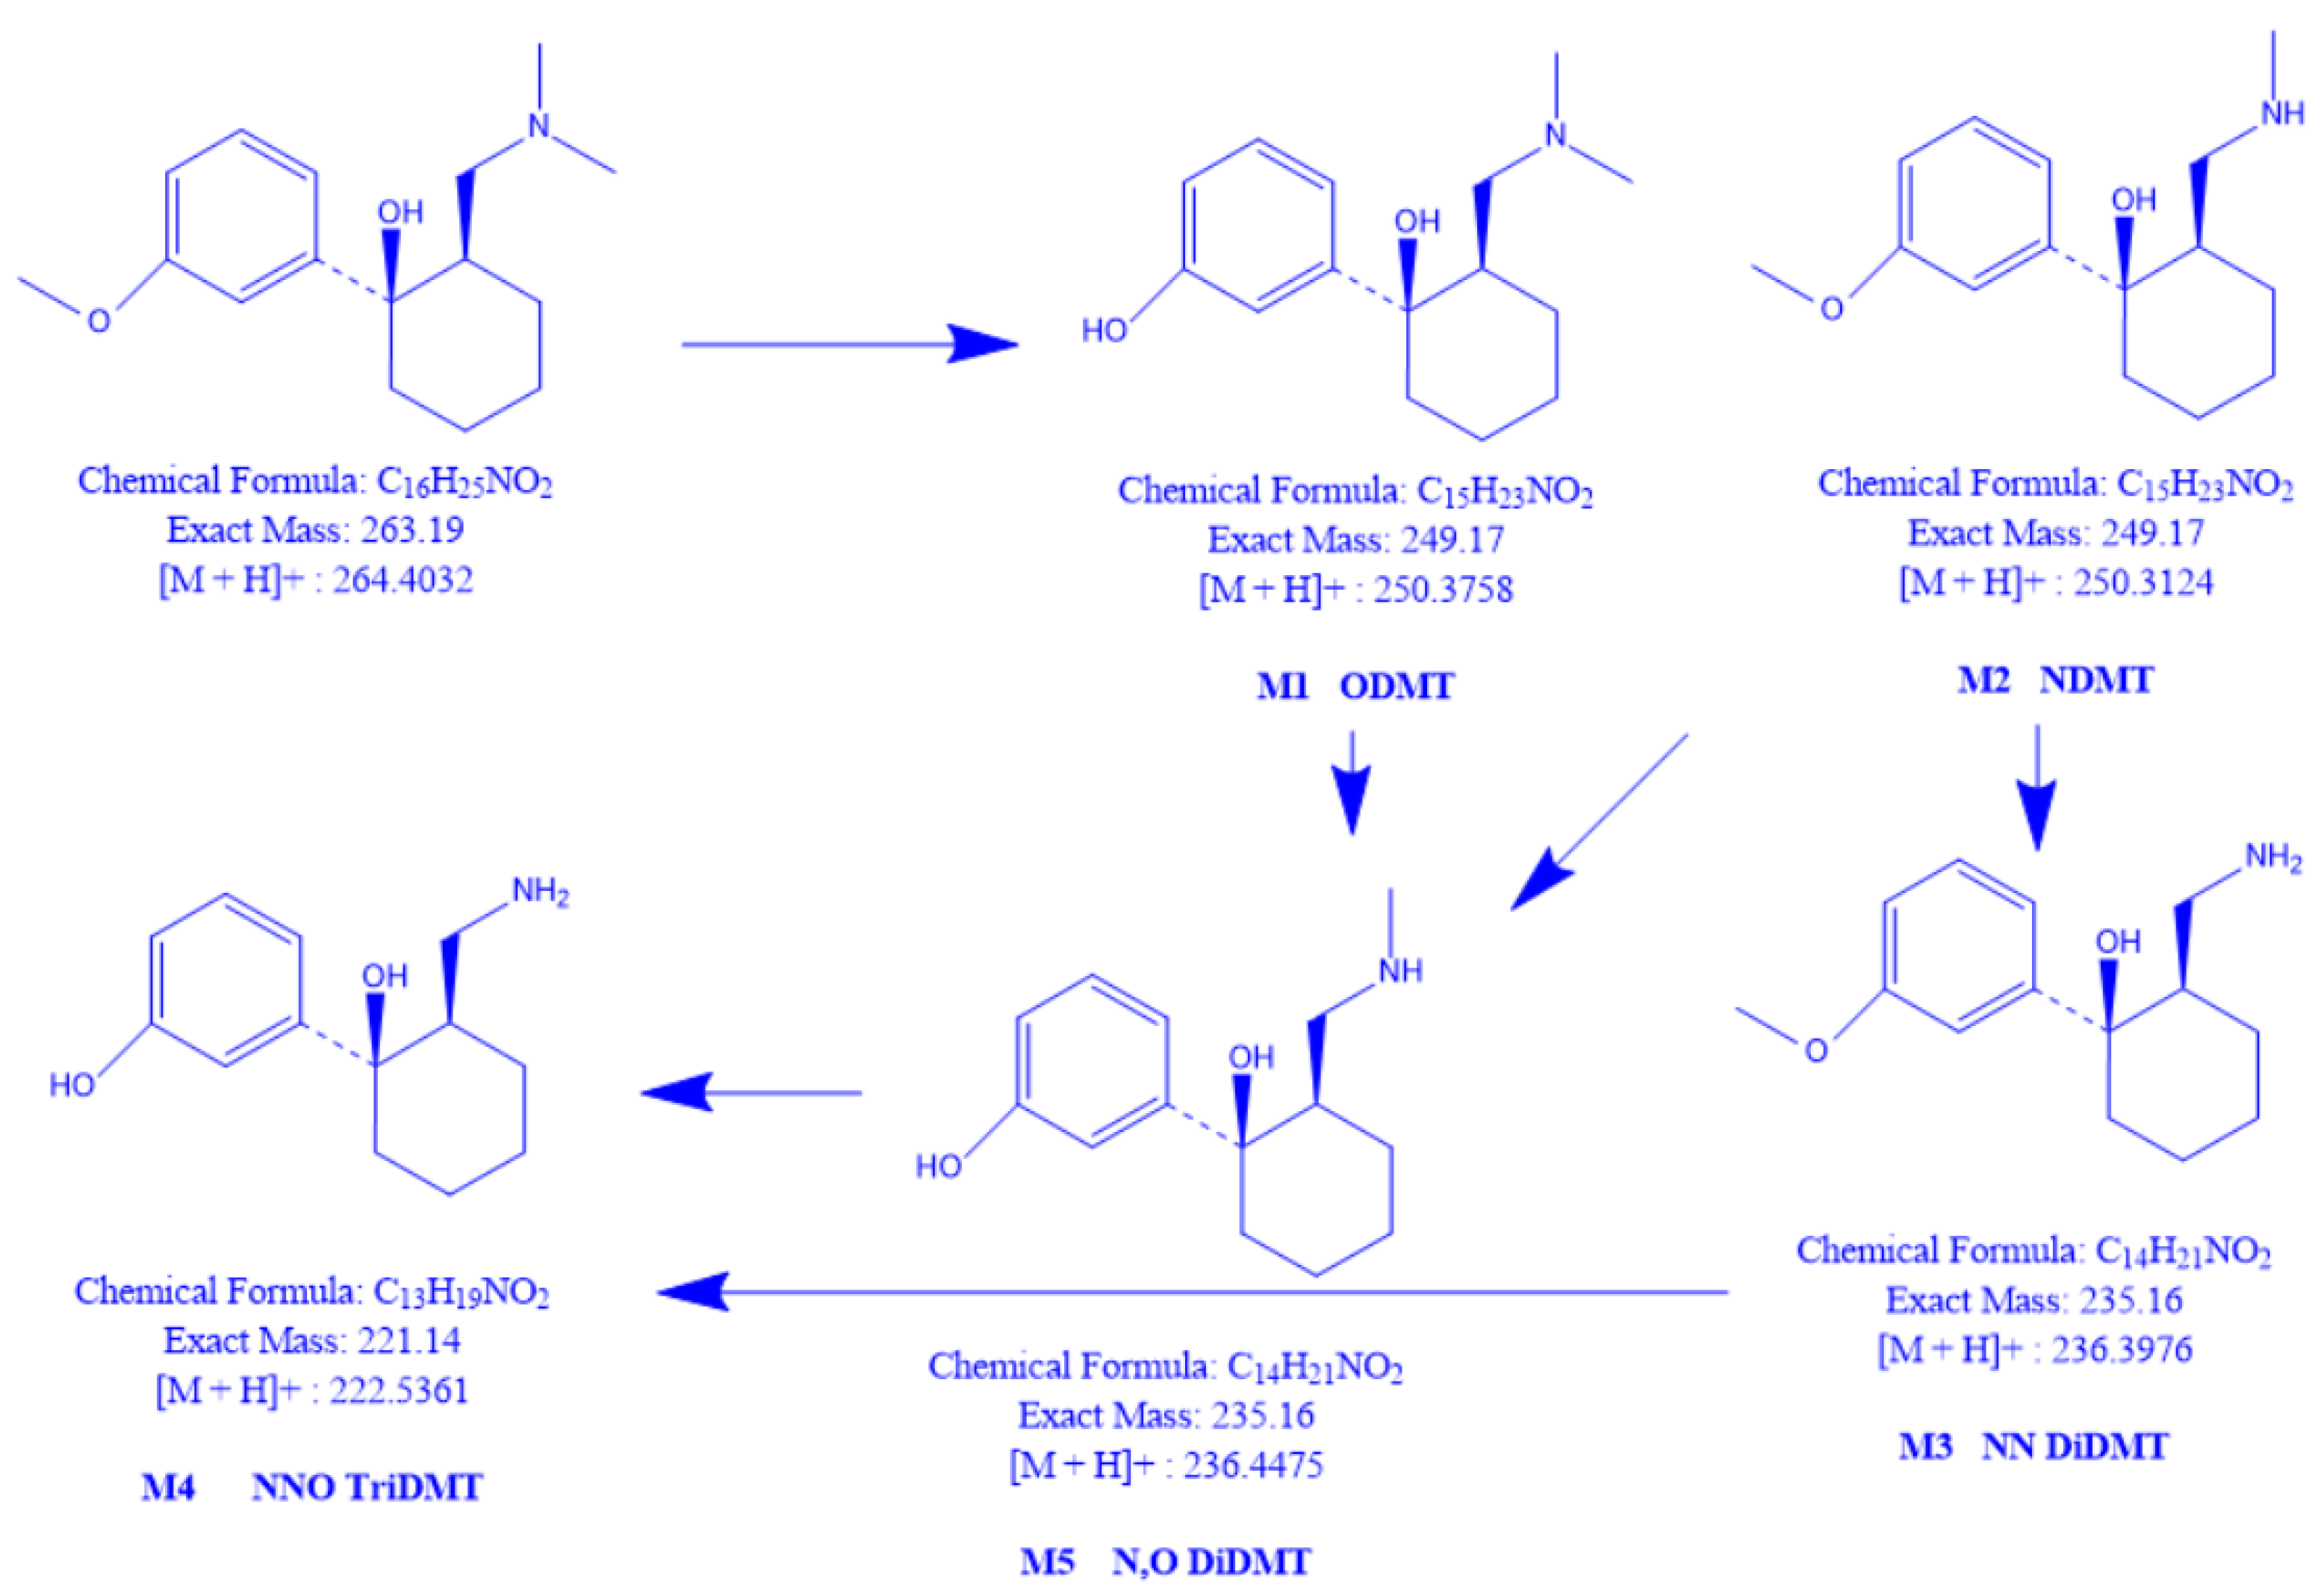
| Analyte | Metabolite | m/z | Retention Time |
|---|---|---|---|
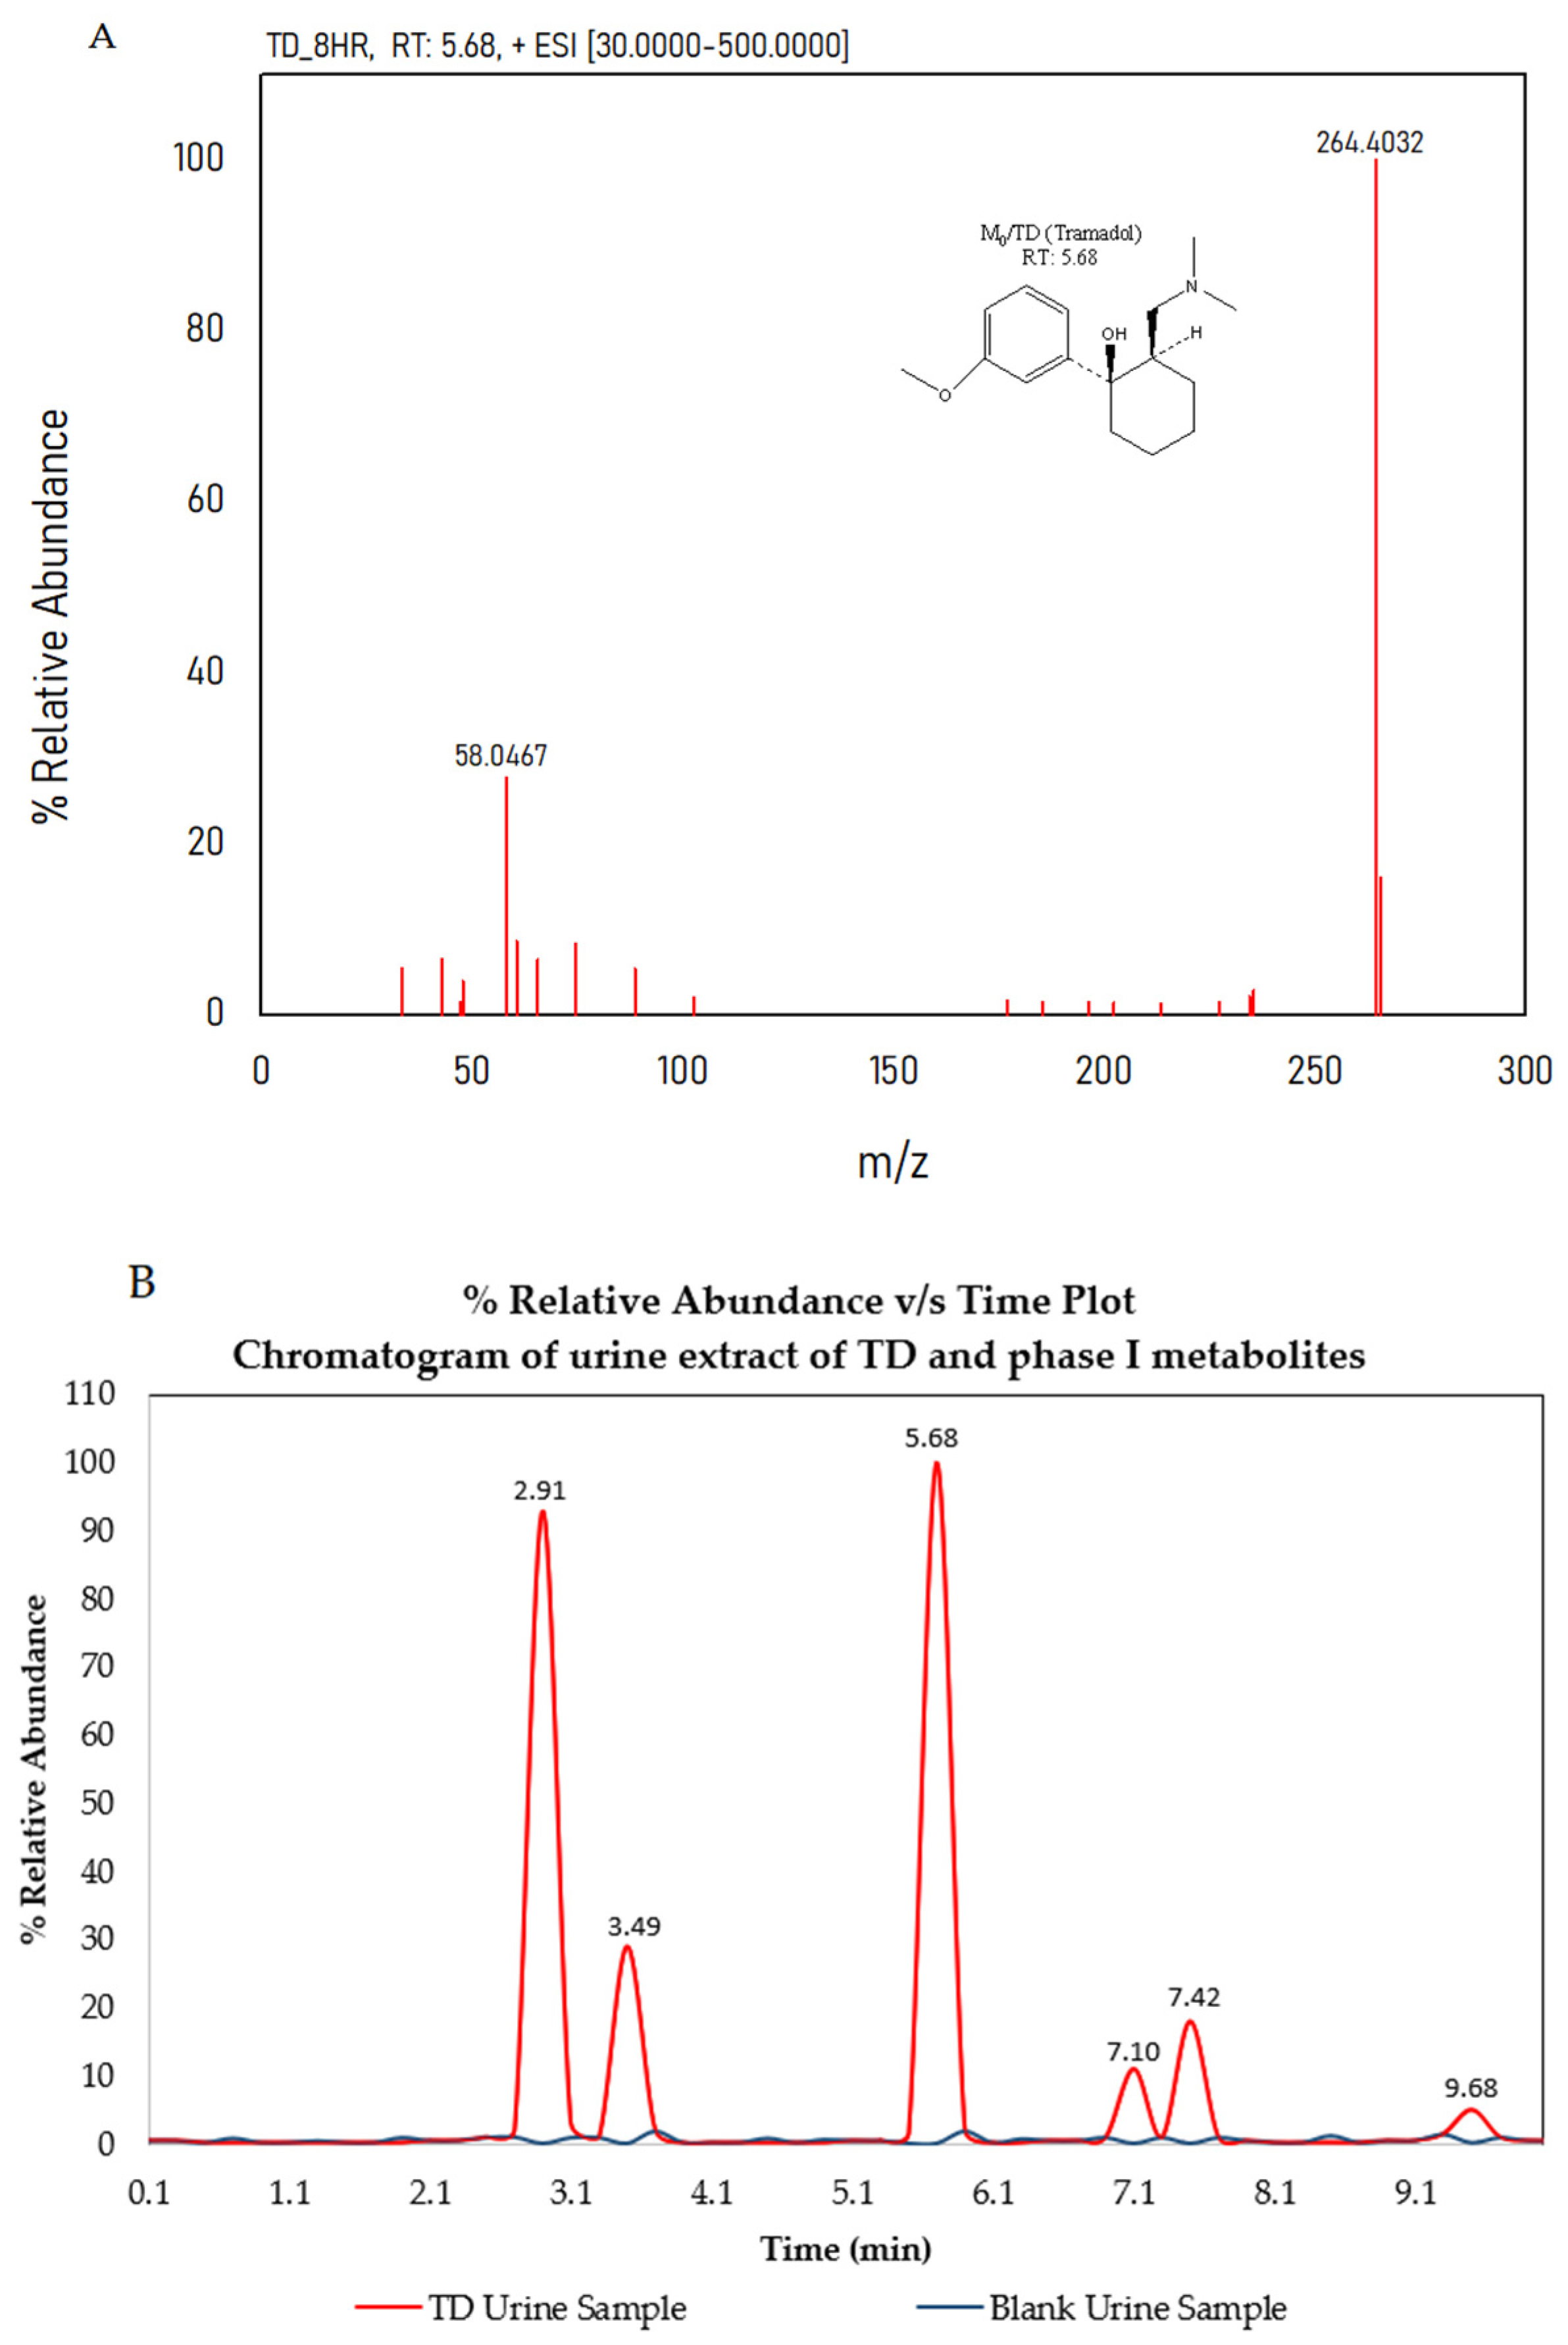
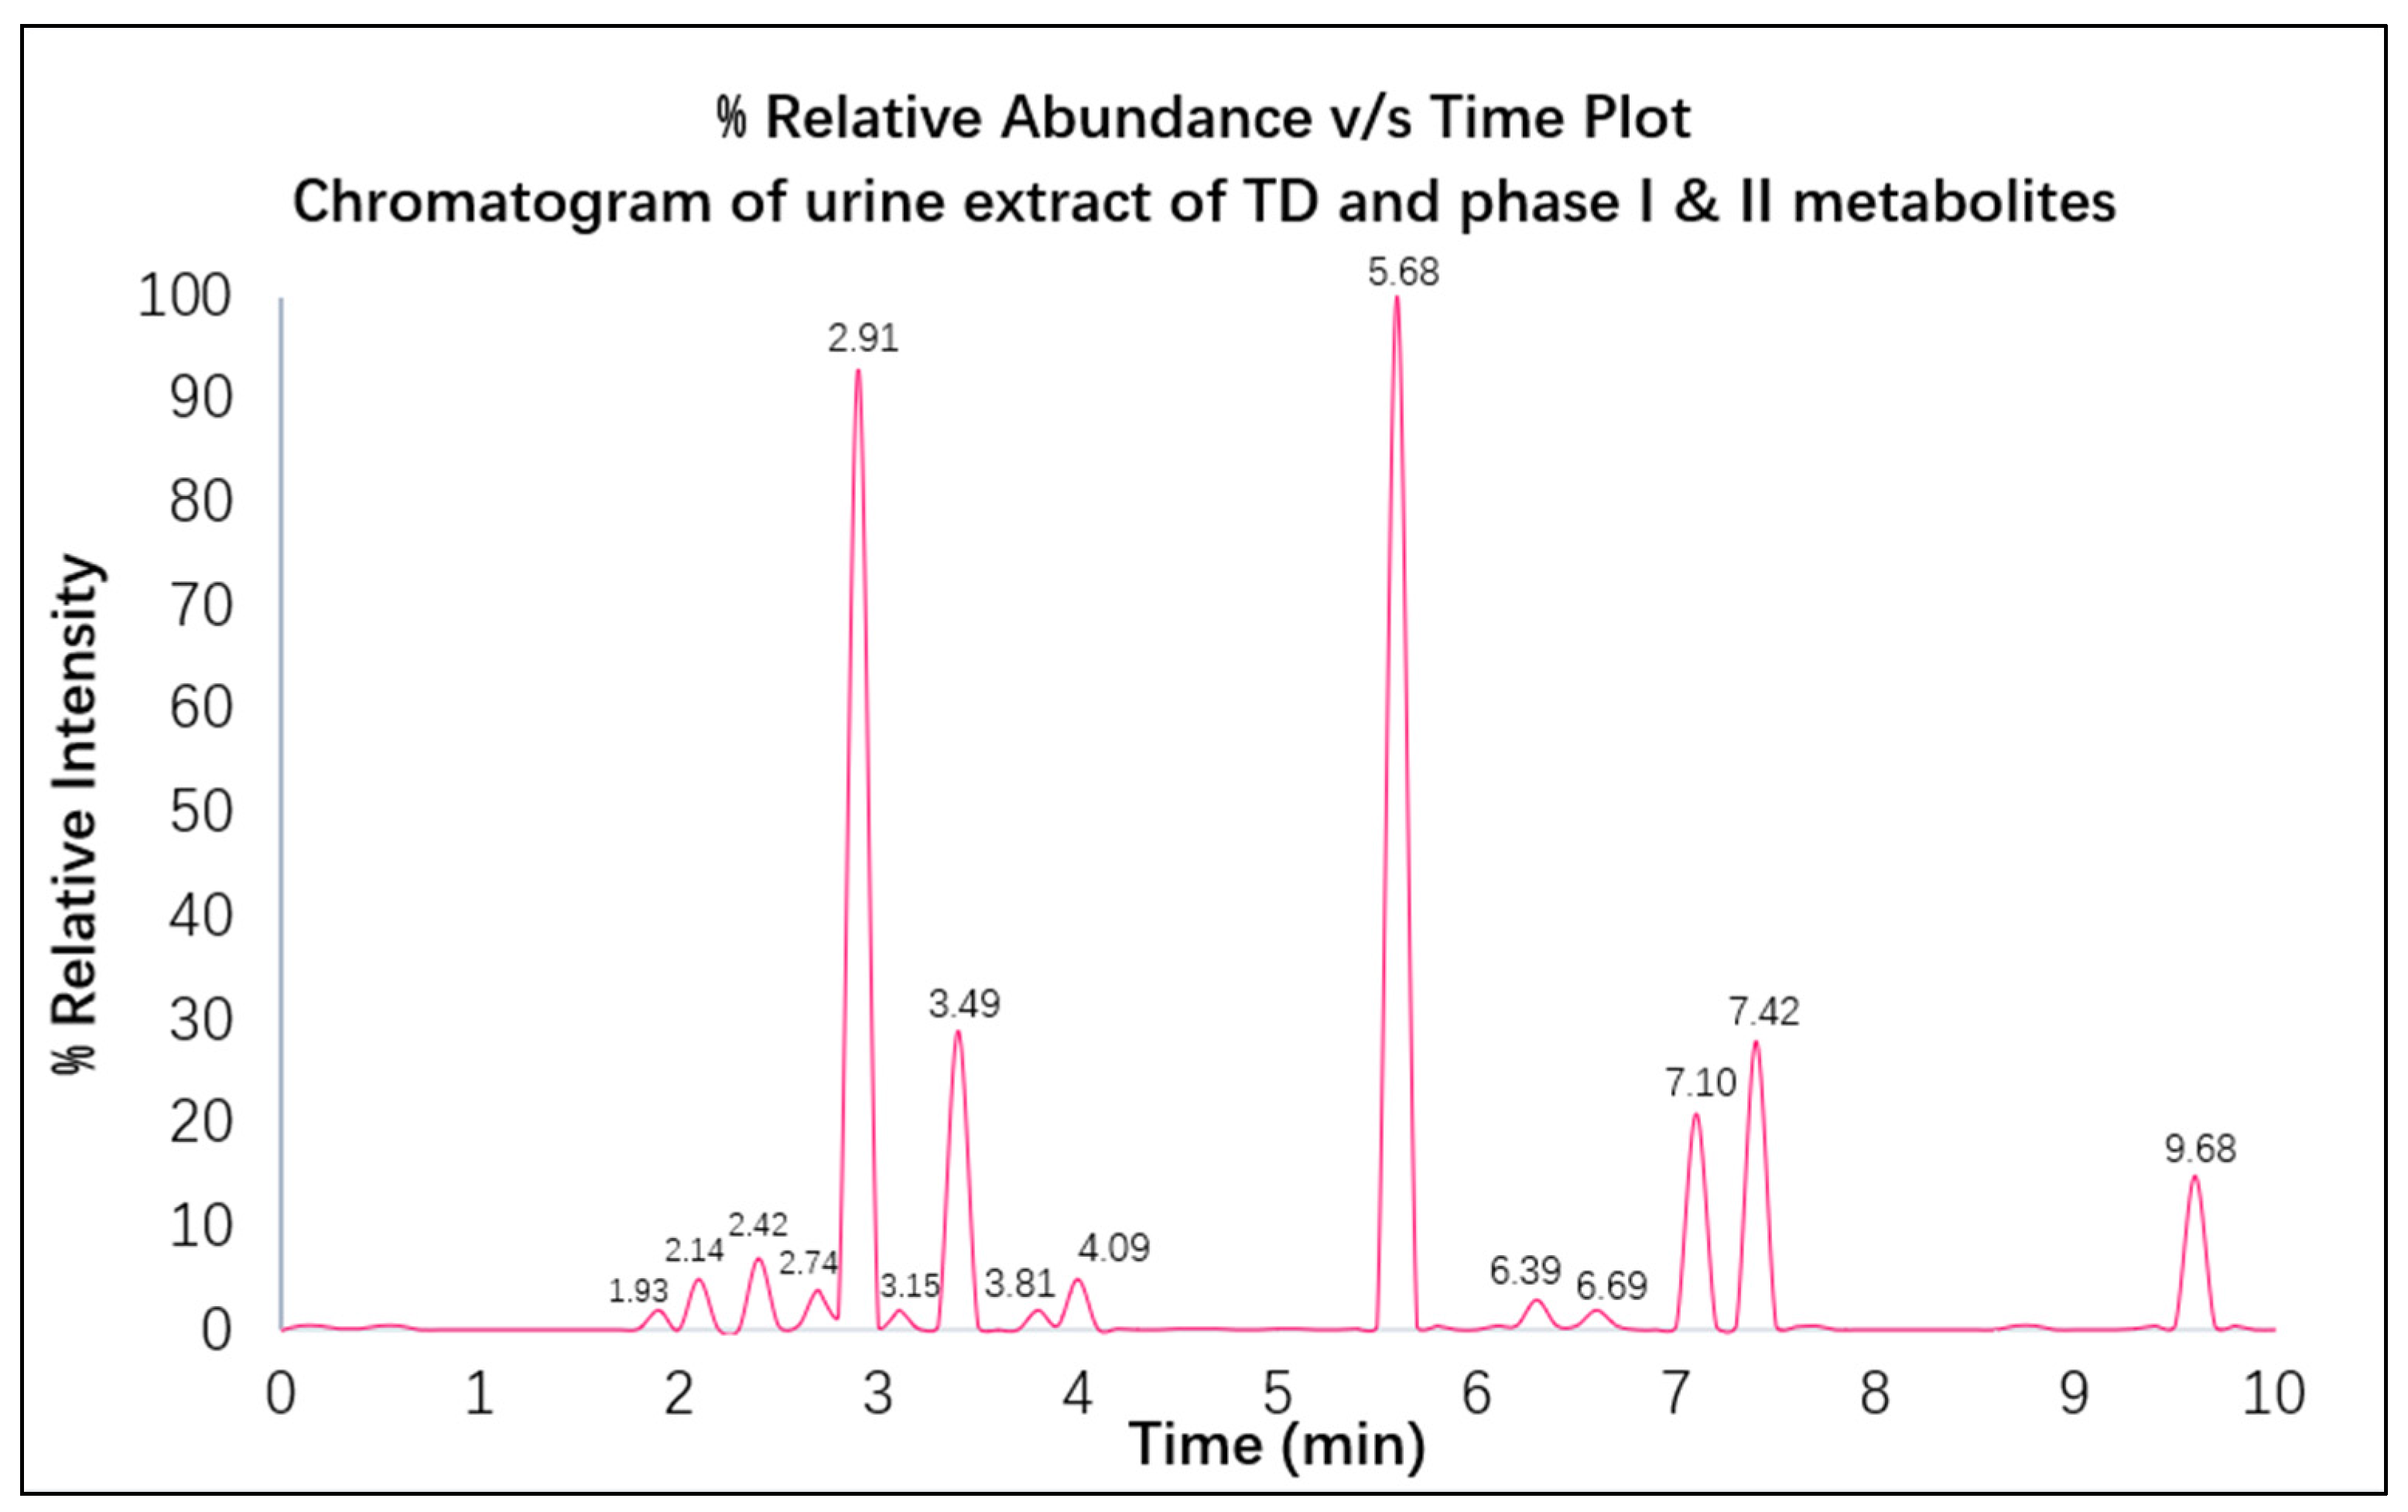
| M0 | TD | 264.4032 | 5.68 |
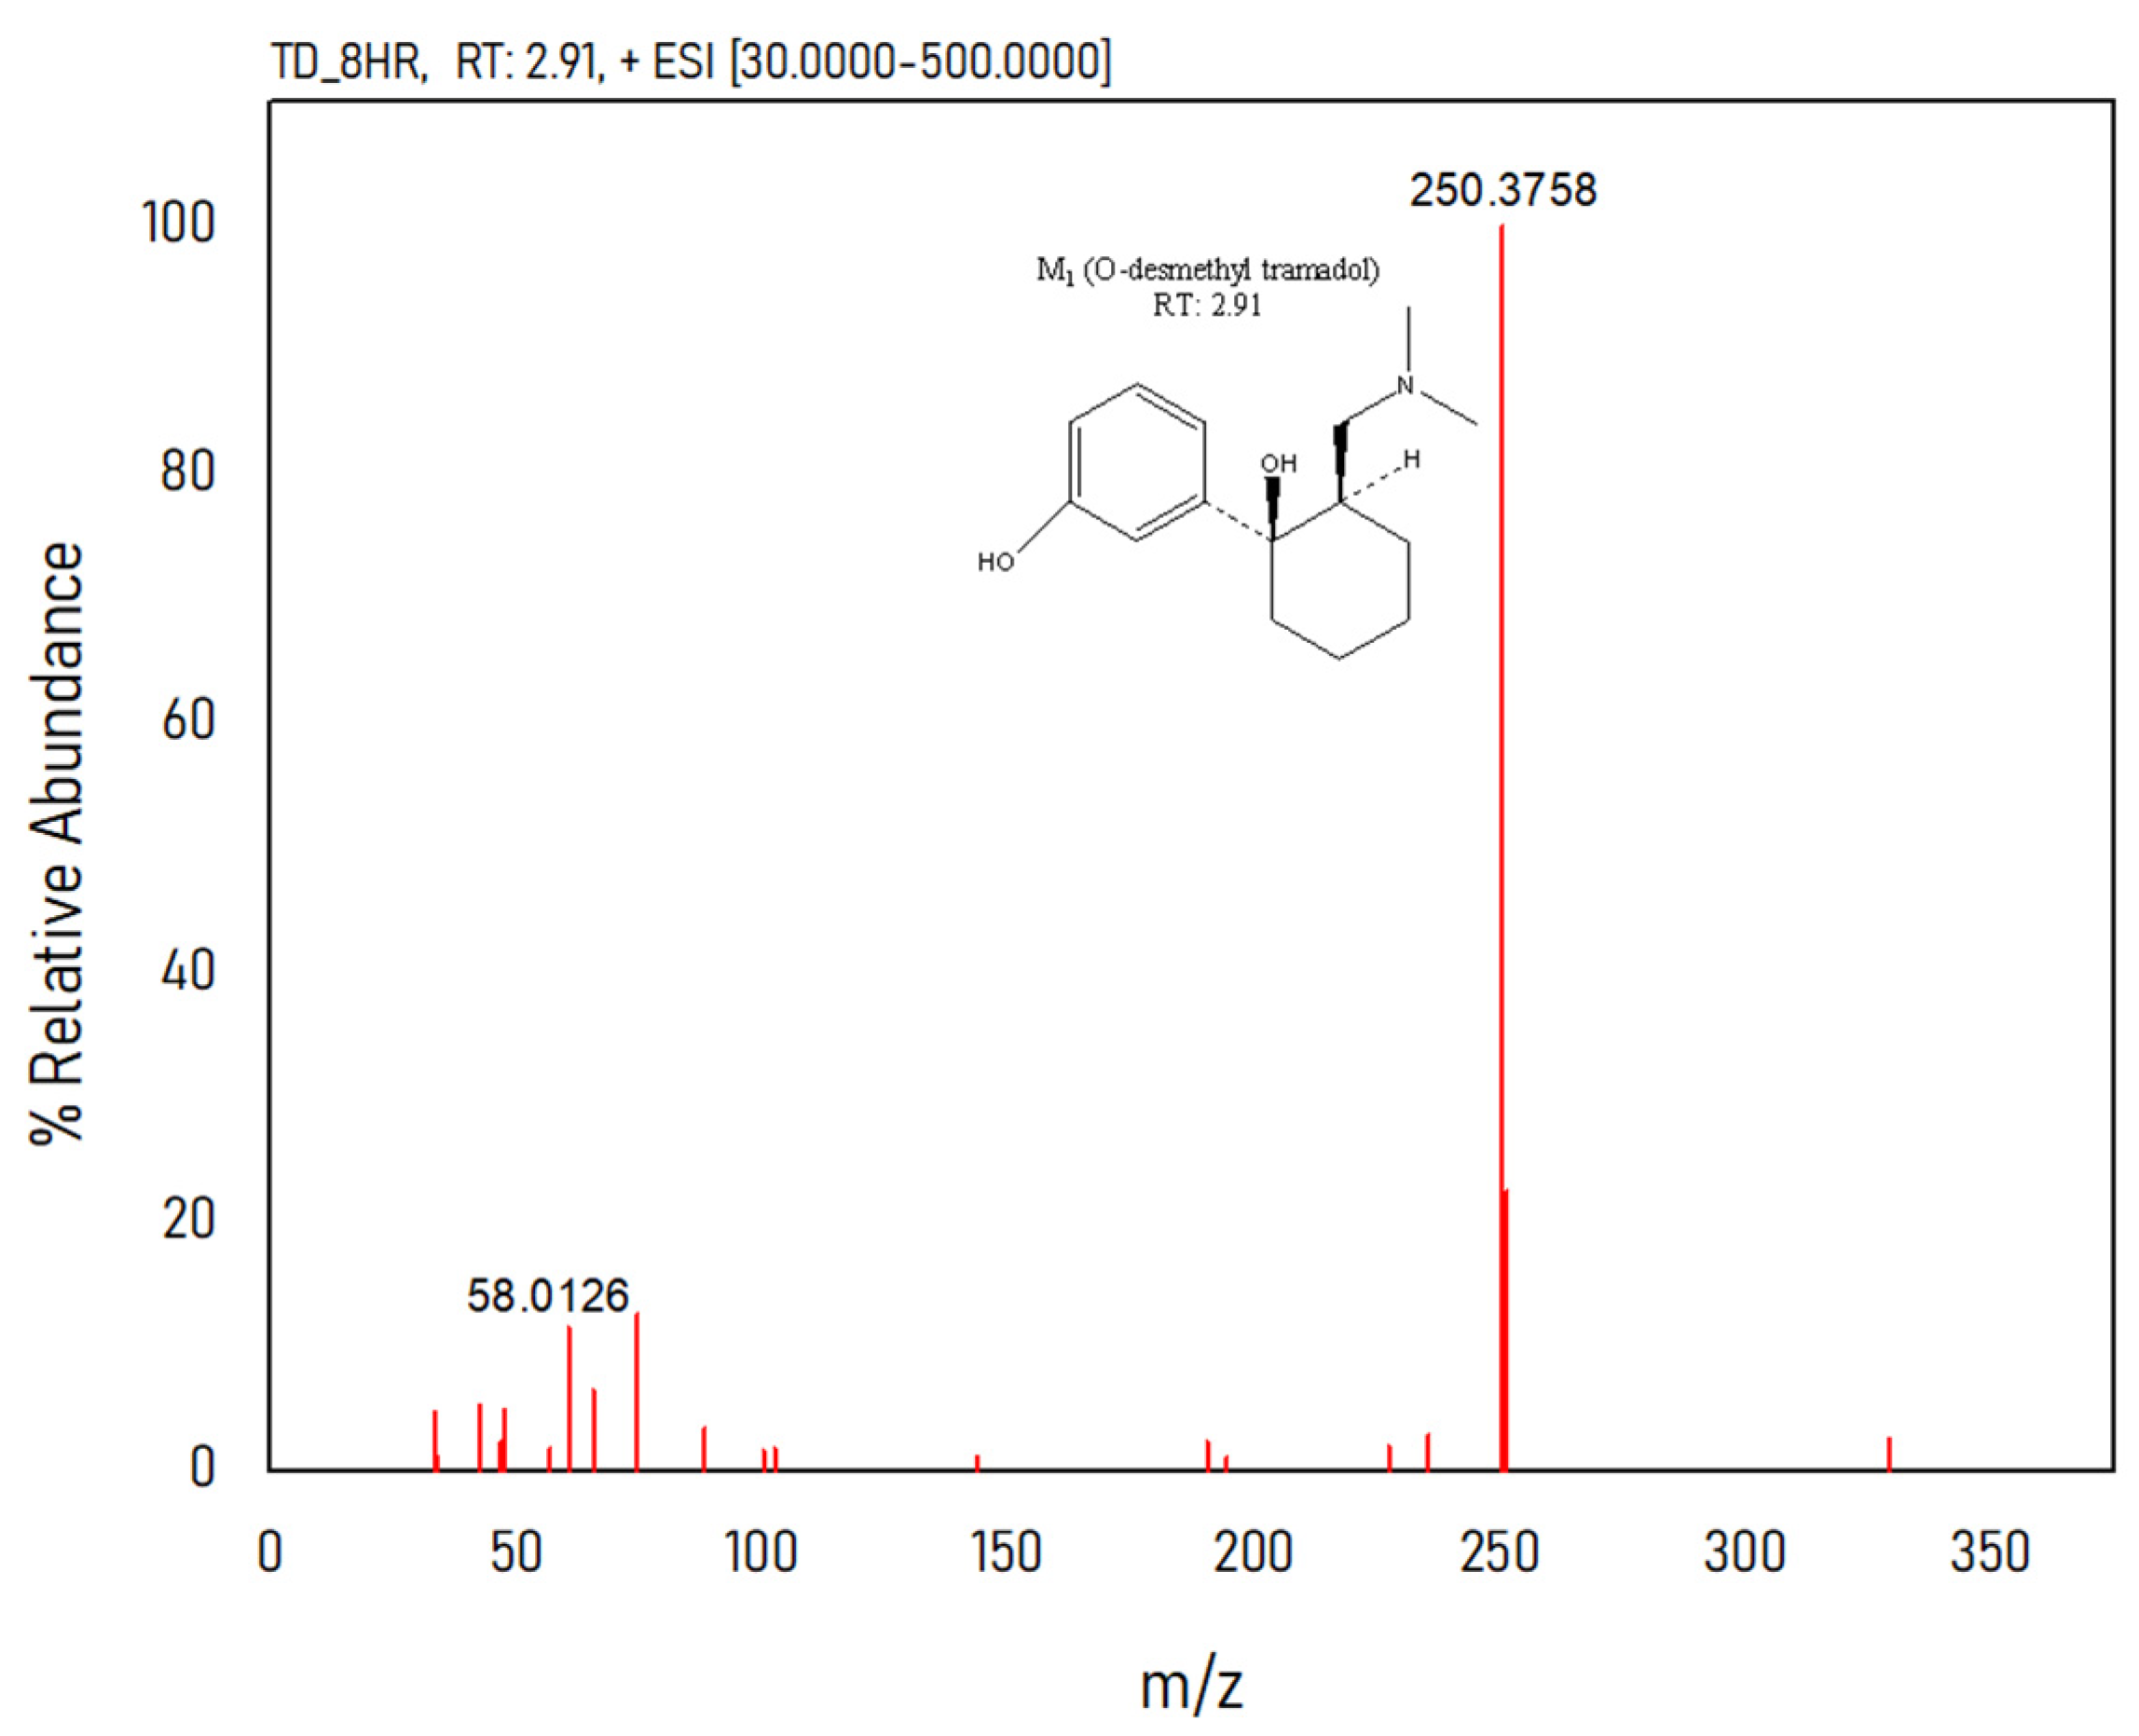
| M1 | O-desmethyl TD | 250.3758 | 2.91 |
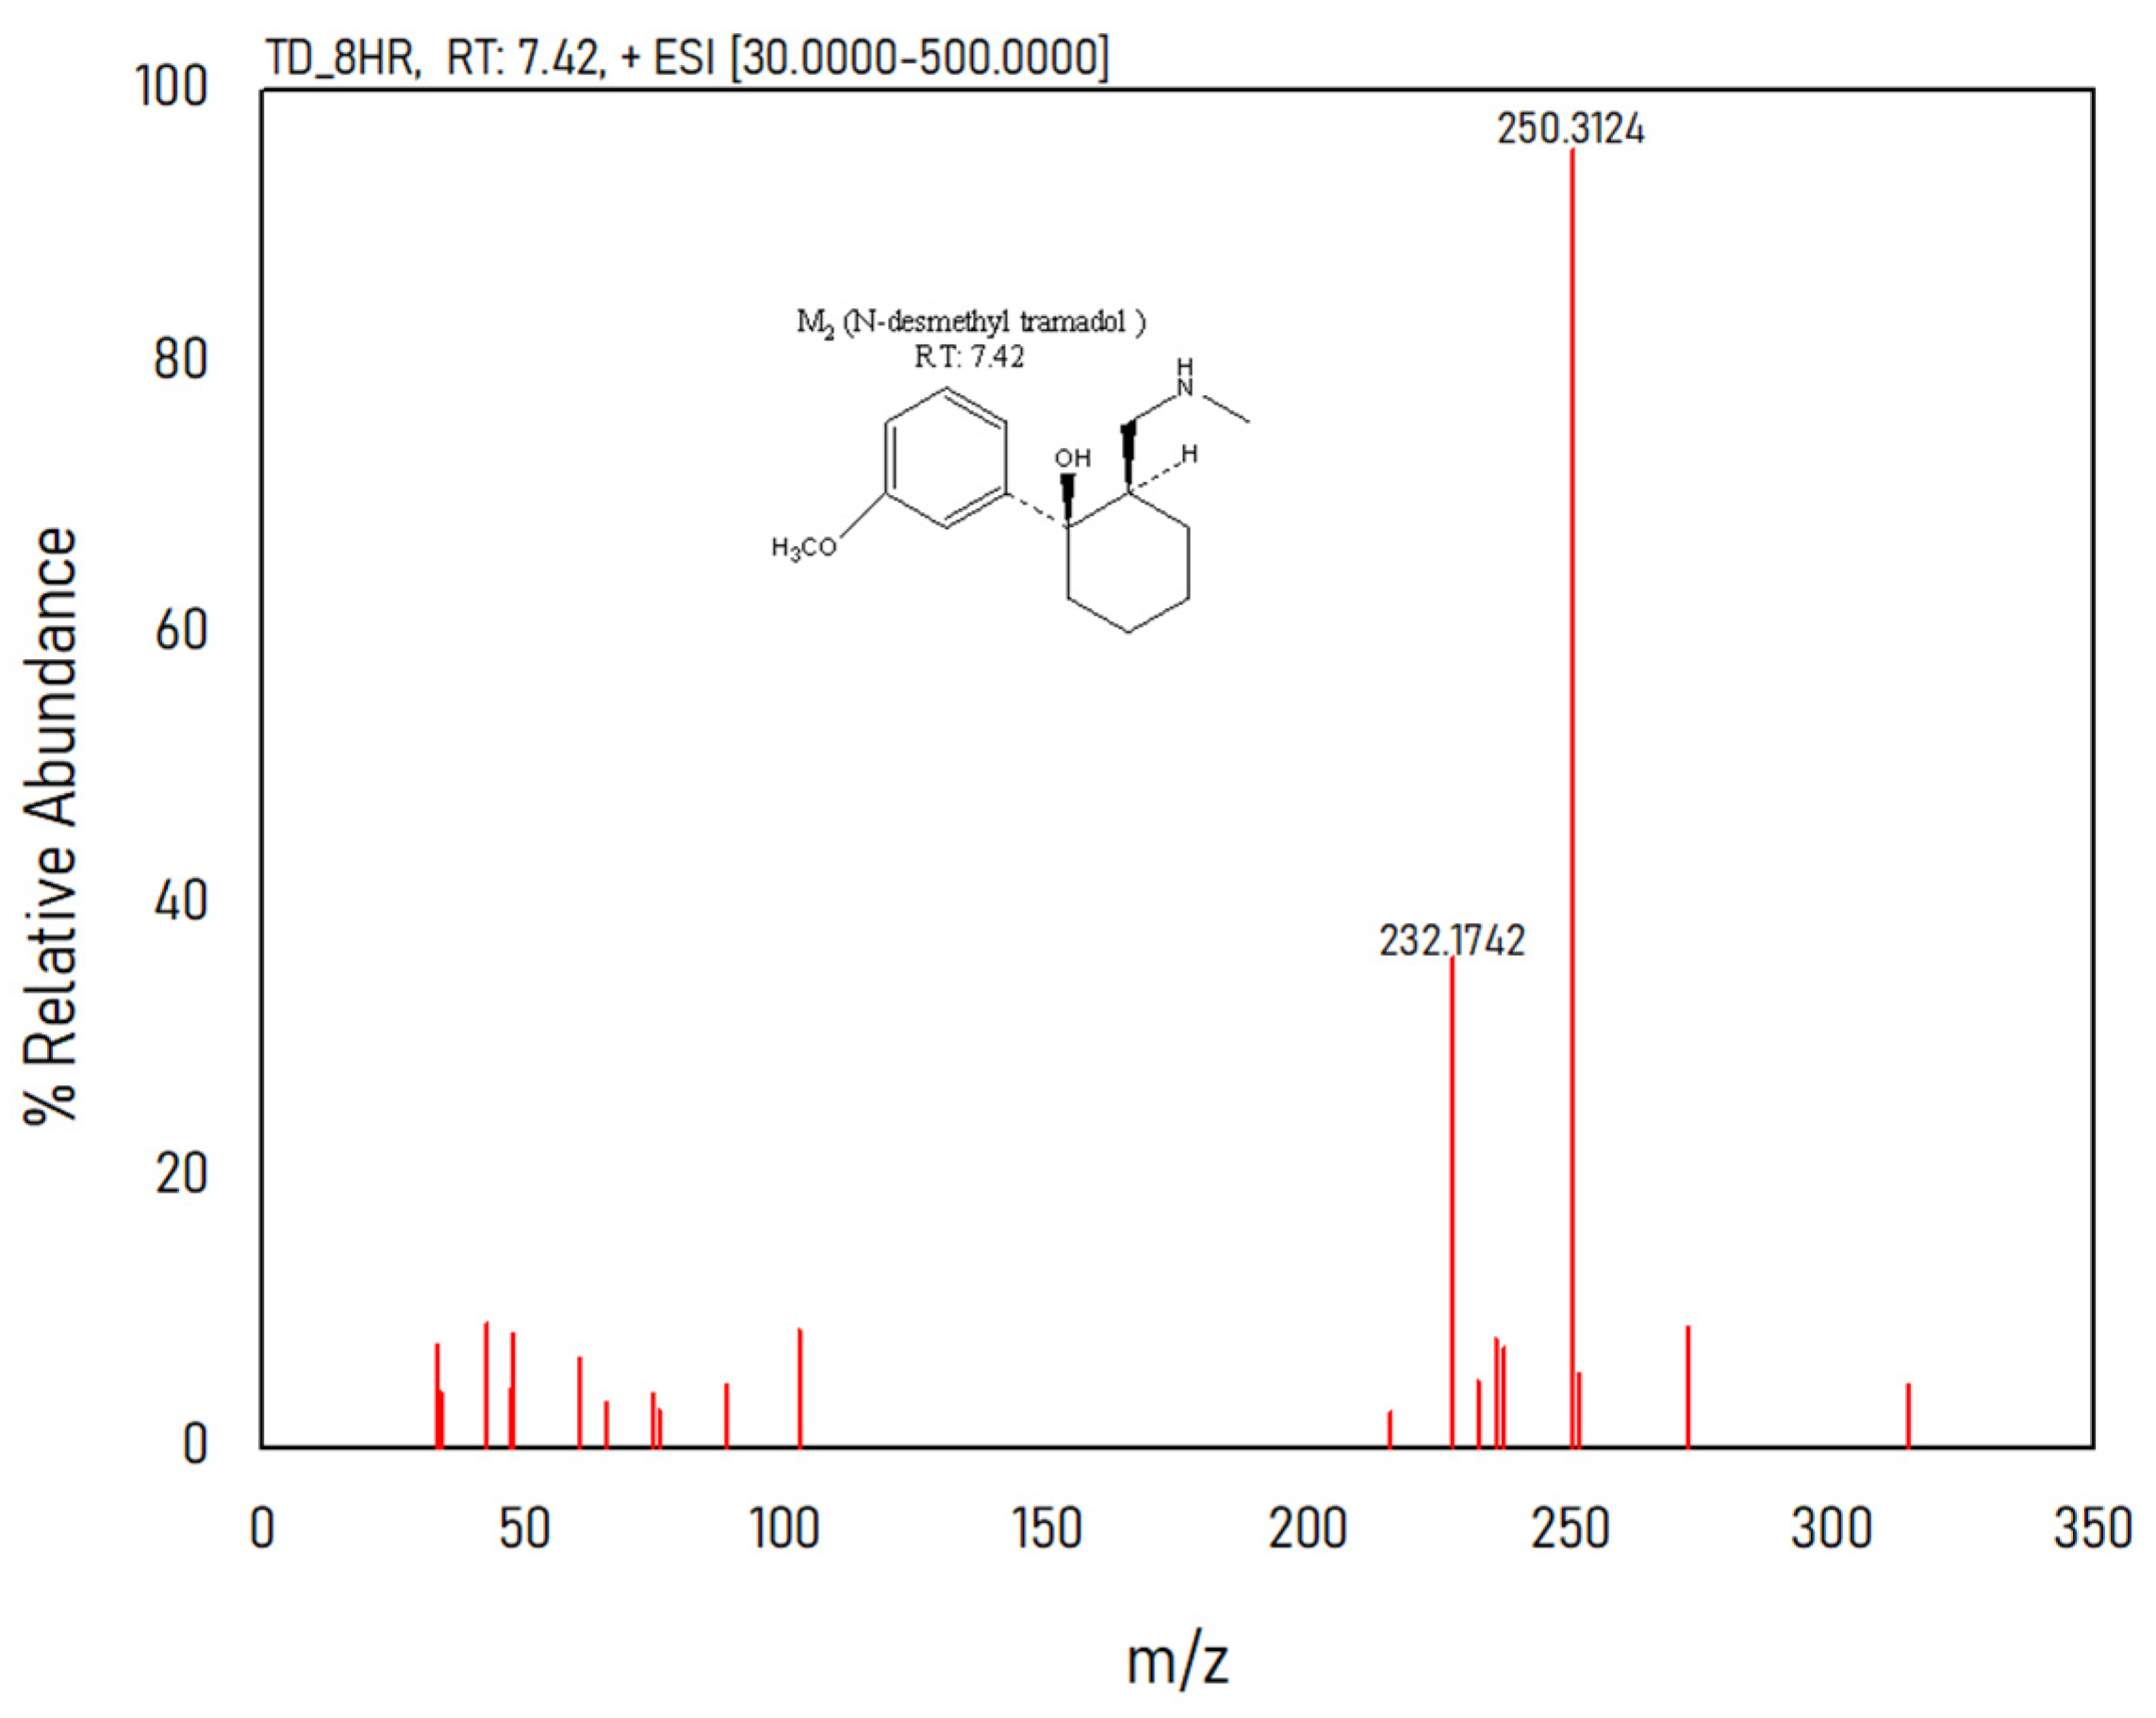
| M2 | N-desmethyl TD | 250.3124 | 7.42 |
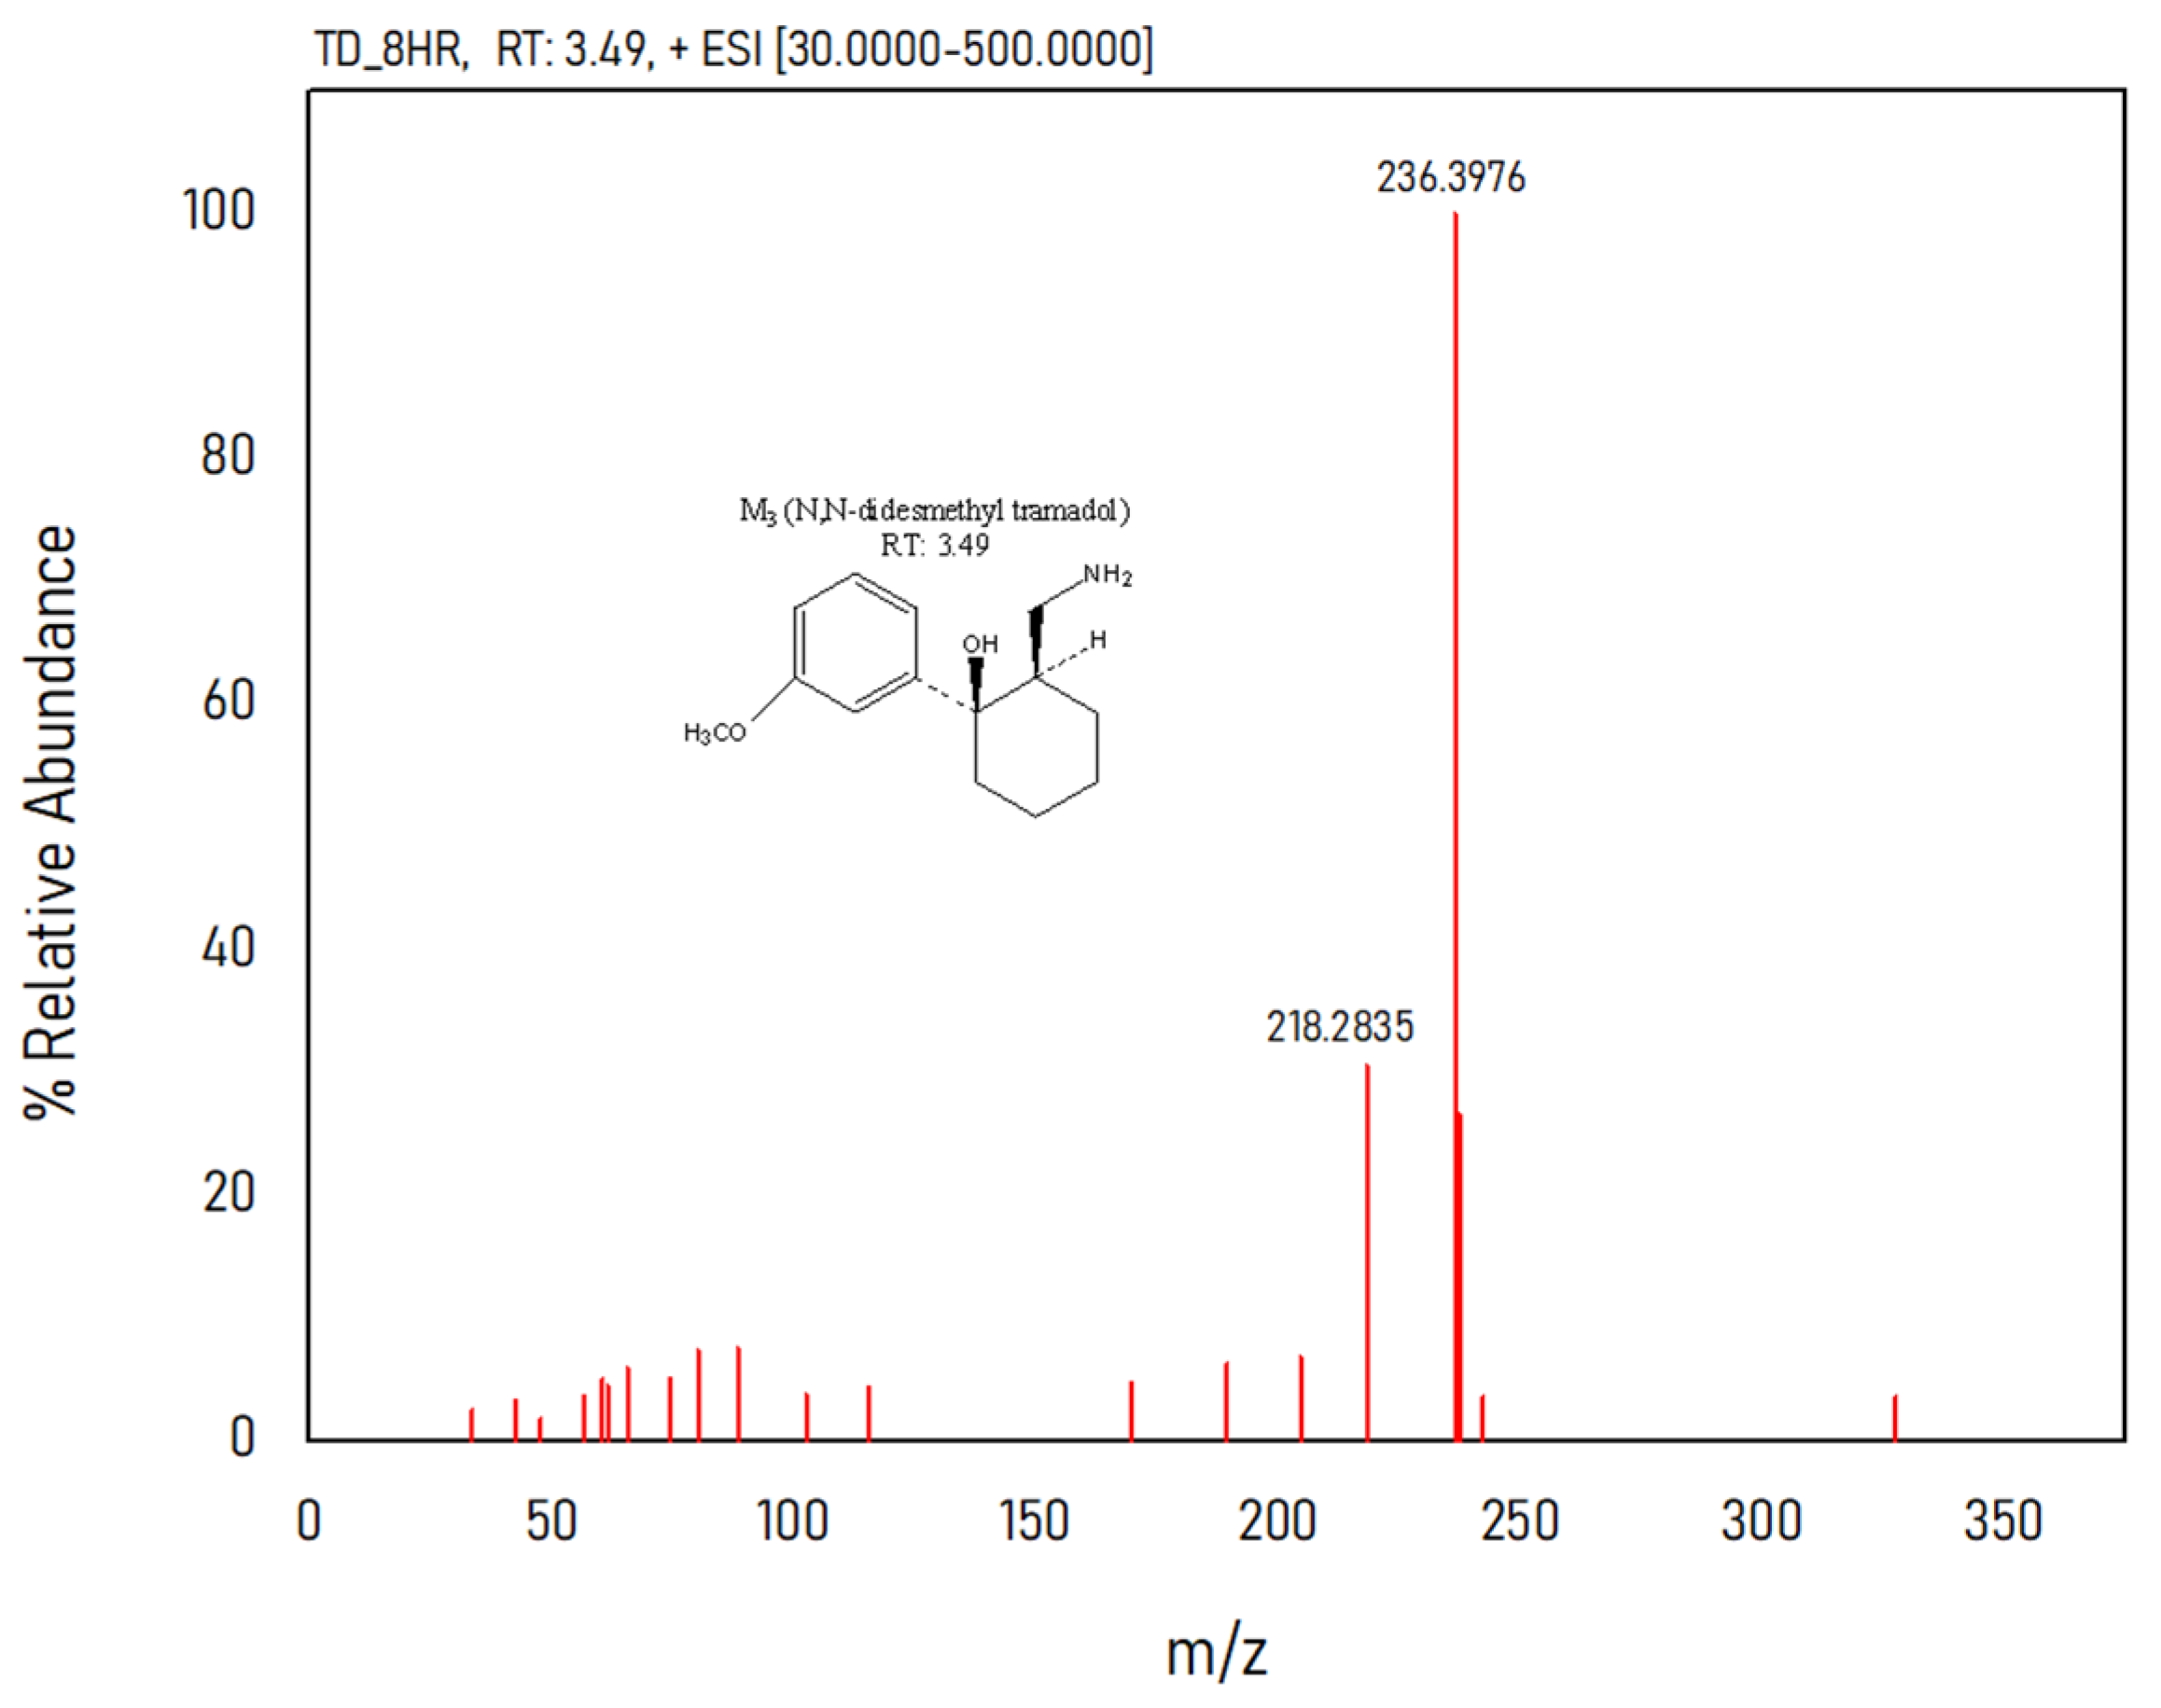
| M3 | N,N-didesmethyl TD | 236.3976 | 3.49 |
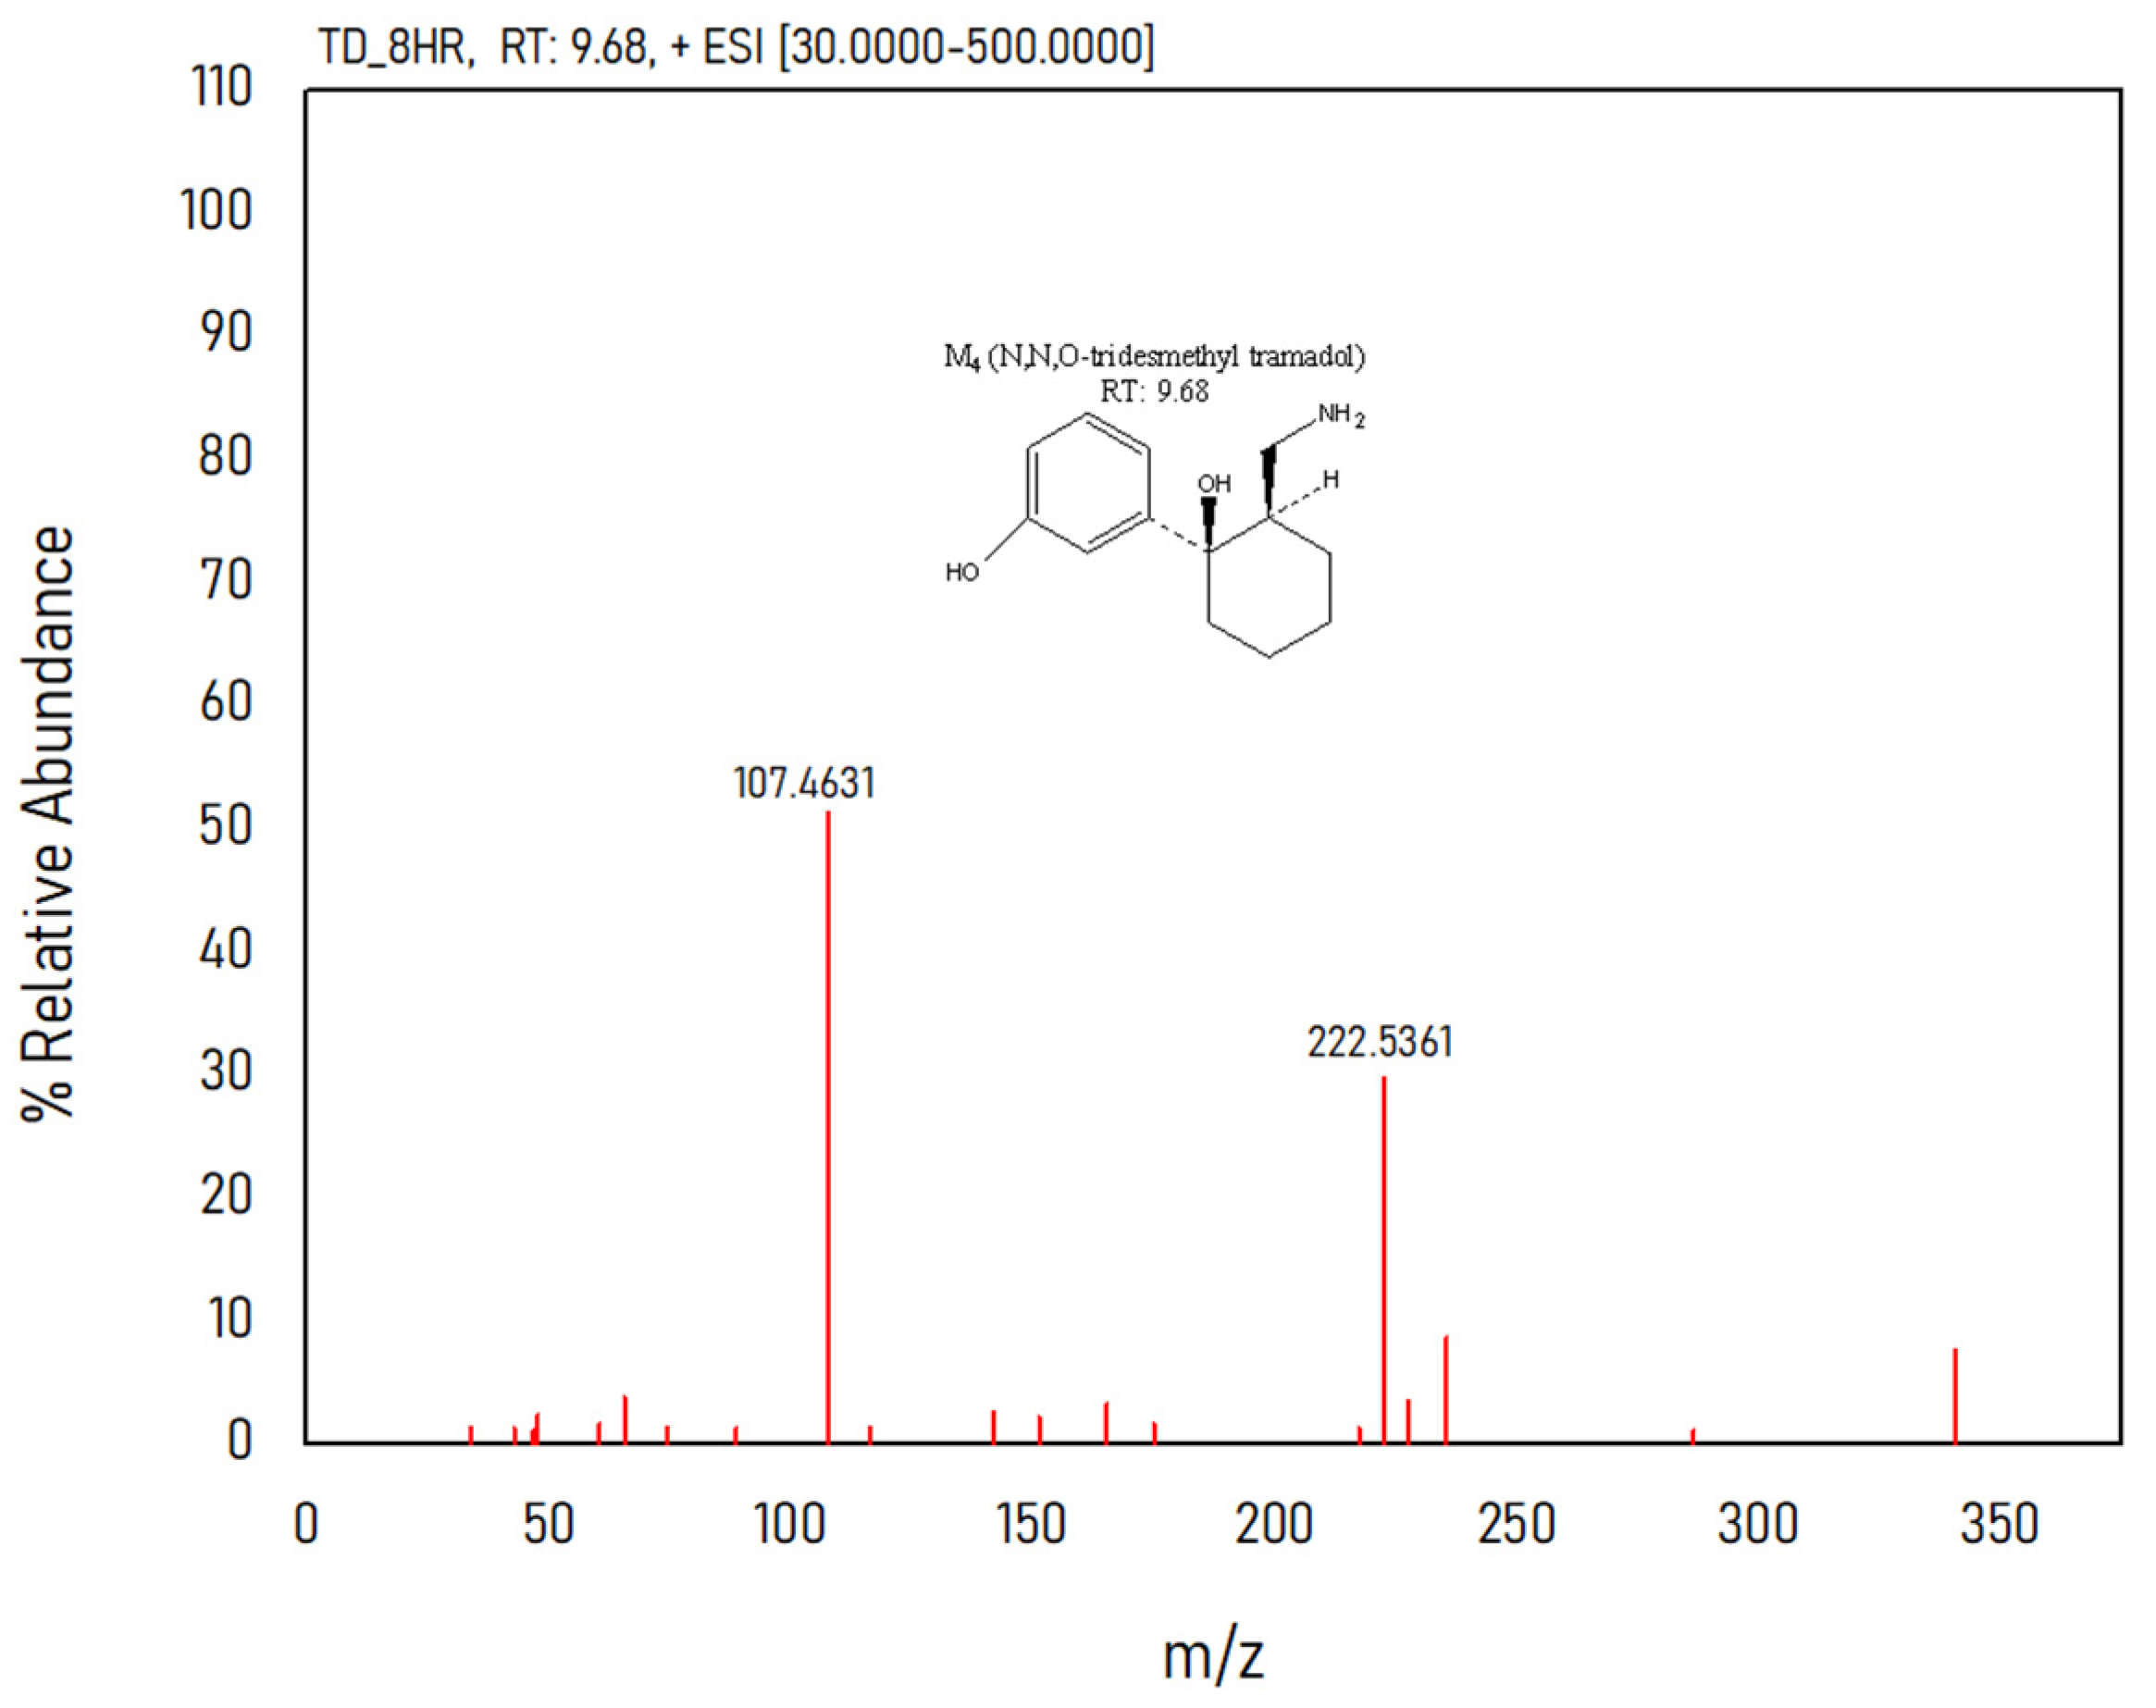
| M4 | N,N,O-tridesmethyl TD | 222.5361 | 9.68 |
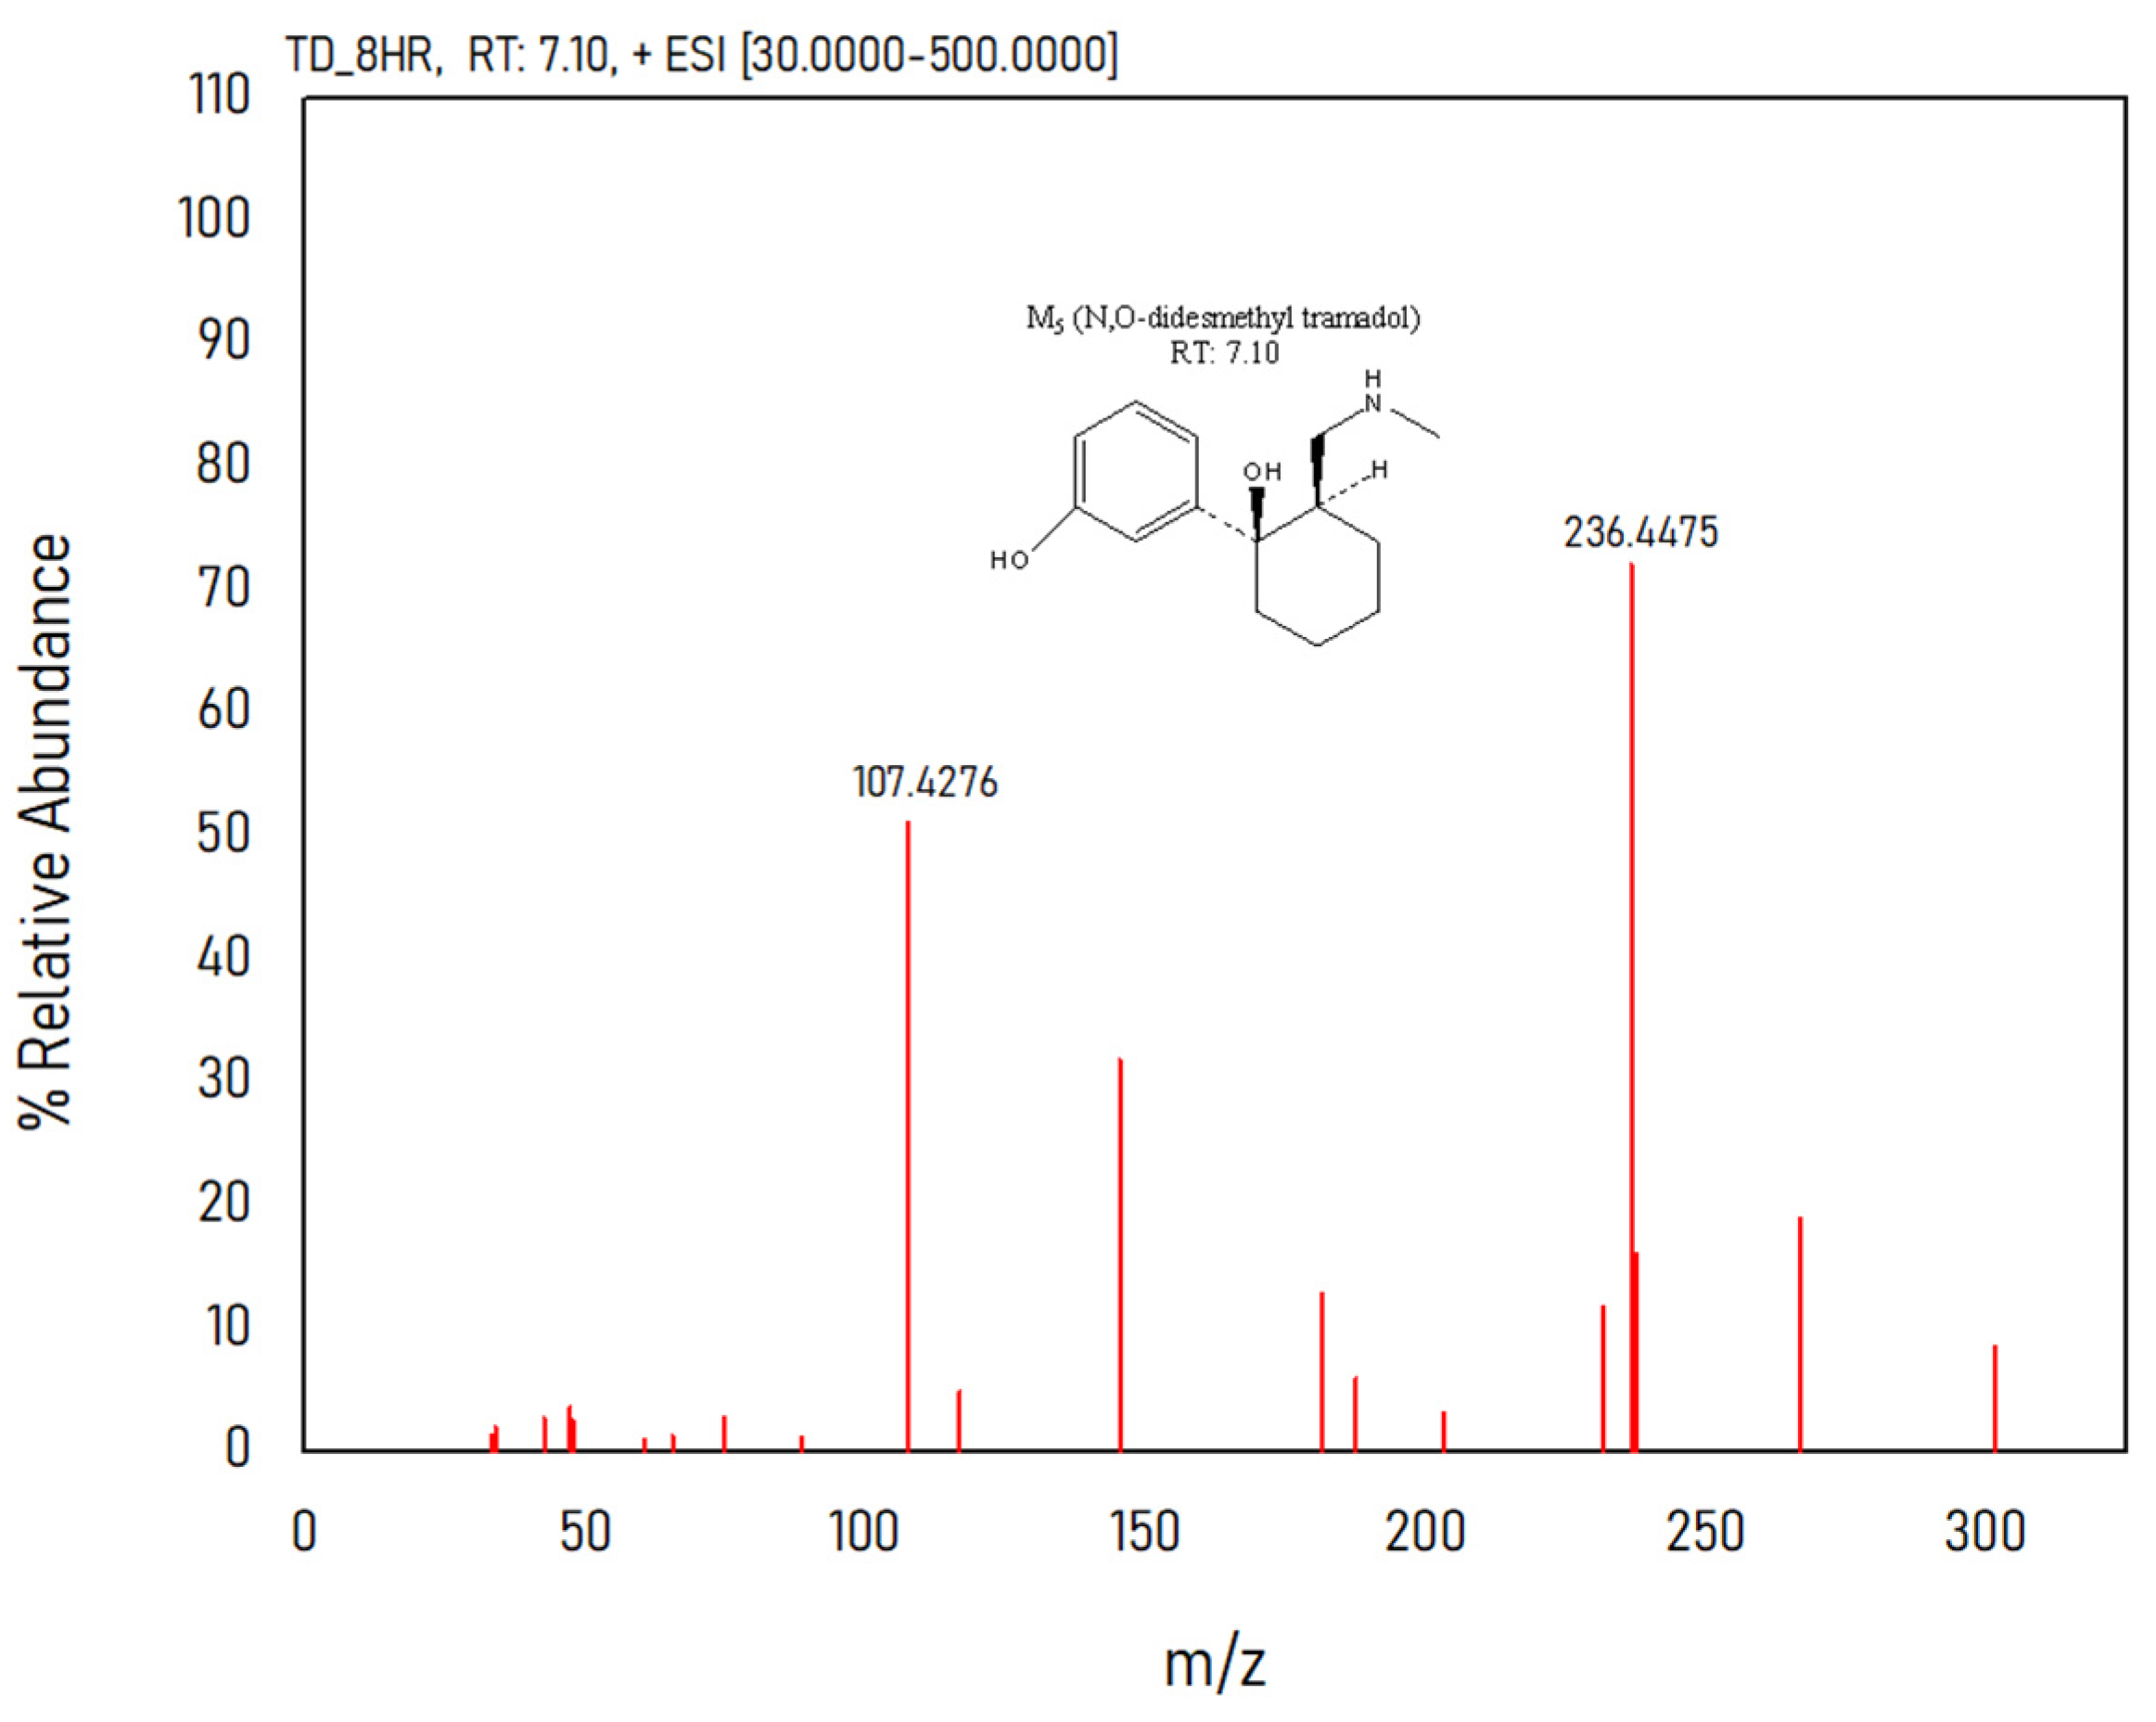
| M5 | N,O-didesmethyl TD | 236.4475 | 7.1 |
| Parameter | TD |
|---|---|
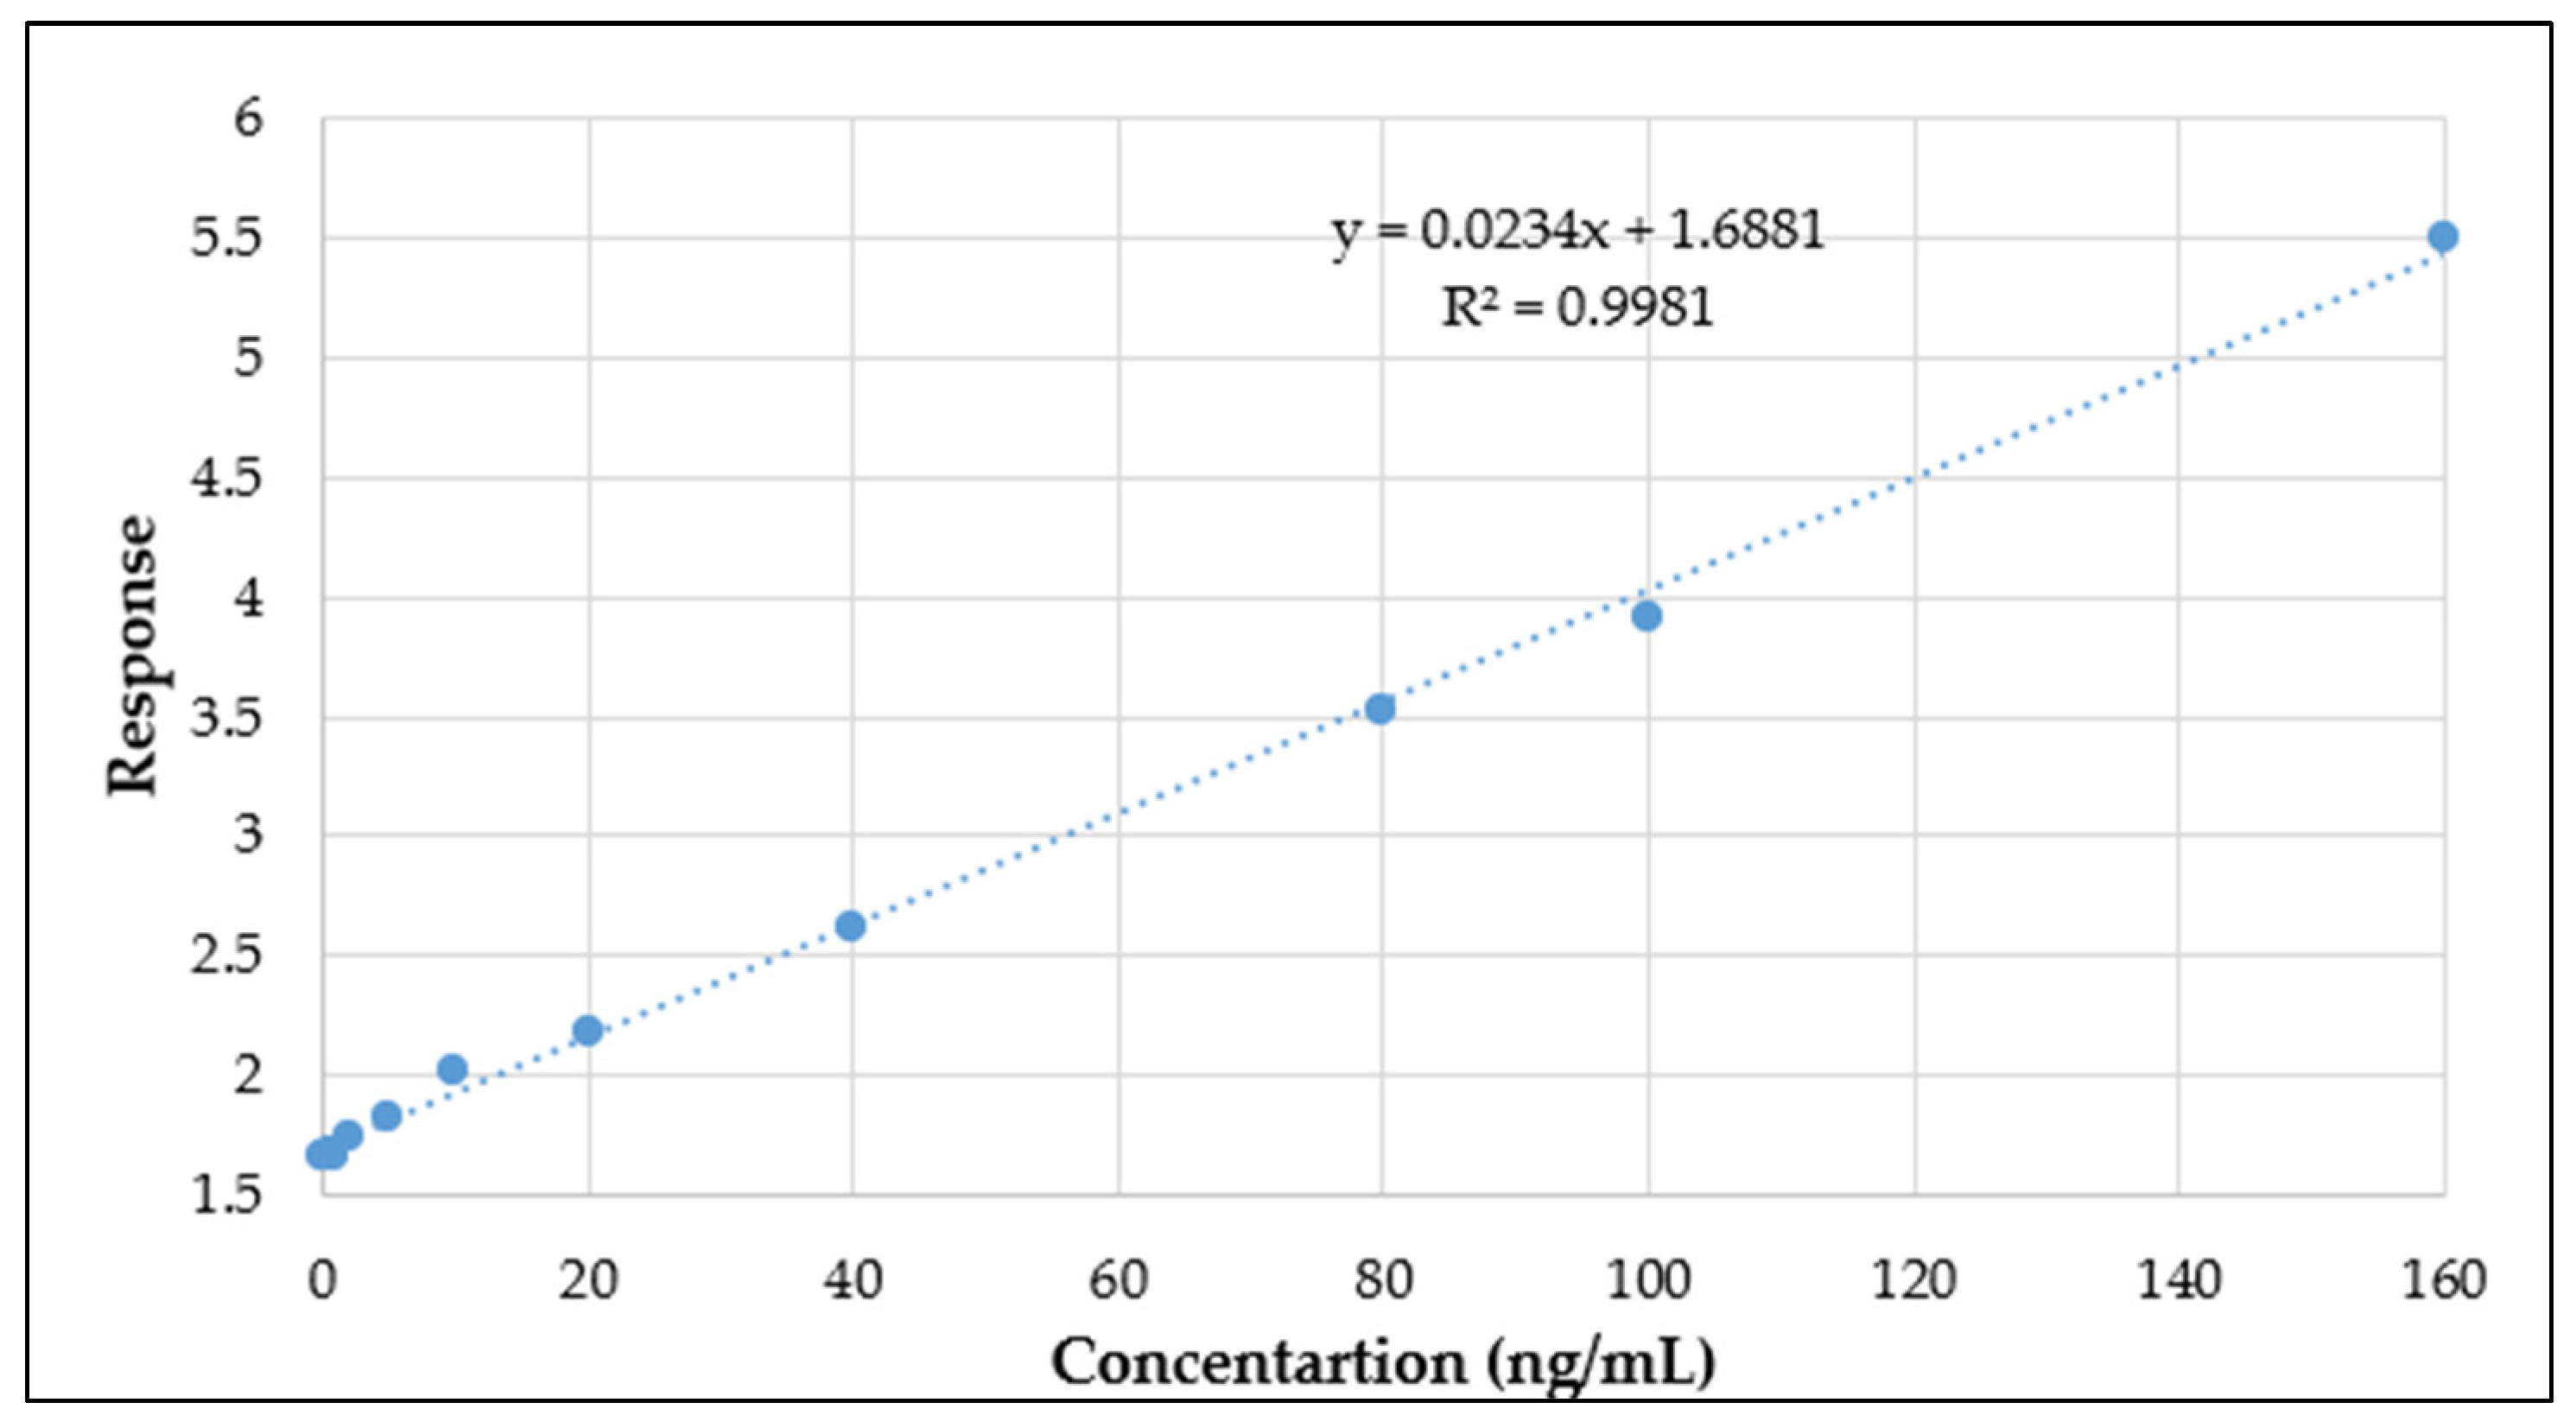
| Linearity (ng/mL) | 0.1–160 |
| Regression equation | y = 0.0234x + 1.6881 |
| Standard deviation of slope | 0.023387819 |
| Standard deviation of intercept | 1.68806942 |
| Correlation coefficient | 0.9981 |
| Limit of detection (ng/mL) | 0.92 |
| Limit of quantification (ng/mL) | 2.7 |
| Analyte | Concentration (ng/mL) | Day 1 | Day 2 | Day 3 | Inter-Day RSD % | Recovery (%) | |||
|---|---|---|---|---|---|---|---|---|---|
| RSD % | Accuracy % | RSD % | Accuracy % | RSD % | Accuracy % | ||||
| TD | 5 | 1.98 | 99.65 | 1.85 | 98.52 | 1.90 | 95.56 | 3.92 | 96.29 |
| 50 | 2.05 | 99.92 | 2.98 | 99.82 | 2.08 | 96.68 | 2.32 | 96.91 | |
| 150 | 3.58 | 100.21 | 2.05 | 97.99 | 1.92 | 97.60 | 2.92 | 94.31 | |
| Ref. | Method | Column | Mobile Phase | Sample Matrix | Extraction Recovery (%) | Extraction Procedure | Analytes Identified | Correlation Coefficient |
|---|---|---|---|---|---|---|---|---|
| [7] | ESI–LC–MS/MS | Phenomenex Luna® Omega 1.6 um polar C18 | CH3OH/H2O (70:30, v/v), 0.1% (v/v) formic acid | Human Plasma and Urine | 86.51–93.38 | LLE | TD | 0.9998 |
| [9] | HPLC | ChromolithTM Performance RP-18e | CH3OH: H2O (13:87, v/v) adjusted to pH 2.5 by phosphoric acid | Human Plasma | - | LLE | TD, M1, and M2 | 0.997 |
| [17] | HPLC | ChromolithTM Performance RP-18e | CH3OH: H2O (19:81, v/v) adjusted to pH 2.5 by phosphoric acid | Human plasma, saliva, and urine | 86.2–92.9 | LLE | TD, M1, M2, and M5 | 0.996 |
| [29] | LC-MS/MS | Aquasil C18 | 1.0 mL, 1 M ammonium trifluoroacetate, and 0.100 mL of HCOOH in CH3OH: H2O (70:30, v/v) a | Human Plasma | 93.6–98 | LLE | TD and M1 | 0.9989 |
| [27] | HPLC-FL, HPLC-MS/MS | Phenomenex Luna® C18 ODS2 | CH3OH plus HCOOH (0.1%): buffer (ammonium acetate, 5 mM, pH 4.5) (30:70, v/v) | Dog urine | 82 | - | TD, M1, M2, and M5 | 0.999 |
| Current Study | ESI–LC-MS/MS | HyPRITY Cl8 column | CH3OH: H2O (35:65) with 0.2% HCOOH | Human Urine | 94.31–96.91 | DLLME | TD, M1, M2, M3, M4, M5, (Phase II metabolites) | 0.9981 |
| Metabolic Pathway | Name | Metabolite | m/z | RT (min) |
|---|---|---|---|---|
| Sulfo- and glucurono- conjugated TD metabolites | M13 | O-desmethyl TD glucuronide | 426.3138 | 6.69 |
| M16 | OH-TD glucuronide | 456.4084 | 6.39 | |
| M15 | N,O-desmethyl TD glucuronide | 412.1774 | 3.81 | |
| oxidative TD derivatives | M6 | OH-TD | 280.3856 | 2.74 |
| M8 | OH-didesmethyl TD | 252.2158 | 1.93 | |
| M32 | OH-O-desmethyl TD | 266.4093 | 4.09 | |
| Sulfo-conjugated TD metabolites | M23 | OH-TD Sulphate | 360.4492 | 3.15 |
| M21 | N, N, O-desmethyl TD sulfate | 302.4325 | 2.14 | |
| M22 | N, O-desmethyl TD sulfate | 316.4469 | 2.42 |
Disclaimer/Publisher’s Note: The statements, opinions and data contained in all publications are solely those of the individual author(s) and contributor(s) and not of MDPI and/or the editor(s). MDPI and/or the editor(s) disclaim responsibility for any injury to people or property resulting from any ideas, methods, instructions or products referred to in the content. |
© 2023 by the authors. Licensee MDPI, Basel, Switzerland. This article is an open access article distributed under the terms and conditions of the Creative Commons Attribution (CC BY) license (https://creativecommons.org/licenses/by/4.0/).
Share and Cite
Chauhan, V.; Sharma, M.; Tiwari, A.; Tiwari, V.; Kumar, M.; Virmani, T.; Kumar, G.; Altwaijry, N.; Al kamaly, O.; Saleh, A.; et al. Development and Validation of Liquid Chromatography-Tandem Mass Spectrometry Method for Simultaneous Determination of Tramadol and Its Phase I and II Metabolites in Human Urine. Separations 2023, 10, 365. https://doi.org/10.3390/separations10060365
Chauhan V, Sharma M, Tiwari A, Tiwari V, Kumar M, Virmani T, Kumar G, Altwaijry N, Al kamaly O, Saleh A, et al. Development and Validation of Liquid Chromatography-Tandem Mass Spectrometry Method for Simultaneous Determination of Tramadol and Its Phase I and II Metabolites in Human Urine. Separations. 2023; 10(6):365. https://doi.org/10.3390/separations10060365
Chicago/Turabian StyleChauhan, Varsha, Manu Sharma, Abhishek Tiwari, Varsha Tiwari, Manish Kumar, Tarun Virmani, Girish Kumar, Najla Altwaijry, Omkulthom Al kamaly, Asmaa Saleh, and et al. 2023. "Development and Validation of Liquid Chromatography-Tandem Mass Spectrometry Method for Simultaneous Determination of Tramadol and Its Phase I and II Metabolites in Human Urine" Separations 10, no. 6: 365. https://doi.org/10.3390/separations10060365
APA StyleChauhan, V., Sharma, M., Tiwari, A., Tiwari, V., Kumar, M., Virmani, T., Kumar, G., Altwaijry, N., Al kamaly, O., Saleh, A., & Alhalmi, A. (2023). Development and Validation of Liquid Chromatography-Tandem Mass Spectrometry Method for Simultaneous Determination of Tramadol and Its Phase I and II Metabolites in Human Urine. Separations, 10(6), 365. https://doi.org/10.3390/separations10060365