Article

Simultaneous Quantification Method of Flavonoids in Jeju Native Citrus from Different Harvest Times Using a High-Performance Liquid Chromatography–Diode Array Detector (HPLC–DAD)

Biodiversity Research Institute, Jeju Technopark, Seogwipo 63608, Republic of Korea
*
Author to whom correspondence should be addressed.
Separations 2023, 10(11), 567; https://doi.org/10.3390/separations10110567
Submission received: 25 October 2023 / Revised: 4 November 2023 / Accepted: 9 November 2023 / Published: 11 November 2023
(This article belongs to the Special Issue Advanced Research on Plant-Based Food Extraction)

Abstract

:
In Jeju-native Citrus, flavonoids are the main contributors to the various types of biological activity, such as antioxidant, antitumor, and anti-inflammatory activity. Thus, we developed simultaneous quantification methods for the analysis of ten bioactive flavonoids in Jeju Citrus fruits (Dangyuja, Gamja, Jigak, Sadugam, and Soyuja) harvested at six different time points using a high-performance liquid chromatography–diode array detector (HPLC-DAD). Separation was performed using a flow rate of 0.8 mL/min, a column temperature of 40 °C, a mobile phase buffer of 0.5% acetic acid, and a detection wavelength of 278 nm. The established analytical method showed good linearity (R2 ≥ 0.9997), precision (inter-day < 0.599%, intra-day < 0.055%), and accuracy (recoveries 92.30–108.80%). The HPLC–DAD method was subsequently applied to analyze flavonoids in Citrus samples. Overall, the quantification results indicated that the compositions and content of flavonoids differed for each Citrus species. The harvesting period also influenced the changes in flavonoid content within each Citrus species. The analytical results with chemometrics revealed that higher flavonoid levels in early-harvested Citrus were derived from the improved fruit size and reduced flavonoid synthesis during maturation. This study provides a practical and reliable method for the analysis of ten flavonoids that can be further utilized in the quality assessment of Jeju Citrus.

1. Introduction

Citrus fruits are important in the global food, pharmaceutical, and cosmetic industries. On Jeju Island, South Korea, a total of 22 unique Citrus species have been grown on a large scale due to the island’s subtropical climate since 476 A.D. [1]. Among them, C. grandis Osbeck, C. benikoji Hort. ex Tanaka, C. aurantium L., C. pseudogulgul Hort. ex Shirai, and C. junos Sieb. ex Tanaka are well-known native species, locally named ‘Dangyuja’, ‘Gamja’, ‘Jigak’, ‘Sadugam’, and ‘Soyuja’, respectively. These native Citrus fruits have been utilized as functional folk medicines due to their numerous health benefits, including antioxidant, antitumor, anti-inflammatory, and anti-obesity effects [2,3].
The beneficial effects of Jeju Citrus fruits are derived from their enriched phytochemicals, such as ascorbic acid, coumarins, carotenoids, limonoids, and dietary fiber [4]. In addition, flavonoids are widely present in Citrus fruits and exhibit health-promoting effects as strong antioxidants [5]. Changes in the flavonoid content are closely related to the stage of Citrus fruit growth [6]. Recent studies have shown that extracts of C. reticulata (Chachi in Chinese) collected at early harvest exhibit higher concentrations of total flavonoids with potent anti-lipase activity [7,8]. The highest level of hesperidin was also found in C. unshiu fruits harvested at the earliest stage of fruit growth [6]. In contrast, studies have shown increased content of nobiletin and tangeretin in C. reticulata × C. paradisi at the mid-maturity stage, and of hesperidin in C. limon (L.) Burm. at the late maturity stage [9,10]. Due to the different optimal harvest times in some species, the accurate analysis of bioactive flavonoids is crucial in increasing the efficacy and usage of Citrus fruits.
As most plant extracts consist of a complex mixture of phytochemicals, a simple, rapid, and reproducible analytical method is required to obtain better experimental results [11]. Several analytical methods have been applied to the analysis of flavonoids in some Citrus species, including high-performance liquid chromatography–diode array detection (HPLC–DAD) [12], nuclear magnetic resonance (NMR) spectroscopy [13], and liquid chromatography–tandem mass spectrometry (LC–MS) [14]. Compared to other approaches, HPLC has been widely used for species differentiation and the standardization of the quality control of foods and herbal plants because of its key advantages, including higher throughput and enhanced separation ability. Previous studies on flavonoids in Jeju-native Citrus have also used HPLC [1,15,16]. However, these studies were performed on Citrus peels or juices, and previous analytical approaches required comparatively long retention times. To the best of our knowledge, no study has developed a simple method for the quantification of flavonoids in Jeju Citrus fruits harvested at different times.
The objective of this study was to develop a novel performance method for the efficient analysis of ten flavonoids (rutin, narirutin, naringin, hesperidin, neohesperidin, quercetin, naringenin, hesperetin, nobiletin, and tangeretin) in Jeju Citrus fruits (Dangyuja, Gamja, Jigak, Sadugam, and Soyuja) harvested at six different time points (from 3 September to 21 November). To thoroughly compare the flavonoid content of the five Jeju native Citrus fruits harvested at six different time points, we applied the established method and then combined the analysis results with chemometrics.

2. Materials and Methods

2.1. Plant Materials

A total of five species of Jeju-native Citrus were used for this research, including ‘Dangyuja’ (Citrus grandis Osbeck), ‘Gamja’ (Citrus benikoji Hort. ex Tanaka), ‘Jigak’ (Citrus aurantium L.), ‘Sadugam’ (Citrus pseudogulgul Hort. ex Shirai), and ‘Soyuja’ (Citrus junos Sieb. ex Tanaka). All Citrus species were cultivated under the same agronomic and environmental conditions at the experimental farm of the Jeju Special Self-Governing Province Agricultural Research & Extension Services (Jeju, Republic of Korea). Samples were collected on six dates: 3 September, 18 September, 4 October, 21 October, 6 November, and 21 November in 2019. The six times of harvesting were decided after referring to previous studies [17,18]. On the harvest day, whole Citrus fruits were washed, cut, ground, and then stored at −80 °C in a deep freezer. Finally, each harvested Citrus sample was freeze-dried and finely ground for further extraction.

2.2. Sample Extraction

The powdered sample (10 g) was mixed with 200 mL of 70% ethanol (v/v) for 24 h, and the mixture was filtered through filter paper (No. 2; Advantec, Tokyo, Japan). After evaporation and lyophilization, the powdered sample extracts (10 mg) were redissolved in 4 mL of 70% methanol (v/v) and sonicated for 10 min. The resulting extracts were filtered through a 0.50 µm PTFE filter (Advantec) and then used for HPLC analysis.

2.3. HPLC Analytical Conditions

The chromatographic analysis was performed using a Dionex UltiMate 3000 HPLC-DAD system (Thermo Fisher Scientific, Waltham, MA, USA). Flavonoids were separated on a Cadenza CD-C18 column (4.6 × 150 nm, 3 µm; Imtakt Corp., Kyoto, Japan) with gradient elution for 39 min. Mobile phases A and B were composed of water containing 0.5% buffer solution and acetonitrile, respectively. The gradient program used in this study was as follows: 0 min, 20% B; 4 min, 20% B; 16 min, 35% B; 28 min, 75% B; 32 min, 75% B; 34 min, 20% B; and 39 min, 20% B. The injection volume was 10 µL. The optimal HPLC analysis condition was selected after performing the elution programs with different flow rates, column temperatures, mobile phase buffers, and detection wavelengths as follows: flow rates of 0.8, 1.0, and 1.2 mL/min; column temperatures of 30, 35, 40, and 45 °C; mobile phase buffers of acetic acid and formic acid; and detection wavelengths of 266 and 278 nm. The validated chromatographic conditions used for sample analysis were a flow rate of 0.8 mL/min, a column temperature of 40 °C, a mobile phase buffer of 0.5% acetic acid, and a detection wavelength of 278 nm.

2.4. Method Validation Process

For method validation, rutin, narirutin, naringin, hesperidin, neohesperidin, quercetin, naringenin, and hesperidin were purchased from Sigme-Aldrich (www.sigmaaldrich.com (accessed on 4 November 2023)). Hesperetin, nobiletin, and tangeretin were obtained from ChemFaces (www.chemfaces.com (accessed on 4 November 2023)). Each standard stock solution was prepared at a concentration of 1000 µg/mL. The stock solutions were diluted with 70% methanol (v/v), and those for hesperidin, neohesperidin, and tangeretin were diluted with dimethyl sulfoxide. The HPLC method was validated by determining a series of parameters, including linearity, precision, accuracy, and chromatographic factors (resolution and asymmetry), in compliance with the International Conference of Harmonization (ICH) Q2 (R1) guidelines [19].

2.4.1. Calibration Curves

Calibration curves were constructed using standard mixtures dissolved in 70% methanol (v/v) at a concentration of 2.5–100 µg/mL. Linear regression equations were used to calculate the peak area versus concentration of each flavonoid. Linearity was demonstrated using correlation coefficients. The limit of detection (LOD) and limit of quantification (LOQ) were measured based on the linear regression approach with the formulas [LOD = 3.3 × σ/S] and [LOQ = 10 × σ/S], where σ represents the standard deviation of the y-intercept and S represents the slope of the calibration curve.

2.4.2. Precision

Inter- and intra-day precision tests were performed three times for each flavonoid at high, medium, and low concentrations (40, 20, and 5 µg/mL, respectively). The inter-day precision was studied by analyzing three different concentrations of each flavonoid with three replicates per day, and the intra-day precision was studied by analyzing three different concentrations of each flavonoid for three consecutive days. The results of the precision test were expressed as percent relative standard deviation (% RSD) using the formula [% RSD = (standard deviation of the measured amounts)/(mean of the measured amounts) × 100].

2.4.3. Accuracy

Accuracy was estimated by performing a recovery study. Experimental data were obtained by analyzing the Dangyuja sample harvested on 3 September, after adding standard solutions at three different concentrations (80, 100, and 120% of the expected quantities) of each flavonoid. These results were compared with those of the analyzed samples without the addition of the standards. All samples were measured in triplicate. The % recovery of each flavonoid was calculated using the formula [% recovery = {(determined amount) − (original amount)}/(added amount) × 100].

2.5. Statistical Analyses

For the visualization of the overall pattern of Citrus species with various harvest periods, principal component analysis (PCA) was performed after normalization with unit-variance scaling using the Soft Independent Modeling of Class Analogy (SIMCA) software (version 17.0; Umetrics, Umeå, Sweden). To compare the content of each flavonoid in Citrus species according to the harvest period, one-way analysis of variance (ANOVA) was conducted using GraphPad Prism 8 (San Diego, CA, USA).

3. Results and Discussion

3.1. Optimization of Chromatographic Conditions

Ten flavonoids (rutin, narirutin, naringin, hesperidin, neohesperidin, quercetin, naringenin, hesperidin, nobiletin, and tangeretin) were chosen as analytes to develop the HPLC-DAD method for 70% ethanol extracts derived from five Citrus species at six different harvest time points. To improve the resolution and selectivity, we first modified the flow rates with three different conditions (0.8, 1.0, and 1.2 mL/min). The overlaid chromatogram shows that the retention time (RT) was shortened by increasing the flow rate (Figure 1A). In addition, the asymmetry factors and resolution were considered to evaluate the perfect peak shape. Generally, asymmetry factors closer to 1.0 represent good Gaussian peaks, and resolution values above 2.0 indicate good separation quality. Considering the asymmetry factors and resolutions, our results indicate that a higher flow rate worsens the peak asymmetry and resolution (Table S1). Consequently, 0.8 mL/min was selected as the flow rate.
Controlling the column temperature is a potential means of improving the method’s reproducibility and RT adjustment. Thus, the effect of the column temperature on the flavonoid analysis was also tested under column temperatures of 30, 35, 40, and 45 °C. With an increase in the column temperature, the analytical results were obtained faster, but the peak asymmetry became slightly worse (Figure 1B, Table S2). The resolution was constant at all column temperatures. However, a higher column temperature has the advantage of reducing the column back pressure. Considering all the results and factors, 40 °C was chosen for our method.
Adjusting the pH of the mobile phase by adding a buffer is essential in achieving desirable separation. Among the developed HPLC methods, acidified water solvents such as acetic acid, formic acid, and trifluoroacetic acid are common choices [11]. In this study, the influence of the mobile phase buffer was examined using two popular buffers: acetic acid and formic acid. When 0.5% formic acid was used as a buffer for the mobile phase, the baseline fluctuated and a ghost peak appeared in front of the tangeretin peak (Figure 1C). In contrast, a mobile phase with 0.5% acetic acid led to optimal HPLC performance without a baseline shift or any interference. Therefore, acetic acid (0.5%) was used for the mobile phase.
Additionally, the effect of the detection wavelength was inspected at 266 and 278 nm, where the 10 flavonoids had common absorption characteristics. When comparing each peak height, rutin and quercetin demonstrated stronger absorbability at 266 nm but narirutin, naringin, hesperidin, neohesperidin, naringenin, hesperetin, nobiletin, and tangeretin showed stronger absorbability at 278 nm (Figure 1D). Based on these results, 278 nm was selected for the HPLC method in this study.

3.2. Analytical Method Validation

Chromatograms of ten flavonoid standards were obtained by using the optimized method (flow rate of 0.8 mL/min, column temperature of 40 °C, mobile phase buffer of 0.5% acetic acid, and detection wavelength of 278 nm) (Figure S1). The HPLC method successfully separated the 10 compounds within the range of 4.88–26.70 min. Compared with previous studies, the total separation time was shortened, and more flavonoids could be analyzed [14].
To validate this method, the linearity, LOD, and LOQ were assessed by drawing calibration curves for each flavonoid. Generally, a correlation coefficient (R2) close to one indicates a strong linear relationship. Under the linear ranges of all flavonoid compounds from 2.5 µg/mL to 100 µg/mL, we obtained R2 values of over 0.999 (Table 1). The LOD and LOQ values of the target flavonoids were in the range of 0.0527–0.4395 µg/mL and 0.1598–1.3317 µg/mL, respectively, which meant that the developed method had good sensitivity.
To determine the instrumental precision, inter- and intra-day precision tests were conducted. The stability of analytical methods is expressed by low % RSD values. In this study, the inter-day precision for the RTs and peak areas was less than 0.116 and 0.318%, respectively, and the intra-day precision for the RTs and peak areas was less than 0.012 and 0.034%, respectively (Table 2). These results indicated that the proposed method was reliable and reproducible.
The optimized method was subsequently applied to a recovery test to analyze its accuracy. Accuracy is defined as the closeness of agreement between the value accepted as a conventional true value and the value identified [20,21]. In some cases, analytical samples supposed to be pure might contain other substances, such as impurities, related substances, or matrices. In the present study, Dangyuja harvested on 3 September was selected for the recovery test because it was expected to display large interference derived from the high analyte content and the large number of analytes. In our results, the recovery values were in the range of 95.06–107.97% with an RSD less than 4.834% (Table 2). In general, a % recovery value close to 100% is considered desirable, whereas a % recovery value in the range of 80–120% is considered acceptable. Our results confirm that the proposed method has acceptable accuracy.

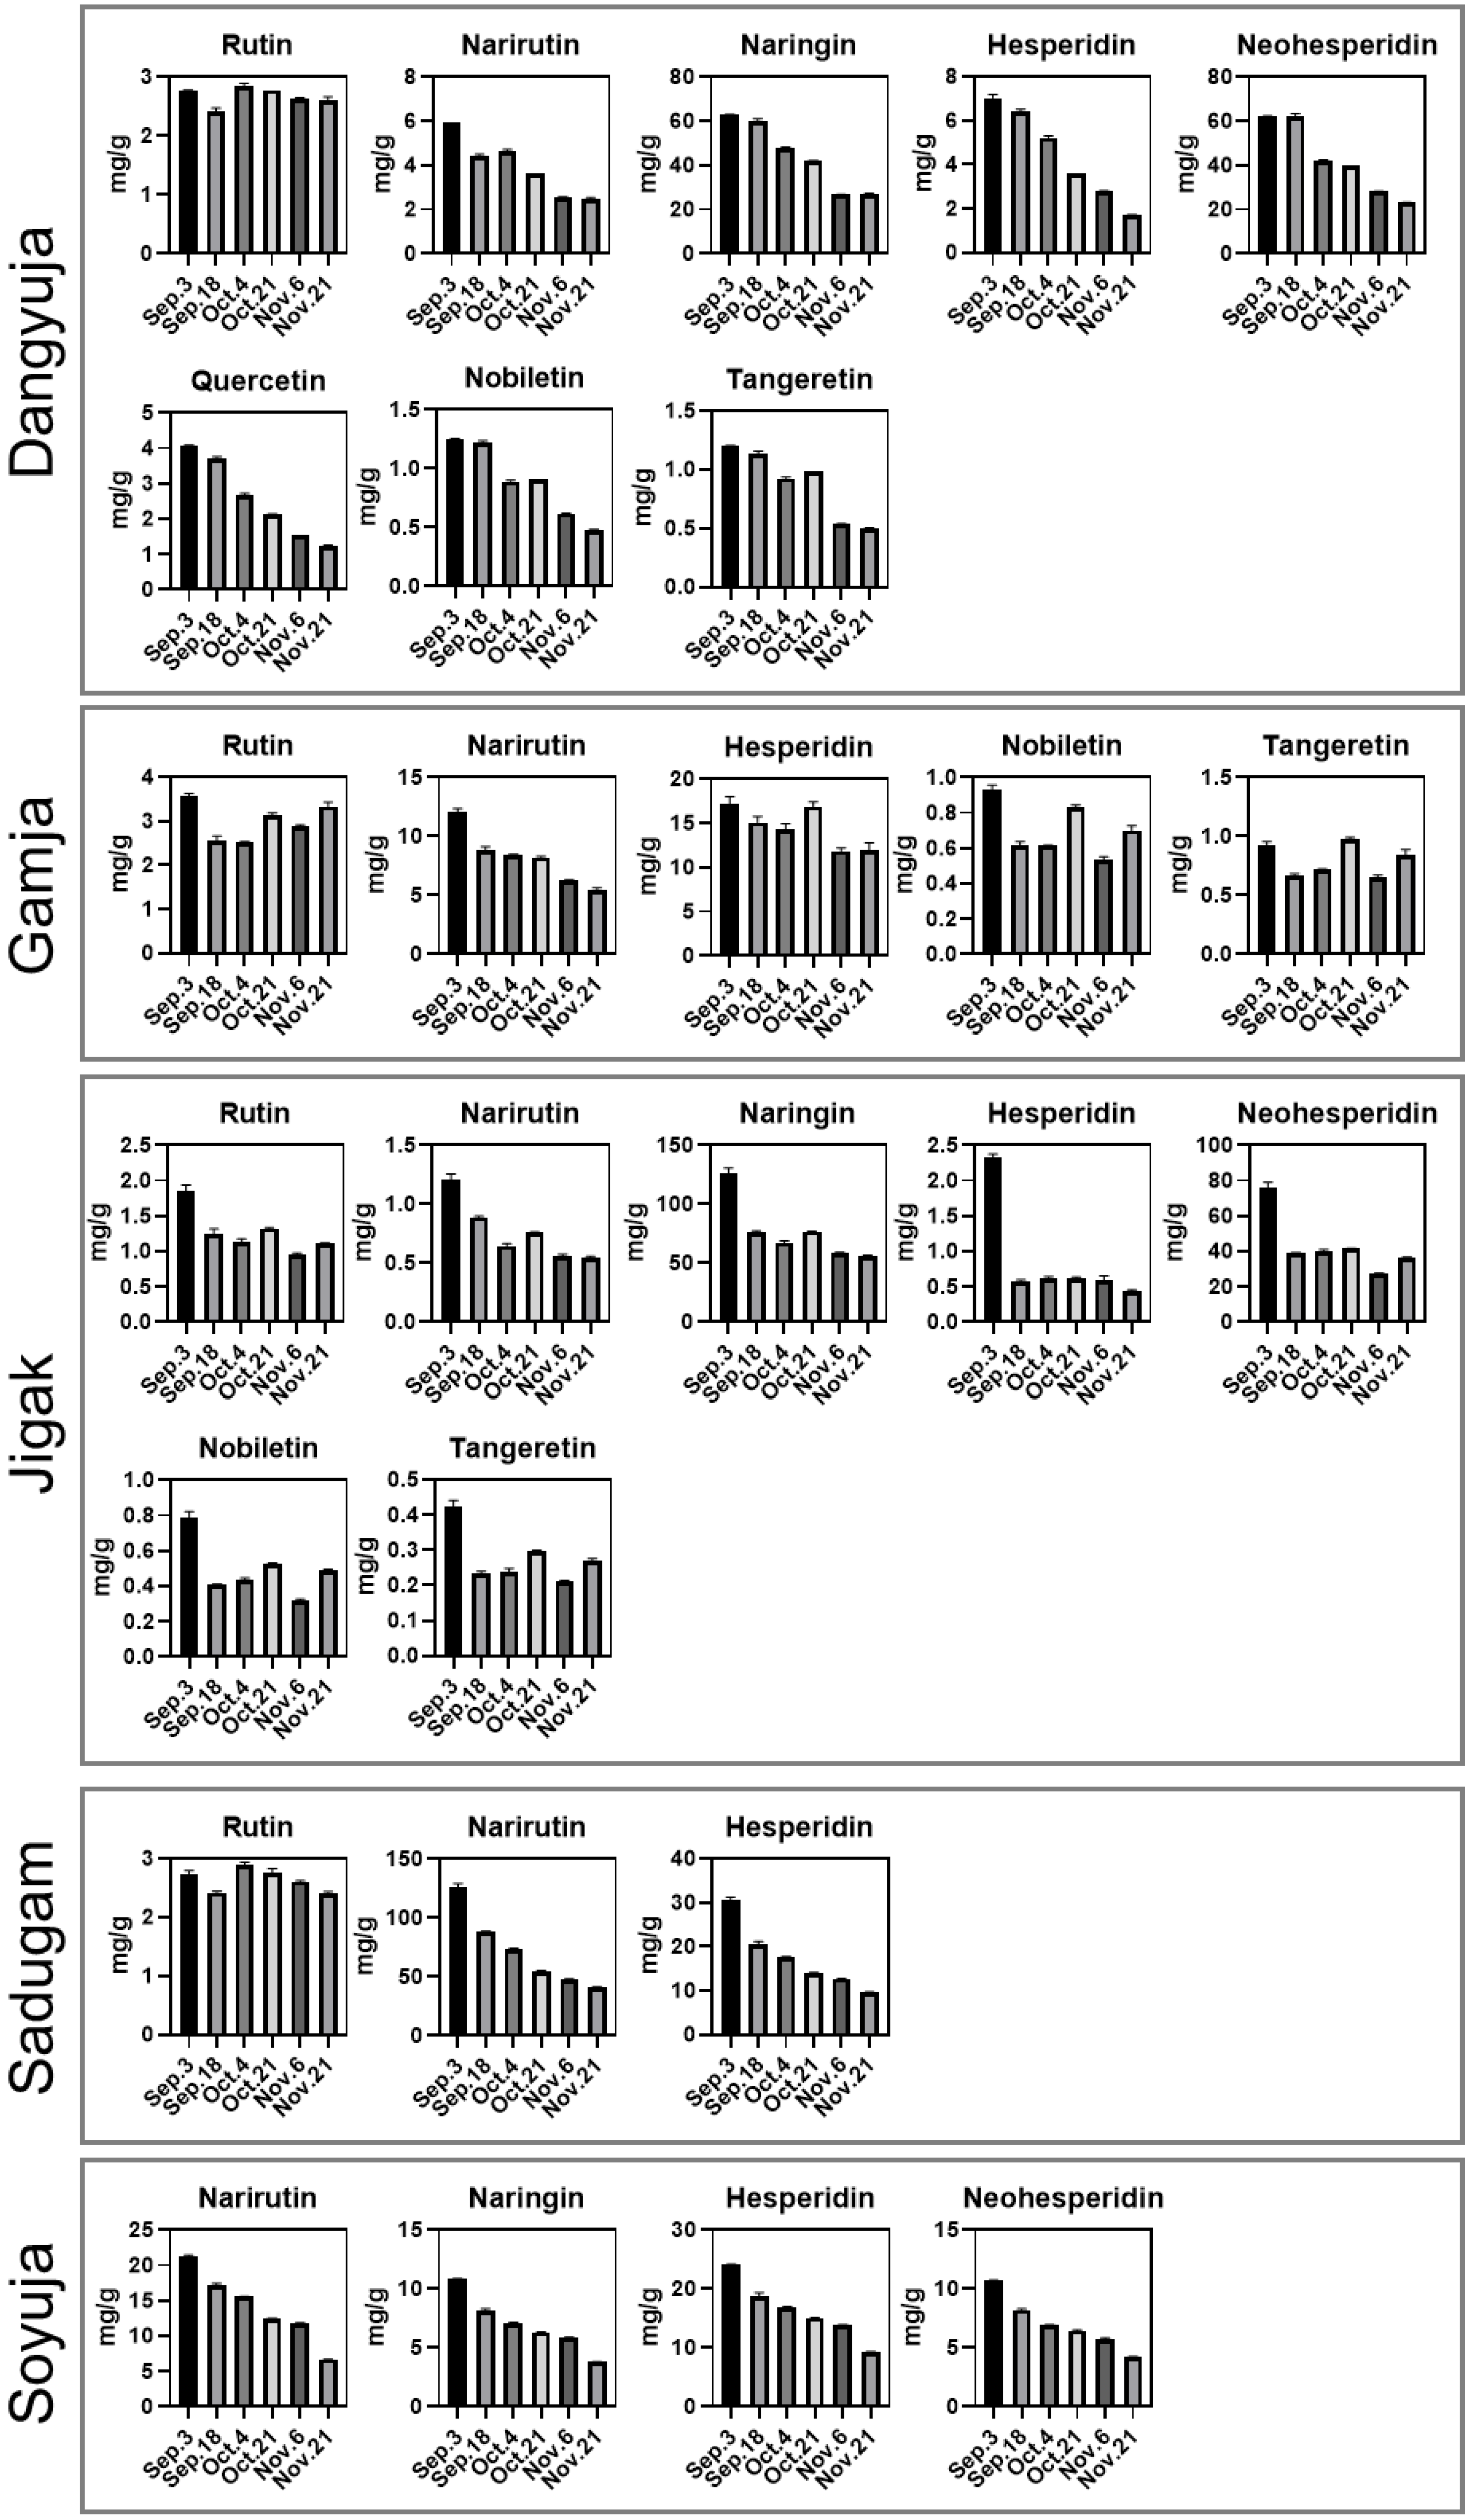
3.3. Quantification of Flavonoids in Citrus Species

The flavonoid content of five types of Citrus species (Dangyuja, Gamja, Jigak, Sadugam, and Soyuja) harvested on six different dates (3 September, 18 September, 4 October, 21 October, 6 November, and 21 November) was analyzed using the optimized HPLC method (Figure S2). The content of each flavonoid in Citrus fruit extracts was calculated according to the calibration curves shown in Table 1. After comparing the RT and UV spectra of the peaks with those of the standards, a maximum of eight flavonoids were identified in the samples, excluding naringenin (aglycone form of naringin) and hesperetin (aglycone form of hesperidin) (Table 3). Independently of the harvest date, the amounts of total flavonoids were compared among the five Citrus species. The highest concentration was found in Jigak and ranged from 95.59 to 209.72 mg/g. Dangyuja and Sadugam also contained high levels of total flavonoids that ranged from 59.03 to 147.55 mg/g and from 52.86 to 159.82 mg/g, respectively. Soyuja and Gamja showed comparatively low levels of total flavonoids in the range of 24.03 to 67.29 mg/g and 22.36 to 34.93 mg/g, respectively. Previous work found that the total flavonoid content was highest in Jagak peels (ranging from 135.30 to 145.33 mg/g), whereas it was lowest in Sadugam peels (ranging from 2.79 to 8.35 mg/g) [22]. This result is slightly in contrast to our findings. The differences might be caused by various factors, such as the plant parts, extraction methods, and environmental conditions during cultivation or storage.
For the individual compounds, hesperidin and narirutin were the two main compounds in Gamja, Sadugam, and Soyuja extracts (Table 3). Our findings are in agreement with previous reports that have revealed that hesperidin is one of the most abundant flavonoids in most Citrus fruits, and narirutin and hesperidin are the two major compounds in Gamja, Sadugam, and Soyuja juice [15,23]. However, in Dangyuja and Jigak extracts, naringin and neohesperidin were the two dominant compounds (Table 3). Kim et al. (2009) suggested that Dangyuja has higher amounts of naringin and neohesperidin than other flavonoid compounds, which induces antioxidant activity [24]. Yang et al. (2019) also reported that Dangyuja and Jigak could be regarded as functional materials for citrus juice because of their high amounts of naringin and neohesperidin [25]. Regarding biosynthetic pathways, both flavanone 7-O-rutinosides (e.g., hesperidin and narirutin) and flavanone 7-neohespedidoside (e.g., naringin and neohesperidin) were derived from glucosylated flavanones [26]. However, the flavanone glucosides are biotransformed either to rutinoside by 1,6-rhamnosyltransferase (1,6RhaT) or to neohesperidoside by 1,2-rhamnosyltransferase (1,2RhaT) [26]. This may explain why hesperidin and narirutin were extremely co-accumulated in Gamja, Sadugam, and Soyuja by activated 1,6RhaT and naringin and neohesperidin were accumulated together by activated 1,2RhaT. Corroborating the previously described data, our results showed that the composition and content of flavonoids varied depending on the Citrus species.
PCA was subsequently applied to outline all the data and find novel patterns in the complex datasets formed from 30 Citrus samples (five Citrus species harvested at six different periods) with eight variables (flavonoids detected in the samples). The two highest-ranking principal components (PCs) of the score plot accounted for 77.0% of the total variance, indicating that the two PCs were sufficient to explain the variability (Figure 2). The percentage of variables for the PCs was 50.6% for the first and 26.4% for the second. In the score plot, the samples were grouped according to similarities in their metabolic properties, and both PC1 and PC2 largely contributed to the separation of Citrus species. In particular, the highest-ranking PC separated Dangyuja and Jigak from the other three species. This result supports previous reports regarding genetic variations occurring within Citrus species based on sequence analysis [27,28]. Hong et al. (2015) revealed that C. aurantium and C. grandis shared a high similarity rate, forming one monophyletic group [27]. Nicolosi et al. (2000) also found that C. aurantium and C. grandis were clustered together on a 50% majority rule consensus tree obtained from RAPD and SCAR data [28]. Our results may reflect the fact that the genotypes involved in the construction of phylogenetic relationships are connected to flavonoid metabolism. Moreover, for each Citrus species, most samples drifted apart from 3 September to 21 November, except for Gamja, where all harvesting periods were clustered together in the middle (Figure 2). Additionally, in Jigak, a clear separation was observed between the earliest harvested sample (on 3 September) and the others on the y-axis. Our PCA results presented various clustering patterns for samples, associated with the harvesting period as well as the Citrus species.
To determine whether the characteristic flavonoids in each Citrus fruit varied depending on the harvest time, ANOVA was conducted for flavonoids that were commonly detected in samples over the whole period. Significantly different samples among harvest dates were identified with p-values of less than 0.05 and then visualized in box plots (Figure 3). In the Dangyuja samples, all detected flavonoids, except rutin, showed decreasing patterns over time. In the Soyuja samples, the narirutin, naringin, hesperidin, and neohesperidin levels gradually decreased from the 3 September to 21 November time points. These patterns for narirutin and hesperidin were similar in the Sadugam samples. For the Jigak samples, all analyzed compounds in the mid to late time points showed fluctuating patterns, but the levels of these compounds were significantly higher in the earliest harvest time point. Regarding the Gamja species, we observed a significantly decreasing pattern for the narirutin content based on the harvesting date. These results indicate that the decreasing patterns of flavonoid components were consistent among the five Citrus groups and were significantly correlated with fruit maturation. Unlike other plants that tend to accumulate flavonoids in mature tissues and organs, Citrus species produce large amounts of flavonoids during the immature season [29]. During the elongation and subsequent maturation process of Citrus fruits, most flavonoid production slows or even stops due to the expression of chalcone synthase-1 and chalcone isomerase, the rate-limiting enzymes in flavonoid biosynthesis [30,31]. Consequently, there are smaller amounts of flavonoids per tissue volume as Citrus organs grow because of the dilution effect [29,30]. Taken together, our results support that the comparatively higher levels of flavonoids in unripe Jeju-native Citrus might be due to the improved fruit size and reduced flavonoid synthesis through chalcone synthase and isomerase during maturation. On the other hand, unlike other compounds, the content of rutin in Citrus species fluctuated over time from 3 September to 21 November (Figure 3). A previous study of Citrus peels indicated that rutin exhibited no significant correlations with the fruit development time as well as other flavonoids (e.g., narirutin naringin, and neohesperidin) [32]. The irregular rutin content in Jeju-native Citrus fruits during maturation confirms the previous research presenting no significant correlations with both the fruit growth stage and other flavonoids. The various patterns of flavonoid levels derived from Citrus species and the harvest periods could be further utilized to assess the quality of raw Citrus fruits during farming, harvesting, and the processing of the materials. In addition, further investigations are required in order to identify the detailed biosynthesis mechanisms of the flavonoids activated during fruit development in individual Citrus species.

4. Conclusions

This study investigated an efficient method for the simultaneous determination of ten flavonoids (rutin, narirutin, naringin, hesperidin, neohesperidin, quercetin, naringenin, hesperidin, nobiletin, and tangeretin) in five types of Citrus species fruits (Dangyuja, Gamja, Jigak, Sadugam, and Soyuja) harvested on six different dates (3 September, 18 September, 4 October, 21 October, 6 November, and 21 November) using HPLC–DAD. The parameters affecting the chromatographic conditions, such as the flow rate, column temperature, mobile phase buffer, and wavelength, were optimized in the robustness study. The established analytical method was validated with good linearity, precision, and accuracy, indicating its reliability and reproducibility. In addition, this method was applied to quantify flavonoids from five Citrus species harvested at six different time points. Quantification results showed that hesperidin and narirutin were dominant in Gamja, Sadugam, and Soyuja, whereas naringin and neohesperidin were dominant in Dangyuja and Jigak. The PCA and ANOVA results presented significant variances among the five Citrus groups and revealed that higher amounts of flavonoids were obtained from unripe fruits in each Citrus group. These results suggest that immature Jeju Citrus fruits containing large amounts of flavonoids could be utilized as health-promoting materials. In conclusion, we have demonstrated that this analytical method is suitable for the quantification of Citrus flavonoids and that this method can be further applied to the quality assessment of various Citrus fruits.

Supplementary Materials

The following supporting information can be downloaded at: https://www.mdpi.com/article/10.3390/separations10110567/s1, Table S1: Summary of system suitability parameters for HPLC analysis of 10 flavonoids with different flow rates (0.8, 1.0, and 1.2 mL/min); Table S2: Summary of system suitability parameters for HPLC analysis of 10 flavonoids with different column temperatures (30, 35, 40, and 45 °C); Figure S1: Representative HPLC chromatogram of 10 flavonoid standards. Plot annotation: 1, Rutin; 2, Narirutin; 3, Naringin; 4, Hesperidin; 5, Neohesperidin; 6, Quercetin; 7, Naringenin; 8, Hesperein; 9, Nobiletin; 10, Tangeretin; Figure S2: Representative HPLC chromatograms of 70% ethanolic extracts of (A) Dangyuja, (B) Gamja, (C) Jigak, (D) Sadugam, and (E) Soyuja harvested on 3 September. Chromatograms were achieved under optimized HPLC conditions. Plot annotation: 1, Rutin; 2, Narirutin; 3, Naringin; 4, Hesperidin; 5, Neohesperidin; 6, Quercetin; 7, Nobiletin; 8, Tangeretin.

Author Contributions

Conceptualization, H.B.H., B.G. and S.-A.Y.; methodology, H.H. and H.B.H.; validation, H.H.; formal analysis, H.H.; investigation, H.H. and S.C.K.; resources, H.B.H., S.C.K. and B.G.; data curation, H.H.; writing—original draft preparation, H.H.; writing—review and editing, Y.-M.H.; visualization, H.H.; supervision, Y.-H.J. and Y.-M.H.; project administration, Y.-H.J. and Y.-M.H. All authors have read and agreed to the published version of the manuscript.

Funding

This research received no external funding.

Data Availability Statement

The data presented in this study are available upon request from the corresponding author.

Conflicts of Interest

The authors declare no conflict of interest.

References

  1. Kim, J.W.; Ko, H.C.; Jang, M.G.; Han, S.H.; Kim, H.J.; Kim, S.J. Phytochemical Content and Antioxidant Activity in Eight Citrus Cultivars Grown in Jeju Island According to Harvest Time. Int. J. Food Prop. 2023, 26, 14–23. [Google Scholar] [CrossRef]
  2. Yun, Y.R.; Park, B.Y.; Kim, S.H.; Jung, J.-H. Antioxidant, Anti-Obesity, and Anti-Aging Activities of Jeju Citrus Blended Vinegar. Foods 2021, 10, 1441. [Google Scholar] [CrossRef] [PubMed]
  3. Suntar, I.; Khan, H.; Patel, S.; Celano, R.; Rastrelli, L. An Overview on Citrus aurantium L.: Its Functions as Food Ingredient and Therapeutic Agent. Oxidative Med. Cell. Longev. 2018, 2018, 7864269. [Google Scholar] [CrossRef] [PubMed]
  4. Yu, E.A.; Kim, G.S.; Lee, J.E.; Park, S.; Yi, S.; Lee, S.J.; Kim, J.H.; Jin, J.S.; Abd El-Aty, A.M.; Shim, J.H.; et al. Flavonoid Profiles of Immature and Mature Fruit Tissues of Citrus grandis Osbeck (Dangyuja) and Overall Contribution to the Antioxidant Effect. Biomed. Chromatogr. 2015, 29, 590–594. [Google Scholar] [CrossRef] [PubMed]
  5. Tripoli, E.; La Guardia, M.; Giammanco, S.; Di Majo, D.; Giammanco, M. Citrus Flavonoids: Molecular Structure, Biological Activity and Nutritional Properties: A Review. Food Chem. 2007, 104, 466–479. [Google Scholar] [CrossRef]
  6. Omidbaigi, R.; Nasiri, M.F. Quantitative Distribution of Hesperidin in Citrus Species, during Fruit Maturation and Optimal Harvest Time. Nat. Prod. Rad. 2004, 3, 12–15. [Google Scholar]
  7. Zeng, S.; Li, S.; Wei, M.; Chen, B.; Li, P.; Zheng, G.; Liu, E. Evaluation of Anti-Lipase Activity and Bioactive Flavonoids in the Citri Reticulatae Pericarpium from Different Harvest Time. Phytomedicine 2018, 43, 103–109. [Google Scholar] [CrossRef]
  8. Liang, S.; Zhang, J.; Liu, Y.; Wen, Z.; Liu, X.; Dang, F.; Xie, T.; Wang, J.; Wang, Z.; Wu, H. Study on Flavonoids and Bioactivity Features of Pericarp of Citrus reticulata “Chachi” at Different Harvest Periods. Plants 2022, 11, 3390. [Google Scholar] [CrossRef]
  9. Multari, S.; Licciardello, C.; Caruso, M.; Martens, S. Monitoring the Changes in Phenolic Compounds and Carotenoids Occurring during Fruit Development in the Tissues of Four Citrus Fruits. Food Res. Int. 2020, 134, 109228. [Google Scholar] [CrossRef]
  10. Peng, Z.; Zhang, H.; Li, W.; Yuan, Z.; Xie, Z.; Zhang, H.; Cheng, Y.; Chen, J.; Xu, J. Comparative Profiling and Natural Variation of Polymethoxylated Flavones in Various Citrus Germplasms. Food Chem. 2021, 354, 129499. [Google Scholar] [CrossRef]
  11. Dela Cruz, J.C.; Quiming, N.; Nicolas, M.; Velarde, M.; Mae, M.C. High-Performance Liquid Chromatography (HPLC) Method Validation for Simultaneous Quantitation of Five Phytoestrogenic Flavonoids. Res. Sq. Prepr. 2023. [Google Scholar] [CrossRef]
  12. Barfi, B.; Asghari, A.; Rajabi, M.; Barfi, A.; Saeidi, I. Simplified Miniaturized Ultrasound-Assisted Matrix Solid Phase Dispersion Extraction and High Performance Liquid Chromatographic Determination of Seven Flavonoids in Citrus Fruit Juice and Human Fluid Samples: Hesperetin and Naringenin as Biomarkers. J. Chromatogr. A 2013, 1311, 30–40. [Google Scholar] [CrossRef] [PubMed]
  13. Macedo, J.d.S.; Copatti, C.E.; Costa, E.V.; da Silva, F.M.A.; Dutra, L.M.; Santos, V.L.A.; Almeida, J.R.G.S.; Tavares-Dias, M.; Melo, J.F.B. Effects of Citrus Limon Extract on Growth Performance and Immunity in Striped Catfish (Pangasius hypophthalmus). Aquac. Int. 2023, 31, 719–738. [Google Scholar] [CrossRef]
  14. de Lourdes Mata Bilbao, M.; Andrés-Lacueva, C.; Jáuregui, O.; Lamuela-Raventós, R.M. Determination of Flavonoids in a Citrus Fruit Extract by LC–DAD and LC–MS. Food Chem. 2007, 101, 1742–1747. [Google Scholar] [CrossRef]
  15. Kim, Y.D.; Ko, W.J.; Koh, K.S.; Jeon, Y.J.; Kim, S.H. Composition of Flavonoids and Antioxidative Activity from Juice of Jeju Native Citrus Fruits during Maturation. Korean J. Nutr. 2009, 42, 278–290. [Google Scholar] [CrossRef]
  16. Kim, Y.; Koh, K.; Koh, J.-S. Changes of Flavonoids in the Peel of Jeju Native Citrus Fruits during Maturation. Food Sci. Biotechnol. 2001, 10, 16–20. [Google Scholar]
  17. Ellouze, I.; Abderrabba, M.; Sabaou, N.; Mathieu, F.; Lebrihi, A.; Bouajila, J. Season’s Variation Impact on Citrus Aurantium Leaves Essential Oil: Chemical Composition and Biological Activities. J. Food Sci. 2012, 77, T173–T180. [Google Scholar] [CrossRef]
  18. Moon, S.H.; Assefa, A.D.; Ko, E.Y.; Park, S.W. Comparison of Flavonoid Contents and Antioxidant Activity of Yuzu (Citrus Junos Sieb. Ex Tanaka) Based on Harvest Time. Korean J. Hortic. Sci. Technol. 2015, 33, 283–291. [Google Scholar] [CrossRef]
  19. International Council for Harmonisation of Technical Requirements for Pharmaceuticals for Human Use (ICH) Harmonised Tripartite Guideline. Validation of Analytical Procedures: Text and Methodology. Q2 (R1). 2005. Available online: somatek.com/wp-content/uploads/2014/06/sk140605h.pdf (accessed on 20 October 2023).
  20. Bhardwaj, S.K.; Dwivedia, K.; Agarwala, D.D. A Review: HPLC Method Development and Validation. Int. J. Anal. Bioanal. Chem. 2015, 5, 76–81. [Google Scholar]
  21. Dolan, J. The Importance of the Sample Matrix. LCGC N. Am. 2013, 31, 104–112. [Google Scholar]
  22. Choi, S.-Y.; Ko, H.-C.; Ko, S.-Y.; Hwang, J.-H.; Park, J.-G.; Kang, S.-H.; Han, S.-H.; Yun, S.-H.; Kim, S.-H. Correlation between Flavonoid Content and the NO Production Inhibitory Activity of Peel Extracts from various Citrus Fruits. Biol. Pharm. Bull. 2007, 30, 772–778. [Google Scholar] [CrossRef]
  23. Kawaii, S.; Tomono, Y.; Katase, E.; Ogawa, K.; Yano, M.; Koizumi, M.; Ito, C.; Furukawa, H. Quantitative Study of Flavonoids in Leaves of Citrus Plants. J. Agric. Food Chem. 2000, 48, 3865–3871. [Google Scholar] [CrossRef] [PubMed]
  24. Kim, G.-N.; Shin, J.-G.; Jang, H.-D. Antioxidant and Antidiabetic Activity of Dangyuja (Citrus grandis Osbeck) Extract Treated with Aspergillus saitoi. Food Chem. 2009, 117, 35–41. [Google Scholar] [CrossRef]
  25. Yang, Y.T.; Kim, H.B.; Lee, S.; Park, Y.C. Composition Characteristics of Flavonoids in Citrus Juice. Kor. J. Hort. Sci. Technol. 2019, 37, 651–662. [Google Scholar] [CrossRef]
  26. Frydman, A.; Liberman, R.; Huhman, D.V.; Carmeli-Weissberg, M.; Sapir-Mir, M.; Ophir, R.; Sumner, L.W.; Eyal, Y. The Molecular and Enzymatic Basis of Bitter/Non-bitter Flavor of Citrus Fruit: Evolution of Branch-forming Rhamnosyltransferases Under Domestication. Plant J. 2013, 73, 166–178. [Google Scholar] [CrossRef] [PubMed]
  27. Sun, Y.-L.; Kang, H.-M.; Han, S.-H.; Park, Y.-C.; Hong, S.-K. Taxonomy and Phylogeny of the Genus Citrus Based on the Nuclear Ribosomal DNA its Region Sequence. Pak. J. Bot. 2015, 47, 95–101. [Google Scholar]
  28. Nicolosi, E.; Deng, Z.N.; Gentile, A.; La Malfa, S.; Continella, G.; Tribulato, E. Citrus Phylogeny and Genetic Origin of Important Species as Investigated by Molecular Markers. Theor. Appl. Genet. 2000, 100, 1155–1166. [Google Scholar] [CrossRef]
  29. Koca, U.; Berhow, M.A.; Febres, V.J.; Champ, K.I.; Carrillo-Mendoza, O.; Moore, G.A. Decreasing Unpalatable Flavonoid Components in Citrus: The Effect of Transformation Construct. Physiol. Plant. 2009, 137, 101–114. [Google Scholar] [CrossRef]
  30. Zhao, C.; Wang, F.; Lian, Y.; Xiao, H.; Zheng, J. Biosynthesis of Citrus Flavonoids and their Health Effects. Crit. Rev. Food Sci. Nutr. 2020, 60, 566–583. [Google Scholar] [CrossRef]
  31. Saini, R.K.; Ranjit, A.; Sharma, K.; Prasad, P.; Shang, X.; Gowda, K.G.M.; Keum, Y.-S. Bioactive Compounds of Citrus Fruits: A Review of Composition and Health Benefits of Carotenoids, Flavonoids, Limonoids, and Terpenes. Antioxidants 2022, 11, 239. [Google Scholar] [CrossRef]
  32. Zhu, C.; Zhou, X.; Long, C.; Du, Y.; Li, J.; Yue, J.; Pan, S. Variations of Flavonoid Composition and Antioxidant Properties among Different Cultivars, Fruit Tissues and Developmental Stages of Citrus Fruits. Chem. Biodivers. 2020, 17, e1900690. [Google Scholar] [CrossRef] [PubMed]
Figure 1. Overlaid chromatogram of 10 flavonoids with different (A) flow rates (0.8, 1.0, and 1.2 mL/min), (B) column temperatures (30, 35, 40, and 45 °C), (C) mobile phase buffers (acetic acid and formic acid), and (D) wavelengths (266 and 278 nm). Plot annotation: 1, Rutin; 2, Narirutin; 3, Naringin; 4, Hesperidin; 5, Neohesperidin; 6, Quercetin; 7, Naringenin; 8, Hesperetin; 9, Nobiletin; 10, Tangeretin.
Separations 10 00567 g001
Figure 2. Principal component analysis (PCA) score plot for five Citrus species harvested at six different time points. Each Citrus species is represented on the plot by a unique color, and each harvest time is represented on the plot by a unique symbol: Dangyuja, orange; Gamja, green; Jigak, yellow; Sadugam, blue; Soyuja, violet; 3 September, circle; 18 September, box; 4 October, triangle; 21 October, inverted triangle; 6 November, diamond; 21 November, pentagon.
Separations 10 00567 g002
Figure 3. One-way ANOVA results as boxplots showing flavonoid content based on different harvest times and the growth for each Citrus fruit species.
Separations 10 00567 g003
Table 1. Calibration curves for limit of detection (LOD) and limit of quantification (LOQ) of 10 flavonoids.
No.Compounda RT
(min)
b Linear Regression Equationc R2LOD
(µg/mL)
LOQ
(µg/mL)
1Rutin4.88y = 0.3374x + 0.16330.999790.08450.2560
2Narirutin7.86y = 0.1563x + 0.04510.999930.05270.1598
3Naringin8.97y = 0.1567x + 0.02780.999960.07130.2161
4Hesperidin9.77y = 0.1458x + 0.01820.999980.06100.1849
5Neohesperidin10.69y = 0.1582x + 0.01050.999980.06490.1965
6Quercetin16.04y = 0.5322x − 0.09790.999980.43951.3317
7Naringenin19.44y = 0.2367x + 0.02220.999990.12810.3882
8Hesperetin20.61y = 0.2147x + 0.02670.999990.13630.4130
9Nobiletin25.00y = 0.5082x + 0.01201.000000.09920.3005
10Tangeretin26.70y = 0.5802x + 0.04680.999990.07620.2310
a RT, retention time; b y, peak area; x, concentration of standard (µg/mL); c R2, correlation coefficient.
Table 2. Results of inter-day and intra-day precision and recovery test for 10 flavonoids.
No.CompoundInter-Day Precision
(a RSD%)
Intra-Day Precision
(RSD%)
Accuracy
(%)
b RTAreaRTAreaRecoveryRSD
1Rutin0.1160.3180.0120.026105.822.709
2Narirutin0.0930.2630.0100.020102.191.521
3Naringin0.0720.2310.0080.023100.921.371
4Hesperidin0.0550.2360.0070.019107.971.480
5Neohesperidin0.0450.2210.0060.020100.021.391
6Quercetin0.0360.3210.0060.034102.452.820
7Naringenin0.0240.2410.0050.02395.621.221
8Hesperetin0.0160.1940.0030.02595.060.993
9Nobiletin0.0100.2210.0020.02596.611.737
10Tangeretin0.0090.2200.0020.030106.304.834
a % RSD, percentage of relative standard deviation; b RT, retention time.
Table 3. Quantification results for five Citrus species harvested at six different time points.
SpeciesHarvest DateCompound (mg/g)
RutinNarirutinNaringinHesperidinNeohesperidinQuercetinNobiletinTangeretinTotal
Dangyuja3 September2.756 ± 0.0215.902 ± 0.01563.063 ± 0.0277.029 ± 0.14762.301 ± 0.0494.053 ± 0.0401.253 ± 0.0061.197 ± 0.010147.553 ± 0.073
18 September2.423 ± 0.0504.426 ± 0.07760.059 ± 0.9676.410 ± 0.11362.342 ± 0.9853.717 ± 0.0421.216 ± 0.0211.138 ± 0.020141.731 ± 2.273
4 October2.850 ± 0.0424.645 ± 0.07247.479 ± 0.7595.214 ± 0.09041.826 ± 0.6622.661 ± 0.0610.888 ± 0.0140.924 ± 0.013106.488 ± 1.710
21 October2.778 ± 0.0013.607 ± 0.00442.156 ± 0.0153.569 ± 0.01039.650 ± 0.0342.116 ± 0.0290.904 ± 0.0010.979 ± 0.00395.760 ± 0.028
6 November2.639 ± 0.0122.566 ± 0.01626.616 ± 0.1902.791 ± 0.01328.159 ± 0.2011.527 ± 0.0110.618 ± 0.0040.536 ± 0.00465.452 ± 0.446
21 November2.609 ± 0.0542.496 ± 0.04027.054 ± 0.3581.697 ± 0.02622.972 ± 0.2941.226 ± 0.0360.478 ± 0.0050.501 ± 0.00459.033 ± 0.805
Gamja3 September3.572 ± 0.05712.135 ± 0.221* N.D.17.210 ± 0.8140.159 ± 0.022N.D.0.935 ± 0.0220.922 ± 0.03334.933 ± 1.091
18 September2.543 ± 0.1148.787 ± 0.329N.D.15.101 ± 0.6850.100 ± 0.006N.D.0.615 ± 0.0210.662 ± 0.02127.808 ± 1.138
4 October2.520 ± 0.0178.451 ± 0.042N.D.14.324 ± 0.627N.D.N.D.0.612 ± 0.0040.716 ± 0.00626.623 ± 0.661
21 October3.139 ± 0.0458.215 ± 0.093N.D.16.903 ± 0.513N.D.N.D.0.828 ± 0.0170.973 ± 0.02030.058 ± 0.598
6 November2.866 ± 0.0546.226 ± 0.093N.D.11.855 ± 0.362N.D.N.D.0.537 ± 0.0140.654 ± 0.02022.138 ± 0.457
21 November3.331 ± 0.1025.482 ± 0.141N.D.11.999 ± 0.822N.D.N.D.0.700 ± 0.0270.847 ± 0.04122.359 ± 1.116
Jigak3 September1.846 ± 0.0911.211 ± 0.047126.091 ± 4.5862.330 ± 0.04576.289 ± 2.7380.743 ± 0.0170.786 ± 0.0340.424 ± 0.018209.719 ± 7.564
18 September1.250 ± 0.0660.888 ± 0.01076.538 ± 0.8010.577 ± 0.01838.794 ± 0.381N.D.0.409 ± 0.0050.233 ± 0.006118.689 ± 1.208
4 October1.132 ± 0.0430.645 ± 0.01967.263 ± 1.5270.611 ± 0.03240.043 ± 0.919N.D.0.434 ± 0.0110.237 ± 0.012110.366 ± 2.555
21 October1.322 ± 0.0150.758 ± 0.00476.695 ± 0.2510.618 ± 0.01541.622 ± 0.184N.D.0.527 ± 0.0030.295 ± 0.004121.837 ± 0.427
6 November0.952 ± 0.0210.560 ± 0.01658.641 ± 0.4630.591 ± 0.06527.640 ± 0.180N.D.0.321 ± 0.0060.210 ± 0.00488.915 ± 0.654
21 November1.103 ± 0.0180.539 ± 0.01656.356 ± 0.4280.430 ± 0.02936.403 ± 0.322N.D.0.491 ± 0.0040.270 ± 0.00695.591 ± 0.813
Sadugam3 September2.740 ± 0.054126.41 ± 2.671N.D.30.666 ± 0.595N.D.N.D.N.D.N.D.159.815 ± 3.186
18 September2.417 ± 0.02987.971 ± 0.952N.D.20.372 ± 0.7770.158 ± 0.002N.D.N.D.N.D.110.760 ± 1.755
4 October2.891 ± 0.04673.851 ± 0.702N.D.17.574 ± 0.1750.107 ± 0.018N.D.N.D.N.D.94.316 ± 0.921
21 October2.765 ± 0.06354.398 ± 0.949N.D.13.850 ± 0.257N.D.N.D.N.D.N.D.71.013 ± 1.266
6 November2.608 ± 0.01748.014 ± 0.252N.D.12.663 ± 0.094N.D.N.D.N.D.N.D.63.285 ± 0.361
21 November2.414 ± 0.02440.890 ± 0.623N.D.9.553 ± 0.133N.D.N.D.N.D.N.D.52.858 ± 0.779
Soyuja3 September0.395 ± 0.03221.344 ± 0.12110.822 ± 0.05724.063 ± 0.12310.671 ± 0.052N.D.N.D.N.D.67.294 ± 0.384
18 September0.245 ± 0.01317.161 ± 0.2838.177 ± 0.12918.802 ± 0.5448.211 ± 0.080N.D.N.D.N.D.52.596 ± 1.024
4 October0.289 ± 0.02115.529 ± 0.0637.104 ± 0.04616.940 ± 0.0746.917 ± 0.039N.D.N.D.N.D.46.778 ± 0.241
21 OctoberN.D.12.485 ± 0.0266.317 ± 0.03315.082 ± 0.0646.457 ± 0.065N.D.N.D.N.D.40.341 ± 0.164
6 NovemberN.D.11.755 ± 0.1275.814 ± 0.09313.753 ± 0.1655.755 ± 0.082N.D.N.D.N.D.37.078 ± 0.464
21 NovemberN.D.6.675 ± 0.0203.816 ± 0.0059.301 ± 0.0244.242 ± 0.014N.D.N.D.N.D.24.033 ± 0.062
* N.D., not detected.
Disclaimer/Publisher’s Note: The statements, opinions and data contained in all publications are solely those of the individual author(s) and contributor(s) and not of MDPI and/or the editor(s). MDPI and/or the editor(s) disclaim responsibility for any injury to people or property resulting from any ideas, methods, instructions or products referred to in the content.

