Abstract
The major challenges for the commercialization of proton exchange membrane fuel cells (PEMFCs) are durability and cost. Prognostics and health management technology enable appropriate decisions and maintenance measures by estimating the current state of health and predicting the degradation trend, which can help extend the life and reduce the maintenance costs of PEMFCs. This paper proposes an online model-based prognostics method to estimate the degradation trend and the remaining useful life of PEMFCs. A non-linear empirical degradation model is proposed based on an aging test, then three degradation state variables, including degradation degree, degradation speed and degradation acceleration, can be estimated online by the particle filter algorithm to predict the degradation trend and remaining useful life. Moreover, a new health indicator is proposed to replace the actual variable loading conditions with the simulated constant loading conditions. Test results using actual aging data show that the proposed method is suitable for online remaining useful life estimation under variable loading conditions. In addition, the proposed prognostics method, which considers the activation loss and the ohmic loss to be the main factors leading to the voltage degradation of PEMFCs, can predict the degradation trend and remaining useful life at variable degradation accelerations.
1. Introduction
As fossil energy consumption continues to increase and the environment continues to deteriorate, there is an urgent need to find clean renewable energy and conversion devices. Proton exchange membrane fuel cells (PEMFCs) can directly convert chemical energy into electrical energy, the unique characteristics, such as high efficiency, high power density, no pollution, and low operating temperature, make PEMFCs be one of the most promising candidates for power generation. Therefore, PEMFCs have been used in many fields [1,2,3]. However, low durability and high cost hinder the commercialization process [4,5].
Although PEMFCs will inevitably exhibit performance degradation with the increase of running time, the degradation rate can be effectively slowed down by effective prognostics and health management (PHM) technology [6]. As shown in Figure 1, PHM consists of seven layers [7]: data acquisition, data processing, condition assessment, diagnostics, prognostics, decision support and human–machine interface. It aims at utilizing the real-time monitoring data of the target system to diagnose and predict its health status.
Figure 1.
Prognostics and health management (PHM) architecture.
Meanwhile, once a fault is found, the PHM technology can provide alternative solutions and implement them at the right time to extend the service life of the system. Then, the maintenance strategy can be changed from “fail to fix” to “predict to prevent”, which improves the safety and availability of the target system. Studies have shown that the application of PHM technology is of great significance to the durability, reliability and maintainability of PEMFCs [8], while reducing the maintenance cost [9]. This paper is focused on the prognosis layer, which aims at predicting the degradation trend and remaining useful life (RUL) of the target system based on the health indicators extracted from the measured data.
According to the definition of the International Organization for Standardization [10], prognostics is the estimation of time to failure and risk for one or more existing and future modes. The RUL is defined as the time between the predicted time () and the end-of-life (EOL) time () [11].
For PEMFCs, the US Department of Energy considers that the EOL is reached when its initial performance declines by 10% [12]. Since voltage is an effective degradation indicator of PEMFCs, this paper considers that EOL is reached when the voltage of PEMFCs drops to 90% of the initial value.
Prognostics studies of PEMFCs have made great progress in recent years, the prognostics methods can be divided into three categories: model-based methods, data-based methods and hybrid methods [8,13]. The model-based method predicts the system’s degradation information based on the empirical or physical models of fuel cells, and the predictive algorithm used to be extended Kalman filter (EKF), unscented Kalman filter (UKF) and particle filter (PF) [14,15,16]. A detailed prediction process by PF is presented in [14], the authors adopt three different empirical models: linear model, logarithmic model and exponential model to predict the degradation trend of voltage, and the results show that the logarithmic model is more efficient, but it cannot be used under variable loading conditions. A precise degradation model is hard to build, so the data-based method is more and more popular. It predicts the degradation trend by kinds of machine learning algorithms: wavelet-based approach [6], echo state network [17,18], adaptive neuro-fuzzy inference systems [19], relevance vector machine [20,21] and so on. But a large number of high-quality data is essential. The hybrid method combines the model-based method with the data-based method to achieve complementary advantages [8]. Liu et al. [22] firstly adopt an automatic machine learning algorithm to predict the degradation trend, and then an adaptive unscented Kalman filter (AUKF) is used to estimate the RUL.
Apart from choosing a proper prognostics method, a suitable health indicator of fuel cells during the degradation process is also difficult to choose. The common health indicators in the literature are measured voltage [1,14,17,23,24], measured power [6,25,26], ECSA [27,28], model parameters [11,15,29,30] and so on. But the measured voltage and power are just suitable for constant loading conditions. Although ECSA can be used under variable loading conditions, it is difficult to measure online. The model parameters can be influenced by different materials, synthesis processes and assembly technologies. In sum, choosing a reasonable health indicator is essential and particularly important, especially under variable loading conditions. A new health indicator is proposed in this paper to overcome the shortcomings above, it can be used not only for constant loading conditions, but also for variable loading conditions online (Section 4.2).
The remaining content of this paper is organized as follows. The aging test of the PEMFCs stack is described in Section 2. Then, a model-based prognostics method including an empirical degradation model and particle filter algorithm is introduced in Section 3. Next, the prediction results including the estimated voltage, new health indicator and remaining useful life are analyzed and discussed in Section 4. Finally, the conclusions are presented in Section 5.
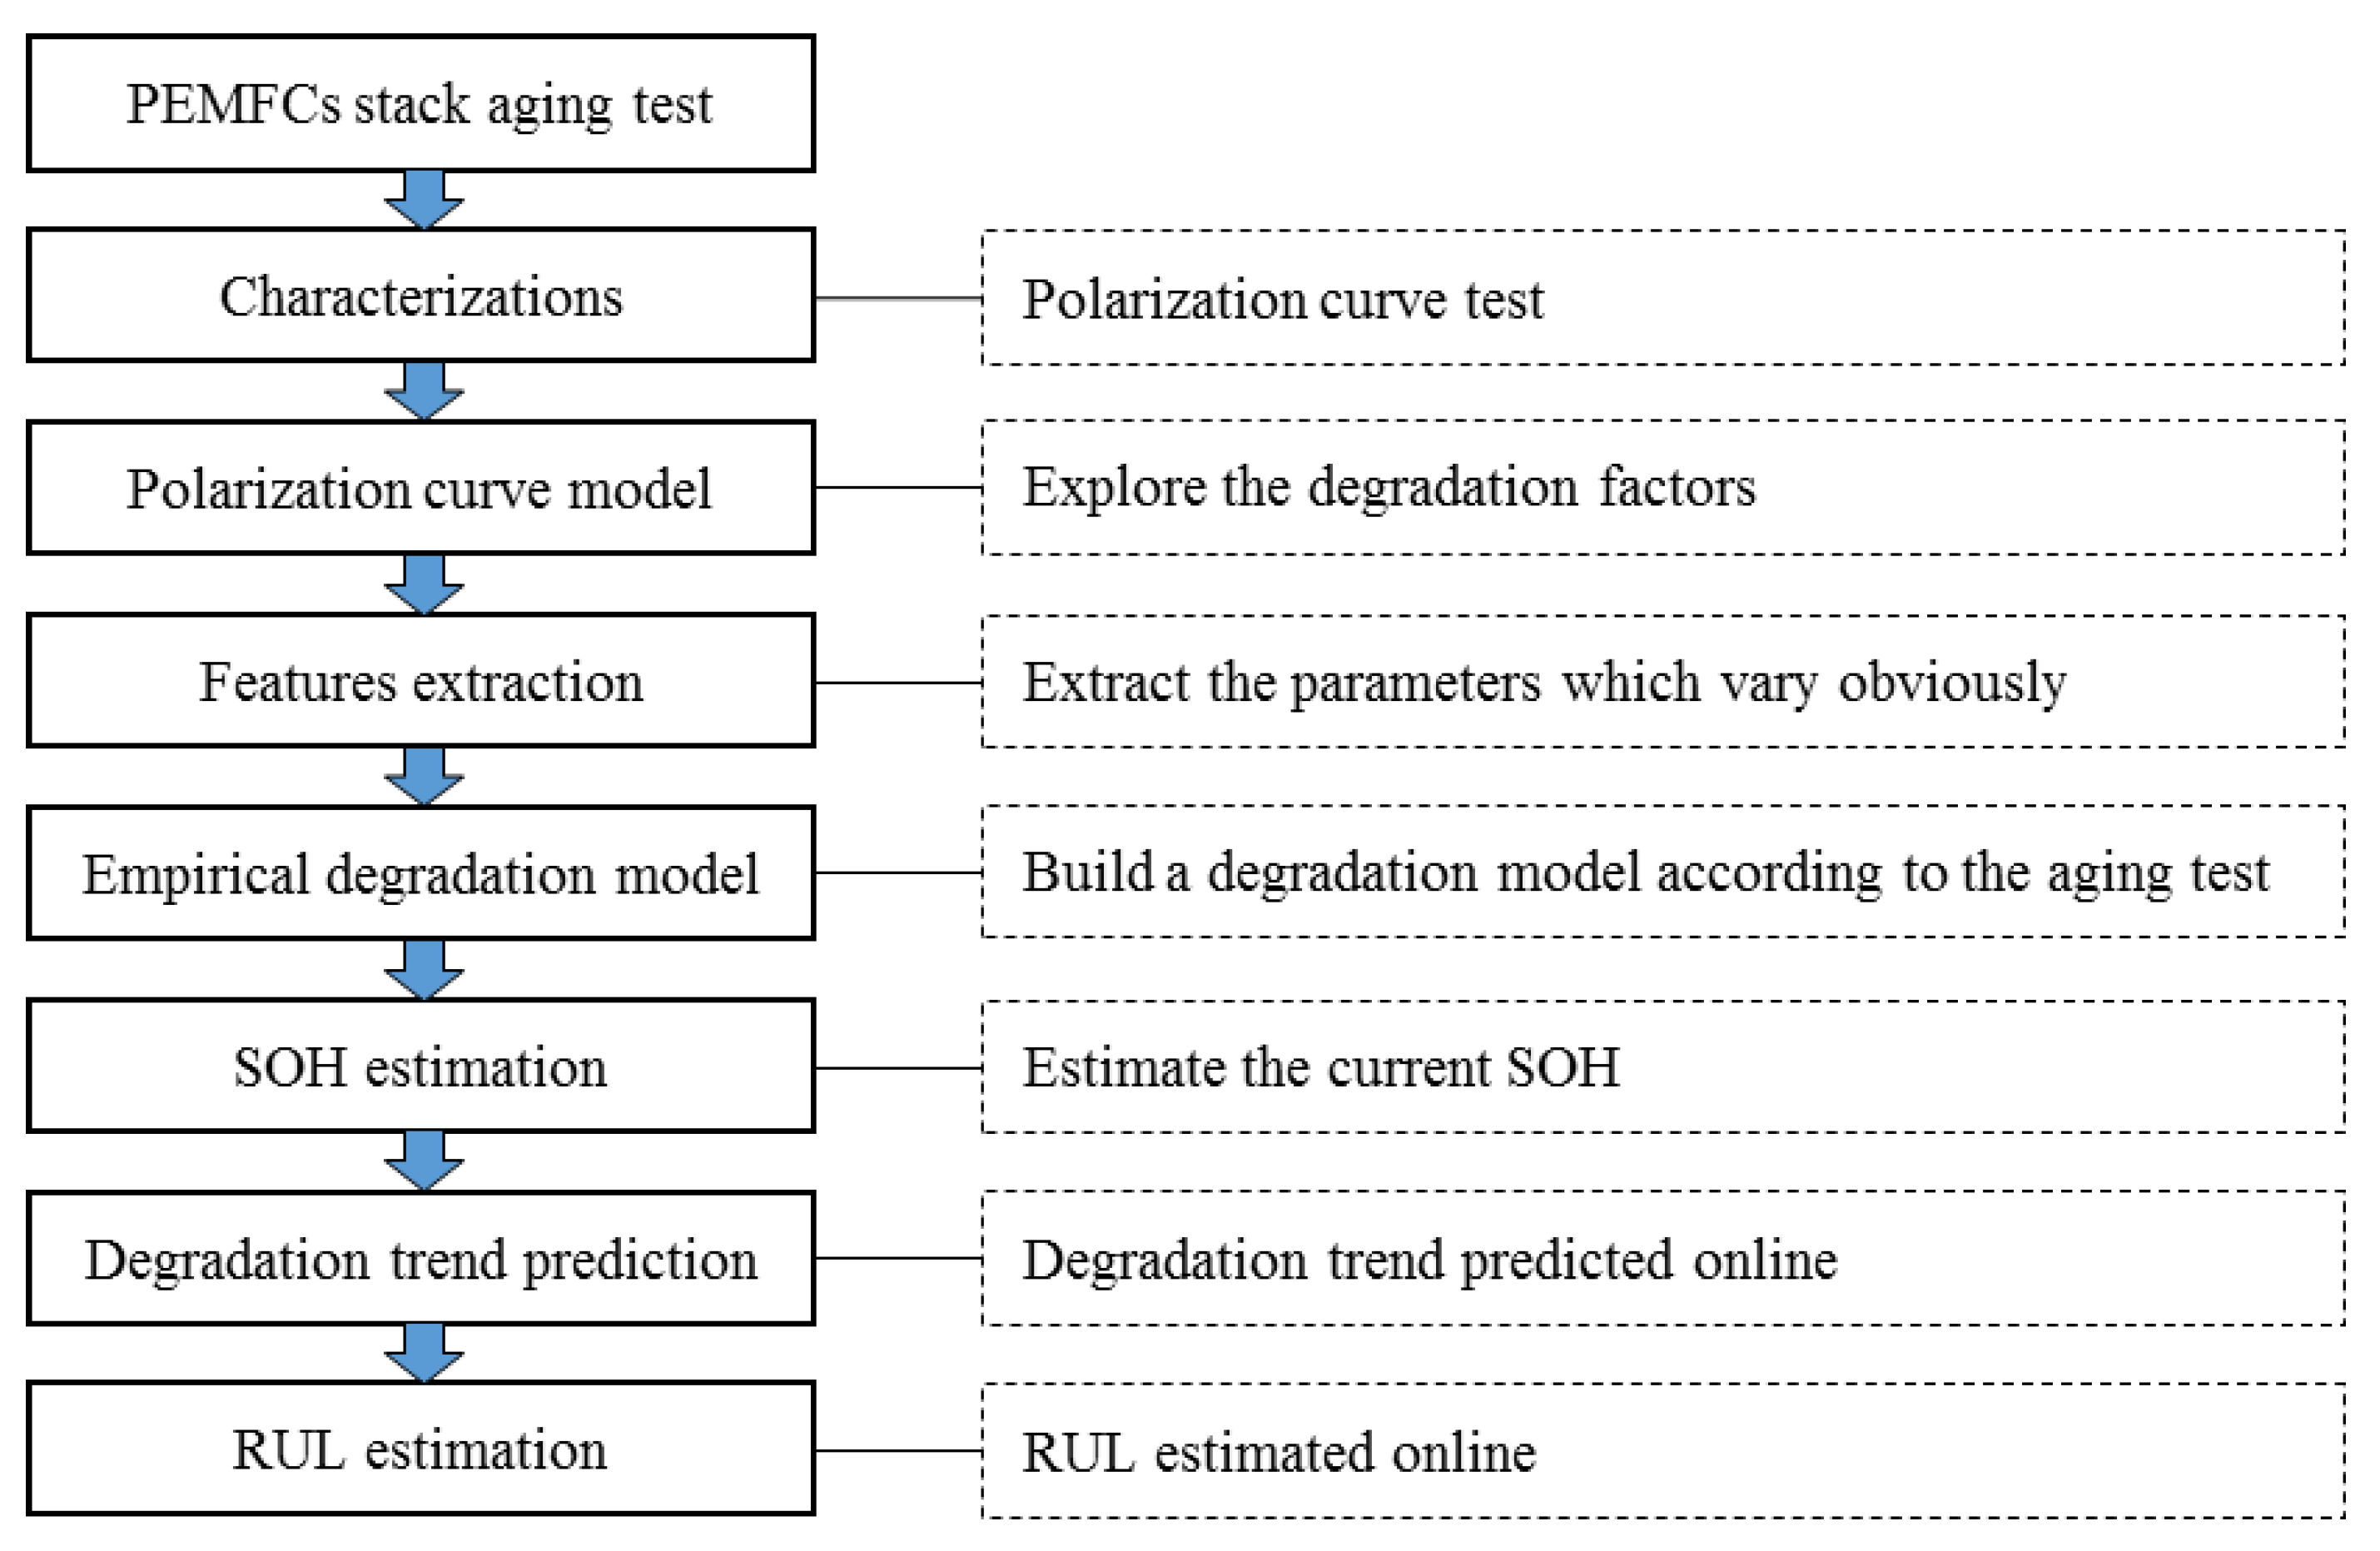
2. Proton Exchange Membrane Fuel Cells (PEMFCs) Stack Aging Test
A homemade PEMFCs stack consisted of 8 cells was used in the aging test, and each cell had an active area of 270 cm2. The PEMFCs stack was composed of metal bipolar plates with parallel flow filed and MEA consisted of commercial Pt/C catalyst and Nafion membrane. The detailed information is listed in Table 1.
Table 1.
Proton exchange membrane fuel cells (PEMFCs) stack components.
A homemade test bench was used in the aging test, the current density was controlled by the electronic load of KIKUSUI PLZ2004WB, the temperature of PEMFCs stack was controlled by the recirculating water bath, the gas flowrate and pressure was adjusted by mass flow controllers and gas regulator valves, the gas pressure was displayed by pressure gauge, the reaction gasses were humidified by bubbling method, there were two independent boilers for reaction gasses, the air humidifier was heated to the requested relative humidity, while the hydrogen humidifier was always kept at room temperature with dry hydrogen, the details about operating parameters during the aging test are summarized in Table 2.
Table 2.
Operation parameters during the aging test.
The aging test was carried out on working days and ran for about 7~9 h every day. Each time the PEMFC stack was started, the current density gradually increased from 0 to the required current density, and then gradually decreased to 0 at the end, which caused a lot of fluctuations in the raw data (Figure 2). The loading current density was mainly 1.0 A cm−2 during 0~620 h, and then mainly 0.8 A cm−2. The sampling frequency of the raw data was 1 Hz during the aging test. However, we would usually consider the degradation phenomenon in hours or even in days in the practical engineering situation [31]. With reference to that, the raw data were resampled with an hour and de-noised. In addition, a series of polarization curves were tested at 20 h, 155 h, 237 h, 349 h, 450 h, 555 h and 646 h respectively in the aging test (Figure 3 solid lines).
Figure 2.
Average voltage (a) and current density (b) of PEMFCs stack over time.
Figure 3.
Polarization curves during the aging test.
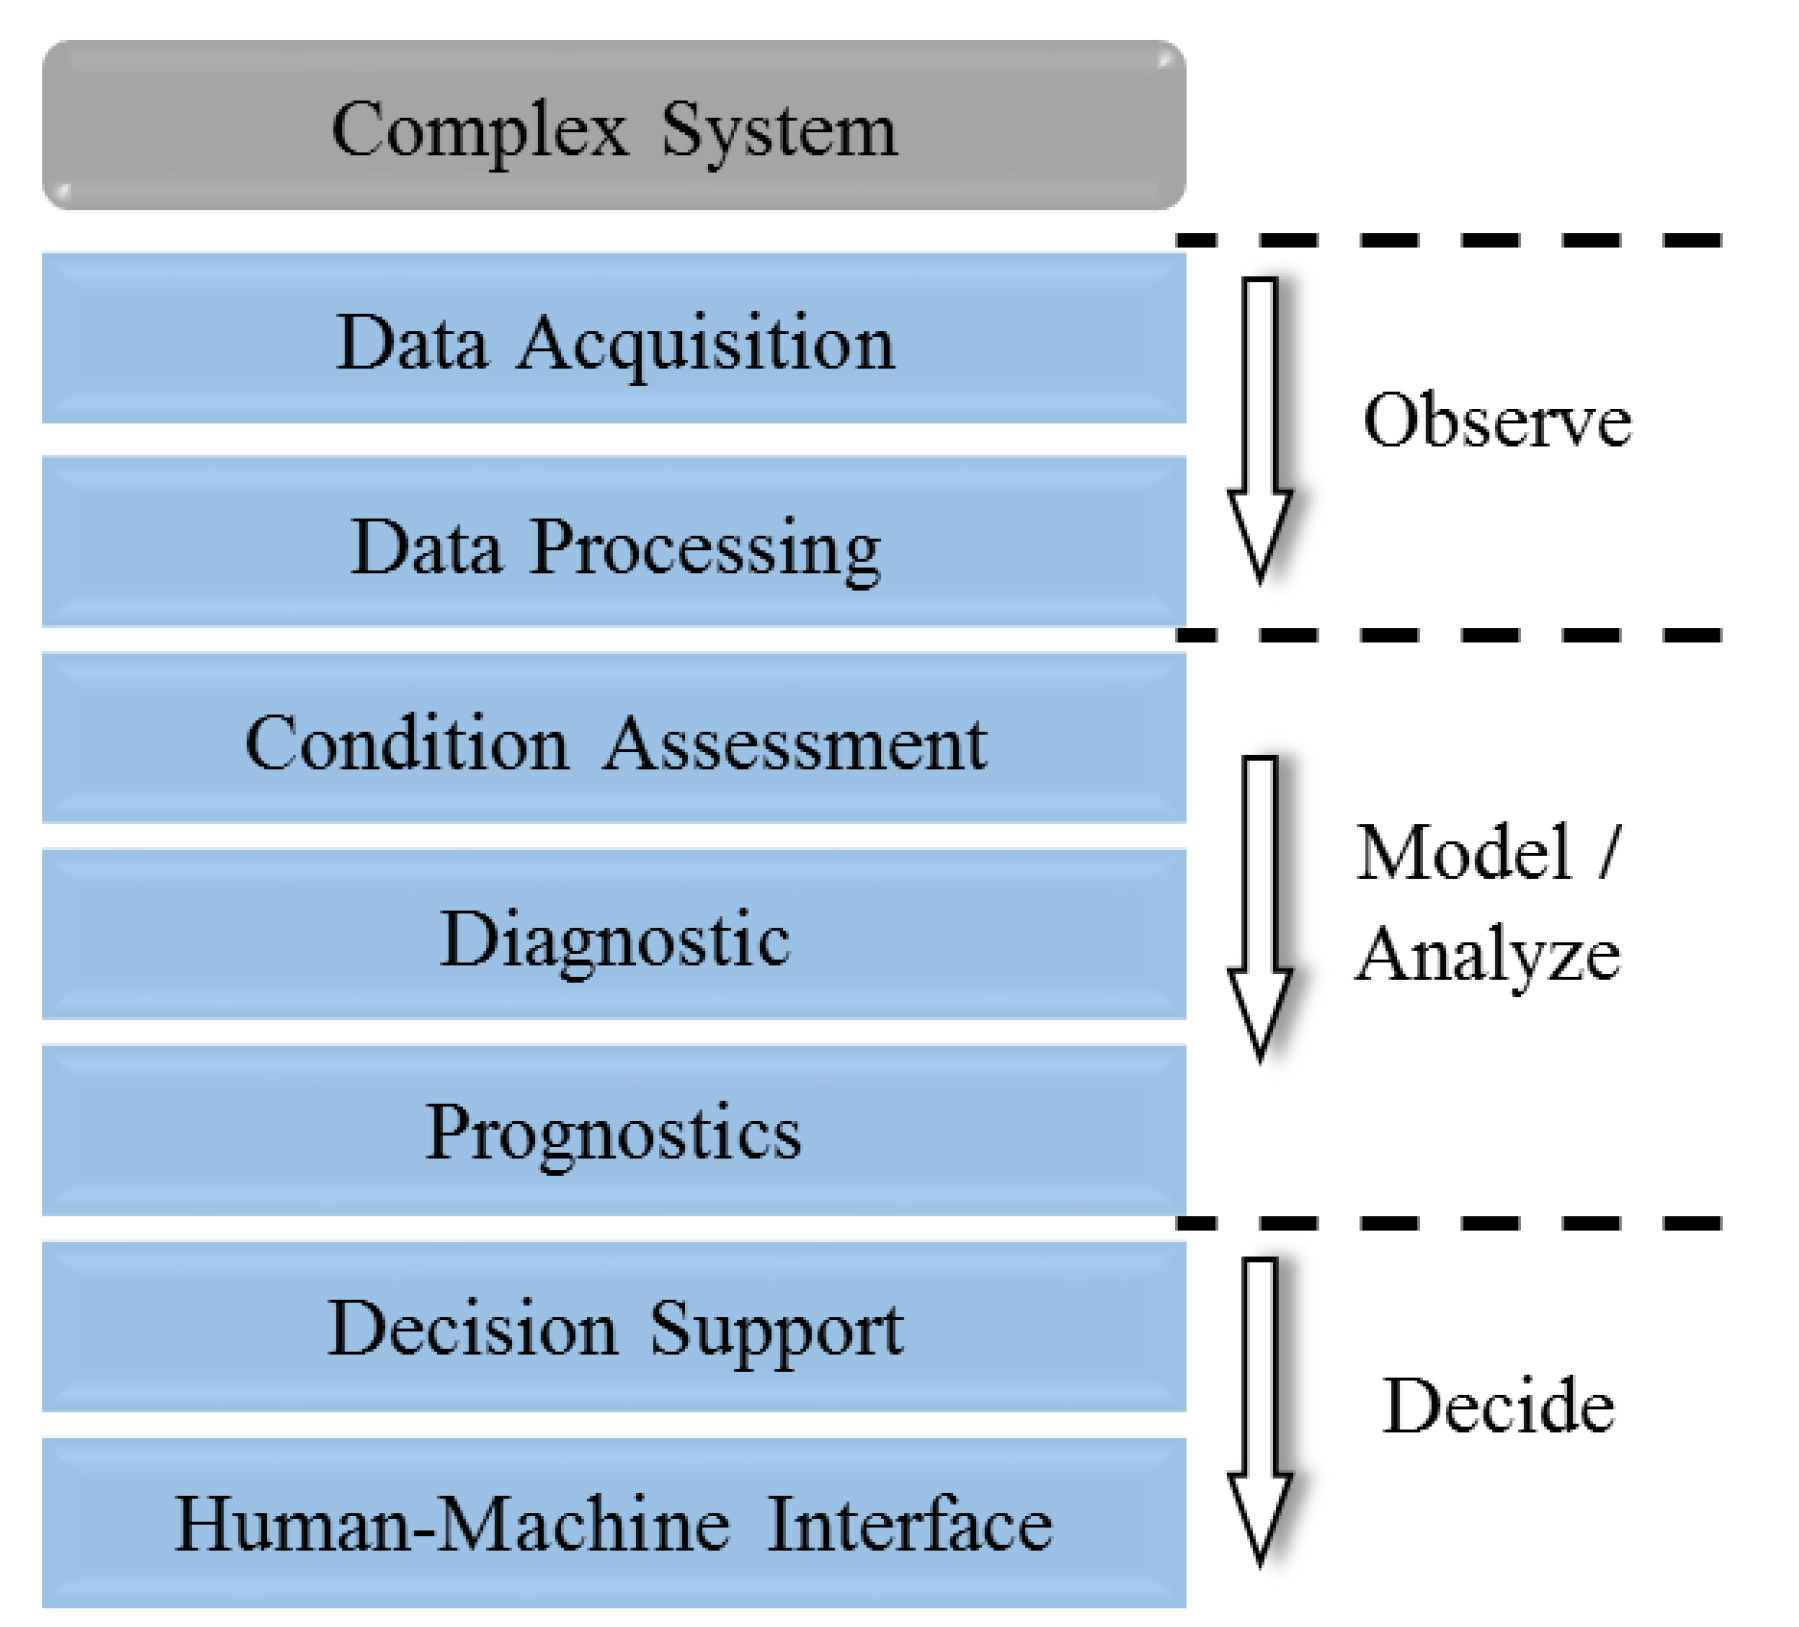
3. Model-Based Prognostics Method
The total procedure of the model-based method is listed in Figure 4. An empirical degradation model of the PEMFCs stack is built in Section 3.1 based on the polarization curves. Then, the PF algorithm is introduced to estimate the degradation status in Section 3.2.
Figure 4.
Model-based prognostics method for PEMFCs.
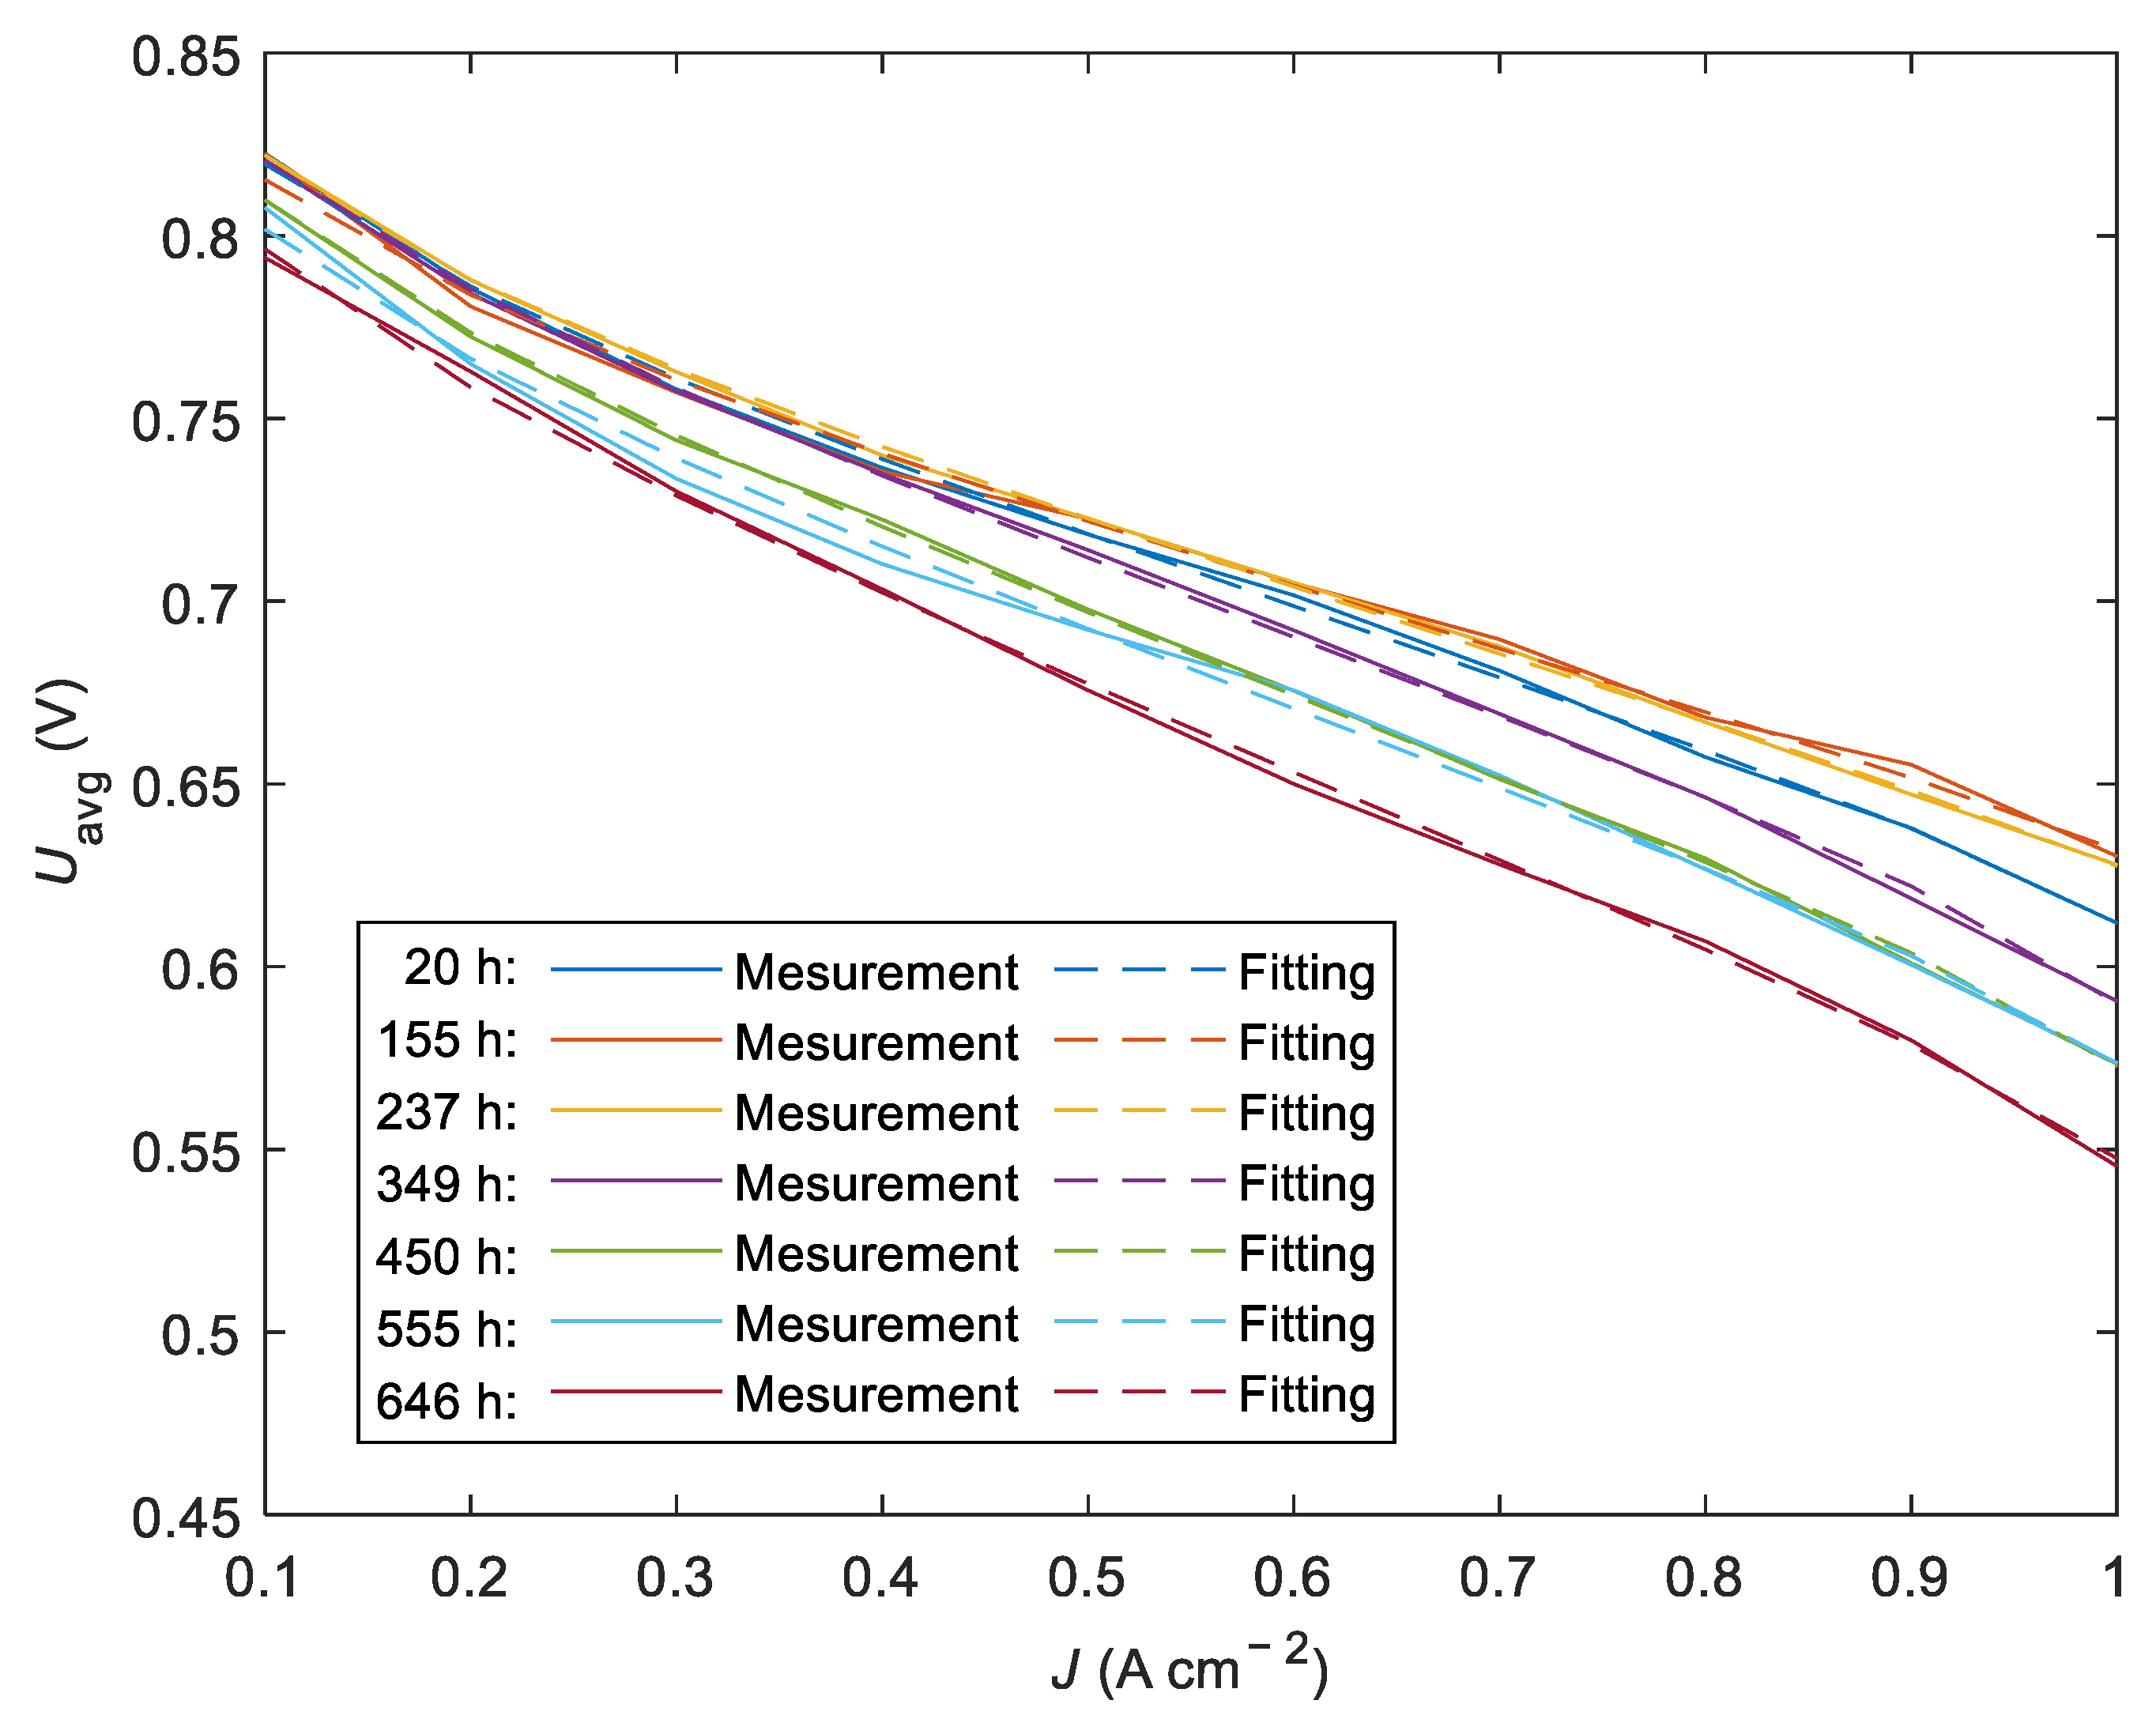
3.1. Empirical Degradation Model
To further study the degradation behavior of the PEMFCs stack, a polarization curve model proposed by Bressel et al. [15] and Blal et al. [32] was selected to fit the polarization curves at different aging stages.
where is the average stack voltage, is the stack voltage, is the number of single cell, is the open circuit voltage, is cell temperature, is current density, is the exchange current density, is the total resistance and is the limited diffusion current density.
Among these model parameters, only the , , and need to be fitted. The non-linear Levenberg–Marquardt method is used to identify the model parameters. However, we could only obtain the local optimal solution through this method, therefore uniform initial values and acceptable fitting error are used to overcome the weakness in this paper [15]. The fitted polarization curves are shown in Figure 3 (dashed lines). It can be seen from Figure 3 that the simulation data are highly consistent with the experimental data, the average error (RMSE) is only 0.0022 V, which means the fitted model parameters are reasonable. Then the evolution of the model parameters with time is shown in Figure 5. This shows that the and display no marked changes over time, so they are assumed to be constant in this paper. In contrast, the and change significantly (decreases/increases about 40%) during the aging test, which may be caused by fuel starvation and the hydrogen–air interface under frequent start-stop conditions [33,34]. Moreover, the evolution trend of the and seems to be a quadratic function, so the quadratic function is used to build an empirical degradation model.
Figure 5.
Evolution of the model parameters.
Herein, we define the as the degradation degree at time t, so the and can be written as follows:
According to the empirical degradation model, the seems to be a quadratic function:
where is the initial degradation degree, is the degradation speed, and is the degradation acceleration.
3.2. Particle Filter Algorithm
The PF is an approximate Bayesian filtering algorithm based on Monte Carlo simulation, which could handle arbitrary distributions of noises and nonlinearities theoretically [35]. The PF mainly includes three steps: prediction, update and re-sampling, the detailed framework can be seen in the references [14,26]. In this paper, PF is adopted to estimate the health status of the PEMFCs stack. The PEMFCs system can be described by the following non-linear system:
The equation of state:
The equation of observation:
where the is the state of system at time k, is the average voltage of system at time k, is the current density, and are Gaussian noises with variances Q and R, respectively.
The MATLAB software is used to solve the problem. The parameters should be initialized before running the algorithm. Obviously, the in the beginning, but it is hard to determine the degradation speed and the degradation acceleration . Taking the generalization of this model into consideration, they are set uniformly to 0, hence the initial state can be written as . In order to make the program converge as soon as possible and insensible to the noises, the Q and R are chosen as [15]:
4. Results and Discussion
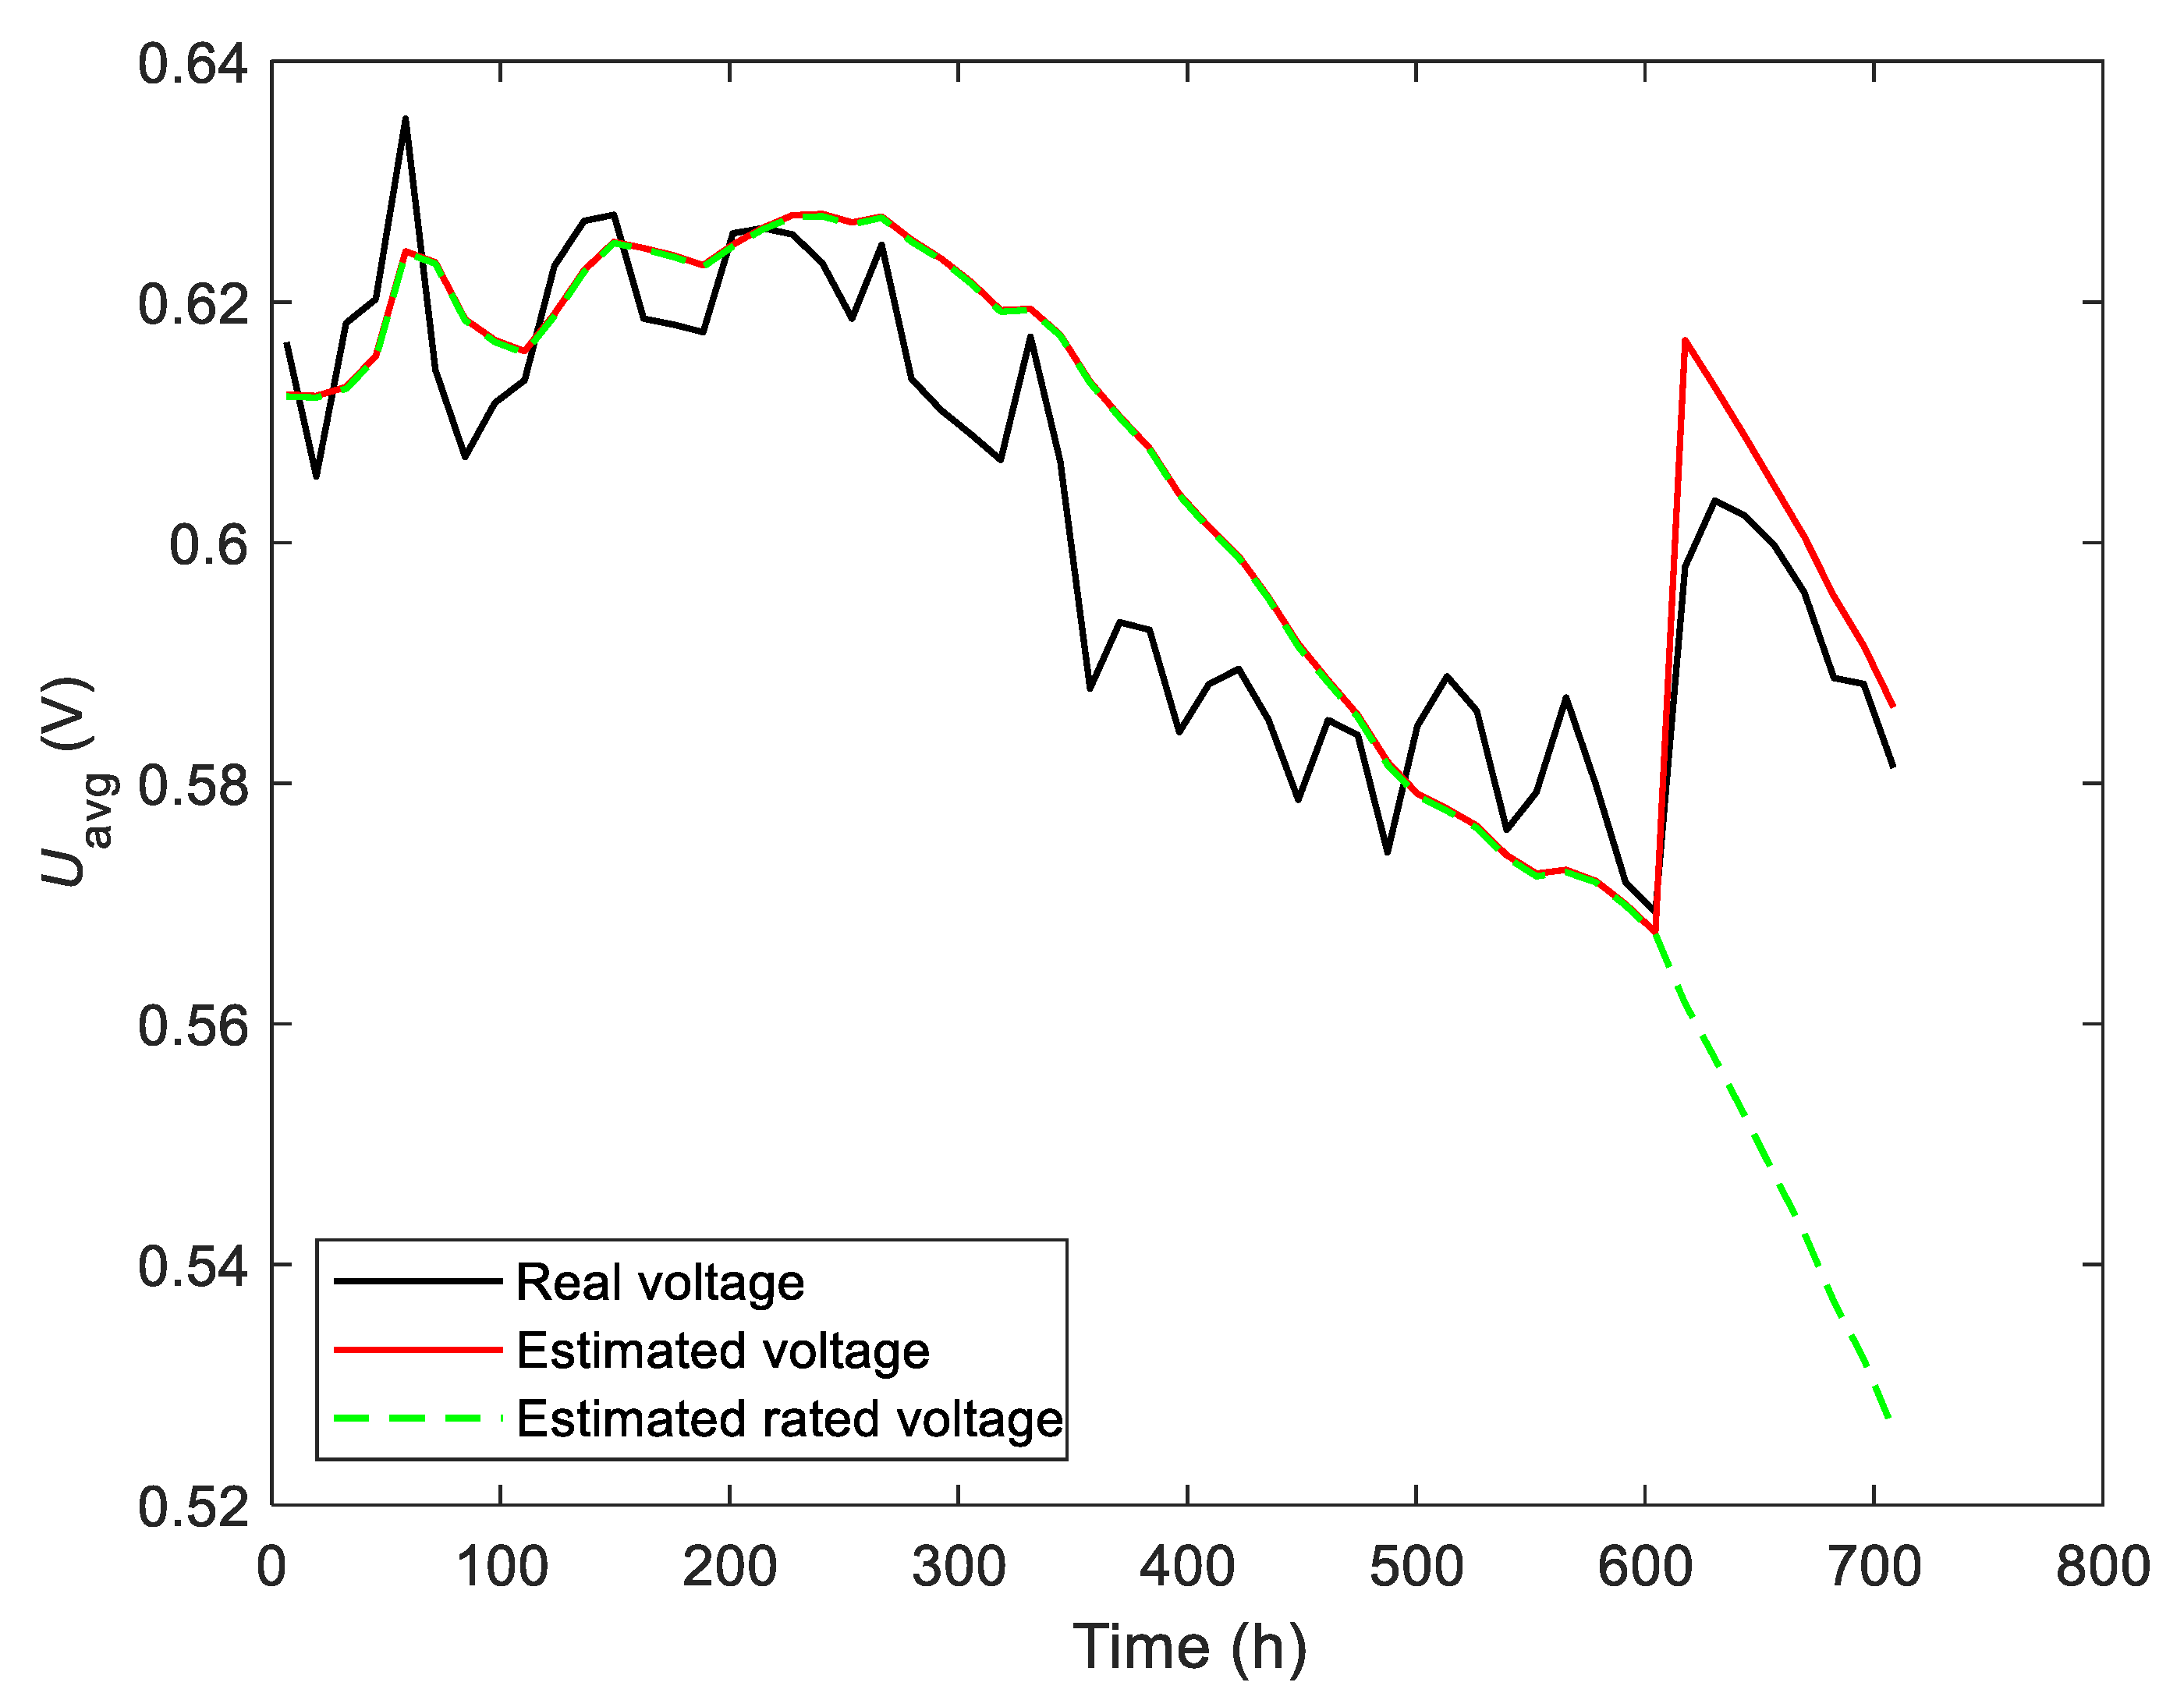
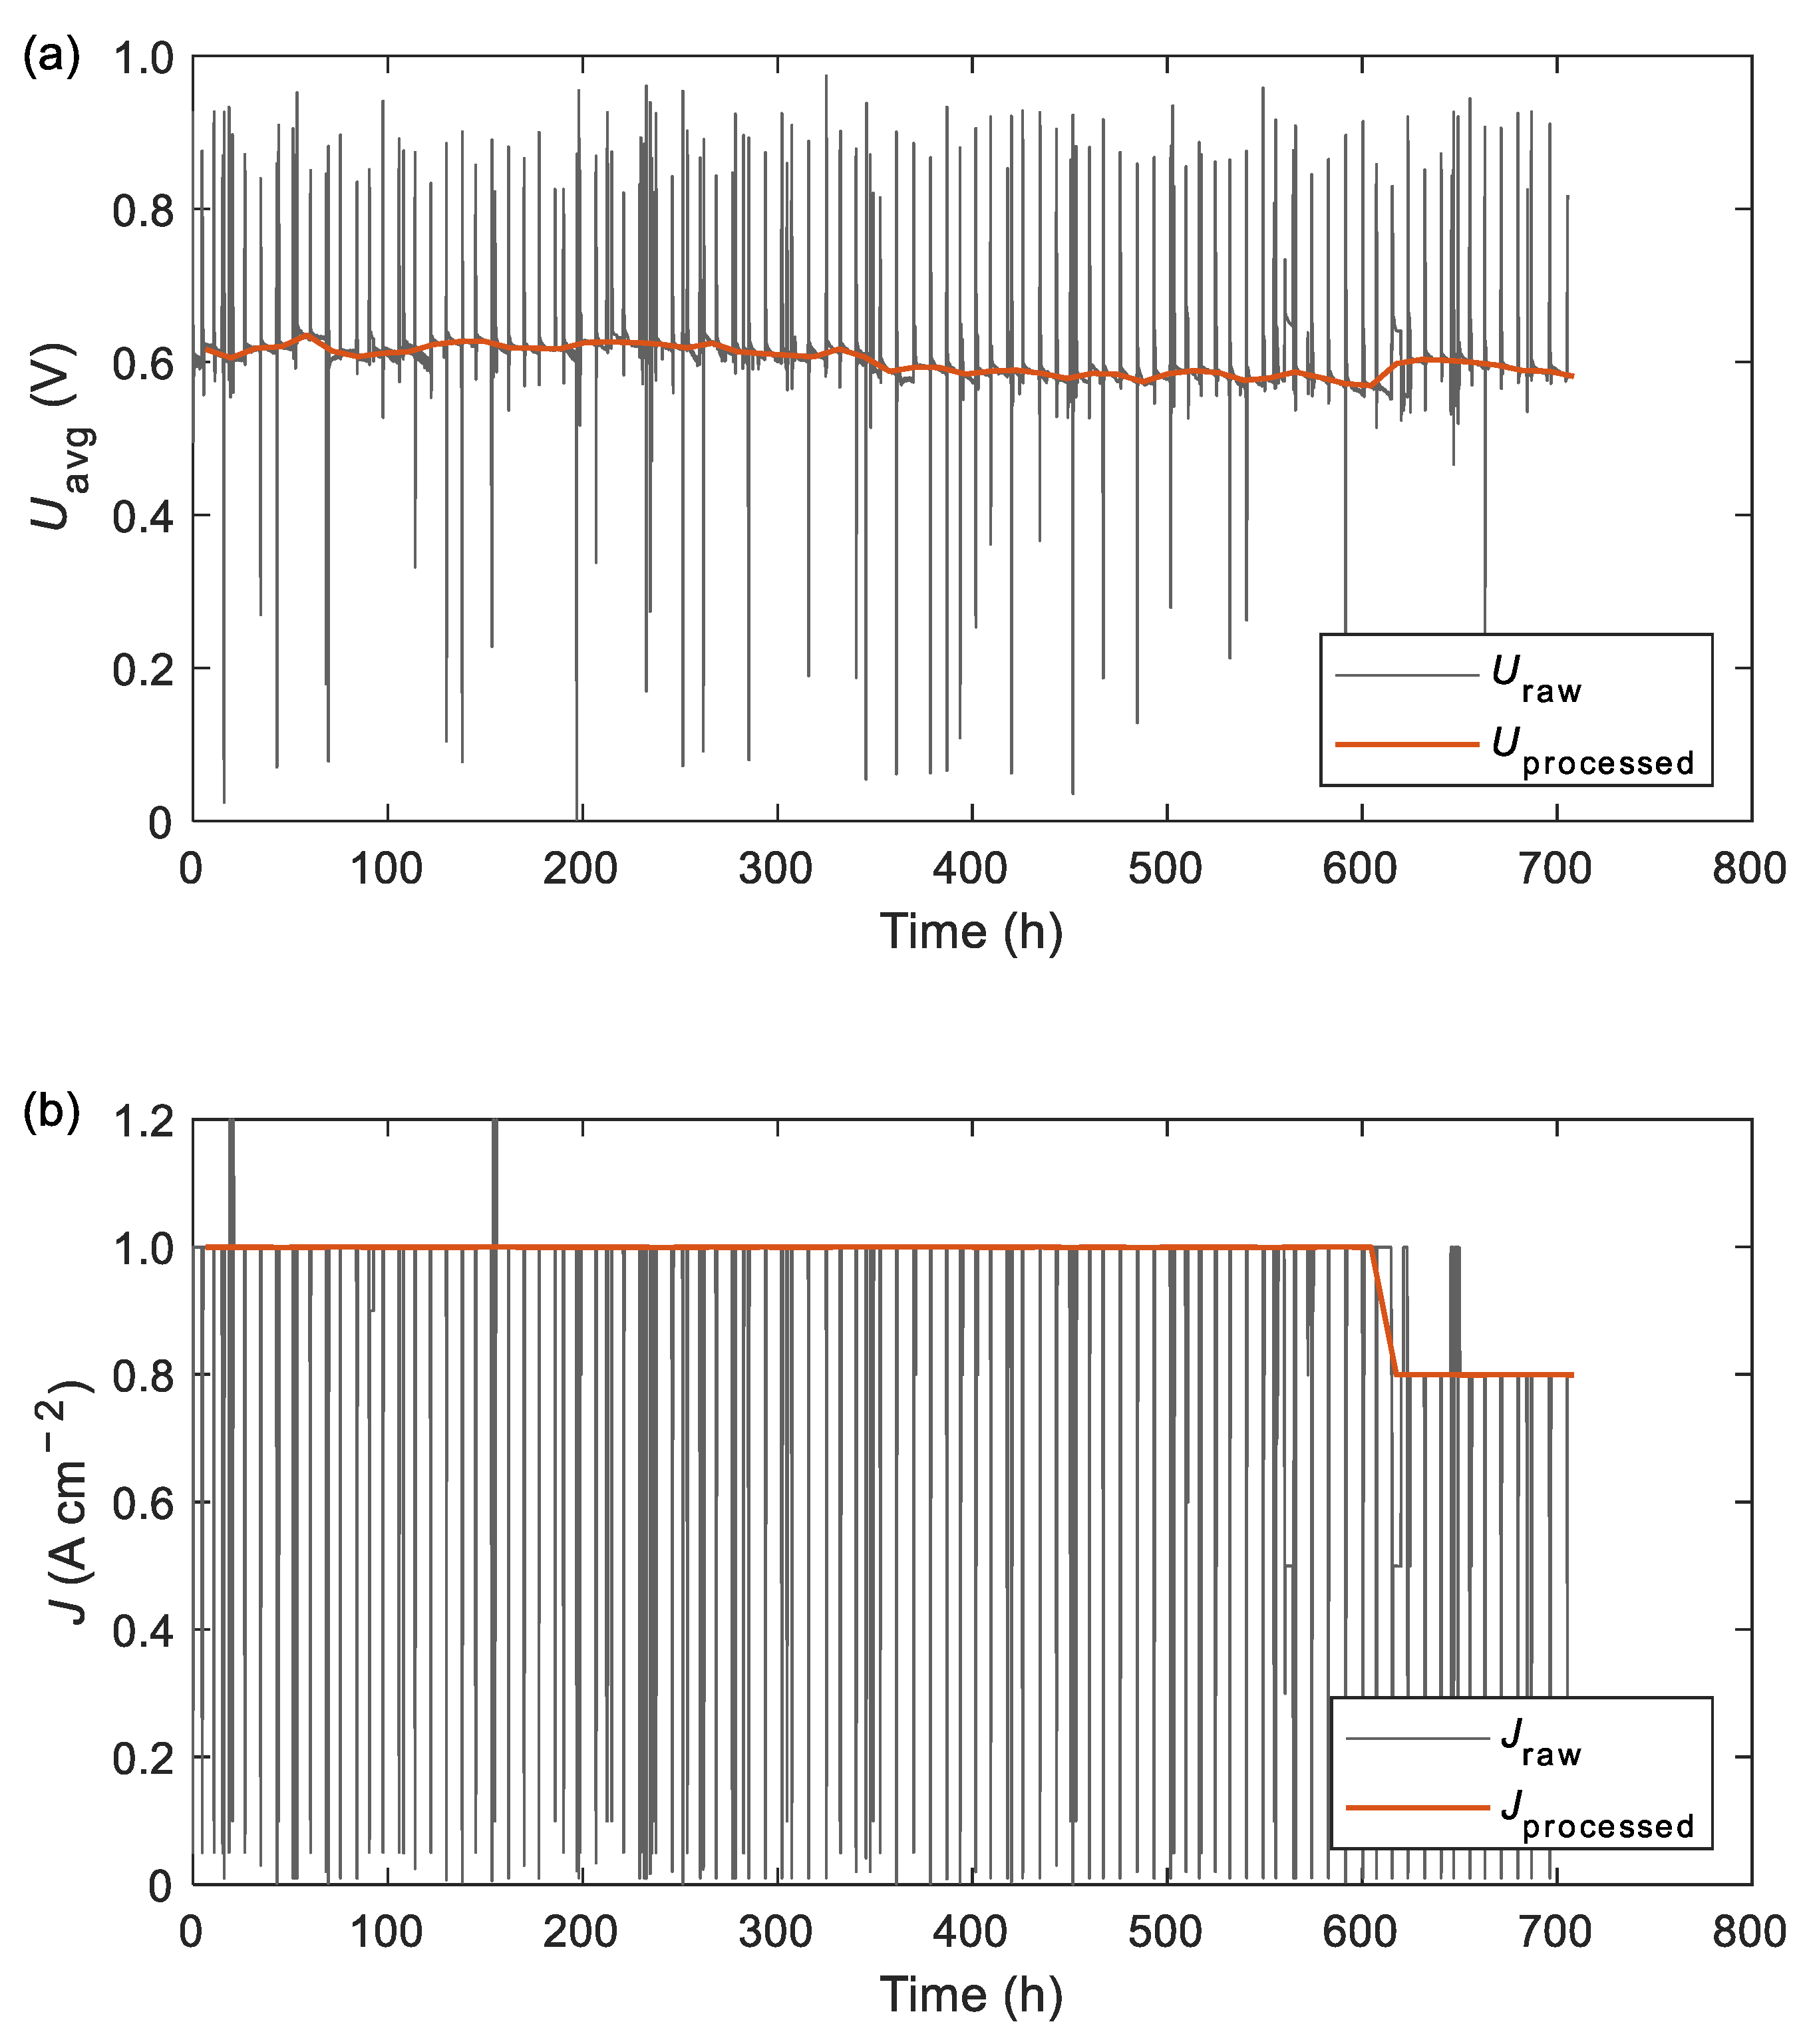
4.1. Health Status Estimation
The health status of PEMFCs, such as degradation degree , degradation speed and degradation acceleration , can be estimated online by PF by inputting the average voltage and current density of the PEMFCs stack, the average time taken for each health status estimation is only 0.13 s, and the results are shown in Figure 6. Figure 6a shows that the evolution of degradation degree can be divided into two stages. In the first stage from 0 to 240 h, the shows a decreasing trend, which may be caused by the activation process of PEMFCs or more favorable working conditions (e.g., the humidity or pressure of the reaction gas.), matching with that the voltage increases gradually during this stage (Figure 7 black line). In the second stage from 240 to 706 h, the increases gradually, which corresponds to the degradation process of PEMFCs and leads to the voltage decreases little by little. It should be noted that at 620 h, the current density changed from 1.0 A cm−2 to 0.8 A cm−2, which caused a sudden increase in voltage. Then according to Equation (10), the estimated voltage can be calculated based on the and , the results are shown in Figure 7 (red line), the total error (RMSE) between the real voltage and the estimated voltage is 0.0093 V, which means the estimated is acceptable.
Figure 6.
Degradation degree α (a), degradation speed v (b) and degradation acceleration a (c) estimation.
Figure 7.
Voltage estimation.
Taking a close look at Figure 6a,c, it can be seen that the degradation acceleration has an important influence on the degradation degree . During the period of 500~600 h, decreases rapidly, which led to the slow growth of , and then slows down the degradation of the PEMFCs stack. In contrast, the increases quickly after 600 h, which leads to a faster growth of , and which means the degradation of PEMFCs is accelerated. In summary, the proposed prognostics method can predict the degradation trend at variable degradation accelerations, so it is more in line with practical demands. However, we initialized with inaccurate values, namely the and at the beginning, which causes some huge fluctuations in the early stage of and .
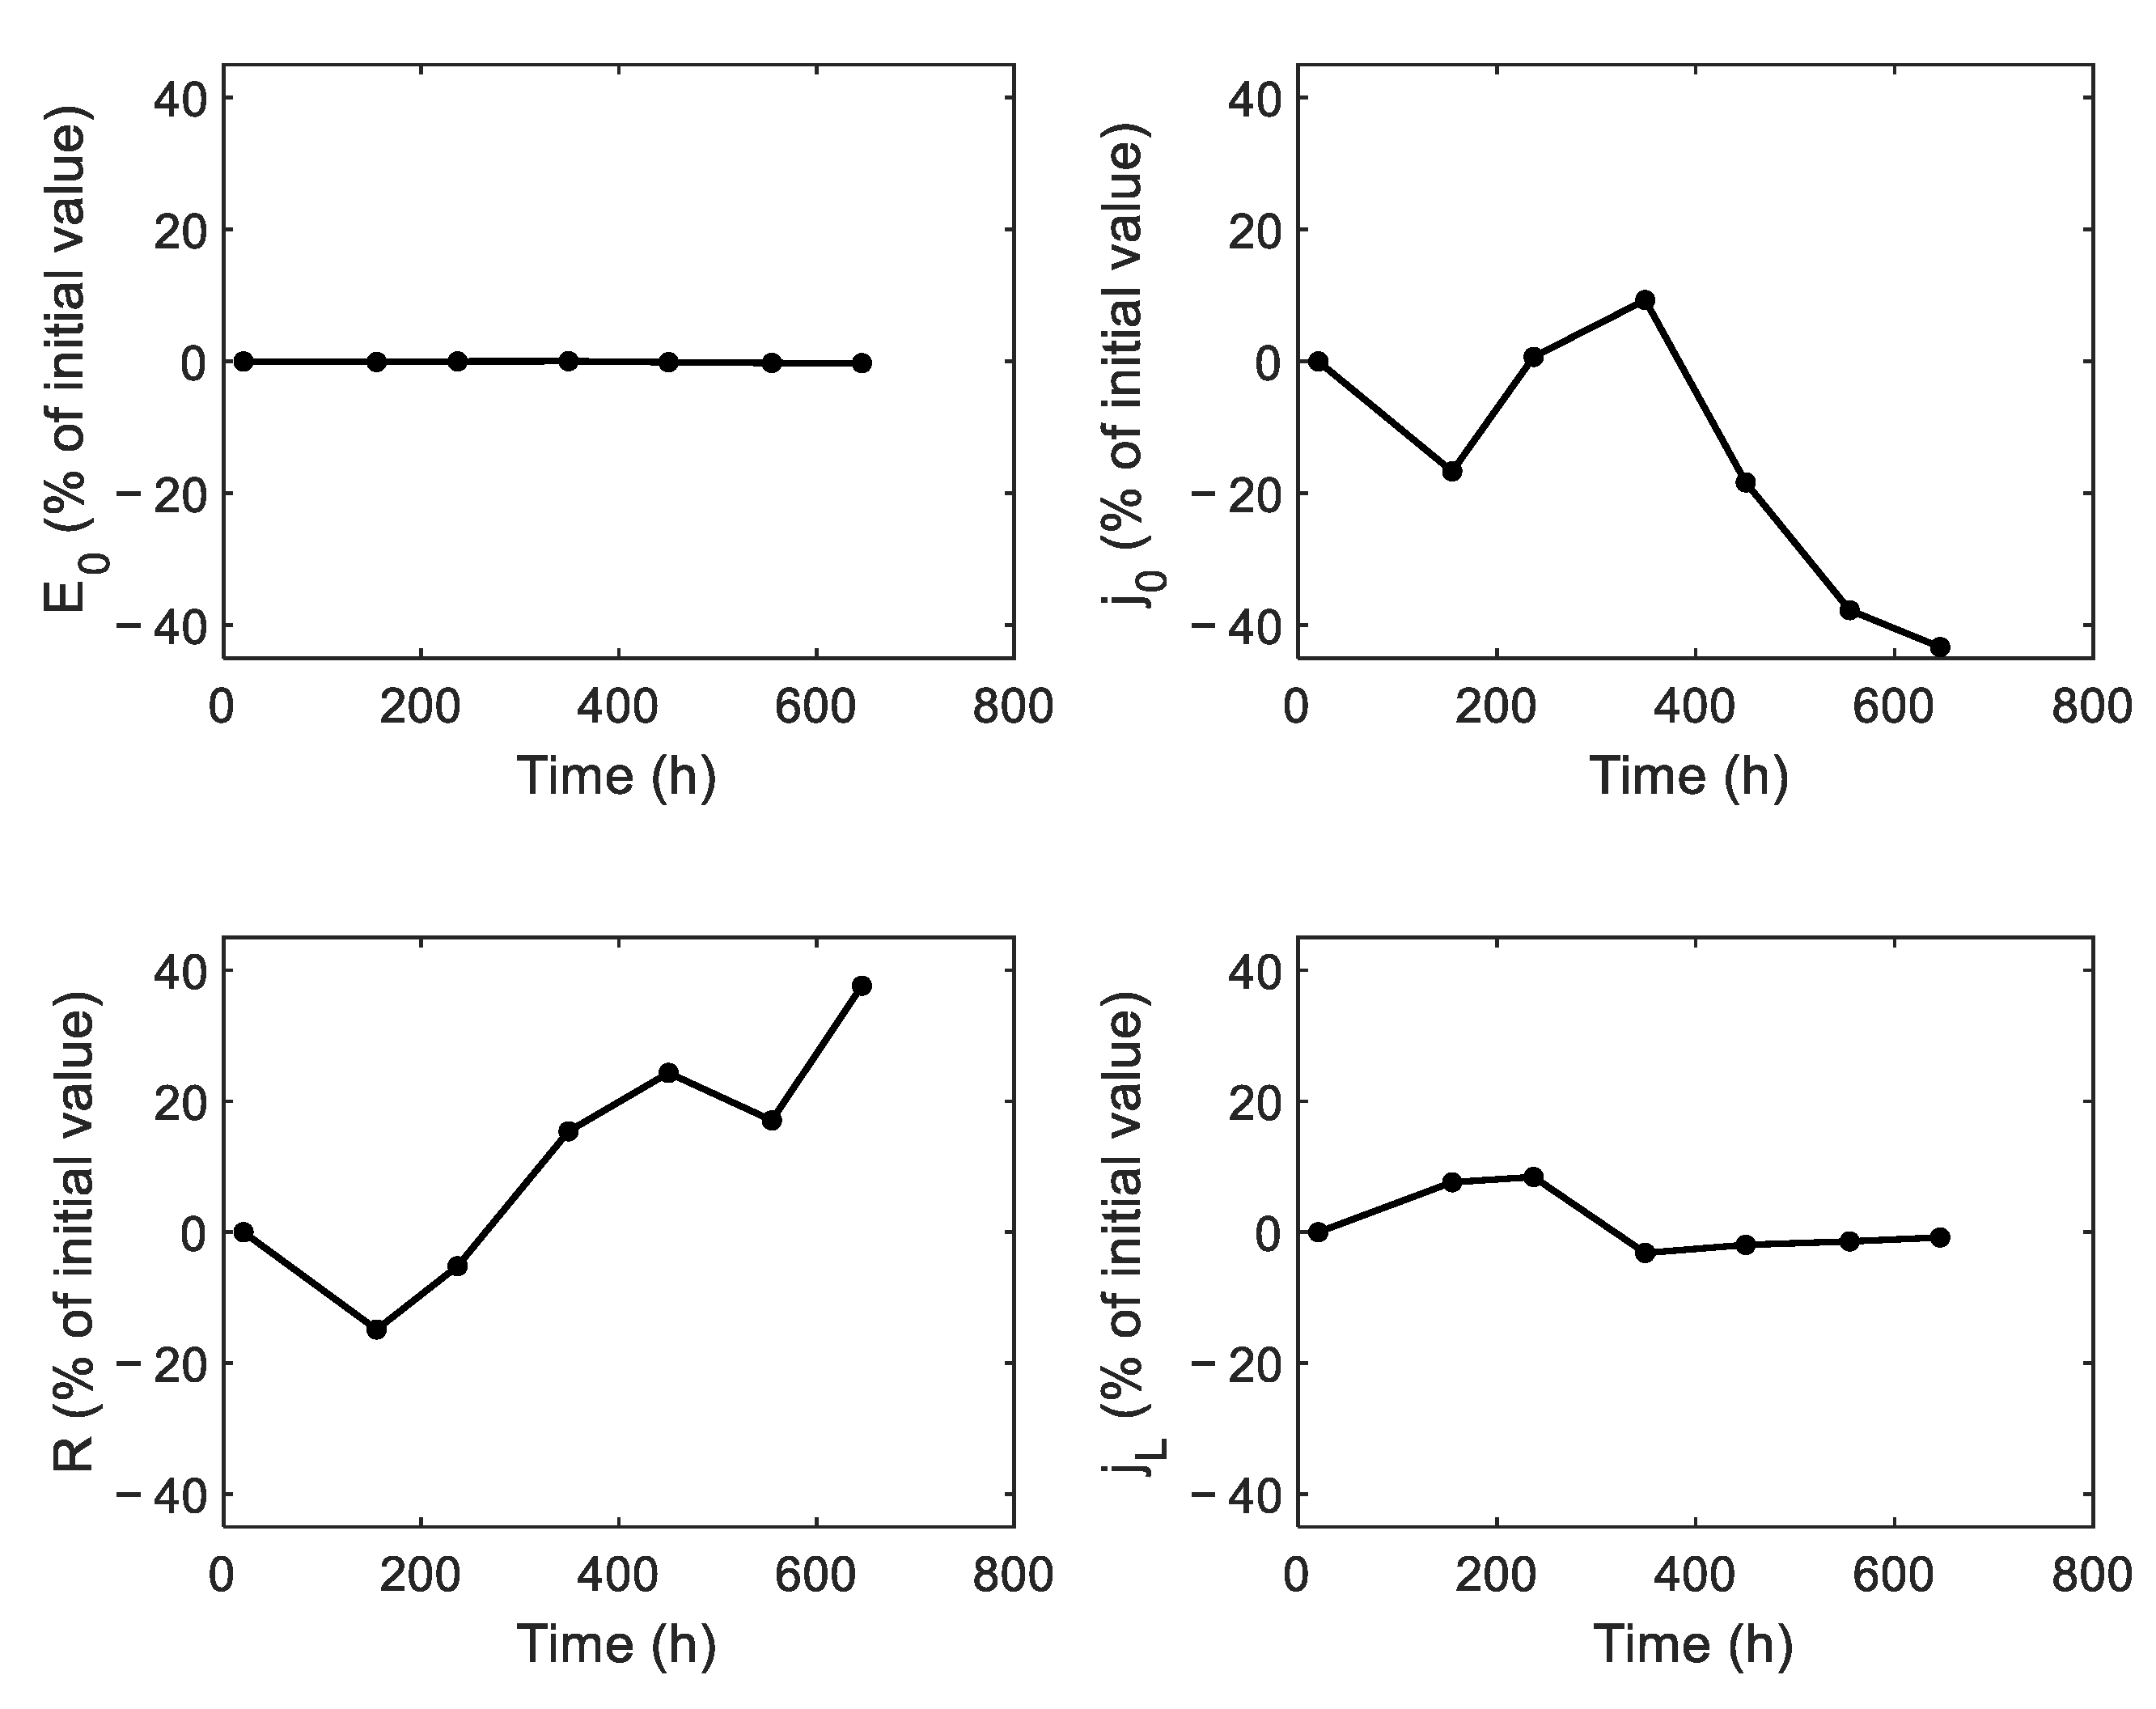
4.2. A New Health Indicator
According to the discussions in Section 4.1, although the parameter can reflect the degradation degree of PEMFCs quite well, the precise threshold cannot be obtained beforehand. Moreover, different materials, synthesis processes and assembly technologies also have impacts on it. Hence, a more suitable health indicator should be selected to replace it. As mentioned in Section 1, although there are many health indicators (e.g., measured voltage, measured power, ECSA, model parameters et al.) that have been used in this field, few of them are applicable for variable loading conditions online. Here, we propose a new health indicator, the rated voltage, which is suitable for constant and variable loading conditions and also can be obtained online. DOE defines that the EOL is reached when PEMFC’s initial performance degrades by 10%. Taking the most easily measured voltage as an example, this criterion can be realized easily under constant loading conditions, just comparing the measured voltage value with the initial value. However, the current density varies with actual demands under variable loading conditions and, correspondingly, the output voltage will change with it, which means that the measured voltage and the initial voltage value cannot be compared directly. In order to overcome this problem, the following strategy has been followed: replace the real measured voltage with the rated voltage. The detailed definition is as follows:
The real measured voltage at time k is defined as:
The rated voltage at time k is defined as:
Where k is the current time, is the degradation degree of the PEMFCs at time k, is the actual loading current density at time k, is the rated current density, which is a consist value. Theoretically, the rated current density can be any value, and 1.0 A cm−2 is chosen in this paper.
Comparing and , we can find that the real measured voltage is not only affected by the degradation degree , but also by loading current density . However, the rated voltage is only affected by . In this way, the new health indicator, rated voltage , can successfully eliminate the influence of current density and highlight the influence of degradation degree. The estimated rated voltage at different times can be calculated according to the Equation (10) (=) and . The results are shown in Figure 7 (green line). Between 0 and 620 h, the estimated is equal to the , because A cm−2. After 620 h, the measured voltage and estimated voltage by particle filter increase rapidly because of the change of current density from 1.0 A cm−2 to 0.8 A cm−2, while the estimated rated voltage keeps the degradation trend regardless of the changes of current density. This shows can eliminate the influence of current density and reflect the health status of PEMFCs. The polarization curve test shows that the measured voltage under 1.0 A cm−2 is 0.5454 V at 646 h, it is close to the estimated rated voltage 0.5530 V at the same time, which means the rated voltage is a valid health indicator for constant and variable loading conditions.
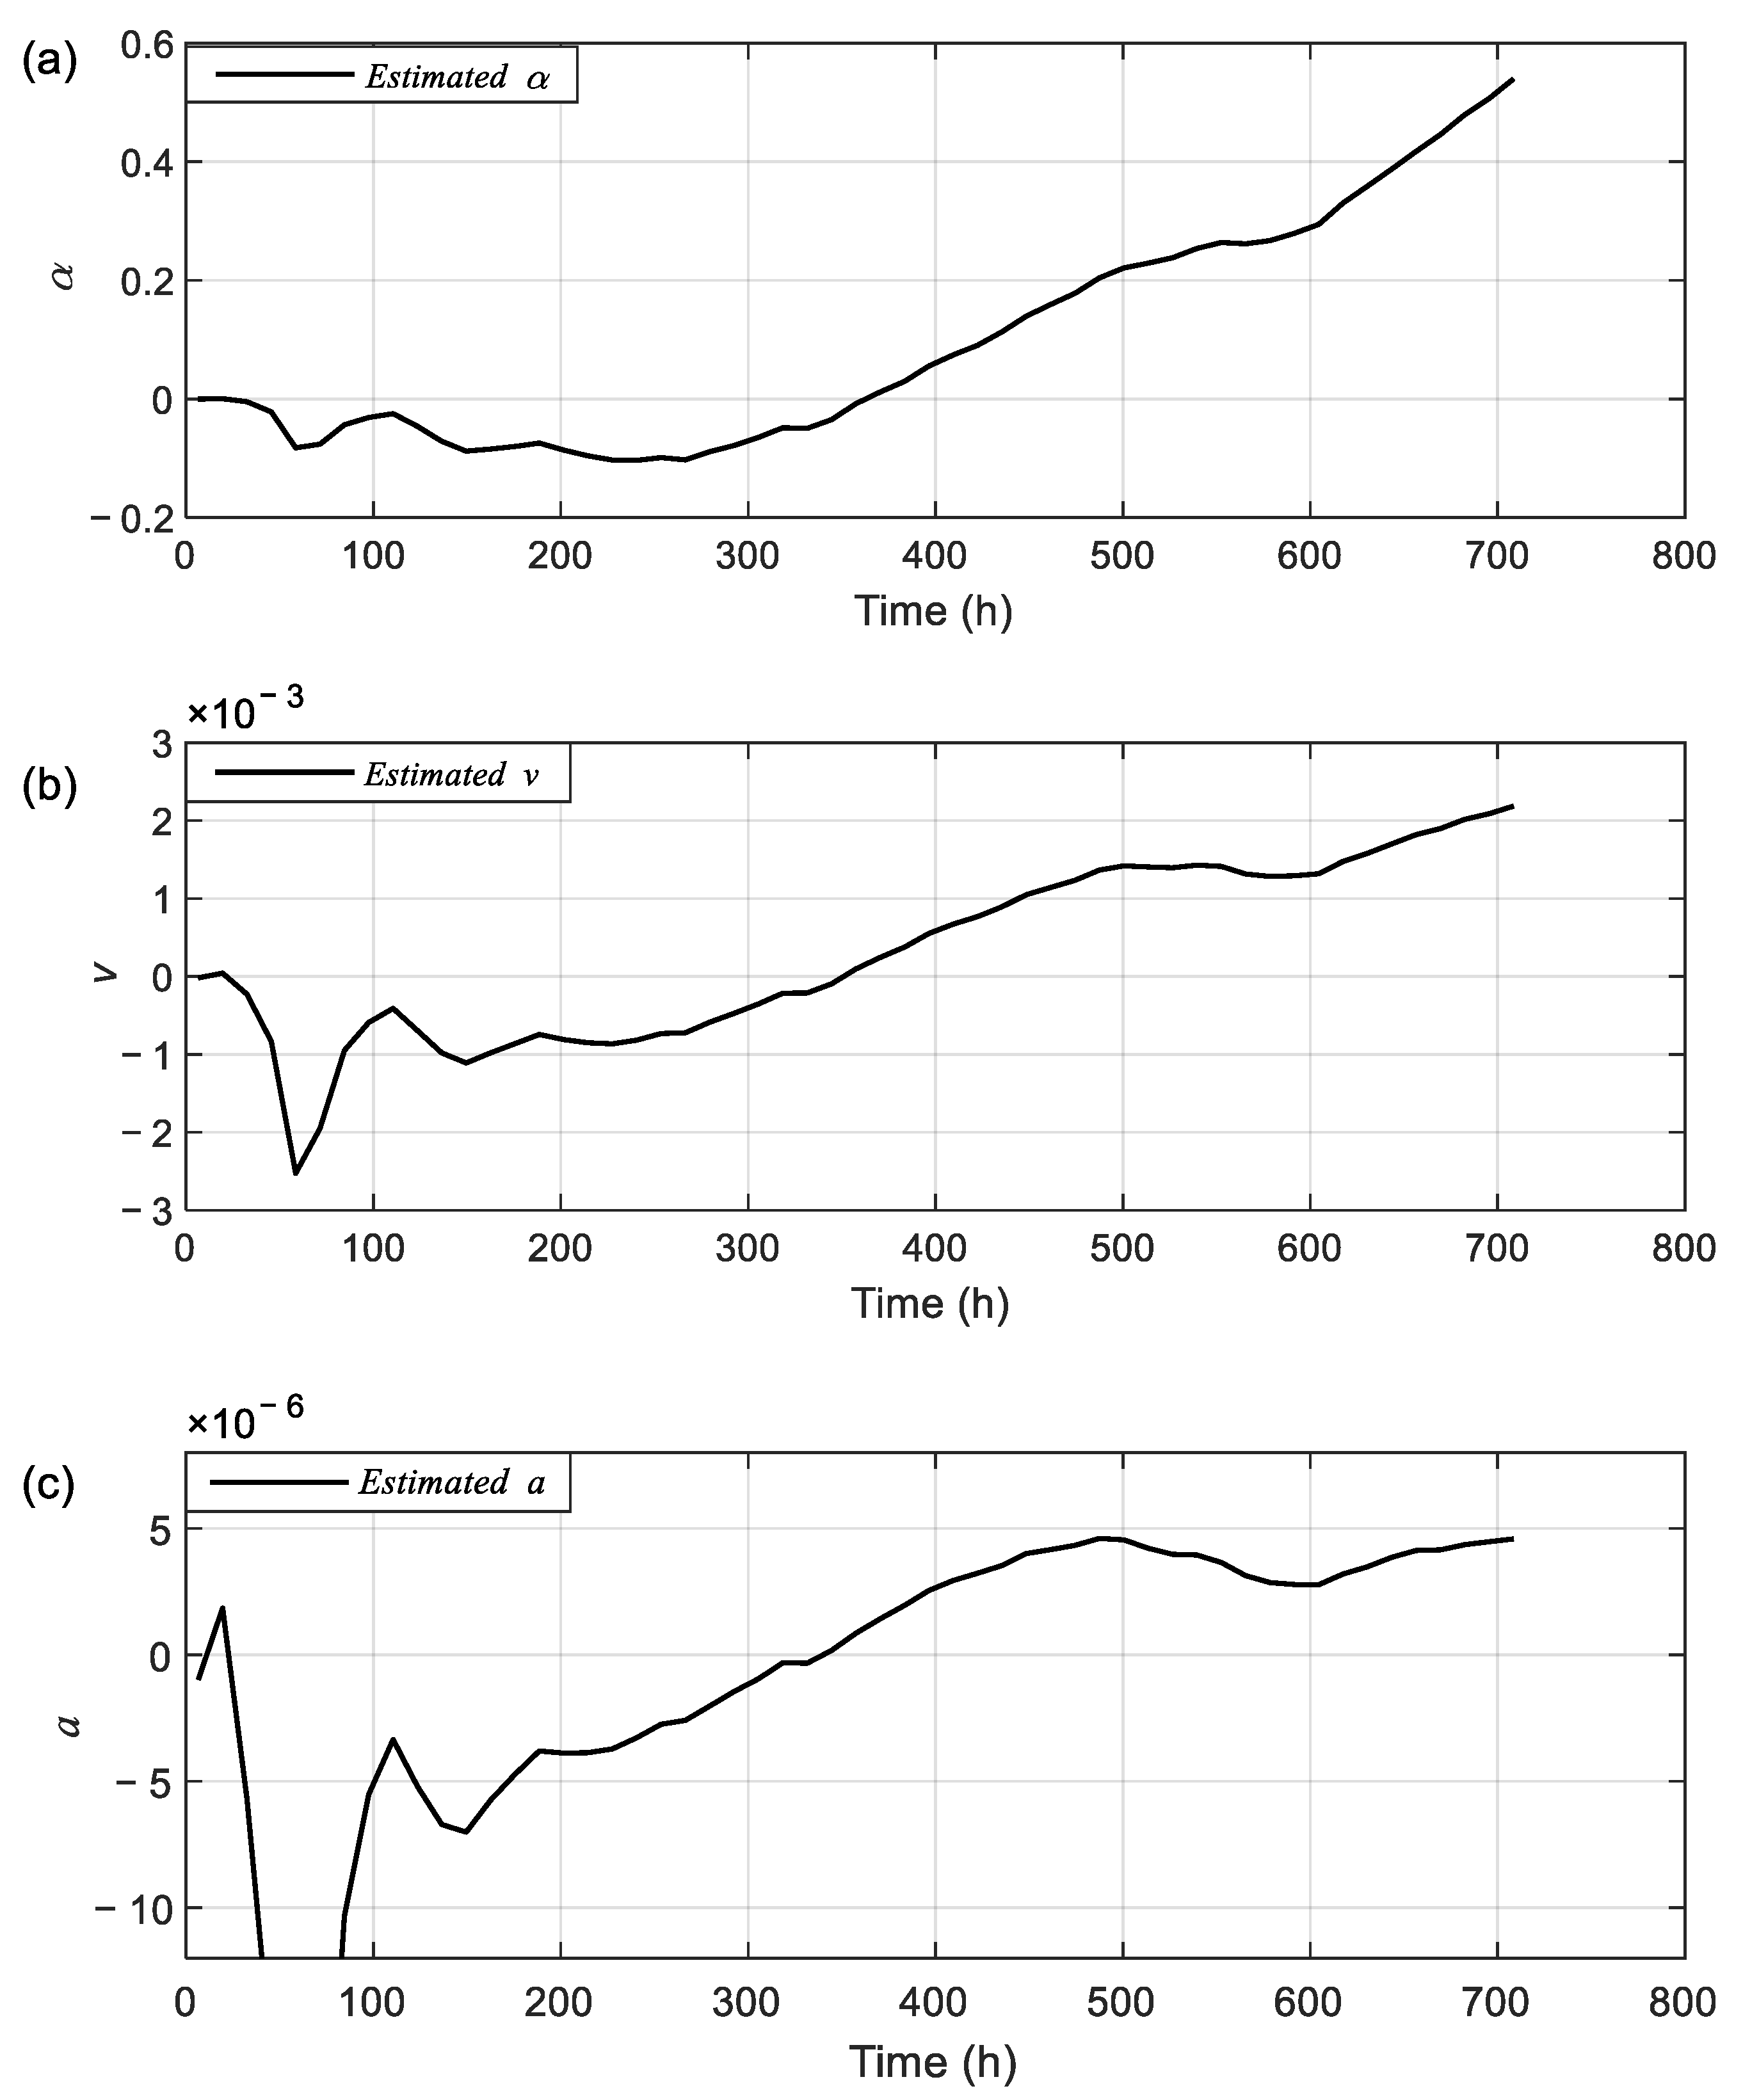
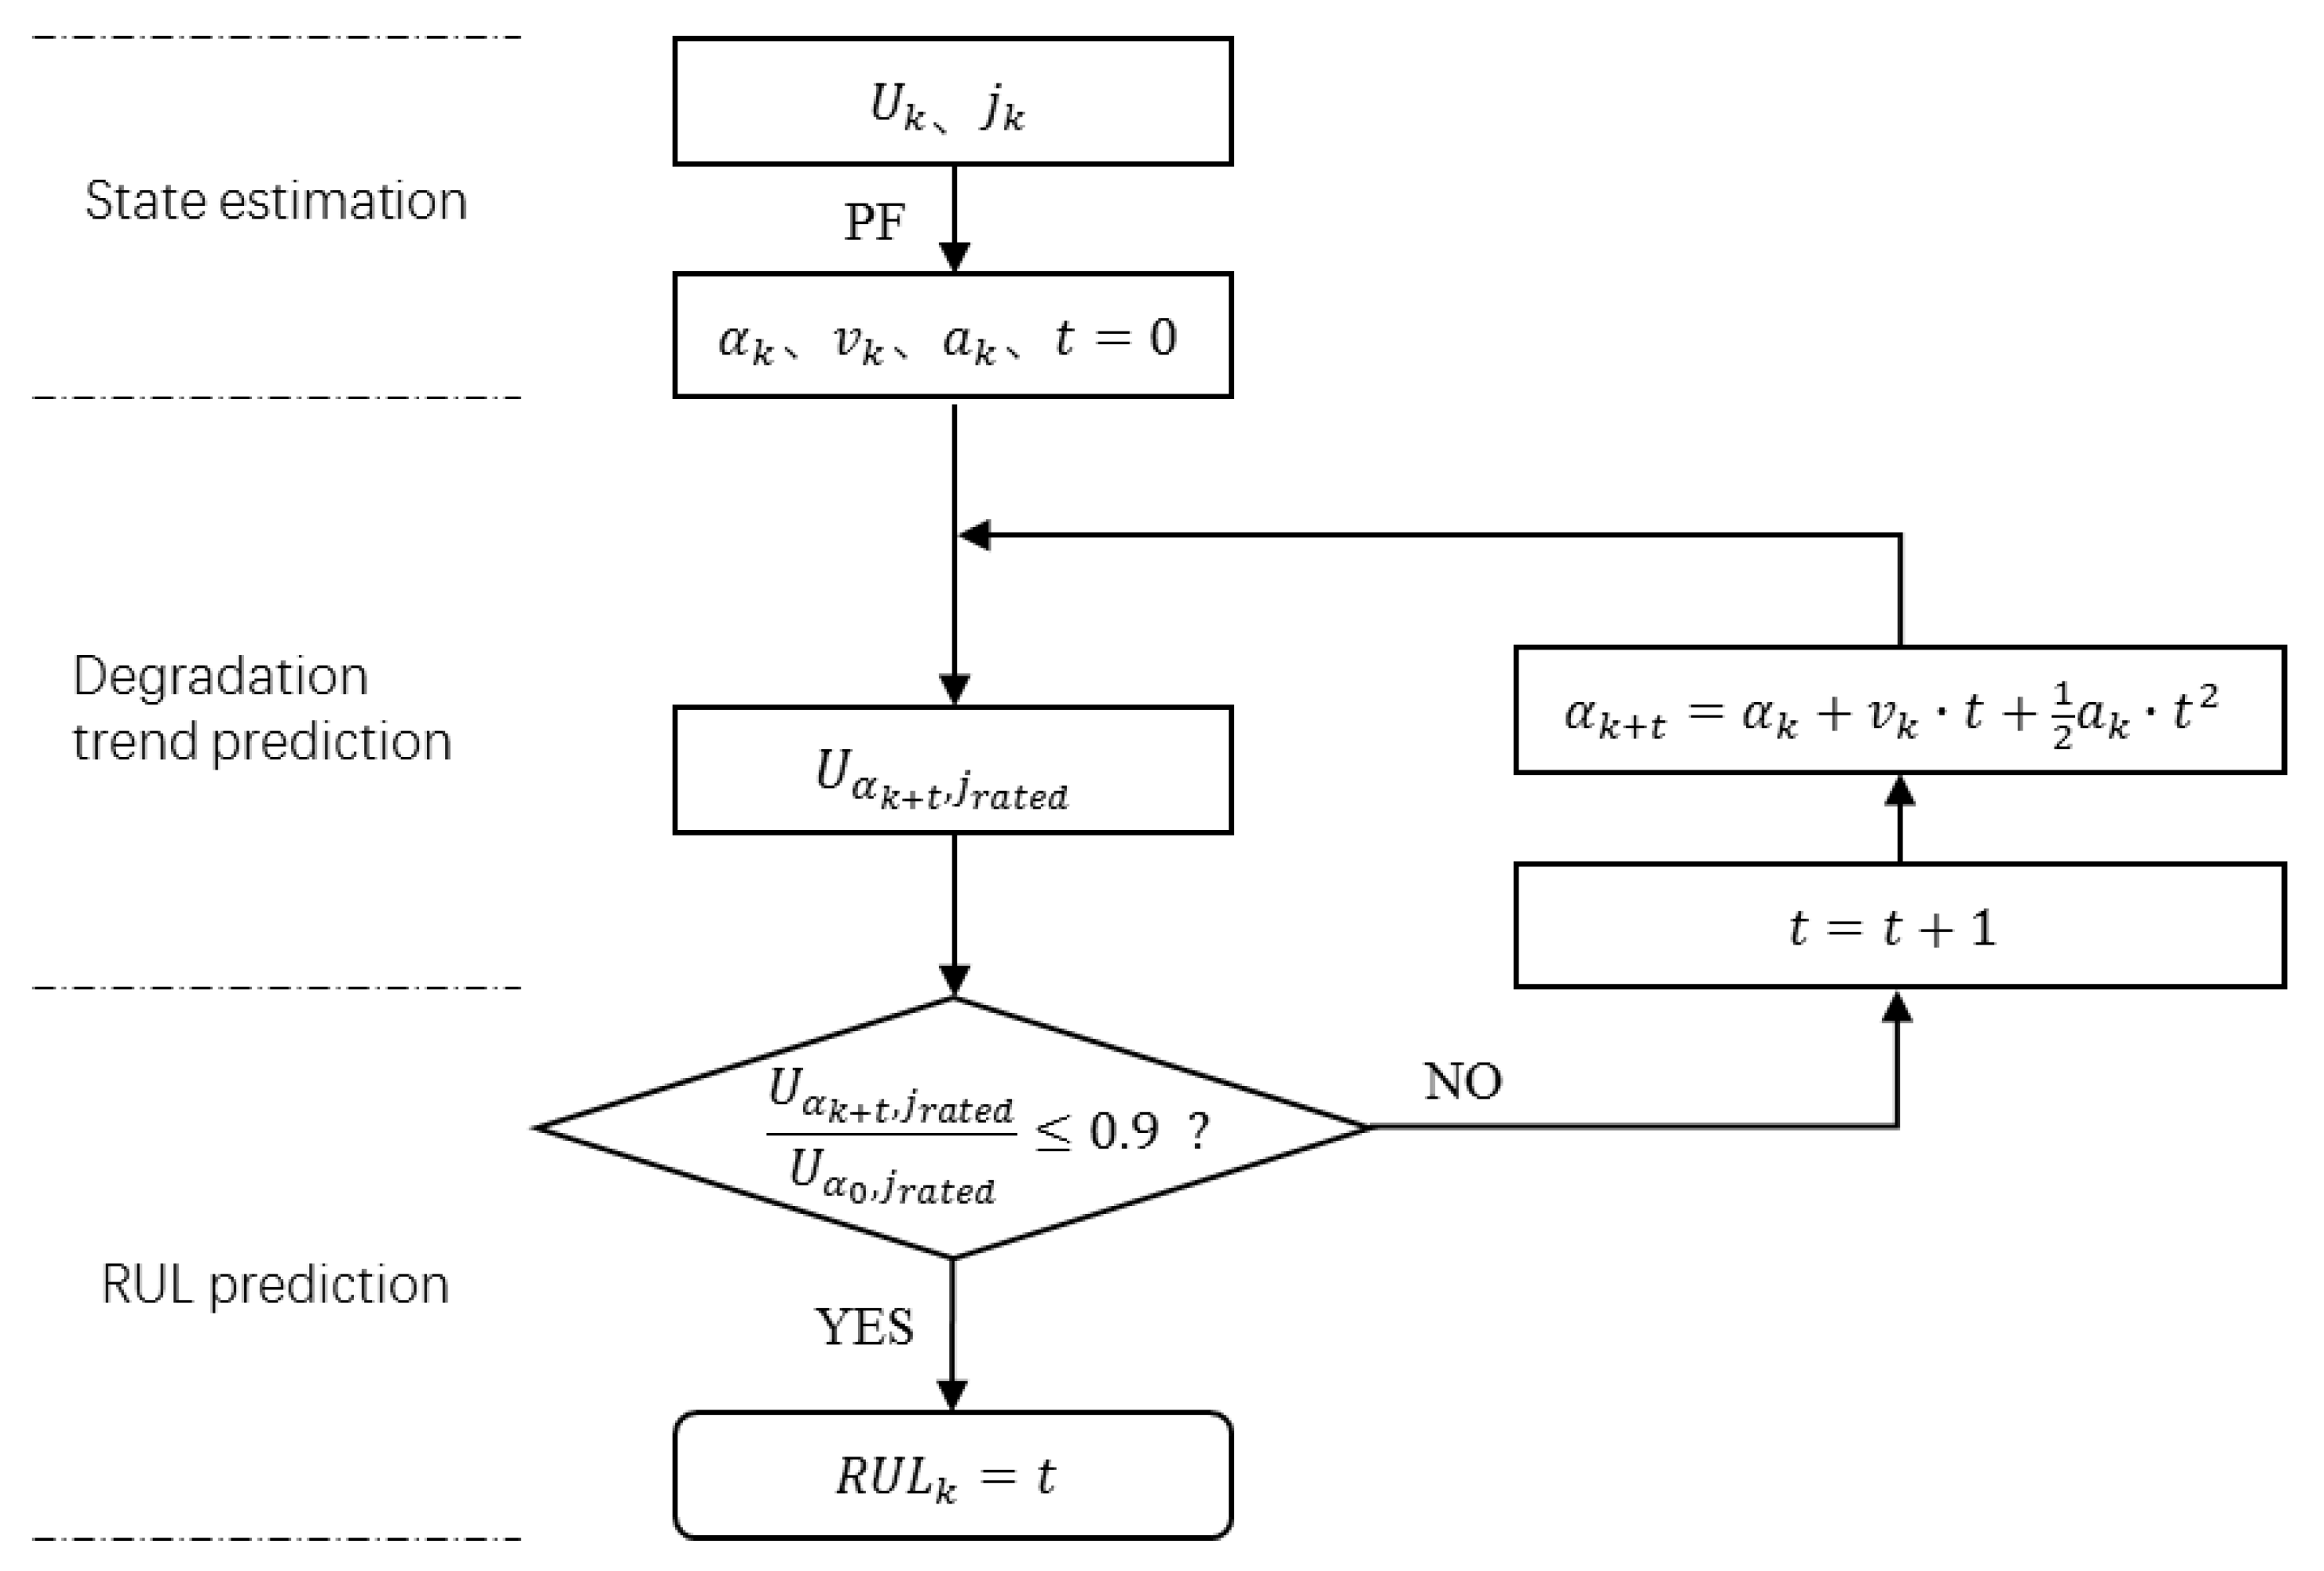
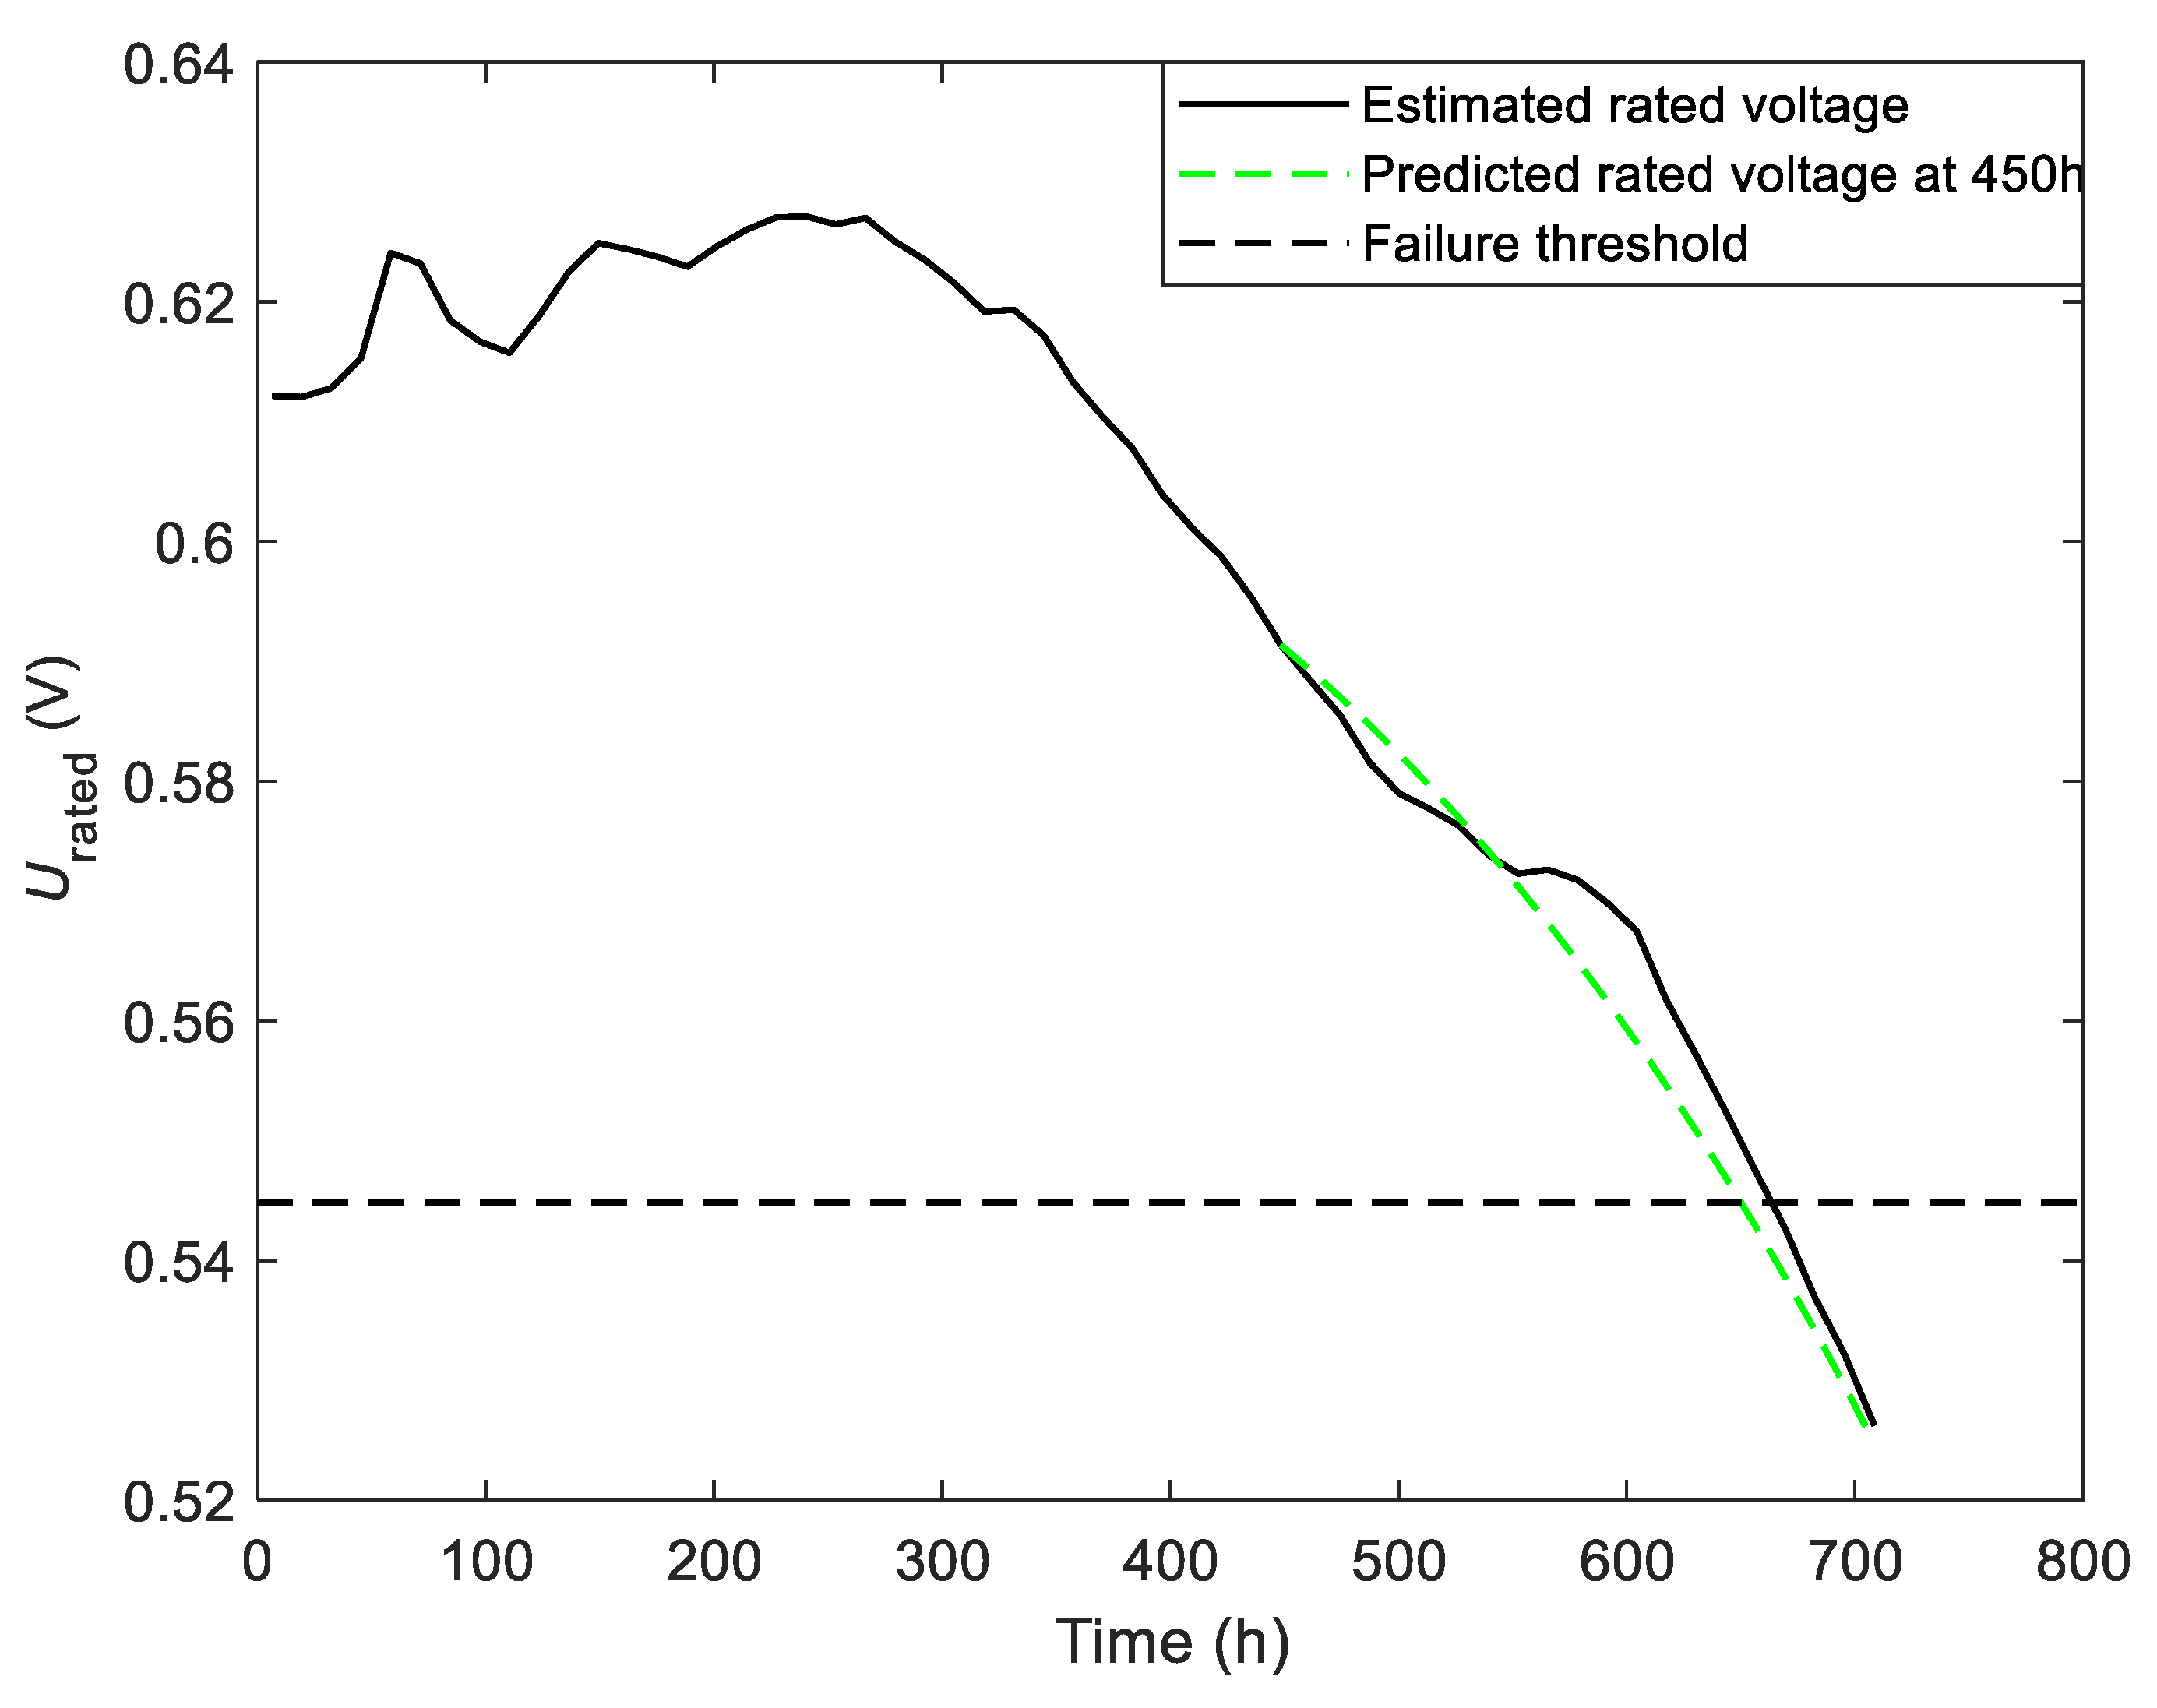
4.3. Degradation Trend Prediction
The state of the PEMFCs stack at the current time k can be gotten in Section 4.1. It is worth noting that the current time is k, so the information after k is unknown, therefore the future degradation trend should be predicted based on the information before time k. Here the state is used to predict the future degradation trend, and the algorithm is presented in Figure 8.
Figure 8.
The degradation trend and remaining useful life (RUL) prediction algorithm.
As shown in Figure 8, in the state estimation part, the degradation degree , the degradation speed and the degradation acceleration can be estimated by particle filter at time k. Next, in the part of degradation trend prediction, iterating the empirical degradation model (Equation (5)), the can be gotten when has converged. Last, the rated voltage can be calculated by the predicted according to Equation (10). It should be noted that the degradation trend can be predicted at every moment. For example, when the current time is 450 h, the degradation degree , the degradation speed and the degradation acceleration can be estimated by particle filter online, then the future degradation trend can be predicted based on this information. Figure 9 shows that the predicted rated voltage is close to the estimated rated voltage, the error is only 0.0045 V, which means that the model has a good ability to predict the degradation trend.
Figure 9.
The degradation trend predicted at different time.
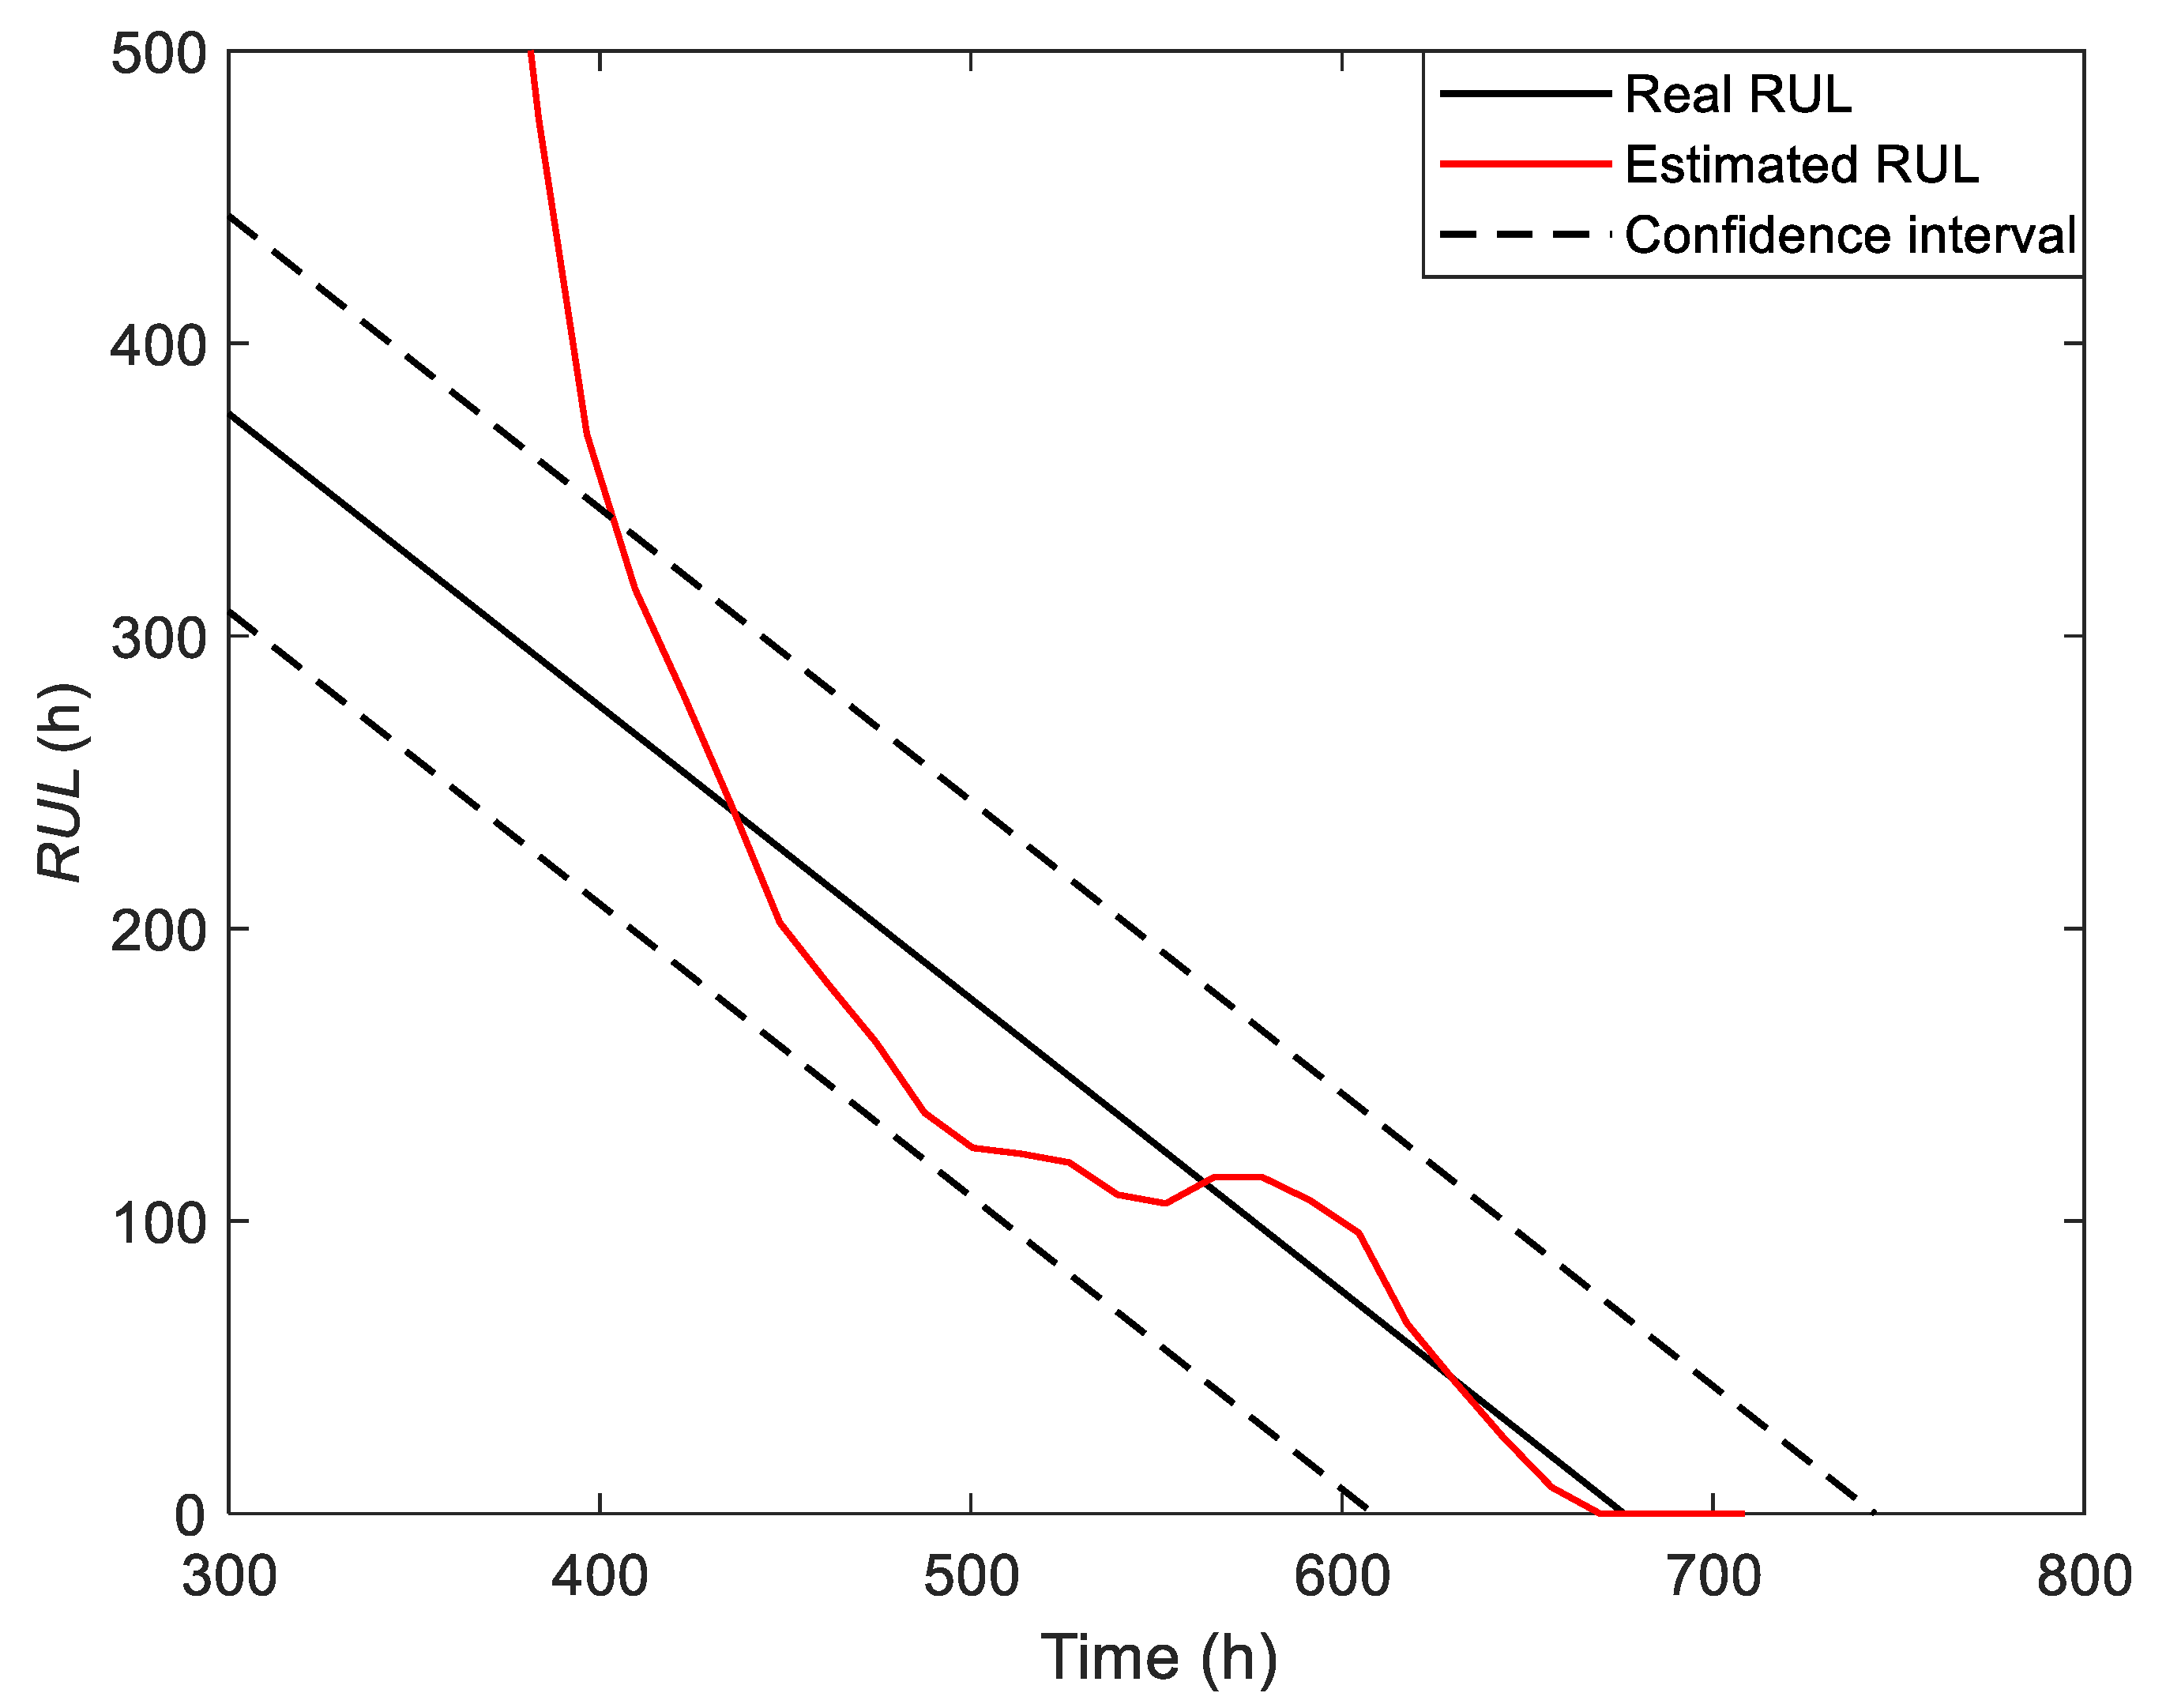
4.4. Remaining Useful Life Estimation
Following Section 4.3, the future rated voltage can be estimated according to the algorithm shown in Figure 8. We repeat the degradation trend prediction part, until the comes up to 90% of the initial rated voltage . Then according to Equation (1), we can conclude that the time t is the remaining useful life at time k, and the estimated RUL results at different times are shown in Figure 10. It takes about 370 h for the algorithm to converge. When converges, the algorithm can successfully predict the RUL of PEMFCs. After 400 h in particular, the predicted RUL falls within the 90% confidence interval, in other words, the predicted RUL is within the bounds ±10% of the maximum lifetime, which means that the prediction algorithm has a high accuracy.
Figure 10.
RUL estimation.
5. Conclusions
A PEMFCs stack aging test was carried out in our laboratory, and seven polarization curves were measured during the experiment. In order to explore the degradation reasons, a polarization curve model was used to fit the polarization curves. It found that the exchange current density and resistance changed obviously, which may have been caused by fuel starvation and the hydrogen–air interface being under frequent start-stop conditions. Afterward, a quadratic function is built as the empirical degradation model according to the degradation evolution.
A model-based method is proposed to estimate the degradation degree , degradation speed and degradation acceleration of PEMFCs stack by particle filter. Besides, a new health indicator of PEMFCs, rated voltage, is proposed, which can be used online not only under constant loading conditions but also under variable loading conditions. Based on this information, the degradation trend and RUL can be estimated online. Moreover, the real aging test data show the proposed prognostics method can predict the degradation trend and RUL at variable degradation accelerations, which has great application potential.
Author Contributions
Conceptualization, W.S. and Z.S.; methodology, P.W. and H.L.; software, P.W.; validation, P.W.; formal analysis, P.W.; investigation, P.W.; resources, M.H., L.Z.; data curation, M.H., L.Z.; writing—original draft preparation, P.W.; writing—review and editing, P.W., H.L., Y.Y., J.G., Z.S.; visualization, P.W.; supervision, W.S., Z.S.; project administration, W.S.; funding acquisition, Z.S. and J.G. All authors have read and agreed to the published version of the manuscript.
Funding
This work was financially supported by the National Key Research and Development Program of China (No. 2018YFB1502502).
Institutional Review Board Statement
Not applicable.
Informed Consent Statement
Not applicable.
Data Availability Statement
The data presented in this study are available on request from the corresponding author. The data are not publicly available due to their current utilization for future works involving the authors of this paper.
Acknowledgments
The authors are very grateful to Chen Jian of Zhejiang University for his help and support in software.
Conflicts of Interest
The authors declare no conflict of interest.
Nomenclature
| Abbreviations | |
| PEMFCs | Proton exchange membrane fuel cells |
| RUL | Remaining useful life |
| EOL | End-of-life |
| DOE | (USA) Department of Energy |
| EKF | Extended Kalman Filter |
| UKF | Unscented Kalman Filter |
| AUKF | Adaptive Unscented Kalman Filter |
| PF | Particle Filter |
| ECSA | Electrochemical surface area |
| MEA | Membrane electrode assembly |
| RMSE | Root mean square error |
| Physis symbols | |
| The time to start the prediction (h) | |
| The end-of-life time (h) | |
| The average voltage of the PEMFCs stack (V) | |
| Voltage of the PEMFCs stack (V) | |
| Open circuit voltage (V) | |
| Gas constant (J mol−1 K−1) | |
| Thermodynamic temperature (K) | |
| Faraday constant (C mol−1) | |
| Current density (A cm−2) | |
| Exchange current density (A cm−2) | |
| Ohmic resistance (Ω) | |
| Limiting diffusion current density (A cm−2) | |
| The exchange current density at time t (A cm−2) | |
| The Ohmic resistance at time t (Ω) | |
| Degradation degree | |
| Degradation speed | |
| Degradation acceleration | |
| The health status of the PEMFCs stack at time k | |
| The average voltage of the PEMFCs stack at time k | |
| Process noise | |
| Observation noise | |
| The rated current density (A cm−2) | |
| The real measured voltage at time k (V) | |
| The rated voltage at time k (V) | |
References
- Cheng, Y.; Zerhouni, N.; Lu, C. A hybrid remaining useful life prognostic method for proton exchange membrane fuel cell. Int. J. Hydrogen Energy 2018, 43, 12314–12327. [Google Scholar] [CrossRef]
- Liu, H.; Chen, J.; Hou, M.; Shao, Z.; Su, H. Data-based short-term prognostics for proton exchange membrane fuel cells. Int. J. Hydrogen Energy 2017, 42, 20791–20808. [Google Scholar] [CrossRef]
- Priya, K.; Sathishkumar, K.; Rajasekar, N. A comprehensive review on parameter estimation techniques for Proton Exchange Membrane fuel cell modelling. Renew. Sustain. Energy Rev. 2018, 93, 121–144. [Google Scholar] [CrossRef]
- Zhang, X.; Yang, D.; Luo, M.; Dong, Z. Load profile based empirical model for the lifetime prediction of an automotive PEM fuel cell. Int. J. Hydrogen Energy 2017, 42, 11868–11878. [Google Scholar] [CrossRef]
- Pahon, E.; Morando, S.; Petrone, R.; Péra, M.C.; Hissel, D.; Yousfi-Steiner, N.; Jemei, S.; Gouriveau, R.; Chamagne, D.; Moçotéguy, P.; et al. Long-term tests duration reduction for PEMFC μ-CHP application. Int. J. Hydrogen Energy 2017, 42, 1527–1533. [Google Scholar] [CrossRef]
- Ibrahim, M.; Steiner, N.Y.; Jemei, S.; Hissel, D. Wavelet-Based Approach for Online Fuel Cell Remaining Useful Lifetime Prediction. IEEE Trans. Ind. Electron. 2016, 63, 5057–5068. [Google Scholar] [CrossRef]
- Jouin, M.; Gouriveau, R.; Hissel, D.; Péra, M.-C.; Zerhouni, N. Prognostics and Health Management of PEMFC—State of the art and remaining challenges. Int. J. Hydrogen Energy 2013, 38, 15307–15317. [Google Scholar] [CrossRef] [Green Version]
- Sutharssan, T.; Montalvao, D.; Chen, Y.K.; Wang, W.-C.; Pisac, C.; Elemara, H. A review on prognostics and health monitoring of proton exchange membrane fuel cell. Renew. Sustain. Energy Rev. 2017, 75, 440–450. [Google Scholar] [CrossRef] [Green Version]
- Yang, C.; Li, Z.; Liang, B.; Lu, W.; Wang, X.; Liu, H. A particle filter and long short term memory fusion algorithm for failure prognostic of proton exchange membrane fuel cells. In Proceedings of the 2017 29th Chinese Control and Decision Conference (CCDC), Chongqing, China, 28–30 May 2017; pp. 5646–5651. [Google Scholar]
- ISO. Condition Monitoring and Diagnostics of Machinery-Prognostics—Part 1: General Guidelines, Technical Report ISO 13381-1; ISO: Geneva, Switzerland, 2004. [Google Scholar]
- Bressel, M.; Hilairet, M.; Hissel, D.; Bouamama, B.O. Remaining Useful Life Prediction and Uncertainty Quantification of Proton Exchange Membrane Fuel Cell Under Variable Load. IEEE Trans. Ind. Electron. 2016, 63, 2569–2577. [Google Scholar] [CrossRef]
- U.D. of Energy. The Department of Energy Hydrogen and Fuel Cells Program Plan, Technical Report, U.D. of Energy; 2011. Available online: http://www.hydrogen.energy.gov/roadmapsvision.html (accessed on 5 November 2020).
- Liu, H.; Chen, J.; Ouyang, Q.; Su, H. A Review on Prognostics of Proton Exchange Membrane Fuel Cells. In Proceedings of the 2016 IEEE Vehicle Power and Propulsion Conference (VPPC), Hangzhou, China, 17–20 October 2016; pp. 1–6. [Google Scholar]
- Jouin, M.; Gouriveau, R.; Hissel, D.; Péra, M.-C.; Zerhouni, N. Prognostics of PEM fuel cell in a particle filtering framework. Int. J. Hydrogen Energy 2014, 39, 481–494. [Google Scholar] [CrossRef] [Green Version]
- Bressel, M.; Hilairet, M.; Hissel, D.; Ould Bouamama, B. Extended Kalman Filter for prognostic of Proton Exchange Membrane Fuel Cell. Appl. Energy 2016, 164, 220–227. [Google Scholar] [CrossRef]
- Mao, L.; Jackson, L.; Jackson, T. Investigation of polymer electrolyte membrane fuel cell internal behaviour during long term operation and its use in prognostics. J. Power Sources 2017, 362, 39–49. [Google Scholar] [CrossRef] [Green Version]
- Morando, S.; Jemei, S.; Hissel, D.; Gouriveau, R.; Zerhouni, N. Proton exchange membrane fuel cell ageing forecasting algorithm based on Echo State Network. Int. J. Hydrogen Energy 2017, 42, 1472–1480. [Google Scholar] [CrossRef]
- Morando, S.; Jemei, S.; Gouriveau, R.; Zerhouni, N.; Hissel, D. Fuel Cells prognostics using echo state network. In Proceedings of the IECON 2013-39th Annual Conference of the IEEE Industrial Electronics Society, Vienna, Austria, 10–13 November 2013; pp. 1632–1637. [Google Scholar]
- Silva, R.E.; Gouriveau, R.; Jemeï, S.; Hissel, D.; Boulon, L.; Agbossou, K.; Yousfi Steiner, N. Proton exchange membrane fuel cell degradation prediction based on Adaptive Neuro-Fuzzy Inference Systems. Int. J. Hydrogen Energy 2014, 39, 11128–11144. [Google Scholar] [CrossRef] [Green Version]
- Wu, Y.; Breaz, E.; Gao, F.; Miraoui, A. A Modified Relevance Vector Machine for PEM Fuel-Cell Stack Aging Prediction. IEEE Trans. Ind. Appl. 2016, 52, 2573–2581. [Google Scholar] [CrossRef]
- Wu, Y.; Breaz, E.; Gao, F.; Paire, D.; Miraoui, A. Nonlinear performance degradation prediction of proton exchange membrane fuel cells using relevance vector machine. IEEE Trans. Energy Convers. 2016, 31, 1570–1582. [Google Scholar] [CrossRef]
- Liu, H.; Chen, J.; Hissel, D.; Su, H. Remaining useful life estimation for proton exchange membrane fuel cells using a hybrid method. Appl. Energy 2019, 237, 910–919. [Google Scholar] [CrossRef]
- Javed, K.; Gouriveau, R.; Zerhouni, N.; Hissel, D. Prognostics of Proton Exchange Membrane Fuel Cells stack using an ensemble of constraints based connectionist networks. J. Power Sources 2016, 324, 745–757. [Google Scholar] [CrossRef]
- Kimotho, J.K.; Meyer, T.; Sextro, W. PEM fuel cell prognostics using particle filter with model parameter adaptation. In Proceedings of the 2014 International Conference on Prognostics and Health Management, Cheney, WA, USA, 22–25 June 2014; pp. 1–6. [Google Scholar]
- Jouin, M.; Gouriveau, R.; Hissel, D.; Péra, M.; Zerhouni, N. Joint Particle Filters Prognostics for Proton Exchange Membrane Fuel Cell Power Prediction at Constant Current Solicitation. IEEE Trans. Reliab. 2016, 65, 336–349. [Google Scholar] [CrossRef]
- Jouin, M.; Gouriveau, R.; Hissel, D.; Péra, M.; Zerhouni, N. Prognostics of Proton Exchange Membrane Fuel Cell stack in a particle filtering framework including characterization disturbances and voltage recovery. In Proceedings of the 2014 International Conference on Prognostics and Health Management, Cheney, WA, USA, 22–25 June 2014; pp. 1–6. [Google Scholar]
- Zhang, X.; Pisu, P. An unscented Kalman filter based approach for the health-monitoring and prognostics of a polymer electrolyte membrane fuel cell. In Proceedings of the Annual Conference of the Prognostics and Health Management Society 2012, PHM 2012, Minneapolis, MN, USA, 23–27 September 2012; pp. 353–361. [Google Scholar]
- Polverino, P.; Pianese, C. Model-based prognostic algorithm for online RUL estimation of PEMFCs. In Proceedings of the 2016 3rd Conference on Control and Fault-Tolerant Systems (SysTol), Barcelona, Spain, 7–9 September 2016; pp. 599–604. [Google Scholar]
- Chen, J.; Zhou, D.; Lyu, C.; Lu, C. A novel health indicator for PEMFC state of health estimation and remaining useful life prediction. Int. J. Hydrogen Energy 2017, 42, 20230–20238. [Google Scholar] [CrossRef]
- Liu, H.; Chen, J.; Zhu, C.; Su, H.; Hou, M. Prognostics of Proton Exchange Membrane Fuel Cells Using A Model-based Method. IFAC Pap. 2017, 50, 4757–4762. [Google Scholar] [CrossRef]
- Jouin, M.; Bressel, M.; Morando, S.; Gouriveau, R.; Hissel, D.; Péra, M.-C.; Zerhouni, N.; Jemei, S.; Hilairet, M.; Ould Bouamama, B. Estimating the end-of-life of PEM fuel cells: Guidelines and metrics. Appl. Energy 2016, 177, 87–97. [Google Scholar] [CrossRef] [Green Version]
- Blal, M.; Benatiallah, A.; NeÇaibia, A.; Lachtar, S.; Sahouane, N.; Belasri, A. Contribution and investigation to compare models parameters of (PEMFC), comprehensives review of fuel cell models and their degradation. Energy 2019, 168, 182–199. [Google Scholar] [CrossRef]
- Zhang, T.; Wang, P.; Chen, H.; Pei, P. A review of automotive proton exchange membrane fuel cell degradation under start-stop operating condition. Appl. Energy 2018, 223, 249–262. [Google Scholar] [CrossRef]
- Javier Pinar, F.; Rastedt, M.; Pilinski, N.; Wagner, P. Effect of idling temperature on high temperature polymer electrolyte membrane fuel cell degradation under simulated start/stop cycling conditions. Int. J. Hydrogen Energy 2016, 41, 19463–19474. [Google Scholar] [CrossRef]
- Chen, K.; Laghrouche, S.; Djerdir, A. Fuel cell health prognosis using Unscented Kalman Filter: Postal fuel cell electric vehicles case study. Int. J. Hydrogen Energy 2019, 44, 1930–1939. [Google Scholar] [CrossRef]
Publisher’s Note: MDPI stays neutral with regard to jurisdictional claims in published maps and institutional affiliations. |
© 2021 by the authors. Licensee MDPI, Basel, Switzerland. This article is an open access article distributed under the terms and conditions of the Creative Commons Attribution (CC BY) license (https://creativecommons.org/licenses/by/4.0/).