Abstract
The Association of Southeast Asian Nations (ASEAN) has experienced rapid social and economic development in the past decades, while energy shortage, environmental pollution, and climate change are the factors that prevent a sustainable development process. Deployment of solar photovoltaic (PV) power is one of the effective alternatives to overcome the above barriers and assist ASEAN to achieve the aspirational target of 23% renewable energy (RE) in the total primary energy supply (TPES). In this study, SWOT analysis is adopted to analyze the internal strengths and weaknesses and the external threats and opportunities tightly related to the development of solar PV power in ASEAN countries. Through the SWOT analysis, great potential for the development of solar PV power in ASEAN is found. As long as appropriate policies are implemented and proper actions are taken, huge space for deployment of solar PV power can be expected. Based on the SWOT analysis, countermeasures that emphasize further deployment of solar PV power in ASEAN countries are put forward. The tactics include arousing people’s awareness of a sustainable development process, government issue coherence and stable incentive policies, fostering a solar PV industry chain and master key technology, and seek opportunities via an international cooperation.
1. Introduction
The Association of Southeast Asian Nations (ASEAN) is an important regional community. It was established in Bangkok, Thailand in 1967. Currently, 10 member states are on board: Brunei, Cambodia, Indonesia, Laos, Malaysia, Myanmar, Philippines, Singapore, Thailand, and Vietnam. In recent decades, ASEAN’s economy has experienced rapid development and has become a vibrant engine for the world’s economy. In 2019, the total GDP of ASEAN countries was U.S. dollars 3166 billion, and per capita GDP was U.S. dollars 4819 [1]. The average annual GDP growth rate in the past 10 years was more than 5% and this trend will continue [2]. With the influence of economic development and population growth, ASEAN’s demand for energy has also grown rapidly. According to the ASEAN Energy Outlook (the 6th edition, 2017–2040), energy consumption in the ASEAN region nearly doubled from 2005 to 2020. The total primary energy consumption of ASEAN countries in 2020 is expected to reach 699 Mtoe, which is an increase of 62.18% compared with 431 Mtoe in 2005. The expected energy consumption could achieve 1589 Mtoe in 2040 [3]. Due to restrictions related to the economic development stage, the overall energy consumption in the ASEAN region is at a comparatively lower level and it has long-term dependence on fossil fuel energy. The development of energy is on an extensive model, the utilization efficiency is lower, and the environmental pollution problem in the production and use process is prominent [4]. To reduce dependence on conventional fossil fuel energy and secure energy security, accessibility, affordability, and sustainability, ASEAN has formulated an aspirational target for the deployment of RE, which means 23% of RE in total primary energy supply (TPES) is projected [5]. Solar photovoltaic (PV) power enjoys the intrisic characteristics such as inexhaustibility, safety, friendliness to the environment [6], and now becomes affordable [7], which has attracted most countries’ attention and some of them have set short-term and long-term goals for the deployment of solar PV power.
With the advancement of solar PV’s technology and sharp reduction of its cost caused by the economies of scale, solar PV power has become the world’s third-largest source of REs. Together with wind power, they have become important factors in meeting the increasing demand for energy globally. In 2019, the world’s newly installed solar PV power generation capacity was 98.12 GW (cumulative 584.84 GW), among which China’s newly installed capacity was 30.20 GW (cumulative 205.49 GW), and the EU’s newly installed capacity was 19.33 GW (cumulative 138.5 GW). The United States newly installed capacity was 9.11 GW (cumulative 60.54 GW). India’s newly installed capacity was 7.71 GW (cumulative 35.06 GW) [8]. As long as the ASEAN’s members are concerned, Vietnam is the only country ranked in the top ten of 2019, with an incremental capacity of 5.59 GW, but its cumulative installed capacity has not entered into the top ten. At present, among ASEAN countries, Thailand is also in the leading position for the utilization of solar PV power [9].Once considering the countries currently at the forefront of solar PV power deployment, all of them have implemented relevant supporting policies to motivate the development of solar PV power [10]. For instance, Germany has revised its Renewable Energy Law in 2000, which promoted the rapid development of the solar PV industry [11]. China enacted its Renewable Energy Law in 2006 and made serval trial experiments such as the “Golden Sun Project”, the concession projects, the feed-in tariff (FIT) policy [12],the revised FIT, and the Green Certificate Scheme that lowered the fiscal burden [13]. China’s “Top Runner” program together with distributed policy led the solar PV power to grid-parity era [14]. Solar PV will eventually assist China to achieve its 2030 carbon emission commitment [15]. National and state-level policies, including the tax-refund scheme, technology supportive program, and other financial supports made United States ranks at the top three in the solar PV field [16]. India heartens the development of solar PV energy by issuing favorable FIT rates, long-term Power Purchase Agreement (PPAs) and a tax preference [17]. Japanese prefer solar than wind. Even solar PV power is much more expensive. After the Fukushima nuclear accident in 2011, Japan has made remarkable achievements to improve its energy mix by adopting solar PV energy through stimulating technical innovation and lower financial costs [18]. BP Energy Outlook 2020 predicted that, in order to achieve zero carbon emission, the cumulative installed capacity of wind and solar PV power will reach 20,000 GW by 2050. An average installed capacity of wind and solar may reach 350 GW and 550 GW annually, respectively. Electricity generated by wind and solar PV will account for more than 60% of the total energy supply [19].
Although Thailand and Vetnam performed well in solar PV power, most ASEAN countries have fallen far behind due to constraints from ecomomic factors, lack of incentive policies, and other unfavorable conditions. It is crucial time for ASEAN countries to consider thoughtfully to accelerate the development of solar PV power immediately. The deployment of solar PV power can lead to a sustainable development process as well as fill the gap between the energy demand and supply and also mitigate the environmental pollution and climate change caused by the consumption of fossil fuel energy [4].
2. Literature Review
With the development of solar PV power generation in some ASEAN countries, a variety of studies have been conducted to focus on ASEAN, and the studies mainly in the following three aspects.
The first aspect is to learn about the signal country’s policies. James Guild [20] compared the Philippines and Indonesia about their FIT scheme for the RE field (solar PV, wind, biomass). Indonesia was thoroughly defeated by the Philippines, since the Philippines’ FIT policy is market-based and the government effectiveness, regulatory quality, and rule of law are favorable, while Indonesia tends to protect the interest of monopoly giants in all aspects. Starting from 2006, Thailand performed very well on the solar side under the supportive policy of Alternative Energy Development Plan (AEDP 2018) with a target of 30% RE. Attractive FIT ensures the internal return rate (IRR) ranging from 11.83% to 15.32%. These incentive policies motivated the installation of solar PV power generation had reached 2812.62 MW by the end of 2018 [9], once ranked at No. one in the ASEAN region. Meanwhile, since 2019, because of the generous FIT rates up to U.S. dollars 95/MWh and also associated with long-term tax exemption making Vietnam surpass Thailand [21], the gaps between the cost of solar PV power and non-hydropower such as biomass power, geothermal power are narrowing, and the Vietnamese government is projecting a rise in solar PV power and wind power by implementing wider supporting policies [22].
The second aspect is taking ASEAN as an entire entity to evaluate and predict the development of RE. Abdul Muhaimin Ismail and Roberto Ramirez-Iniguez [23] reviewed the incentive policies for solar PV power in 10 of the ASEAN countries, but 5 of them were found without contribution and, therefore, resulted in low-level deployment, even though ASEAN countries’ are enjoying solar radiation of 1460 to 1892 kWh/m2 annually. A report issued by Asia Development Bank (ADB) in 2015 to explore the RE developments in 5 of Greater Mekong Subregion (GMS) countries focused on the technical consideration of solar resource, wind speed, and backup capacity of grid systems, policy, regulatory, and program measures were suggested to be implemented to reach sustainable development targets [24]. A report prepared by Abt Associates Inc. for U.S. Agency for International Development Regional Development Mission for Asia summarized that policy and regulatory incentives are key policy tools that drive the growth of clean energy in ASEAN countries, FITs, self-consumption schemes, tax incentives, soft loans, and other incentives performed together to expand the installed capacity of RE in ASEAN. The market-based mechanism of auction is also working to reduce the cost of the RE [25]. The research sponsored by Singapore National Research Foundation took the climate-based A-P model estimate that solar irradiation in ASEAN countries varies between 4.1 kWh/(m2/d) to 5.1 kWh/(m2/d), even though it is lower compared with Australia and India, considering the geographic advantages. The conservative potential generating capacity could be 430 TWh if 1% of the ASEAN’s land will be installed with solar PV power stations [26]. Building-integrated solar PV (BIPV) system is deemed to substitute some of the building materials, provides architectural elegance and the onsite generation of electricity produced by a solar PV system will reduce the utility bills. Akash Kumar Shukla studied the drivers and barriers existing in Southeast Asian countries for the exploitation of BIPV [27]. Though the cost of the solar PV power and other RE has declined rapidly in the past years, the reliable data to support the decision is still not adequate. Experts conducted a spital estimate of levelized cost of electricity (LCOE) by Net Present Value (NPV) in ASEAN countries, which provide strong insights and databases for solar PV power generation [28]. The Renewable Energy Institute also pointed out that the ASEAN countries are rich in solar resources and have appropriate wind speed. RE could play a more vital role in the energy mix in ASEAN countries [29]. Erdiwansyah et al. [30] researched the development of RE in ASEAN countries. They believe to achieve the 23% RE ratio by 2030, the governments have to remove subsidies for fossil fuels. Incentive policies for RE and regional cooperation are most urgent. Other scholars assessing the technical potential of ASEAN countries to achieve a 100% RE supply, found that solar PV power eventually will act as the most vital role. The ideal potential installed capacity is expected to reach 54,131 TWh [31].
The rest of the studies evaluated the yield performance of the solar PV power stations in ASEAN. Findings showed the fixed flat system was more affected by air pollution than the tracking flat plate [32] and anthropogenic haze from Indonesia to Singapore caused the yield loss of the solar PV system to a 15%–25% range [33], but the solar-assisted cooling system could help utilize the solar radiation to some extent [34]. This may result due to the temperature coefficient.
The existing studies have made a significant contribution to the development of solar PV power generation in some ASEAN countries. However, studies that focus on individual countries cannot provide macro guidance for the development of solar PV power in ASEAN countries, while research concerning overall REs from macro perspectives are too macroscopic to provide specific guidance for the development of solar PV power. In order to supplement the gap in existing research, it is extremely urgent to launch a research focus on solar PV power exclusively, since the development of solar PV power cannot only help to meet the increasing energy demand, control environmental pollution, and climate change but also has a practical significance for ASEAN countries to achieve the 23% target in TPES by 2030. To form a comprehensive understanding of the situation, Daniel del Barrio Alvarez and Masahiro Sugiyama [35] have set a good example for us. They adopted SWOT analysis to evaluate the development of large-scale grid-connected solar PV power generation in Myanmar. Inspired by their intelligence, we would like to adopt SWOT analysis to investigate the internal strengths and weaknesses as well as the external opportunities and threats confronting with the development of solar PV power in ASEAN countries.
3. Research Methodology
3.1. Brief Introduction to SWOT Analysis Framework
SWOT analysis is a common strategic analysis tool. It is also known as situational analysis, which can help to understand the internal strengths (S) and weaknesses (W) and the external opportunities (O) and threats (T) that the enterprise is facing. By synthesizing and generalizing all aspects of the internal and external contents, the analyzed factors are matched with each other, and a series of corresponding conclusions that, with a certain decision-making nature, can be drawn from them [36]. In a sense, SWOT analysis belongs to the internal analysis method of the enterprise, which can conduct a comprehensive, systematic, and accurate study of the situation of a specific enterprise, so as to formulate corresponding development strategies, plans, and countermeasures. A typical SWOT analysis matrix is shown in Figure 1.
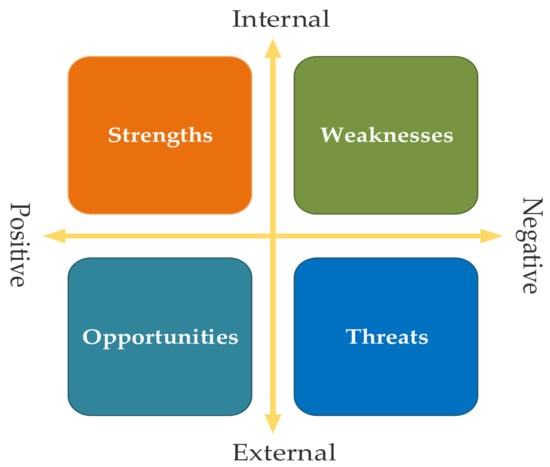
Figure 1.
Typical SWOT analysis matrix.
3.2. Application of SWOT Analysis
The SWOT analysis is an effective situational analysis tool that helps an enterprise to conduct strategy analysis, strategy formulation, and strategy selection. By analyzing the internal strengths and weaknesses as well as the external opportunities and threats, it can assist the enterprise to formulate its strategy and provide guidance for further actions.
In recent years, scholars have gradually introduced the SWOT analysis approach into the energy field, conducted a comprehensive assessment and analysis of the energy development status of a region or a country, and made certain contributions to academia and practice. J. Terrados, G. and Almonacid, L. Hontoria [37] took strategic planning processes and a SWOT analysis framework as the tools to observe how the Spanish south located Jaén providence can transform from the olive-based agricultural region to an RE (solar PV power and biomass) elaboration region. Ritu Paliwal [38] has taken SWOT as an evaluation model to evaluate the Indian environmental impact assessment (EIA) system to find out the constraints and opportunities and made some practical suggestions to improve the EIA efficiency. Zhanglin et al. [39] collected data from the literature review, government reports, and regulations and also conducted a semi-structured interview to reveal the drivers and barriers in the course of implementing the rural building energy efficiency scheme in China, through SWOT analysis. Customized recommendations to the government were put forward.
Especially in the past 4 or 5 years, scholars further applied SWOT analysis to the fields of wind power and solar PV power generation. Chen Weiming et al. [40] examined Japan, South Korea, and Taiwan’s SWOTs in respect of RE’s development, in order to secure their energy security and promote a low-carbon economy, an additional capacity for RE deployment that was highlighted. Igliński Bartlomiej et al. [41] overviewed the history, current status, and prospect of utilization of wind power in Poland, and concluded that, though there are weaknesses and threats for the development of wind power in Poland, there are chances for promising development by introducing a renewed Renewable Energy Act Bill and promote the domestic produced small wind turbines. AG Lupu et al. [42] presented a SWOT analysis for RE sources in Romania. The country is rich in biomass and hydro, but it has good potential for solar PV energy because of its geographic location, legislative framework, well-developed research in academia, and personnel training. The result of their research emphasized technology innovation and financial support so as to achieve the Europe 2020 Strategy (20-20-20) [43]. Scholar Xunpeng Shi [44] took SWOT analysis to assess the ASEAN energy mix and found out that the existing energy mix cannot meet the continuous economic and population growth in a green and sustainable way. A greener and more suitable energy mix could be achieved by cleaner use of fossil fuels, adopting RE and enhancing energy efficiency. However, regional cooperation and energy connectivity are needed. Scholars from China, Angola, Germany, and the UK used SWOT analysis to investigate the internal strengths and weaknesses, external opportunities and threats, for the development of solar PV power in Africa compared with China. More opportunities and great potential were predicted, but the adverse environmental impact on the primordial ecological system is the main concern [45].
3.3. SWOT Analysis Modelling Procedure
A framework of SWOT analysis was formulated on the basis of work in Reference [39]. The SWOT analysis is composed of four steps and the modelling procedure is shown in Figure 2.
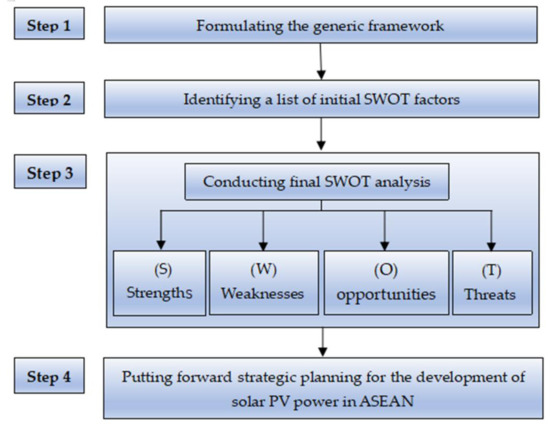
Figure 2.
Modelling procedure of the SWOT analysis.
In step 1, a generic framework was formulated to determine the purpose of this study. It is to oberve the S.W.O.T. for the development of solar PV power in ASEAN. In Step 2, a list of strengths, weaknesses, opportunities, and threats related with the development of solar PV power in ASEAN was derived from literature review, government reports, ASEAN official website, and record of interviews with project developers, law firms, and accounting firms from Vietnam, Singapore, Thailand, Cambodia, Indonesia, and the Philippines. The main questions for the interviews as shown in Table 1 and free discussion were encouraged. The interviews were carried out during August 2018 to June 2020. Each interview session lasted 50–60 min. Based on the information from literature review, government reports, ASEAN official website, and interviewee’s answers to the questions, the SWOT factors related to the development of solar PV power in ASEAN countries were initially indentified. In Step 3, four authors and another four experts held a conference call to evaluate the reliablity of the SWOT factors. Important factors such as impact of COVID-19 were added, while unsuitable factors such as logistic cost were removed. The final list of SWOT factors was obtained after the evaluation process, and the SWOT matrix was established. In step 4, strategies and suggestions to accelerate the development of solar PV power in ASEAN were put forward.

Table 1.
Main questions for interviews.
4. SWOT Analysis for the Development of Solar PV Power in ASEAN
The matrix of the SWOT analysis is established on the basis of information derived from literature review, government reports, ASEAN official website, and interviews. The established matrix of SWOT analysis for the development of solar PV power in ASEAN is shown in Table 2. In this section, these factors are proceeded with a detailed discussion.
Table 2.
SWOT analysis results for the development of solar PV power in ASEAN.
4.1. The Strengths Analysis
4.1.1. Abundant Solar Radiation Resource
Solar PV power generation is based on the rationale of the photovoltaic effect. The effect elaborates that sunlight can be converted into direct current (DC) electricity through silicon-based semiconductors, and the DC electricity can be converted into alternating one through inverters [46]. The amount of conversion capacity relies on the intensity of the solar radiation and the conversion efficiency of solar PV panels. ASEAN is located in Southeast Asia, bordering China in the north, and Australia in the south, at the “cross-road” of Asia and Oceania and between the Pacific and the Indian Oceans. The latitude and longitude coordinates range from 92°10′ to 141°05′ east longitude and 09°32′ to 11°15′ north latitude. The ten-member countries of ASEAN are all located on both sides of the equator. They have tropical and subtropical climates. Most of this area is hot and rainy with long, time-exposed sunshine hours throughout the year with high radiation intensity and abundant solar resource. The Global Solar Atlas (version 2.0) shows that the total annual solar radiation of the ASEAN countries ranges from 1460 kWh/m2 to 1892 kWh/m2 [47]. The average radiation intensity is greater than 1750 kWh/m2. Performance of the PV array may become better when coupling ArcGIS and TRNSYS [48]. It is suitable and favorable for the development of solar PV power generation. Figure 3 demonstrates the solar resource in ASEAN countries.
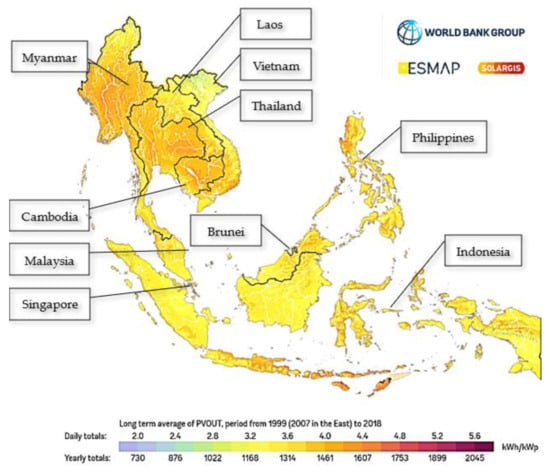
Figure 3.
Solar radiation resource in the Association of Southeast Asian Nations (ASEAN) countries. Source: Global Solar Atlas 2.0, Solar resource data: Solargis. © 2019 The World Bank.
4.1.2. Rich Untapped Land Resource
Owing to the lower density of solar PV power generation, even the conversion efficiency has been raised from 16% to 22.5%–23% in the year of 2006 to 2020 [49]. Furthermore, 1 Km2 land is estimated to install 43.65 MW solar PV power generation [50]. A utility-scale solar PV power station with a capacity of 500 MW may take up 11.5 Km2’s land. Therefore, sufficient land resource is the fundamental precondition for the development of solar PV power generation in any country or region. The ASEAN region has an overall area of 4.4950 million km2 and, with a population of 655.90 million only, it undoubtedly has a huge advantage when compared with those countries who are pioneers in the field of solar PV power development but with a limited land resource such as India and Japan. The concern is ASEAN countries have to save land resource even though they are rich in this respect. Large-scale deployment of BIPV is strongly recommended [51]. Table 3 shows the comparative advantage of ASEAN region compared with India and Japan in terms of land resource.
Table 3.
Land resource comparative advantage of the Association of Southeast Asian Nations (ASEAN) compared with Japan and India.
4.1.3. Flexible Application of Any Type of Solar PV System
There are various application types of solar PV power generation. Classified by the capacity, the solar PV power stations are identified as centralized solar power stations (CSPS) and distributed solar power stations (DSPS) [52]. Regarding whether it is connected to the grid or not, it is called on-grid solar power station or off-grid solar power station [53]. Solar PV power is integrated with diesel sometimes [54] or with other kinds of energy. It is called pure solar PV power station or hybrid solar PV power system [55]. In the meantime, solar PV power stations can also be integrated into agriculture to enhance the comprehensive benefits [56] or, when there is not sufficient land, even the solar PV stations can be constructed on the surface of the water and fish can be raised in the pond [57]. Since the application types of solar PV power generation are diverse, people can choose any type of solar PV power system according to their purpose of utilization, investment budget, land availability, and expected effects. For example, it is suitable to promote BIPV in high-density cities [58]. Large-scale grid-connected CSPS is the wonderful choice in LuNinh Providence in Vietnam. Agriculture-integrated solar PV power station around Bangkok can improve the awkward status of the farmers when facing loss in the pure agriculture industry. Small-sized grid-connected solar PV plants (<50 MW) in Vientiane and large ones (above 100 MW) in Attapu are possible in Lao’s. In Java island, a solar and diesel hybrid system can secure the electricity supply and the solar home system (SHS) will ameliorate the living standard of the non-electricity rural citizen in Northern Myanmar [59].
4.2. The Weaknesses Analysis
4.2.1. Not Mastering Key Technology and Equipment
The ASEAN countries are relatively lagged behind in terms of RE development [60], which are also lagging in technology, equipment manufacturing, and construction capability of power generation infrastructure, and have not fostered a complete solar PV industry chain [61]. Thereby, as a result in weakness of independent self-supply, innovation capabilities of key technologies and equipment, some of them are not matured in personnel training and management. Key components of a solar PV power station such as solar PV panels, solar inverters, and transformers all depend on import from China and Europe. Most of the EPC (Engineering, Procurement, Construction) work and operation & maintenance (O&M) of solar PV power stations are almost conducted by Chinese and European companies. Although Chinese companies have established some solar production plants in Vietnam, Thailand, and Malaysia, they cannot be converted into the advantages of ASEAN countries in a short time. The shortcomings of ASEAN countries in terms of the solar PV industry supply chain, technology, and management cannot turn the advantage of the solar resource into advantage in the deployment of solar PV power generation. The above-mentioned deficiencies do not increase the cost of developing solar PV power generation in ASEAN countries merely, but are also inconducive to the sustainable development of solar PV power generation. Another issue that needs to draw people’s attention is the recycling process of solar PV power stations. It refers to recycling of materials and disposal of wastes (cements, etc.) at the end of commercial operation. France tried to recycle solar PV panels in 2019 under the PV Cycle Program and very few studies focus on recycling technology in China since most of the solar PV power stations are less than ten years after the commercial operation date (COD).
4.2.2. Insufficient Capitals to Invest in Solar PV Power
Solar PV power generation is a dual capital and technology-intensive industry. It requires a large initial investment amount and the fund needs to be raised in a short time. Project finance is a clear shortcut [62]. Although the investment quota of solar PV power generation has been dramatically declined in the past decade, the per W investment is reaching approximately U.S. dollars 65–70 cents or even lower [63]. U.S. dollars 70 million are required for a 100 MW solar PV power station and the budget of a 5 kW SHS is roughly U.S. dollars 5000. According to Bloomberg Finance L.P. (BNEF), in 2020, the global investment in solar PV power is about U.S. dollars 148.6 billion, among which China, the US, and Japan accounted for approximately 36.15, 19.2, and 6.8 billion U.S. dollars, respectively. In stark contrast, the ASEAN countries’ investment in solar PV power is only U.S. dollars 7.76 billion, which takes up only 5.32% of the total global investment in the solar section [64]. Although some international organizations have offered financial support for the development of ASEAN’s solar PV power, sustainable development relies on the economic development of ASEAN countries. Although the ASEAN economy has experienced rapid development in recent years, most of the ASEAN member countries are developing countries, except for Singapore, Brunei, Malaysia, and Thailand. The per capita GDP of the rest ASEAN member countries is less than U.S. dollars 5000. Cambodia, Vietnam, Laos, Myanmar and other countries are still struggling in low levels of economic development with lower fiscal revenue. What’s more, the local banks also have limited financing capability. The current economic status will hinder further development of solar PV power generation. The International Energy Association (IEA) estimated that ASEAN’s expected investment in energy industry is U.S.D. $2.36 trillion from 2016 to 2040. Solving such a huge funding gap seems to be a key barrier in the development of solar PV power in ASEAN countries.
4.2.3. Dis-Match Demand and Existing Stereotypes and Misperceptions
Advocacy of the government and the participation of the public are indispensable to the development of RE. At present, most ASEAN member countries have not formed an atmosphere for the development of RE and the knowledge for solar PV are lacking among the publics, business communities, and bankers [65]. People’s concern and enthusiasm for green and sustainable development are related to the stage and level of local economic development [66]. Most ASEAN countries are relatively backward in development levels. What the people most concern themselves with are pragmatic things closely related to their living standards, such as food supply, health and medical care, and education for the next generations. Most of them have not reached the view of pursuing green and sustainable development. When talking about solar PV power, it is also related to the basic requirements of daily life [67]. From the government’s point of view, the primary priority is to improve peoples’ livelihood. Urgencies include boosting economy, creating job opportunities, bettering medical service, and educational conditions. What’s more, long-standing prejudices and misperceptions about RE may also be the barrier that impeded their enthusiasm and engagement for solar PV power. A survey conducted by Chinese scholars in Tianjin city China revealed that, although people realized solar PV power is green and sustainable, a certain ratio of the sampled population engaged in the investigation held stereotypes and misperceptions on solar PV power. They mistakenly believed solar PV power is at a higher cost level than coal. The technology of solar PV power is immature and the electricity supplied by solar PV power stations is unstable [68].
4.2.4. Vulnerability of the Grid Connection
Solar PV power generation has the same characteristics as wind power generation, such as intermittent, random, and volatile characteristics. Its instability will cause fluctuations in grid voltage. Current and frequency, once connected to the grid, will consequently affect the power quality and safety of the grid [69]. In order to eliminate the adverse effects, grid companies have to add an additional spinning reserve capacity, which will lead to a cost rise and indirectly affects the development of the RE source. At this stage, the overall structure of the ASEAN’s power grid is relatively fragile. The high-voltage transmission lines are fewer. Even the ASEAN Power Grid (APG) is established and, with a transmission capacity of 7645 MW (Laos-Thailand-Malaysia-Singapore), it is not sufficient to facilitate the electricity flow among the ASEAN member states [70]. In addition, the scale of the pumped storage power station and hydropower stations with strong regulating capability in ASEAN countries are small. Thus, the peak regulating capabilities of the power grids is limited. To a certain extent, the development of RE (including solar PV power) is restricted. On the other hand, most of the households without access to electricity are located on isolated islands and remote rural areas [71]. For example, the population without access to electricity in Indonesia live on the isolated island of Maluku and Dongnusantungara, while the population without access to electricity in Laos live in the mountainous area on the border with Thailand. The cost of building a transmission line to extend electricity to areas without access to electricity is very expensive. Without subsidies, most power generation nor grid companies have no motivation to make the investment, even stated-owned giant-companies, like Perusahaan Listrik Negara (PLN) in Indonesia. Consequently, the large-scale grid-connected solar PV power generation that should enjoy a scale economic effect is restricted from further promotion. The development and application of off-grid solar PV power generation systems have to become an alternative option.
4.3. The Opportunities Analysis
4.3.1. Fast-Growing Demand for Electricity
By the end of 2020, the per capita electricity consumption of ASEAN member countries was 2511 kWh, which is at a far lower level when compared with the top ten of European Union (6569 kWh), Japan (7519 kWh), and China (5365 kWh). Taking current economic development status into consideration, consumption for electricity will increase at a growth rate of 4.6% to meet the annual economic growth at an average rate of 5%–5.5%. Demand for electricity in ASEAN countries is expected to reach 103.9 billion kWh in 2020 [3]. What’s more, it is estimated that around 55 million people in ASEAN countries still suffer without access to electricity [71]. In Cambodia, only 58% of the households have access to electricity. In Myanmar’s 10.877 billion households, only 4.709 million (equals to 43%) have access to electricity, while 11.68% of Philippines’s rural areas are without access to electricity, etc. Demand for electricity from households in these areas will undoubtedly continue to grow at a higher rate. Countermeasures to fill the gap between the electricity supply and demand include at least three routines: improvement of energy efficiency (more efficient industry, greener transport, higher electrification rate), new technology to upgrade existing coal-fired power plants, or new ones to be built with new technology (supercritical and ultra-supercritical coal-fired power plants have an efficiency up to 42%–45%, while subcritical stations’ efficiency is 38%) [3] adoption of RE resources such as wind power, hydropower, and solar PV power. The government of ASEAN countries have formulated relevant policies and tried all means to enhance the electricity supply capability. Due to the rapid decrease in the cost of solar PV power in the past ten years, it has a short lead time and flexibility in terms of utilization. The above features make solar PV power generation become the preferred alternative solution to meet the increasing demand for electricity.
4.3.2. Cost Reduction Makes Solar PV Power Affordable
The development of solar PV power generation is affected not only by the maturity of the technology but also affected by the economic benefits. Historically, coal-fired power generation has dominated the power mix in ASEAN countries because the LCOE is relatively lower. In 2015, the LCOE of the coal-fired electrify was U.S. dollars 50–60/MWh. Considering the return on investment (ROI), ASEAN countries may take fossil fuel energy as the primary choice to meet the increasing energy demand. However, from 2010 to 2019, the LCOE of RE energy has dropped dramatically. The cost of wind power electricity and solar PV power electricity has fallen by 39% and 82%, driven by the improving technologies, economies of scale, and competitive supply chains. The LCOE of solar PV power has reached U.S.D. $0.068/kWh [63]. In many countries, newly installed solar PV power has already reached the grid-parity level, or even lower than fossil fuel energy [72]. Hence, it has obtained the capability to compete with coal-fired electricity. Inferred from the development trend, the LCOE of the coal-fired electricity will not be further optimized by 2035. Conversely, the LCOE of solar PV power generation will be further reduced with the advancement of technology, and the competitiveness will also be significantly enhanced once the comprehensive cost of carbon emission and governance are taken into account. The comparative advantage of solar PV power generation will undoubtedly be more prominent. The price trends of solar PV panels and solar systems are shown in Figure 4.
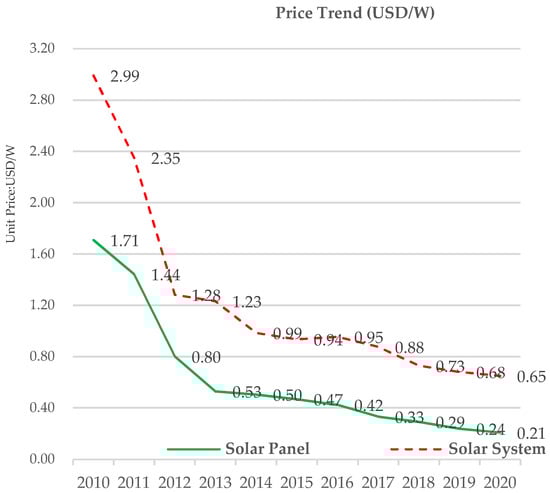
Figure 4.
Cost reduction trend of solar panels and solar project. Source: the author.
4.3.3. Aspirational Target for RE in the Energy Mix
Energy supply security, environmental pollution, and climate change have aroused the public’s awareness of a low-carbon development society and the importance of RE. The 2002 Johannesburg summit in South Africa has highlighted sustainable development and energy security. The Tokyo Protocol taken and effected in 1997 has assigned distinct responsibilities according to the different stages of countries’ development to prevent humankind harmed by drastic climate change. The Paris Agreement under United Nations Framework Convention on Climate Change (UNFCCC) has set specific targets for controlling climate change and carbon dioxide emissions in the 21st century and call on alliance members to make national determined contributions (NDCs) based on their capabilities. All ASEAN countries have submitted their NDCs and formulated their own carbon dioxide emission reduction targets. The development of RE is an inevitable choice for the ASEAN countries to fulfill their NDCs. The ASEAN Cooperation Plan (APAEC) Phase II:2016–2025 has set a target to increase the component of RE to 23% in the ASEAN energy mix by 2025 [5], which is a much more ambitious goal compared with NDCs (17.7%). However, at the end of 2018, the RE takes up only 13.9% in the TPES [5]. AEO6 projected that share of RE will be 14% by 2025 at the Business as Usual Scenario (BAU), 18% under the ASEAN Target Scenario (ATS), and 23% under the ASEAN Progressive Scenario (APS), to realize the APS. The solar PV power’s installed capacity must increase to 40% of the total installed capacity [3], or it is extremely hard or unreasonable for ASEAN countries to meet their NDCs or APS [4]. Therefore, there is abundant space for the deployment of solar PV power generation. Figure 5 dominates different situations under BAU, ATS, and APS.
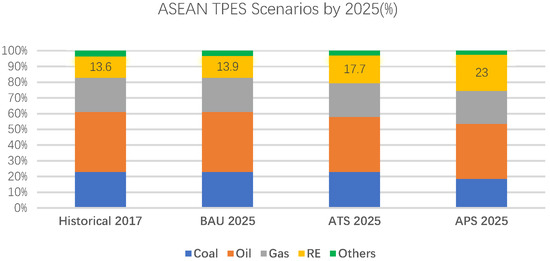
Figure 5.
Energy mix under three scenarios of ASEAN. Source: The 6th ASEAN Energy Outlook 2017–2040.
4.3.4. Prospect of More Mature Inter-Connection with Neighboring Nations
Due to the inherent fragility of the ASEAN grid transmission lines, the electricity transmission capability is relatively weak, which hinders the development of solar PV power generation result from the solar PV power’s intermittent, random, and volatile characteristics. However, the special geographical lactation of ASEAN countries facilitates the possibility of the interconnection of ASEAN grid transmission lines with its internal member. This will help to enhance the feasibility of the grid for the integration of RE [73]. The APG project has already connected Laos-Thailand-Malaysia-Singapore with a transmission capacity of 7645 MW and a cumulative 30.2 GWh of electricity was traded. The second phase is under construction [5]. The feasibility of interconnection with other neighboring countries are under studies. For instance, the grid transmission lines in the Greater Mekong Region have already been connected with China’s Yunnan Providence under China’s Belt and Road Initiative [24]. There are also potentials and possibilities to establish interconnections with Australia [74] and other Pacific Rim region across the sea [75]. If the interconnections are duly established with its neighboring countries and regions, the economics and flexibility of the ASEAN power grid system could be greatly improved, and new windows for development of solar PV power can be opened up.
4.4. The Threats Analysis
4.4.1. Fossil Fuel Dominated Energy Mix
For a long time, conventional fossil fuel energy has dominated the leading position in the energy mix of ASEAN. The laws and institutional system promulgated by the governments tend to support the utilization of fossil fuels energy and protect the rights and interests of fossil fuel energy stakeholders. The penetration and utilization of RE are inadequate, which discourage business leaders and investors’ enthusiasm in exploiting the alternative energy source. From 2008–2018, fossil fuels accounted for 85% of the growth in TPES and the share of RE seemed to stagnate [76]. At the same time, the urgency faced by most of the governments of ASEAN is to develop the economy to improve people’s livelihood. Policymakers choose to pay much attention to short-term economic benefits instead of focus on long-term sustainable development. The consequence is the dominated position of fossil fuels energy, which had been established and even had to be transformed. At end of 2020, RE energy accounts for 29% of the global energy mix [77]. Simultaneously, in ASEAN, fossil fuels accounted for 82.8% of the energy mix, and the RE’s ratio is only 13.9%. The development of solar PV power is bound to conflict with the interests of the fossil fuel-dominated energy mix. Figure 6 shows the updated energy mix of ASEAN by the end of 2018.
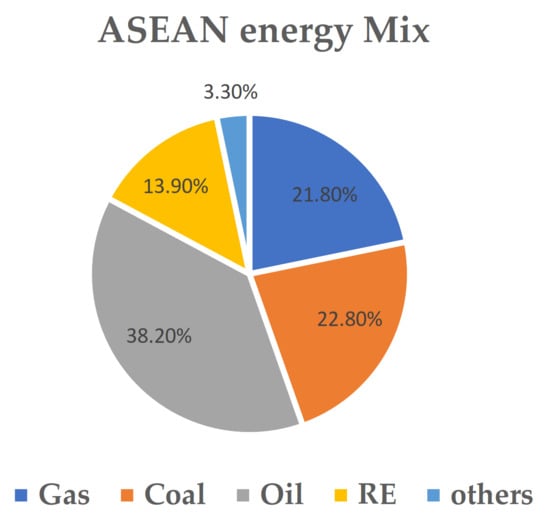
Figure 6.
Energy mix of ASEAN by the end of 2018. Source: The 6th ASEAN Energy Outlook 2017–2040.
4.4.2. Discontinuity and Non-Systematic Incentive Policies
According to the findings obtained from previous literature, those countries who are in the leading position in the field of solar PV power development have implemented a series of continuous and incentive policies, including FIT [10], tax preference, R&D subsidies [78], and favorable financial interest rates [79]. All supportive policies are adjusted dynamically according to the changes based on internal and external conditions, such as economic development status, technology advancement levels, and cost reduction trends. Although some of the ASEAN countries have also implemented various incentive programs, barriers related to policies are also found in ASEAN state members, including slow implantation of supportive policies, lack of policies in some member states, an existing complicated permitting process, and non-systematically policies [30]. Discontinuity of the policies bring uncertainty to solar PV participants. Thailand is an example in this sector. Its AEDP 2030 has set an ambitious target for RE, but the development progress paused during 2017–2020 because the newly on-board government did not release their renewed policy. Another example is Indonesia, which would like to vigorously promote solar PV power generation domestically, but local state-owned companies may oppose and some of the government tenders had to be rescinded [80]. To protect the local companies’ interest, for this purpose, they put forward the requirement of at least 60% of local product content. Even if the domestic solar PV supply chain is incomplete, blocking Chinese solar PV panels enjoy a reputation for advanced technology and competitive price outside the door.
4.4.3. Fluctuating Price of Solar PV Panels
The initial investment of a solar PV power station includes development cost (DC), engineering cost (EC), equipment cost (EQC), construction cost (CC), and installation cost (IC). Among all factors, solar PV panels play a big portion, accounting for approximately 30%–35% of the overall investment. Therefore, the price fluctuation of solar PV panels can greatly affect the internal return rate (IRR) of a solar PV power station. The rapid decline in the cost of solar PV panels offers positive opportunities for the accelerated development of solar PV power generation. However, the price of solar PV panels has been on the rise since the second half of 2020. The unit price for monocrystalline panels with a peak power output of 340 W was U.S.D. $0.2/W, but the prices surging in glass, copper, aluminum, and other bulk products have pushed the solar panel’s price to U.S.D. $0.22/W in quarter 3 and 4 of 2020. A 10% raise in solar PV panel price may affect 3%–3.5% of the total investment of a solar PV power station. Until now, this trend has not been conversed. If this trend will not come back to the routine, the development progress of solar PV power may slow down somehow. Figure 7 shows the cost structure of a 100 MW solar PV power station.
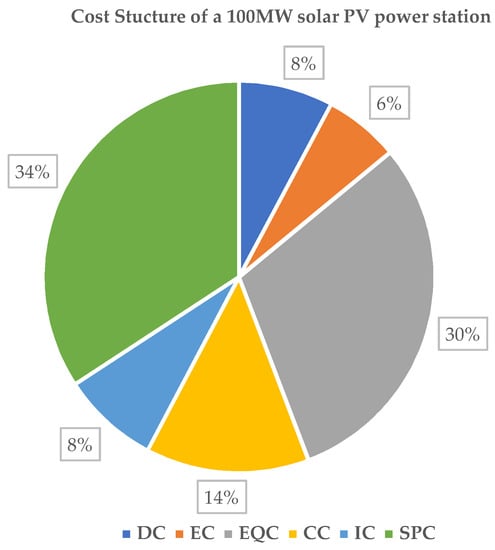
Figure 7.
Cost structure of a 100 MW solar PV power station.
4.4.4. Underlying Impact of COVID-19
The occurrence of major accidents always has a huge impact on the socio-economy and public’s lives. The Spanish Flu in 1918 caused thousands of deaths. The Second World War led to a global economic depression in the 1930s. The emergence of fast-spreading Coronavirus Disease (COVID-19) in the second half of 2019 disrupted the world’s order and slowed down the world’s economy [81]. By 24 March, 2021, more than 123 million people worldwide had been infected, among which 2.7 million were deprived of their lives [82]. It triggered a global economic crisis and generated domino effects on any sector. The energy research company Rystad Energy warned that COVID-19 slowed down the pace of global economic development. It has severely hindered the cross-border movement of people and commodities. It could lead to a complete halt in the growth rate of RE installations. A few solar PV power stations around the world scheduled to be finalized within 2020 had to be postponed. Until now, although the COVID-19 epidemic has been controlled to a certain extent, the impact of the COVID-19 epidemic has not been eliminated thoroughly, and it may rebound at any time. If such a situation continues, ASEAN countries’ motivation in participating in the investment in solar PV power will also be negatively affected in the coming years.
5. Suggestions for the Development of Solar PV Power in ASEAN
Through SWOT analysis, great potential for deployment of solar PV power generation in ASEAN is realized. Suggestions for ASEAN to speed up the development of solar PV power are listed hereafter in Section 5.
5.1. Arouse the Public’s Awareness of Sustainable Development
Participation of the public is the cornerstone for the development of solar PV power. ASEAN countries should elevate the concept of sustainable development to national strategies, formulate and review specific annual development plan on the basis of the overall development target of REs, publicize the benefits of solar PV power to the public through various channels (social media, forums, exhibitions, open day posters, schools, etc.), to change public’s misperception on solar PV power and eliminate the dilemma that the investors are discouraging from investing in solar PV power generation. Demonstration projects for the public should be set up by the governments and mandatory green energy quotas to enterprise are also advised.
5.2. Strong and Systematic Incentive Policies Have to Be Implemented
To achieve sustainable economic and social development, transforming the current fossil-fuel-dominated energy mix, promoting the development of solar PV power vigorously, adopting and implementing coherent, reliable, predictable, and systematical incentive policies are necessary. For utility-scale solar PV power plants, the above-market level FIT is recommended to attract domestic and worldwide investors, while the auction mechanism is suggested to be introduced. For commercial and industrial applications, the net-metering and tax-refund scheme are advised. For rural areas, the government’s supports in the field of funds and technology are indispensable. All the above three aspects should be escorted with a tax preference, favorable finacing rates, an easy grid access service, a convenient permitting procedure, and reliable PPAs. The specific situations in each ASEAN country are complex and diverse, since there is no one-size-fits-all method. When stimulative policies are implemented, they must comply with distinct scenarios. Measurements also should be taken to ensure the fiscal burdens of ASEAN countries should not be increased.
5.3. Foster Solar PV Technology to Ensure Sustainable Development
The core technology of solar PV power and key equipments cannot be supplied locally, which increase the LCOE of solar PV power generation, and also harms the development prospect of solar PV power generation in ASEAN. Without mature recycling technology, it will damage the environment and lead to waste of resources. When formulating incentive policies to promote the development of solar PV power generation, ASEAN countries also need to try every means to cultivate the solar PV supply chain and draw up schemes for talent training. It is recommended that the ASEAN countries should give priority to grasp the technology and skill associated with EPC and O&M of solar PV power generation, then take the advantage of low-cost land and sufficient labor supply to vigorously develop the solar PV industry chain, and start the R&D program concerning recycling technology of solar PV power stations at the very beginning.
5.4. Seek Opportunities via International Cooperation
A solar PV industry is an international division of labor and collabration. During the development process, each country has formed its advantages and accumulated expertise experience. Therefore, ASEAN countries can also discover opportunities and inspirations from international cooperation. The suggested cooperation are as follows. To begin with, ASEAN countries can get financial support from developed countries, the World Bank, Asian Infrastructure Development Bank, etc. Secondly, solar PV panels and other solar products can be imported from China. EPC and O&M technology can be introduced from China and Europe. Current production facilities established in Vietnam, Thailand, and Malaysia by Chinese companies can be treated as the first pilot factories to cultivate solar PV supply chain. Last but not least, this improve the interconnection of power grids within ASEAN countries and its neighboring nations in due course, conduct the possibility analysis, and techno-economics feasibility study of establishing power grid interconnection with China, India, and Australia. The interconnection will surely enhance the regulation capacity of RE generation in ASEAN countries and provide a strong guarantee for the sustainable development of solar PV power generation.
6. Conclusions and Discussions
ASEAN’s rapid economic and social development has brought continuous increasing energy demand. Thus, it has caused a gap between the energy supply and demand. However, ASEAN’s energy mix is dominated by fossil fuels energy, which causes environmental pollution and climate change. Therefore, it cannot support a sustainable development. In this paper, a specific SWOT analysis is conducted focusing on the development of solar PV power in ASEAN. Great potential for the deployment of solar PV power is realized, and suggestions to accelerate the development of solar PV power are put forward. As long as appropriate policies are implemented and proper actions are taken, ASEAN countries can make full use of the strength factors and take advantage of the opportunity factors. Meanwhile, they can overcome the weakness factors and dissolve the threat factors. Hence, we can assist ASEAN to achieve a sustainable development process.
The SWOT analysis framework is adopted to identify the internal and external factors associated with the development of solar PV power in ASEAN, and precise suggestions are made out. Still, there are limitations in this paper that have to be further studied. Firstly, this paper focuses on solar PV power only. A comparison between solar PV power and other RE energies (wind power, hydropower, tidal energy, etc.) could be conducted by adopting the Fuzzy Analytic Hierarchy Process (FAHP). Secondly, since SWOT analysis is a qualitative method, quantitative tools are needed to examine the expected economic benefits of solar PV power stations such as the NPV model or Sensitivity Analysis on Profits (SAP). The third is life-time management, especially the recycling of materials and disposal of wastes at the end of the commercial operation, which requires close attention from experts and stakeholders.
Author Contributions
Conceptualization, H.W. and X.Y. Methodology, H.W. and X.Y. Validation, X.Y. Formal analysis, H.W. Investigation, H.W., X.Y., Q.L., and X.X. Resources, H.W., X.Y., and Q.L. Data curation, H.W. and X.Y. Writing—original draft preparation, H.W. Writing—review and editing, H.W., X.Y., Q.L., and X.X. Visualization, X.Y. Supervision, H.W. and X.Y. Project administration, X.Y. Funding acquisition, X.Y. All authors have read and agreed to the published version of the manuscript.
Funding
This research was funded by the Ministry of Education of People’s Republic of China, under the project of 2018 Key Projects of Philosophy and Social Sciences Research, grant number 18JZD032.
Data Availability Statement
The data presented in this study are openly available in [ASEAN Statistics and ASEAN Center for Energy], reference number [1,3].
Acknowledgments
The authors sincerely thank the editor and anonymous reviewers for their insightful comments and suggestions. Besides, the authors would like to thank Michael Daly, who is analyst of solar PV industry from Bloomberg L.P. He provided financial analysis for the paper and Lanjun Zhang, a senior engineer of solar PV system from JA solar Co., ltd, who offered technical guidance for the solar PV power field.
Conflicts of Interest
The authors declare no conflict of interest. The funders had no role in the design of the study, in the collection, analyses, or interpretation of data, in the writing of the manuscript, or in the decision to publish the results.
References
- ASEAN Secretariat. Selected Basic Indicators. Available online: Data.aseanstats.org (accessed on 4 February 2021).
- OECD. Economic Outlook for Southeast Asia, China and India 2020: Rethinking Education for the Digital Era; OECD Publishing: Paris, France, 2020. [Google Scholar]
- ACE. The 6th ASEAN Energy Outlook (AEO6); ASEAN Centre for Energy (ACE): Jakarta, Indonesia, 2020. [Google Scholar]
- Overland, I.; Sagbakken, H.F.; Chan, H.; Merdekawati, M.; Suryadi, B.; Utama, N.A.; Vakulchuk, R. The ASEAN climate and energy paradox. Energy Clim. Chang. 2021, 2, 100019. [Google Scholar] [CrossRef]
- ACE. Asean Plan of Action for Energy Cooperation (APAEC) 2016–2025 Phase ii: 2021–2025; ASEAN Centre for Energy (ACE): Jakarta, Indonesia, 2020. [Google Scholar]
- Millstein, D.; Wiser, R.; Bolinger, M.; Barbose, G. The climate and air-quality benefits of wind and solar power in the United States. Nat. Energy 2017, 2, 2. [Google Scholar] [CrossRef]
- Bimenyimana, S.; Asemota, G.N.O.; de Dieu Niyonteze, J.; Nsengimana, C.; Ihirwe, P.J.; Li, L.; Álvarez-Gallegos, A. Photovoltaic solar technologies: Solution to affordable, sustainable, and reliable energy access for all in Rwanda. Int. J. Photoenergy 2019, 2019. [Google Scholar] [CrossRef]
- IREAN. Renewable Energy Statistics 2020; International Renewable Energy Agency: Abu Dhabi, United Arab Emirates, 2020. [Google Scholar]
- Sagulpongmalee, K.; Therdyothin, A.; Nathakaranakule, A. Analysis of feed-in tariff models for photovoltaic systems in Thailand: An evidence-based approach. J. Renew. Sustain. Energy 2019, 11. [Google Scholar] [CrossRef]
- Kumar Sahu, B. A study on global solar PV energy developments and policies with special focus on the top ten solar PV power producing countries. Renew. Sustain. Energy Rev. 2015, 43, 621–634. [Google Scholar] [CrossRef]
- Wand, R.; Leuthold, F. Feed-in tariffs for photovoltaics: Learning by doing in Germany? Appl. Energy 2011, 88, 4387–4399. [Google Scholar] [CrossRef]
- Zhang, S.; He, Y. Analysis on the development and policy of solar PV power in China. Renew. Sust. Energy Rev. 2013, 21, 393–401. [Google Scholar] [CrossRef]
- Ye, L.; Rodrigues, J.F.D.; Lin, H.X. Analysis of feed-in tariff policies for solar photovoltaic in China 2011–2016. Appl. Energy 2017, 203, 496–505. [Google Scholar] [CrossRef]
- Zhang, L.; Qin, Q.; Wei, Y. China’s distributed energy policies: Evolution, instruments and recommendation. Energy Policy 2019, 125, 55–64. [Google Scholar] [CrossRef]
- Niu, D.; Wang, K.; Wu, J.; Sun, L.; Liang, Y.; Xu, X.; Yang, X. Can China achieve its 2030 carbon emissions commitment? Scenario analysis based on an improved general regression neural network. J. Clean. Prod. 2020, 243, 118558. [Google Scholar] [CrossRef]
- Heng, Y.; Lu, C.; Yu, L.; Gao, Z. The heterogeneous preferences for solar energy policies among US households. Energy Policy 2020, 137, 111187. [Google Scholar] [CrossRef]
- Behuria, P. The politics of late late development in renewable energy sectors: Dependency and contradictory tensions in India’s National Solar Mission. World Dev. 2020, 126, 104726. [Google Scholar] [CrossRef]
- Li, A.; Xu, Y.; Shiroyama, H. Solar lobby and energy transition in Japan. Energy Policy 2019, 134, 110950. [Google Scholar] [CrossRef]
- BP. Energy Outlook 2020 Edition; BP.p.l.c: London, UK, 2020. [Google Scholar]
- Guild, J. Feed-in-tariffs and the politics of renewable energy in Indonesia and the Philippines. Asia Pac. Policy Stud. 2019, 6, 417–431. [Google Scholar] [CrossRef]
- Do, T.N.; Burke, P.J.; Baldwin, K.G.H.; Nguyen, C.T. Underlying drivers and barriers for solar photovoltaics diffusion: The case of Vietnam. Energy Policy 2020, 144, 111561. [Google Scholar] [CrossRef]
- Nguyen, P.A.; Abbott, M.; Nguyen, T.L.T. The development and cost of renewable energy resources in Vietnam. Util. Policy 2019, 57, 59–66. [Google Scholar] [CrossRef]
- Ismail, A.M.; Ramirez-Iniguez, R.; Asif, M.; Munir, A.B.; Muhammad-Sukki, F. Progress of solar photovoltaic in ASEAN countries: A review. Renew. Sustain. Energy Rev. 2015, 48, 399–412. [Google Scholar] [CrossRef]
- ADB. Renewable Energy Developments and Potential in the Greater Mekong Subregion; Asian Development Bank (ADB): Mandaluyong, Philippines, 2015. [Google Scholar]
- USAID Clean Power Asia. Designing Renewable Energy Incentives and Auctions: Lessons for ASEAN; U.S. Agency for International Development Regional Development Mission for Asia: Washington, DC, USA, 2017. [Google Scholar]
- Siala, K.; Stich, J. Estimation of the PV potential in ASEAN with a high spatial and temporal resolution. Renew. Energy 2016, 88, 445–456. [Google Scholar] [CrossRef]
- Shukla, A.K.; Sudhakar, K.; Baredar, P.; Mamat, R. BIPV in Southeast Asian countries—Opportunities and challenges. Renew. Energy Focus 2017, 21, 25–32. [Google Scholar] [CrossRef]
- Lee, N.; de Oliveira, C.R.; Roberts, B.; Katz, J.; Brown, T.; Flores-Espino, F. Exploring Renewable Energy Opportunities in Select Southeast Asian Countries: A Geospatial Analysis of the Levelized Cost of Energy of Utility-Scale Wind and Solar Photovoltaics; National Renewable Energy Laboratory (NREL): Golden, CO, USA, 2019. [Google Scholar]
- Zissler, R. Renewable Energy to Replace Coal Power in Southeast Asia; Renewable Energy Institute: Tokyo, Japan, 2019. [Google Scholar]
- Erdiwansyah; Mamat, R.; Sani, M.S.M.; Sudhakar, K. Renewable energy in Southeast Asia: Policies and recommendations. Sci. Total Environ. 2019, 670, 1095–1102. [Google Scholar] [CrossRef]
- Vidinopoulos, A.; Whale, J.; Fuentes Hutfilter, U. Assessing the technical potential of ASEAN countries to achieve 100% renewable energy supply. Sustain. Energy Technol. Assess. 2020, 42, 100878. [Google Scholar]
- Maghami, M.; Hizam, H.; Gomes, C.; Hajighorbani, S.; Rezaei, N. Evaluation of the 2013 Southeast Asian Haze on Solar Generation Performance. PLoS ONE 2015, 10, e135118. [Google Scholar] [CrossRef]
- Nobre, A.M.; Karthik, S.; Liu, H.; Yang, D.; Martins, F.R.; Pereira, E.B.; Rüther, R.; Reindl, T.; Peters, I.M. On the impact of haze on the yield of photovoltaic systems in Singapore. Renew. Energy 2016, 89, 389–400. [Google Scholar] [CrossRef]
- Bukoski, J.; Gheewala, S.H.; Mui, A.; Smead, M.; Chirarattananon, S. The life cycle assessment of a solar-assisted absorption chilling system in Bangkok, Thailand. Energy Build. 2014, 72, 150–156. [Google Scholar] [CrossRef]
- Del Barrio Alvarez, D.; Sugiyama, M. A SWOT analysis of Utility-Scale solar in myanmar. Energies 2020, 13, 884. [Google Scholar] [CrossRef]
- Weihrich, H. The TOWS matrix—a tool for situational analysis. Long Range Plan. 1982, 15, 54–66. [Google Scholar] [CrossRef]
- Terrados, J.; Almonacid, G.; Hontoria, L. Regional energy planning through SWOT analysis and strategic planning tools. Renew. Sustain. Energy Rev. 2005, 11, 1275–1287. [Google Scholar] [CrossRef]
- Paliwal, R. EIA practice in India and its evaluation using SWOT analysis. Environ. Impact Assess. Rev. 2006, 26, 492–510. [Google Scholar] [CrossRef]
- Zhang, L.; Guo, S.; Wu, Z.; Alsaedi, A.; Hayat, T. SWOT analysis for the promotion of energy efficiency in rural buildings: A case study of china. Energies 2018, 11, 851. [Google Scholar] [CrossRef]
- Chen, W.; Kim, H.; Yamaguchi, H. Renewable energy in eastern Asia: Renewable energy policy review and comparative SWOT analysis for promoting renewable energy in Japan, South Korea, and Taiwan. Energy Policy 2014, 74, 319–329. [Google Scholar] [CrossRef]
- Igliński, B.; Iglińska, A.; Koziński, G.; Skrzatek, M.; Buczkowski, R. Wind energy in Poland—History, current state, surveys, Renewable Energy Sources Act, SWOT analysis. Renew. Sustain. Energy Rev. 2016, 64, 19–33. [Google Scholar] [CrossRef]
- Lupu, A.G.; Dumencu, A.; Atanasiu, M.V.; Panaite, C.E.; Dumitrașcu, G.; Popescu, A. SWOT analysis of the renewable energy sources in Romania—case study: Solar energy. IOP Conf. Ser. Mater. Sci. Eng. 2016, 147, 12138. [Google Scholar] [CrossRef]
- Airá, E.; Kotulič, R.; Kravčáková Vozárová, I.; Daňová, M. Sustainable development in EU countries in the framework of the europe 2020 strategy. Processes 2021, 9, 443. [Google Scholar]
- Shi, X. The future of ASEAN energy mix: A SWOT analysis. Renew. Sustain. Energy Rev. 2016, 53, 672–680. [Google Scholar] [CrossRef]
- Lei, Y.; Lu, X.; Shi, M.; Wang, L.; Lv, H.; Chen, S.; Hu, C.; Yu, Q.; Da Silveira, S.D.H. SWOT analysis for the development of photovoltaic solar power in Africa in comparison with China. Environ. Impact Assess. Rev. 2019, 77, 122–127. [Google Scholar] [CrossRef]
- Nastasi, B.; di Matteo, U. Solar energy technologies in sustainable energy action plans of italian big cities. Energy Procedia 2016, 101, 1064–1071. [Google Scholar] [CrossRef]
- ESMAP. Global Photovoltaic Power Potential by Country; World Bank: Washington, DC, USA, 2020. [Google Scholar]
- Choi, Y.; Rayl, J.; Tammineedi, C.; Brownson, J.R.S. PV Analyst: Coupling ArcGIS with TRNSYS to assess distributed photovoltaic potential in urban areas. Sol. Energy 2011, 85, 2924–2939. [Google Scholar] [CrossRef]
- Lv, Y.; Zhuang, Y.F.; Wang, W.J.; Wei, W.W.; Sheng, J.; Zhang, S.; Shen, W.Z. Towards high-efficiency industrial p-type mono-like Si PERC solar cells. Sol. Energy Mater. Sol. Cell 2020, 204, 110202. [Google Scholar] [CrossRef]
- Ruiz, H.S.; Sunarso, A.; Ibrahim-Bathis, K.; Murti, S.A.; Budiarto, I. GIS-AHP Multi Criteria Decision Analysis for the optimal location of solar energy plants at Indonesia. Energy Rep. 2020, 6, 3249–3263. [Google Scholar] [CrossRef]
- Mancini, F.; Nastasi, B. Solar energy data analytics: PV deployment and land use. Energies 2020, 13, 417. [Google Scholar] [CrossRef]
- Boamah, F. Desirable or debatable? Putting Africa’s decentralised solar energy futures in context. Energy Res. Soc. Sci. 2020, 62, 101390. [Google Scholar] [CrossRef]
- Okedu, K.; Uhunmwangho, R.; Bassey, N. Comparative Study of on and off Grid Tied Integrated Diesel/Solar (PV) Battery Generation System. Int. J. Eng. Technol. 2015, 1, 19–25. [Google Scholar]
- Quansah, D.A.; Woangbah, S.K.; Anto, E.K.; Akowuah, E.K.; Adaramola, M.S. Techno-economics of solar pv−diesel hybrid power systems for off−grid outdoor base transceiver stations in ghana. Int. J. Energy Clean Environ. 2017, 18, 61–78. [Google Scholar] [CrossRef]
- Fahmi, M.I.; Rajkumar, R.; Arelhi, R.; Rajkumar, R.; Isa, D. Solar hybrid PV system for Off-Grid electrification in semenyih, malaysia. Appl. Mech. Mater. 2015, 3710, 195–198. [Google Scholar] [CrossRef]
- Chen, J.; Liu, Y.; Wang, L. Research on coupling coordination development for photovoltaic agriculture system in china. Sustainability 2019, 11, 1065. [Google Scholar] [CrossRef]
- Château, P.A.; Wunderlich, R.F.; Wang, T.W.; Lai, H.T.; Chen, C.C.; Chang, F.J. Mathematical modeling suggests high potential for the deployment of floating photovoltaic on fish ponds. Sci. Total Environ. 2019, 687, 654–666. [Google Scholar] [CrossRef]
- Happle, G.; Shi, Z.; Hsieh, S.; Ong, B.; Fonseca, J.A.; Schlueter, A. Identifying carbon emission reduction potentials of BIPV in high-density cities in Southeast Asia. J. Phys. Conf. Ser. 2019, 1343, 12077. [Google Scholar] [CrossRef]
- Principe, J.; Takeuchi, W. Supply and demand assessment of solar PV as Off-Grid option in asia pacific region with remotely sensed data. Remote Sens. 2019, 11, 2255. [Google Scholar] [CrossRef]
- Erdiwansyah; Mahidin; Mamat, R.; Sani, M.S.M.; Khoerunnisa, F.; Kadarohman, A. Target and demand for renewable energy across 10 ASEAN countries by 2040. Electr. J. 2019, 32, 106670. [Google Scholar]
- BNEF. 1Q 2020 Global PV Market Outlook: A Slow Start to 2020; Bloomberg Finance L.P.: New York, NY, USA, 2020. [Google Scholar]
- Steffen, B. The importance of project finance for renewable energy projects. Energy Econ. 2018, 69, 280–294. [Google Scholar] [CrossRef]
- IRENA. Renewable Power Generation Costs in 2019; International Renewable Energy Agency: Abu Dhabi, United Arab Emirates, 2020. [Google Scholar]
- BNEF. Energy Transition Investment Trends 2021; Bloomberg Finance L.P.: New York, NY, USA, 2020. [Google Scholar]
- Vaka, M.; Walvekar, R.; Rasheed, A.K.; Khalid, M. A review on Malaysia’s solar energy pathway towards carbon-neutral Malaysia beyond Covid’19 pandemic. J. Clean. Prod. 2020, 273, 122834. [Google Scholar] [CrossRef]
- Joshi, L.; Choudhary, D.; Kumar, P.; Venkateswaran, J.; Solanki, C.S. Does involvement of local community ensure sustained energy access? A critical review of a solar PV technology intervention in rural India. World Dev. 2019, 122, 272–281. [Google Scholar] [CrossRef]
- Dufo-López, R.; Zubi, G.; Fracastoro, G.V. Tecno-economic assessment of an off-grid PV-powered community kitchen for developing regions. Appl. Energy 2011, 91, 255–262. [Google Scholar] [CrossRef]
- Liu, Y.; Zhang, M. Unpacking stereotypes about sustainable energy: Knowledge, policy, and public misperceptions of solar energy and coal in China. Energy Res. Soc. Sci. 2021, 71, 101832. [Google Scholar] [CrossRef]
- Tavakoli, A.; Saha, S.; Arif, M.T.; Haque, M.E.; Mendis, N.; Oo, A.M.T. Impacts of grid integration of solar PV and electric vehicle on grid stability, power quality and energy economics: A review. IET Energy Syst. Integr. 2020, 2, 243–260. [Google Scholar] [CrossRef]
- Fabio, I. ASEAN-EU energy cooperation: Sharing best practice to implement renewable energy sources in regional energy grids. Glob. Energy Interconnect. 2019, 2, 393–401. [Google Scholar]
- CREEI. ACE Practical Experience and Prospects of Electricity Accessibility in ASEAN 2020; ASEAN Centre for Energy (ACE): Jakarta, Indonesia, 2020. [Google Scholar]
- Zhang, M.M.; Zhang, C.; Liu, L.Y.; Zhou, D.Q. Is it time to launch grid parity in the Chinese solar photovoltaic industry? Evidence from 335 cities. Energy Policy 2020, 147, 111733. [Google Scholar] [CrossRef]
- Huang, Y.W.; Kittner, N.; Kammen, D.M. ASEAN grid flexibility: Preparedness for grid integration of renewable energy. Energy Policy 2019, 128, 711–726. [Google Scholar] [CrossRef]
- Halawa, E.; James, G.; Shi, X.; Sari, N.; Nepal, R. The prospect for an australian–asian power grid: A critical appraisal. Energies 2018, 11, 200. [Google Scholar] [CrossRef]
- Gulagi, A.; Bogdanov, D.; Breyer, C. A cost optimized fully sustainable power system for southeast asia and the pacific rim. Energies 2017, 10, 583. [Google Scholar] [CrossRef]
- IEA. Southeast Asia Energy Outlook 2019; Internal Energy Agency: Paris, France, 2019. [Google Scholar]
- IEA. Global Energy Review 2020; International Energy Agency: Paris, France, 2020. [Google Scholar]
- Abdmouleh, Z.; Alammari, R.A.M.; Gastli, A. Review of policies encouraging renewable energy integration & best practices. Renew. Sustain. Energy Rev. 2015, 45, 249–262. [Google Scholar]
- White, W.; Lunnan, A.; Nybakk, E.; Kulisic, B. The role of governments in renewable energy: The importance of policy consistency. Biomass Bioenergy 2013, 57, 97–105. [Google Scholar] [CrossRef]
- Kennedy, S.F. Indonesia’s energy transition and its contradictions: Emerging geographies of energy and finance. Energy Res. Soc. Sci. 2018, 41, 230–237. [Google Scholar] [CrossRef]
- Anderson, R.M.; Heesterbeek, H.; Klinkenberg, D.; Hollingsworth, T.D. How will country-based mitigation measures influence the course of the COVID-19 epidemic? Lancet 2020, 395, 931–934. [Google Scholar] [CrossRef]
- WHO. Coronavirus Disease (COVID-19) Pandemic, Numbers at a Glance. Available online: https://www.who.int/emergencies/diseases/novel-coronavirus-2019 (accessed on 24 March 2021).
Publisher’s Note: MDPI stays neutral with regard to jurisdictional claims in published maps and institutional affiliations. |
© 2021 by the authors. Licensee MDPI, Basel, Switzerland. This article is an open access article distributed under the terms and conditions of the Creative Commons Attribution (CC BY) license (https://creativecommons.org/licenses/by/4.0/).