Abstract
As an advanced oxidative processes, the Fenton process is receiving popularity as a wastewater treatment technique that can be used for hazardous landfill leachate. The treatment is simple, yet involves complex interactions between the affecting parameters including reaction time, H2O2/Fe2+ ratio, pH, and iron (II) ion concentration. Hence, the purpose of this present study was to analyze the factors affecting landfill leachate treatment as well as their interaction by means of response surface methodology (RSM) with central composite design. The independent variables were reaction time, H2O2/Fe2+ ratio, iron (II) ion concentration, and pH, and the dependent variable (response) was color-removal percentage. The optimum treatment conditions for pH, H2O2/Fe2+ ratio, Fe2+ concentration, and reaction time were 8.36, 3.32, 964.95 mg/L, and 50.15 min, respectively. The model predicted 100% color removal in optimum conditions, which was close to that obtained from the experiment (97.68%). In conclusion, the optimized Fenton process using the RSM approach promotes efficient landfill leachate treatment that is even higher than that already reported.
1. Introduction
Liquids may become contaminated from dissolved or suspended materials when passing through municipal solid waste landfills. The term used for these liquids is landfill leachate; it is commonly a dark color with strong smell and carries high organic and inorganic loads [1]. There are over 200 organic compounds identified in landfill leachate including aromatic hydrocarbons and cyclic and bicyclic compounds, with each compound having a concentration range from <1 g/L to more than 100 g/L. The contaminant loads can be divided into four groups—heavy metals (Pb2+, Ni2+, Cd2+, Zn2+, Cr3+, and Cu2+), major inorganic ions (NH4+, Fe2+, Ca2+, Mn2+, Na+, Cl−, K+, SO4−2, Mg2+, and HCO3−), dissolved organic matter (including volatile fatty acids as well as persistent organic matters such as humic compounds), and xenobiotic organic substances derived from chemical and domestic residue (including aromatic hydrocarbons, phenols, and pesticides). Microorganisms are also present in landfill leachate predominated by total and thermo-tolerant coliforms [2,3,4]. Regardless of its toxicity and recalcitrance, landfill leachate persists in increasing amounts owing to the landfilling methods used for either municipal or industrial solid waste discharge [5].
Current approaches employed in leachate treatment are mostly dependent on biological techniques. However, such approaches are considered impractical due to extremely variable organic loads and leachate flows as well as the requirements of vast construction areas. Furthermore, treatment efficiency could be reduced due to the refractory features of the leachate [6]. Other approaches, including adsorption, also require special reactors and work only against specific contaminants [7,8]. Alternatively, combined physicochemical processes can be used on the leachate to degrade and mineralize the refractory contaminants [9]. An example of this is the recently popular treatment method, advanced oxidative processes (AOPs), that can work against a wide range of resistant contaminants. The Fenton process, one of AOPs, works by exploiting the vigorous oxidation potential of •OH radicals which results in the mineralization of resistant contaminants and biodegradability enhancement allowing for further treatment using biological techniques. The •OH radicals are produced concomitant to the catalysis reaction of hydrogen peroxide using ferrous ions [8]. The treatment system itself consists of pH adjustment, oxidation reaction, neutralization, coagulation, and settlement [10,11]. Nonetheless, despite its high removal efficiency, previous work employing Fenton reagents in leachate treatment has reported unsatisfying results, where a post-treatment was required for its application [12].
Based on a previous report [13], pH, experimental time, the amount of Fe2+, and the H2O2:Fe2+ ratio are significant to the outcome of oxidative leachate treatment. Optimization of the aforementioned parameters could be a solution to overcoming the weaknesses in the Fenton process. In this light, advanced statistical design is commonly employed for modelling, optimization, and characterization of a particular treatment [14]. Herein, we employed response surface methodology (RSM) which is a combination of mathematical and statistical techniques to study correlated factors in leachate treatment process and their optimization [15]. In comparison to conventional optimization methods, the RSM could provide much more information from only a small number of experiments performed [16]. In this study, the optimum conditions (reaction time, pH, and H2O2:Fe2+ ratio, as well as Fe2+ concentration) for landfill leachate decolorization by the Fenton process were determined. Using the color-removal percentage is a common parameter to evaluate the success of the landfill leachate treatment [17,18,19]. The experimental runs were prepared based on the suggestion from central composite design (CCD) [20].
2. Materials and Methods
2.1. Sampling and Characterization of the Landfill Leachate
In the Jeram Sanitary Landfill the leachate produced from landfill is pumped into a treatment system that consists of three main stages—primary stage, secondary stage, and tertiary stage. During the primary stage the leachate is passed through three equalization ponds (also referred to as sequential batch reactors). The same process is repeated in the secondary stage but with only two sequential batch reactors. Once the secondary stage is completed the remaining liquid is subjected to physical and chemical treatments during the tertiary stage to ensure compliance with standards. In this work, leachate samples were obtained from a landfill near an oil palm plantation at Jeram, Kuala Selangor, Malaysia. Priorly-cleaned two-gallon plastic containers were used to carry the leachate sample collected from beneath the top surface. Each container was labelled according to the sampling location and date. Before being capped, air bubbles in the sample were removed. All samples were brought to the laboratory and kept at 4 °C. Sieve analysis (gradation test with pore size 100 and 150 um), 0.45 μm Whatman filter glass paper and a centrifuge device (Kubota 2420 model) were used to exclude large particles and debris before the experiment. The results of the leachate samples showed the concentration of organic compounds, expressed as COD, were 10,516 mg/L and the ammoniacal (NH3-N) concentration in the leachate studied was about 15 mg/L. Characteristics of the collected leachate sample are presented in Table 1.

Table 1.
Characteristics of the leachate sample collected from Jeram Landfill.
2.2. Fenton Experiments
To obtain the data on effective variables and their proper range, Design Expert software was employed to produce a full factorial design effect plot. Investigation on possible combinations was carried out under the full factorial approach that is required to generate a probability model displaying interactions between k design variables. As many as four steps and 20 runs per experimental set were involved in the screening phase (total runs: 80 with 2k design, where k represents the number of variables). As suggested previously [16], in this present study, 2k full factorial design was employed, where responses were measured from all combinations of the experimental factor levels. Preliminary four-steps full factorial design has been presented (Table 2). Plots were generated to determine each variable and to observe its interaction against the response variables. The ratio of H2O2:Fe2+ (2, 5, 6, and 10) was assigned as the variable factor in the selection of full factorial design. The concentration variation of Fe2+ was prepared as per the suggestions of previous studies [15,21]. The following are the operated runs at each Fe2+ concentration.
Table 2.
Preliminary full factor design for color removal resulting from the Fenton process.
- Step 1: 500 mg/L Fe2+
- Step 2: 4000 mg/L Fe2+
- Step 3: 1000 mg/L Fe2+
- Step 4: 2000 mg/L Fe2+
2.3. Experimental Design and Statistical Model
In this procedure, contact time (A), Fe2+ concentration (B), pH (C), as well as ratio of H2O2:Fe2+ (D) were assigned as independent variables determined using the RSM. As for the responses, overall color removal (Y1) was selected. Effect plots were generated in R (R core team) software version 3.2.2 based on an assessment of collective responses from 80 runs, suggesting the effective factors. Exclusion was then applied on factors that were not effective. Hence, the new design consisted of 44 runs. CCD was used in the RSM model to observe the interaction between the independent variables against Fenton-treatment-induced color removal. The levels of independent variables and experimental range employed toward Fenton-process-based leachate treatment have been presented (Table 3). Meanwhile, the yielded responses (Y1) and experimental values (A, B, C, and D), along with variable-encoded experimental data are given in Table 4. Each response represents a function of the treatment time (A), Fe2+ concentration (B), pH (C), and H2O2:Fe2+ ratio (D). Important terms of the interaction effects (AB, AC, AD, BC, BD, and CD), the first order (A, B, C, and D), and the second-order (A2, B2, C2, and D2) are included. The approximate ranges of the variables were 5–60 min, 500–1500 mg/L, pH 3–9, and 2–10 for treatment time, Fe2+ concentration, initial pH level, and H2O2:Fe2+ ratio, respectively. Collectively, there were 44 experiments designed using 2k; 8 axial (star) points, 16 factorial points, and 20 replicates at the center point. The chosen independent factors were coded using Equation (1) [22,23].
where Xi represents a dimensionless coded value of the ith independent variable, while X0 and ΔX are the center point value of Xi and step change value, respectively. To determine the correlation between the variables (X) and the responses (Y), a quadratic model was applied (Equation (2))—an adequate (second order) model. A linear model predicting the responses from entire experimental fields was also generated—approximating the interaction between the decolorization and the four independent variables [8]:
where bi, bii, and bij represent the coefficient of the related regression coefficients. Obtained data were analyzed statistically using ANOVA operated in Minitab software. Coefficient of determination (R2) and adjusted R2 represent the model’s fitting quality. F-tests were further used to assess the significance of linear and quadratic terms. P-value was used to select the final subset of variables at a confidence level of 95%. Predictive ability of the proposed model was judged based on R2 prediction coefficient along with predicted residual error sum of squares (PRESS). Relationships between responses and experimental levels of each tested variable were illustrated in contour and surface plots based on the fitted polynomial equation. Preparation of the 3D response plots and contour plots was based on a customized program using design expert software. The optimum value of each independent variable was tested in a batch Fenton experiment for validation.
Table 3.
Central composite experiments design.
Table 4.
Experimental range and levels used for the independent variables.
The influential factors such as initial pH, H2O2:Fe2+ ratio, and Fe2+ concentration, along with their ranges were chosen according to published studies [24,25,26,27], as shown in Table 3. The coded levels and the factor values used in the experiments are presented in Table 4. The batch experiment was conducted in a 1 L glass reactor using jar-test equipment with flat stirring vanes (25 °C; 1 atm). The 300 mL leachate sample was poured onto the glass reactor, followed by pH adjustment (3, 4.5, 6, 7.5, and 9) using H2SO4 95–97%. Ferrous sulphate (FeSO4.7H2O) powder (500, 750, 1000, 1250, and 1500 mg/L) was then added to the reactor and mixed for 5 min until homogenous. Next, to initiate the Fenton reaction, H2O2 30% (w/w) was added until the H2O2:Fe2+ ratio reached the desired amount (2, 4, 6, 8, and 10). The procedure was followed by a rapid mixing (250 rpm) for 80 s in a jar-test, before the rotation speed slowed down to 50 rpm for predetermined contact time (5, 18.75, 32.5, 46.25, and 60 min). Once completed, the sample was filtered at the same intervals and subsequently neutralized using NaOH until pH 7.5–8.0. The sample was left to allow the formation of precipitate for 1 h. The supernatant was measured for color removal using the following equation [28]:
(COD initial − COD final/COD initial) × 100
3. Results and Discussions
3.1. Preliminary Investigation
For this part of study, there were four steps that each included 20 runs. These runs were performed for screening. In total, there were 80 runs conducted as provisioned by the full factorial method in the laboratory during the preliminary investigation. A number of runs were applied on Fe2+ concentration variation based on the predetermined H2O2:Fe2+ ratios. As the outcome, the stage of investigation determined effective variables along with their appropriate ranges. The aim of choosing this parameter was to reduce the number of runs. As a consequence, this phase was able to determine the effective variables and their adequate ranges. In order to assess each variable and how it affects the response variables, effect plots were prepared based on the results. The orders of runs are shown as follows. To assess the effect of each variable against the decolorization, effect plots were generated and presented (Figure 1). The order of runs is exhibited below.
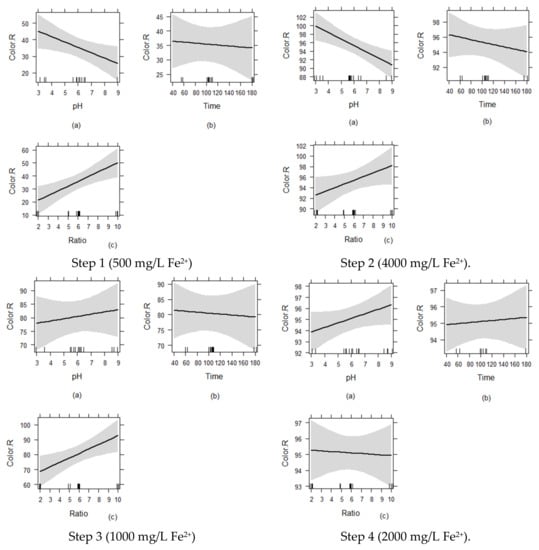
Figure 1.
Effect plots of the independent variables on color removal for (a) pH, (b) time, (c) H2O2:Fe2+ ratio.
The range of solution pH appears to influence the color removal, which is in contrast with the reaction time that yielded insignificant effect.
This means with the 500 mg/L Fen2+ the color removal would be at pH (acidic range) and the ratio (alkaline range) had a significant effect but contact time has little effect. For color removal with the 1000 mg/L Fe2+, the ratio (alkaline range) had a significant effect, but contact time did not. It also revealed that ratio had more effect on the process in comparison to the initial pH. The color removal with the 2000 mg/L Fe2+, pH (alkaline range) had a considerable influence, although the reaction time and ratio did not have any great effect.
3.2. Primary Investigation
The experimental data obtained through 44 different observations have been normalized. Each independent variable had a variation ranged between −α, −1, 0, and +1, +α that was determined as per suggestions from the preliminary study along with published reports. This coding scheme was massively employed in fitting regression models, where the coded variables would fall between +α (maximum value) and –α (minimum value) [24,29]. The summary of adopted configurations in each CCD are presented in Table 5.
Table 5.
Coded variable of central composite experiments design.
3.3. Color Removal Efficiency Using the RSM Method
This part evaluated the color removal efficiency of landfill leachate treatment relying on the Fenton process. Table 6 shows the color-removal percentage in accordance with the experimental and predicted data using the RSM. The maximum color removal was obtained in run 36 with 95% removal and the minimum color removal in run 31 with 13.4% removal. The predicted data were obtained from Equation (4). The RSM method revealed an overall prediction error of 4.3%. This suggests the suitability of the proposed empirical method in forecasting the color removal.
Table 6.
Experimental design and results for color removal.
3.4. Regression Models and Statistical Analysis
The polynomial model representing the response variable (color removal) was constructed based on the data presented in Table 4. Further, these data were used to prepare a regression model; the Y response was defined as a function of contact time (A), Fe2+ concentration (B), pH (C), and the H2O2:Fe2+ ratio (D). The proposed formula is as follows:
where A represents contact time, B is the Fe2+ concentration, C is the pH, and D is the H2O2:Fe2+ ratio, with Y as the response (in this case, it is % color removal). The scope of the generated formula is to determine the efficiency of color removal from landfill leachate by using the Fenton process. In addition, the empirical formula was developed to remove the turbidity of leachate.
A significant effect of the Fe2+ concentration, pH, time, H2O2:Fe2+ratio, and interactions among the variables was observed. Table 7 illustrates the model F-value of 18.53 suggesting statistical significance. It could be a 0.01% chance that noise is responsible for a “Model F-Value” of this size. In this investigation, A, B, C, D, AB, BC, BD, CD, A2, and B2 are statistically meaningful derived from their values of Prob > F that are less than 0.05. Meanwhile, when the values are higher than 0.1, the model terms are not considered significant. Model reduction could contribute to an improvement when many insignificant model terms were found (excluding the required terms for hierarchy support). The “Lack of Fit F-value” of 0.85 suggests that the lack of fit is relatively insignificant to the pure error. This large “Lack of Fit F-value” has 58.12% chance to occur. Note that insignificant lack of fit is preferred.
Table 7.
Analysis of variance for color removal.
Fitting quality of a model could be judged by the coefficient of determination (R2). ANOVA results in this study present a high R2 value (0.9026) that is close to the adjusted R2 (0.8539) implying the applicability of the quadratic model. The closeness between R2 and adjusted R2 values suggests that the all terms included in the model were significant [30]. A model could not be assessed solely by R2, where a model with high R2 may still yield poor prediction. Thus, the predictability of a regression model could be assessed by R2 prediction, derived from the prediction error sum of squares (PRESS) [24,31]. Generally, our model was found to have better predictability according to the stated criterion when compared with others [26,32]. Table 8 presents a “Pred R-Squared” of 0.7156 which is in line with the adjusted R2 of 0.8539. Moreover, Adeq Precision was taken to measure the signal-to-noise ratio, where the value higher 4 is desirable. Herein, Adeq Precision of 19.156 was obtained indicating an adequate signal.
Table 8.
Regression statistics.
A popular combination technique of the used procedures in this study, the stepwise regression method, allows simultaneous addition or deletion of regressors, where only variables with statistical significance (p < 0.05) are be included. Hence, the statistically insignificant A:C, A:D, C2, and D2 coefficients were excluded from the model. As a consequence, only interactions between A, B, C, D, AB, AC, AD, BC, BD, CD, A2, B2, C2, and D2 were included to the model. Model reduction was then carried out using a new ANOVA. Reduced second-order equation of the model and some other statistical parameters could be observed in Table 9. The Model F-value was 27.48 suggesting the statistical significance of the model.
Table 9.
Analysis of variance for color removal (reduced model).
In this case, there was merely a 0.01% chance that the noise generated such “Model F-Value”. Moreover, the significance of the model was exhibited by values of “Prob > F” less than 0.05. It can be concluded that A, B, C, D, AB, BC, BD, CD, A2, and B2 are considered significant terms in the model. The “Lack of Fit F-value” of 0.73 suggests that the insignificance of the lack of fit was relative to pure error with a 71.18% chance it was generated from the noise.
High R2 values show the high significance of the model, indicating the reliability of the polynomial equation. Furthermore, all of the screened terms had significant contribution to the proposed model (p < 0.05). The “Pred R-Squared” of 0.8043 was in reasonable agreement with the “Adj R-Squared” of 0.8631. “Adeq Precision” measures the signal to noise ratio. A ratio greater than 4 is desirable. Adeq Precision of 22.852 indicates a proportional signal. This model could be utilized to direct the design space, as shown in Table 10.
Table 10.
Regression statistics (reduced).
The plot constructed according to the experimental results versus the predicted data is presented in Figure 2. It shows that most data points were well-distributed around the straight-line X = Y in a narrow area. The plot also has R2 = 0.87999 suggesting good reliability of the model. Therefore, this model could be utilized to direct the design space.
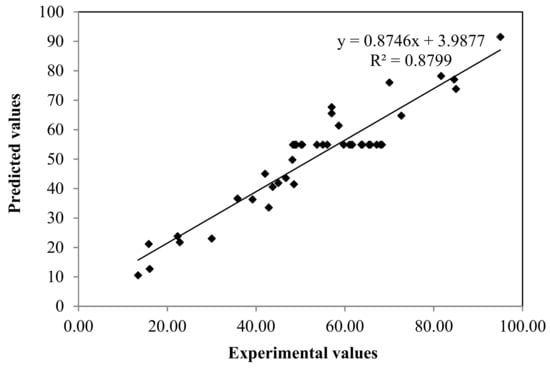
Figure 2.
Predicted vs. actual values plot for color removal.
An analysis was conducted for the assumption of normality by preparing the plot of studentized residuals vs. the normal % of probability (Figure 3), revealing a satisfactory model towards color removal.
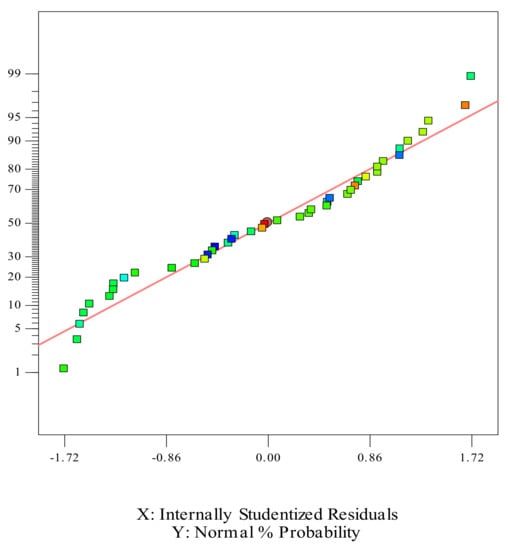
Figure 3.
The normal % probability and studentized residuals.
3.4.1. Perturbation Plot for Color Removal
A perturbation plot was constructed for deeper identification of the most sensitive factors for leachate treatment. In this part, the perturbation plot for color removal was used to assess the response behavior as a result of deviation from the center point while the other factors were maintained constant. In the perturbation plot (Figure 4), the increase in reaction time (A) and pH (C) promoted higher color-removal percentage; therefore, the reaction time (A) and pH (C) yielded the most noteworthy positive effect on the color response. Increase in Fe2+ concentration (B) along with the ratio of H2O2:Fe2+ (D) decreased the color-removal percentage suggesting the negative effects on the decolorization.
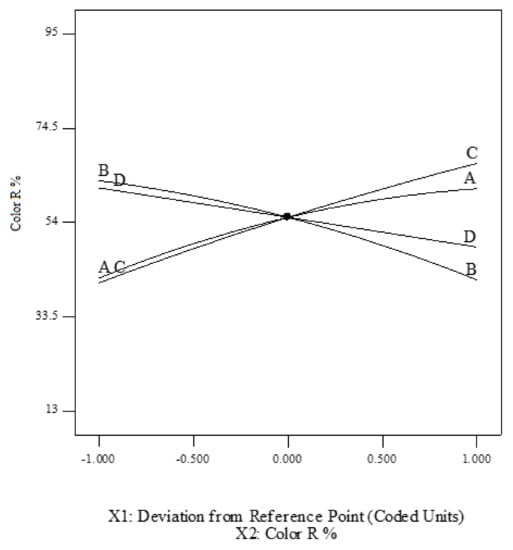
Figure 4.
Perturbation plot for color removal.
3.4.2. Three-Dimensional (3D) Response Surfaces and Contour Plots for COD Removal
To obtain graphical illustrations of the regression equation the 3D response surface plot and 2D contour map were constructed in Design Expert 7.0 software analysis. The first-order effects, six interaction effects (AB, AC, AD, BC, BD, and CD) and four second-order effects (A2, B2, C2, and D2) were evaluated according to Equation (4).
Variation from 5 to 60 min reaction time was applied to determine its effect on Fenton process-induced color removal. It also revealed that Fenton efficiency is negatively affected by the augmentation of Fe2+ concentration (Figure 5). Generally, the uptake of organic contaminants could be enhanced by decreasing concentration of the iron salt, and similarly, by decreasing the reaction time. Nonetheless, the increase in color removal was probably too minor in the presence of high iron salt concentration. According to previously published works, further addition of Fe2+ could induce self-inhibition of the •OH radical which consequently reduce the degradation of organic contaminants [28,33,34]:
OH• + Fe2+ → Fe3+ + OH−

Figure 5.
Role of reaction time and Fe2+ concentration in leachate decolorization depicted in 3D response surfaces and contour plot.
The influence of pH against the leachate decolorization is exhibited in Figure 6, where the system was varied with pH ranged from 3, 4.5, 6, 7.5 to 9. A decrease in color removal efficiency was observed at pH lower than 7.5, ascribed to the reduction of hydroxyl radical population concomitant to Fe2+ complexation [35]. Similarly, the formation of Fe2+ complex is also responsible for the decrease of removal efficiency at pH > 7.5. This is in line with a previously reported study suggesting the reduction of oxidation potential of the •OH radicals when the system pH is elevated [35]. Moreover, the leachate that was originally black in color turned into light brown at higher and lower pH levels. The results also show that reaction time has a positive correlation with color removal. The equilibrium was reached after 46.25 min reaction. Afterward, the significant color removal no longer occurred. Reaction time is a core factor in the Fenton process. According to reported studies, the required reaction time to reach equilibrium varied from 30 min up to 3 h [36,37].
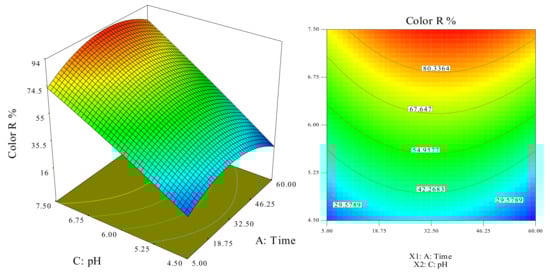
Figure 6.
Role of reaction time and pH in leachate decolorization depicted in 3D response surfaces and contour plot.
Figure 7 indicates the increase in decolorization efficiency as a function of time during oxidation. The obtained data demonstrate that the landfill leachate was instantly decolorized during the Fenton process. Commonly, organic contaminants were degraded as soon as 46.25 min reaction time. Afterwards, the decolorization was negligible. Numerous foams were formed on the leachate surface with the proceeding of the oxidation. Bicarbonate ions originating from the leachate were converted into carbonic acid when pH level was reduced to acidic range, which consequently dissolved in the liquid or released it to the air as CO2. Organic matter present in the leachate was dramatically converted to oxidized by-products as a result of the Fenton process. During the early state of oxidation reactions, the conversion occurs both partially and fully. With the abundance of hydroxyl radicals, the full conversion is expected. Nonetheless, as the time elapses the reaction would only rely only on residual hydroxyl radicals that consequently cause the partial conversion.
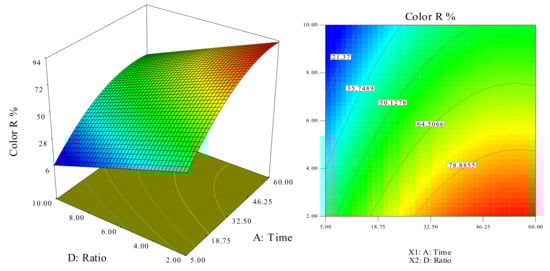
Figure 7.
Role of reaction time and H2O2:Fe2+ratio in leachate decolorization depicted in 3D response surfaces and contour plot.
The ratio of H2O2:Fe2+ was set at a variation from 2, 4, 6, 8, to 10 in order to investigate its effect against the color removal. Both hydrogen peroxide and iron are essential in the Fenton process, especially in regard of the treatment efficiency and operation cost. The efficiency could be obtained by elevating the ratio of H2O2:Fe2+ from 2 to 4, whereas further increment led to lower removal percentage. This phenomenon could be associated with the reaction mechanism of the Fenton process as reported previously [36]. At low H2O2:Fe2+ ratio, second-pseudo-order kinetics governs the reaction rate until the stoichiometry ratio of 2Fe (II) ≅ H2O2 is reached. However, when the H2O2:Fe2+ ratio goes up, the oxidative reaction is more dependent to zero-order kinetics. Higher H2O2:Fe2+ ratios result in the alteration of the mechanism, where it would be no longer affected by hydrogen peroxide concentration [36].
As mentioned earlier, due to the importance of Fe2+ and H2O2 in the Fenton process, the H2O2:Fe2+ ratio used in the treatment required optimization. The oxidation of organic substances in the leachate by hydroxyl radicals produced from a reaction between H2O2 and iron followed the reaction below [38]:
OH• + organic substances → oxidation products
The optimization of H2O2 and Fe2+ aimed to avoid the excessiveness that could cause unwanted •OH radical-scavenging reactions. Thus, H2O2:Fe2+ ratios used in the batch experiment were varied from 2, 4, 6, 8, to 10. The optimum Fe2+ concentration and H2O2:Fe2+ ratio was revealed to be 750 mg/L and 4, respectively, where the color removal efficiency reached 95% (Figure 8). A higher ratio of H2O2:Fe2+ could lead to reduced efficiency of the color removal, which is ascribed to the scavenging activity of H2O2 against hydroxyl radicals [38]:
H2O2 + OH• → HO•2 + H2O
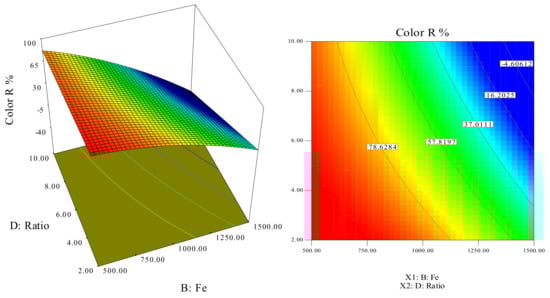
Figure 8.
Role of Fe2+ concentration and H2O2:Fe2+ ratio in leachate decolorization depicted in 3D response surfaces and contour plot.
The foregoing reaction induces the generation of the hydroperoxyl radical (HO2); a species with significantly less oxidizing potential than that of hydroxyl radical. Furthermore, auto-decomposition of H2O2 into water along with oxygen and the recombination of •OH radicals could occur at the excess of H2O2. Meanwhile, when the ratio is set below 4, the scavenging activity would be inhibited by the excess of Fe3+ species that consequently reduces the color removal efficiency (Equation (8)). It appears that Fe2+ could compete with organic contaminants in the hydroxyl-radical-induced oxidation. Hence, Fe2+ digests hydroxyl radicals (Equation (8)), leading to the reduction of the treatment efficiency.
Fe2+ + OH• → Fe3+ + OH−
As a consequence, more addition of Fe2+ results in less availability of •OH radicals to act in oxidizing the organic contaminants. Additionally, Fe3+ may form a reaction with hydrogen peroxide (Equation (8)) to yield Fe2+ and HO2 in the leachate. Taken altogether, the ratio of 4 is assigned as the optimum ratio. In this study, the obtained optimum ratio was distinct to that reported. For instance, a 20:1 ratio of H2O2:Fe2+ yielded an optimum result in a raw leachate treatment [39]. Meanwhile, another previous study revealed the optimum H2O2:Fe2 ratio was 1.5 [40]. Disagreement on optimum H2O2:Fe2 ratio between published research and our work could be attributed to different characteristics of the landfill leachate.
H2O2 + Fe3+ → Fe2+ + HO•2 + H+
This study revealed that the highest removal efficiency was reached with Fe2+ concentration of 750 mg/L. More addition of Fe2+ concentration could be associated with the increase in the decolorization until the optimum concentration was reached. As explained earlier, competition between Fe2+ and organic substances might occur leading to inefficient decolorization. Hence, excessive amounts of Fe2+ should be avoided.
Interaction between iron (II) ion concentration as well as initial pH of the system against the decolorization is presented in Figure 9. The interaction suggests that modification of Fe2+ and H2O2 is dependent on the pH level, where all of them are regressor variables. The highest removal (95%) was achieved at pH 7.5. It could be concluded that alkaline range pH enables the maximum removal of the organic compound, indicated by the decolorization. It is worth mentioning that a pH level less than 5.0 might cause slower reaction stemming from iron species complexation as well as oxonium ion [H3O2]+ formation [35]. Moreover, pH lower than 7.5 could induce the precipitation of iron ions (especially Fe3+), that consequently inhibit the regeneration of ferrous ions. Further increase in pH level (>7.5) might cause instability of the hydrogen peroxide to be decomposed into neutral molecules O2 and H2O. Herein, the investigation results suggest that the Fenton system was sensitive to pH level and the system should be maintained in alkaline condition to promote iron solubility.
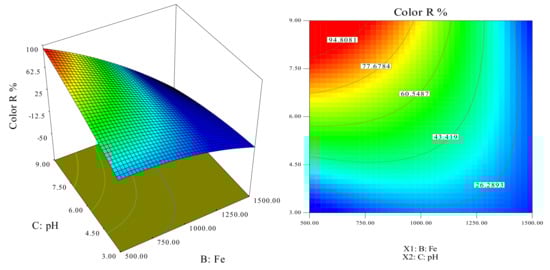
Figure 9.
Role of Fe2+ concentration and pH in leachate decolorization depicted in 3D response surfaces and contour plot.
Figure 10 exhibits the role of pH in the leachate decolorization, where the data were obtained from a batch experiment using pH values ranging from 3 to 9. According to the investigation, the pH level that could yield the optimum treatment result is pH 7.5. It appears that that alkaline range pH is preferred to produce a maximum amount of •OH radicals. When pH solution is set above 7.5, the •OH radicals are slower as a result of ferric–hydroxo complex formation [38,41]. The correlation of the H2O2:Fe2+ ratio and the color removal efficiency were observed positive until the ratio reached 4. However, the correlation became negative once the ratio was increased which is attributed to the inhibition of the scavenging activities of OH• radical by excessive amounts of hydrogen peroxide.
OH• + H2O2 → HOO• + H2O
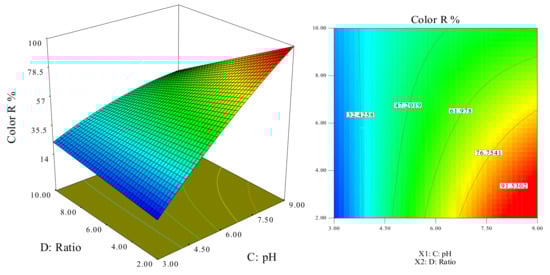
Figure 10.
Role of pH and H2O2:Fe2+ ratio in leachate decolorization depicted in 3D response surfaces and contour plot.
4. Validation of the Experimental Model at Optimized Conditions
Numerical optimization was carried out to obtain the optimum parameters for the color removal from the leachate by using response surface and desirability functions. In this regard, all variables were prepared to fit the designed range, and color removal was set at maximal value. The highest desirability was then revealed as pH = 8.36, H2O2:Fe2+ ratio = 3.32, Fe2+ concentration = 964.95 mg/L, and reaction time = 50.15 min, in which the color removal was expected to reach 100%. To validate the prediction of the model and the reliability of the optimum combination, an additional batch experiment was conducted using suggested conditions. As a result, 97.68% color removal was obtained. The small error between the experimental and forecast values suggests high reliability of the model. Furthermore, this outcome was better than that of the reported combined Fenton methods using manual optimization [17,18,19]. Taken together, our study suggests that the RSM is a robust tool for optimizing the working conditions of Fenton-process-based leachate decolorization.
5. Conclusions
To date, landfilling has been the most common method of municipal waste management, due to both technological and economic reasons. A problem associated with the use of landfills is the production of leachate which can lead to serious environmental problems. Characteristics of leachate depend on the composition and amount of deposited waste, the construction and operational conditions of the landfill, and the age of the landfill. Leachate contains high concentrations of ammonia and organic contaminants, halogenated hydrocarbons, heavy metals, and inorganic salts. The Fenton process is used to oxidize complex organic constituents found in wastewater that is difficult to degrade biologically into simpler end products and facilitate the conversion of pollutants to less harmful and more biodegradable compounds. It removes a wide range of organic matter and has been studied by several researchers for the treatment of various types of industrial and residential wastewaters, including landfill leachate. In this regard, mathematical models such as the response surface method (RSM) have proved to be useful for process design and optimization of responses. This model was also used to reduce the number of experimental trials. The RSM provides information and is an economical approach to monitoring the effect of the independent variables on the response. It can reduce the number of experiments that need to be carried out as well as reducing time and expense.
The RSM with CCD could be utilized to optimize the operating conditions of the Fenton process in landfill leachate treatment, where data produced using the RSM has been shown to be statistically reliable. The optimum conditions were as follows: pH = 8.36, H2O2:Fe2+ ratio = 3.32, Fe2+ concentration = 964.95 mg/L, and reaction time = 50.15 min. The quadratic models are in line with the experimental data (R2 > 0.9026). Maximum color removal achieved under the determined optimal conditions was 97.68%, higher than that of previously reported work.
Author Contributions
A.M.R.: Conceptualization, methodology, validation, formal analysis, investigation, resources, data curation, writing—original draft preparation, visualization, project administration, software, Supervision, Funding acquisition, Writing—Review & editing. S.S.: Data curation, funding. M.A.: formal analysis, Software, Validation, Data curation. A.M.: Data curation, Formal analysis. M.I.: Funding. All authors have read and agreed to the published version of the manuscript.
Funding
The authors would like to thank Worldwide Landfills Sdn Bhd, Jeram, Selangor, Malaysia for supplying the landfill leachate. This research was funded by Universiti Teknologi Malaysia under the UTM Prototype Research Grant, Vote Number: Q.K130000.2856.00L57.
Institutional Review Board Statement
Not applicable.
Informed Consent Statement
Not applicable.
Data Availability Statement
Contact correspondence author.
Acknowledgments
The authors would like to thank Worldwide Landfills Sdn Bhd, Jeram, Selangor, Malaysia for supplying the landfill leachate. This research was funded by Universiti Teknologi Malaysia under the UTM Prototype Research Grant, Vote Number: Q.K130000.2856.00L57.
Conflicts of Interest
The authors have no conflict of interest to declare.
References
- Maslahati Roudi, A.; Chelliapan, S.; Wan Mohtar, W.H.M.; Kamyab, H. Prediction and optimization of the fenton process for the treatment of landfill leachate using an artificial neural network. Water 2018, 10, 595. [Google Scholar] [CrossRef] [Green Version]
- Moravia, W.G.; Amaral, M.C.; Lange, L.C. Evaluation of landfill leachate treatment by advanced oxidative process by Fenton’s reagent combined with membrane separation system. Waste Manag. 2013, 33, 89–101. [Google Scholar] [CrossRef] [PubMed]
- Anita, M.R.; Sabariah, B.; Shreeshivadasan, C.; Roudi, A.; Hesam, K.; Mohammad, S. Effect of temperature on theperformance of Porous Membrane Activated Sludge Reactor (PMASR) treating synthetic wastewater. Res. J. Pharm. Biol. Chem. Sci. 2014, 5, 84–100. [Google Scholar]
- Dolatabadi, M.; Świergosz, T.; Ahmadzadeh, S. Electro-Fenton approach in oxidative degradation of dimethyl phthalate-The treatment of aqueous leachate from landfills. Sci. Total. Environ. 2021, 772, 145323. [Google Scholar] [CrossRef]
- Dos Santos Vaz, C.A.; Samanamud, G.L.; da Silva, R.S.; França, A.B.; Quintão, C.M.F.; Urzedo, A.P.; Silva, M.B.; Neto, J.C.B.; Amaral, M.S.; Loures, C.C.A.J. Modeling and optimization of hybrid leachate treatment processes and scale-up of the process. J. Clean. Prod. 2021, 312, 127732. [Google Scholar] [CrossRef]
- Roudi, A.M.; Akhlaghi, E.; Chelliapan, S.; Kaboli, A.; Roudi, A.M.; Aslani, H.; Selvam, S.B. Treatment of Landfill Leachate via Advanced Oxidation Process (AOPs)—A Review. Res. J. Pharm. Biol. Chem. Sci. 2015, 6, 260–271. [Google Scholar]
- Marlina; Iqhrammullah, M.; Saleha, S.; Fathurrahmi; Maulina, F.P.; Idroes, R. Polyurethane film prepared from ball-milled algal polyol particle and activated carbon filler for NH3-N removal. Heliyon 2020, 6, e04590. [Google Scholar] [CrossRef]
- El Mrabet, I.; Ihssane, B.; Valdés, H.; Zaitan, H. Optimization of Fenton process operating conditions for the treatment of the landfill leachate of Fez city (Morocco). Int. J. Environ. Sci. Technol. 2021, 6, 1–14. [Google Scholar] [CrossRef]
- Zolfaghari, M.; Jardak, K.; Drogui, P.; Brar, S.K.; Buelna, G.; Dubé, R. Landfill leachate treatment by sequential membrane bioreactor and electro-oxidation processes. J. Environ. Manag. 2016, 184, 318–326. [Google Scholar] [CrossRef] [Green Version]
- Erkan, H.S.; Apaydin, O. Final treatment of young, middle-aged, and stabilized leachates by Fenton process: Optimization by response surface methodology. Desalination Water Treat. 2015, 54, 342–357. [Google Scholar] [CrossRef]
- Kumar, S.S.; Malyan, S.; Kumar, A.; Bishnoi, N.R. Optimization of Fenton’s Oxidation by Box-Behnken Design of Response Surface Methodology for Landfill Leachate. J. Mater. Environ. Sci. 2016, 7, 4456–4466. [Google Scholar]
- Guvenc, S.Y.; Varank, G. Degradation of refractory organics in concentrated leachate by the Fenton process: Central composite design for process optimization. Front. Environ. Sci. Eng. 2021, 15, 1–16. [Google Scholar]
- Kermani, M.; Shahsavani, A.; Ghaderi, P.; Kasaee, P.; Mehralipour, J. Optimization of UV-Electroproxone procedure for treatment of landfill leachate: The study of energy consumption. J. Environ. Health Sci. Eng. 2021, 19, 81–93. [Google Scholar] [CrossRef]
- Kwarciak-Kozłowska, A.; Fijałkowski, K.L. Efficiency assessment of municipal landfill leachate treatment during advanced oxidation process (AOP) with biochar adsorption (BC). J. Environ. Manag. 2021, 287, 112309. [Google Scholar] [CrossRef]
- Mahtab, M.S.; Islam, D.T.; Farooqi, I.H. Optimization of the process variables for landfill leachate treatment using Fenton based advanced oxidation technique. Eng. Sci. Technol. Int. J. 2021, 24, 428–435. [Google Scholar] [CrossRef]
- Muszyńska, J.; Bąk, Ł.; Górski, J.; Górska, K.; Sałata, A.; Gawdzik, J. Fenton Process Optimization with Landfill Leachate in Janczyce as an Example. Pol. J. Environ. Stud. 2021, 30, 3769–3775. [Google Scholar] [CrossRef]
- Silveira, J.E.; Zazo, J.A.; Pliego, G.; Casas, J.A. Landfill leachate treatment by sequential combination of activated persulfate and Fenton oxidation. Waste Manag. 2018, 81, 220–225. [Google Scholar] [CrossRef]
- Yazici Guvenc, S.; Dincer, K.; Varank, G. Performance of electrocoagulation and electro-Fenton processes for treatment of nanofiltration concentrate of biologically stabilized landfill leachate. J. Water Process. Eng. 2019, 31, 100863. [Google Scholar] [CrossRef]
- Tejera, J.; Miranda, R.; Hermosilla, D.; Urra, I.; Negro, C.; Blanco, Á. Treatment of a Mature Landfill Leachate: Comparison between Homogeneous and Heterogeneous Photo-Fenton with Different Pretreatments. Water 2019, 11, 1849. [Google Scholar] [CrossRef] [Green Version]
- Taşcı, S.; Özgüven, A.; Yıldız, B. Multi-Response/Multi-Step Optimization of Heterogeneous Fenton Process with Fe3O4 Catalyst for the Treatment of Landfill Leachate. Water Air Soil Pollut. 2021, 232, 275. [Google Scholar] [CrossRef]
- Kirmizakis, P.; Tsamoutsoglou, C.; Kayan, B.; Kalderis, D. Subcritical water treatment of landfill leachate: Application of response surface methodology. J. Environ. Manag. 2014, 146, 9–15. [Google Scholar] [CrossRef]
- Aslani, H.; Nabizadeh, R.; Nasseri, S.; Mesdaghinia, A.; Alimohammadi, M.; Mahvi, A.H.; Rastkari, N.; Nazmara, S. Application of response surface methodology for modeling and optimization of trichloroacetic acid and turbidity removal using potassium ferrate (VI). Desalination Water Treat. 2016, 57, 25317–25328. [Google Scholar] [CrossRef]
- Roudi, A.M.; Chelliapan, S.; Armaki, S.S.M. Determination of Cod and Color Reduction of Stabilized Landfill Leachate by Fenton Process. J. Asian Sci. Res. 2017, 7, 77. [Google Scholar] [CrossRef] [Green Version]
- Lak, M.G.; Sabour, M.R.; Amiri, A.; Rabbani, O. Application of quadratic regression model for Fenton treatment of municipal landfill leachate. Waste Manag. 2012, 32, 1895–1902. [Google Scholar]
- Sabour, M.R.; Lak, M.G.; Rabbani, O. Evaluation of the main parameters affecting the Fenton oxidation process in municipal landfill leachate treatment. Waste Manag. Res. 2011, 29, 397–405. [Google Scholar] [CrossRef]
- Wu, Y.; Zhou, S.; Qin, F.; Ye, X.; Zheng, K. Modeling physical and oxidative removal properties of Fenton process for treatment of landfill leachate using response surface methodology (RSM). J. Hazard. Mater. 2010, 180, 456–465. [Google Scholar] [CrossRef]
- Amiri, A.; Sabour, M.R. Multi-response optimization of Fenton process for applicability assessment in landfill leachate treatment. Waste Manag. 2014, 34, 2528–2536. [Google Scholar] [CrossRef]
- Santin-Gusman, M.; Moreno-Andrés, J.; Cisneros-Abad, M.; Aguilar-Ramírez, S. Optimization for Fenton Process in Removal of COD for Landfill Leachate Treatment. Int. J. Environ. Sci. Dev. 2015, 6, 920–924. [Google Scholar]
- Bianco, B.; De Michelis, I.; Vegliò, F. Fenton treatment of complex industrial wastewater: Optimization of process conditions by surface response method. J. Hazard. Mater. 2011, 186, 1733–1738. [Google Scholar] [CrossRef]
- Myers, R.; Montgomery, D.; Anderson-Cook, C. Response Surface Methodology: Process and Product Optimization Using Designed Experiments, 3rd ed.; John Wiley: Hoboken, NJ, USA, 2009. [Google Scholar]
- Montgomery, D.C. Design and Analysis of Experiments; John Wiley: Hoboken, NJ, USA, 2009. [Google Scholar]
- Ghafari, S.; Aziz, H.A.; Isa, M.H.; Zinatizadeh, A.A. Application of response surface methodology (RSM) to optimize coagulation–flocculation treatment of leachate using poly-aluminum chloride (PAC) and alum. J. Hazard. Mater. 2009, 163, 650–656. [Google Scholar] [CrossRef]
- Talebi, A.; Ismail, N.; Teng, T.T.; Alkarkhi, A.F. Optimization of COD, apparent color, and turbidity reductions of landfill leachate by Fenton reagent. Desalination Water Treat. 2014, 52, 1524–1530. [Google Scholar] [CrossRef]
- Roudi, A.M.; Kamyab, H.; Chelliapan, S.; Ashokkumar, V.; Kumar, A.; Yadav, K.K.; Gupta, N. Application of response surface method for Total organic carbon reduction in leachate treatment using Fenton process. Environ. Technol. Innov. 2020, 19, 101009. [Google Scholar] [CrossRef]
- Kwon, B.G.; Lee, D.S.; Kang, N.; Yoon, J. Characteristics of p-chlorophenol oxidation by Fenton’s reagent. Water Res. 1999, 33, 2110–2118. [Google Scholar] [CrossRef]
- Ahmadian, M.; Reshadat, S.; Yousefi, N.; Mirhossieni, S.H.; Zare, M.R.; Ghasemi, S.R.; Rajabi Gilan, N.; Khamutian, R.; Fatehizadeh, A. Municipal leachate treatment by Fenton process: Effect of some variable and kinetics. J. Environ. Public Health 2013, 2013, 169682. [Google Scholar] [CrossRef]
- Tengrui, L.; Al-Harbawi, A.; Jun, Z.; Bo, L.M. The effect and its influence factors of the Fenton process on the old landfill leachate. J. Appl. Sci. 2007, 7, 724–727. [Google Scholar] [CrossRef]
- Mohajeri, S.; Aziz, H.A.; Isa, M.H.; Bashir, M.J.; Mohajeri, L.; Adlan, M.N. Influence of Fenton reagent oxidation on mineralization and decolorization of municipal landfill leachate. J. Environ. Sci. Health Part A 2010, 45, 692–698. [Google Scholar] [CrossRef]
- Lopez, A.; Pagano, M.; Volpe, A.; Di Pinto, A.C. Fenton’s pre-treatment of mature landfill leachate. Chemosphere 2004, 54, 1005–1010. [Google Scholar] [CrossRef]
- Zhang, H.; Choi, H.J.; Huang, C.P. Optimization of Fenton process for the treatment of landfill leachate. J. Hazard. Mater. 2005, 125, 166–174. [Google Scholar] [CrossRef]
- Zhang, H.; Fei, C.; Zhang, D.; Tang, F. Degradation of 4-nitrophenol in aqueous medium by electro-Fenton method. J. Hazard. Mater. 2007, 145, 227–232. [Google Scholar] [CrossRef]
Publisher’s Note: MDPI stays neutral with regard to jurisdictional claims in published maps and institutional affiliations. |
© 2021 by the authors. Licensee MDPI, Basel, Switzerland. This article is an open access article distributed under the terms and conditions of the Creative Commons Attribution (CC BY) license (https://creativecommons.org/licenses/by/4.0/).