Article

Green Method Synthesised Graphene-Silver Electrochemical Nanobiosensors for Ethambutol and Pyrazinamide

1
SensorLab, Chemistry Department, Chemical Sciences Building, Senate Avenue, University of the Western Cape, Robert Sobukwe Road, Cape Town 7530, South Africa
2
Biotechnology Department, Life Sciences Building, Senate Avenue, University of the Western Cape, Robert Sobukwe Road, Cape Town 7530, South Africa
3
iThemba Labs, Materials Research Division, Old Faure Road, Faure, Cape Town 7131, South Africa
*
Author to whom correspondence should be addressed.
Processes 2020, 8(7), 879; https://doi.org/10.3390/pr8070879
Submission received: 18 June 2020 / Revised: 11 July 2020 / Accepted: 15 July 2020 / Published: 21 July 2020

Abstract

:
A novel nanobiosensor was constructed with graphene oxide (GO) sheets coupled to pear extract-based green-synthesised silver nanoparticles (Ag-NPs) to which cytochrome P450-2D6 (CYP2D6) enzyme was attached. The biosensor was applied in the electrochemical detection of the tuberculosis (TB) treatment drugs, ethambutol (EMB) and pyrazinamide (PZA). The surface morphology of the green-synthesised nanocomposites was studied by performing High-Resolution Transmission Electron Microscopy (HR-TEM) and High-Resolution Scanning Electron Microscopy (HR-SEM). Fourier Transform Infrared Spectroscopy (FTIR) and Raman Spectroscopy were used for structural analysis, while Ultraviolet Visible (UV-Vis) Spectroscopy was used in the optical characterisation of the nanocomposite material. Electrochemical studies on glassy carbon electrode (GCE), which were done by Cyclic Voltammetry (CV), showed that the GO|Ag-NPs||GCE electrode was highly conductive, and thereby indicating its suitability as a platform for nanobiosensor development. The non-toxic and low-cost green GO|Ag-NPs|CYP2D6||GCE nanobiosensor was used to determine EMB and PZA. The very low limit of detection (LOD) values of the biosensor for EMB (0.2962 × 10⁻² nM, S/N = 3) and PZA (0.897 × 10⁻² nM, S/N = 3) demonstrate that the green nanobiosensor is more sensitive than other biosensors reported for EMB and PZA.

1. Introduction

Metallic nanoparticles have fascinated scientists for over a century and are now heavily utilised in biomedical sciences and engineering. They are a focus of interest because of their huge potential use in nanotechnology [1]. Today these materials can be synthesised and modified with various chemical functional groups, which allows them to be conjugated with antibodies, ligands and drugs of interest, thus opening a wide range of potential applications in biotechnology, magnetic separation, the pre-concentration of target analytes, targeted drug delivery, drug delivery and more importantly are used in diagnostic imaging [2]. These imaging modalities differ in both techniques and instrumentation and require a contrast agent with unique physiochemical properties. This led to the invention of various nanoparticle contrast agents, such as magnetic nanoparticles (Fe3O4), gold, zinc and silver nanoparticles, for their application in these imaging modalities [3]. Among metal oxide nanoparticles, silver nanoparticles (Ag-NPs) have unique optical, electrical and thermal properties, allowing them to be incorporated into products that range from photovoltaic to biological and chemical sensors [4]. Examples include conductive inks, pastes and fillers which utilise silver nanoparticles for their high electrical conductivity, stability and low sintering temperatures. Additional applications include molecular diagnostics and photonic devices, which take advantage of the novel optical properties of these nanomaterials [5]. They also play a vital role as metal nanoparticles mostly in cosmetics and also in sensor development. In recent years, Ag-NPs have attracted the interest of many researchers because of their advantageous applications in biomedical, drug delivery, food industries, agriculture, textile industries, water treatment, catalysis and surface enhanced Raman scattering [6]. This study presents the non-toxic, simple, and environmentally friendly method for the synthesis of GO|Ag-NPs nanocomposites using pear extracts for the detection of tuberculosis (TB) treatment drugs.
Green nanotechnology is a new field aiming to replace the classical methods of obtaining nanoparticles which employ toxic and expensive chemicals with high energy input and negative effects on the environment [7]. The following study offers the tools for the alteration of biological methods to green protocols while preventing related toxicities. The need for such a study is attributed to the enormous amount of harmful and toxic chemicals and extreme conditions employed in the physicochemical synthesis of nanoparticles. As such, combining engineering principles with those of green chemistry and green nanotechnology can harvest eco-friendly, non-toxic and safe metal nanoparticles without the use of toxic chemicals in their synthesis [8]. This study reports on the use of the chemical properties of pear extract to synthesise GO|Ag-NPs nanocomposites.
Pear (Pyrus spp.) is a common fruit consumed throughout the whole world and used in the manufacture of processed products such as jam, drinks and preserved fruit. It is their diuretic, antihyperglycaemic, antitussive and anti-inflammatory effects which made pears a Chinese traditional remedy for more than 2000 years. In recent years, scholars have focused their attention on the analyses of the edible parts of pear fruits such as vitamins, polyphenols, amino acids, carboxylic acids, fatty acids and minerals [9]. Additionally, the peel has been shown to possess more important compounds such as kaempferol, quercetin, arbutin, hyroxycinnamoyl malates, catechin, chlorogenic acid and various ethyl esters, hydroxycinnamoylmalic acids and triterpenes compounds [10] which are believed to play a key role in the synthesis of nanomaterials.
Due to its isolation and the measurement of its unique properties, graphene has been the centre of interest for the entire community of scientists studying the properties of carbon [11]. Because high quality sheets of graphene are often prepared by chemical vapour deposition (CVD), which requires expensive equipment, graphene oxide as a solution possesses an alternative for the preparation of graphene-like materials. Indeed, graphene oxide can be reduced in solution into a thin film using a variety of reducing conditions where the reduction converts the graphene oxide into a material that has an enhanced electrical conductivity. Graphene is usually prepared by the reduction of its precursor graphite oxide [12], a typical pseudo-two-dimensional oxygen-containing solid in bulk form, possessing functional groups including hydroxyls, epoxides, and carboxyls [13]. The literature suggests that graphene oxide sheets have very high mechanical properties with good biocompatibility and have potential application in the biomaterial field [14]. The chemical groups of graphene oxide have been found to be a feasible and effective means of improving the dispersion of graphene. In addition, functional side groups bound to the surface of graphene oxide are there to improve the interfacial interaction between graphene oxide and the matrix, similarly to that observed for functionalised carbon nanotube-based nanocomposites [15]. Therefore, by combining the remarkable mechanical properties of graphene oxide sheets with green synthesised nanoparticles, they offer promising nanoscale fillers for the next generation of nanocomposite materials [16].
The synthesis and characterisation of different types of nanoparticles has dramatically advanced over the past 20 years, particularly regarding the incorporation of metal nanoparticles with active carbon atoms. The catalytic and optical properties of silver nanoparticles are useful for a range of applications, such as catalysis, information storage, photonics, biological and chemical sensing and also surface enhancement Raman scattering [17]. By synthesising and characterising metal nanoparticles with carbon-active material into single entities, the catalytic performance of the material can be enhanced and the surface plasmon absorption of the composite (GO|Ag-NPs) can be varied continuously [18]. As such, many monometallic nanoparticles such as platinum (Pt), gold (Au), silver (Ag) and palladium (Pd) have been successfully attached to graphene where graphene-supported bimetallic catalysts have been produced, such as Au-Pt alloys attached to graphene [19]. Despite these advancements, only a few examples of the use of these graphene-based nanocomposites can be found in the literature illustrating their application in the development of electrochemical sensors. This study presents the novel green synthesis of silver nanoparticle-modified graphene sheets for the development of Cytochrome P450-2D6-based electrochemical nanobiosensors for the detection of the tuberculosis treatment drugs ethambutol and pyrazinamide [20].

2. Materials and Methods

2.1. Reagents and Materials

Most of the chemicals used in this study were of analytical grade and were purchased from Sigma Aldrich, Kempton Park, Johannesburg, South Africa. This includes human plasma, human cytochrome P450-2D6, graphite powder, sulfuric acid 99.99% (H2SO4), potassium permanganate 99% (KMnO4), hydrogen peroxide (H2O2), hydrochloric acid (HCl), sodium borohydride (NaBH4) and silver nitrate 99.8% (AgNO3). The reaction medium, pH 7.4, 0.1 M phosphate buffer (PBS), was prepared from sodium phosphate dibasic dihydrate (Na2HPO4·2H2O) (≥99.5%) and sodium phosphate monobasic dihydrate (NaH2PO4·2H2O) (≥99%) purchased from Sigma Aldrich, Kempton Park, Johannesburg, South Africa and was used as an electrolyte throughout this study. Additionally, fresh pear fruits were purchased from Checkers Hypermarket, Cape Town, South Africa. De-ionised ultra-purified water used throughout these experiments was prepared with a Milli-Q water purification system from Merck KGaA, Darmstadt, Germany. The prepared electrolyte solutions were kept refrigerated at 4 °C when not in use.
The optical and structural properties of the synthesised nanocomposites were studied by Fourier Transform Infrared Spectroscopy (FTIR) (performed with a PerkinElmer Spectrum 100-FT-IR Spectrometer from PerkinElmer (Pty) Ltd., Midrand, South Africa), Ultraviolet-Visible (UV-Vis) Spectroscopy (performed with a Nicolett Evolution 100 from Thermo Electron Corporation, Johannesburg, South Africa) and Cyclic Voltammetry (CV) (performed with PalmSens 3 Potentiostat from PalmSens BV, Houten, The Netherlands). High Resolution Transmission Electron Microscopic (HR-TEM) analyses of the nanocomposites were performed with a Tecnai G2 F2O X-Twin HRTEM purchased from FEI Company, Hillsboro, OR, USA; while High Resolution Scanning Electron Microscopic (HR-SEM) analyses were studied with a Zeiss Auriga HR-SEM purchased from Carl Zeiss Microscopy GmbH, Jena, Germany. Raman Spectroscopic studies were carried out with a HORIBA XploRA PLUS Raman Spectrometer-Confocal Raman Microscope manufactured by HORIBA France SAS, Longjumeau, France.

2.2. Synthesis of Graphene|Silver Nanoparticle (GO|Ag-NPs) Nanocomposites

Silver nanoparticles (Ag-NPs) were prepared using a green synthesis method catalysed by the use of pear juice extract. The pears were finely cut into small pieces and washed thoroughly with de-ionised water. One hundred grams of the cut pears were placed into 200 mL of deionised water and heated for 2 h at 80 °C. The extract was then filtered, and the filtrate was later used as the reducing agent for the synthesis of Ag-NPs. A brown red colour was observed, which confirmed the synthesis of Ag-NPs. Furthermore, graphene oxide was synthesised using a modified Hummer’s method [21] as follows; 50 mL of sulfuric acid was added onto 2 g of graphite powder and stirred at room temperature for 30 min. The solution was then placed into an ice bath, where 7 g of potassium permanganate was added gradually under constant stirring for 30 min. The solution was then allowed to reach room temperature prior to being placed into a water bath set at 35 °C and left to stir for 2 h. The solution was then placed into an ice bath for half an hour where 150 mL of distilled water was added prior to the addition of approximately 5 mL hydrogen peroxide until effervescence ceased. The solution was left to stir overnight at room temperature, after which it was filtered, followed by 3 successful acid washes, followed by washing briefly with distilled water. The resulting product was dried for 48 h in a vacuum oven. The prepared graphite oxide (10 mg) was then exfoliated in 10 mL of acetate buffer (pH 4.6) by ultra-sonication for 1 h to give a graphene oxide (GO) solution which was dried in the oven for 48 h to get powdered GO. The nanocomposite of GO|Ag-NPs was prepared by mixing 10 mL of 0.1 M aqueous solution AgNO3 with the GO powder and stirred for 30 min at room temperature. This was then followed by the slow addition of 20 mL of the pear extract to serve as the reducing agent followed by vigorous stirring. A colour change of dark brown from grey occurred and the reaction mixture was further stirred at room temperature for another 5 h for the complete synthesis of the nanocomposite.

2.3. Fabrication of GO|Ag-NPs|CYP2D6||GCE Nanobiosensors

In this process, 0.1 M phosphate buffer with pH 7.4 was used for the preparation of CYP2D6 enzyme stock solutions and stored at −70 °C when not in use. Five microlitres of 10 μg μL−1 enzyme was drop coated onto a freshly prepared GO|Ag-NPs glassy carbon electrode (GCE). The enzyme-modified electrode was then covered with a tight-fitting lid for about 30 s to form a uniform layer of GO|Ag-NPs|CYP2D6||GCE and stored refrigerated at 4 °C for 24 h. The modified electrodes were used to detect various concentrations of EMB (100–1600 μM) and PZA (100–600 μM) prepared in human plasma using cyclic voltammetry (CV). The experimental parameters were set at a potential window of −1 to +1 V, a potential step of 0.005 V and at the scan rate of 50 mV/s at different concentrations of each drug.

3. Results and Discussion

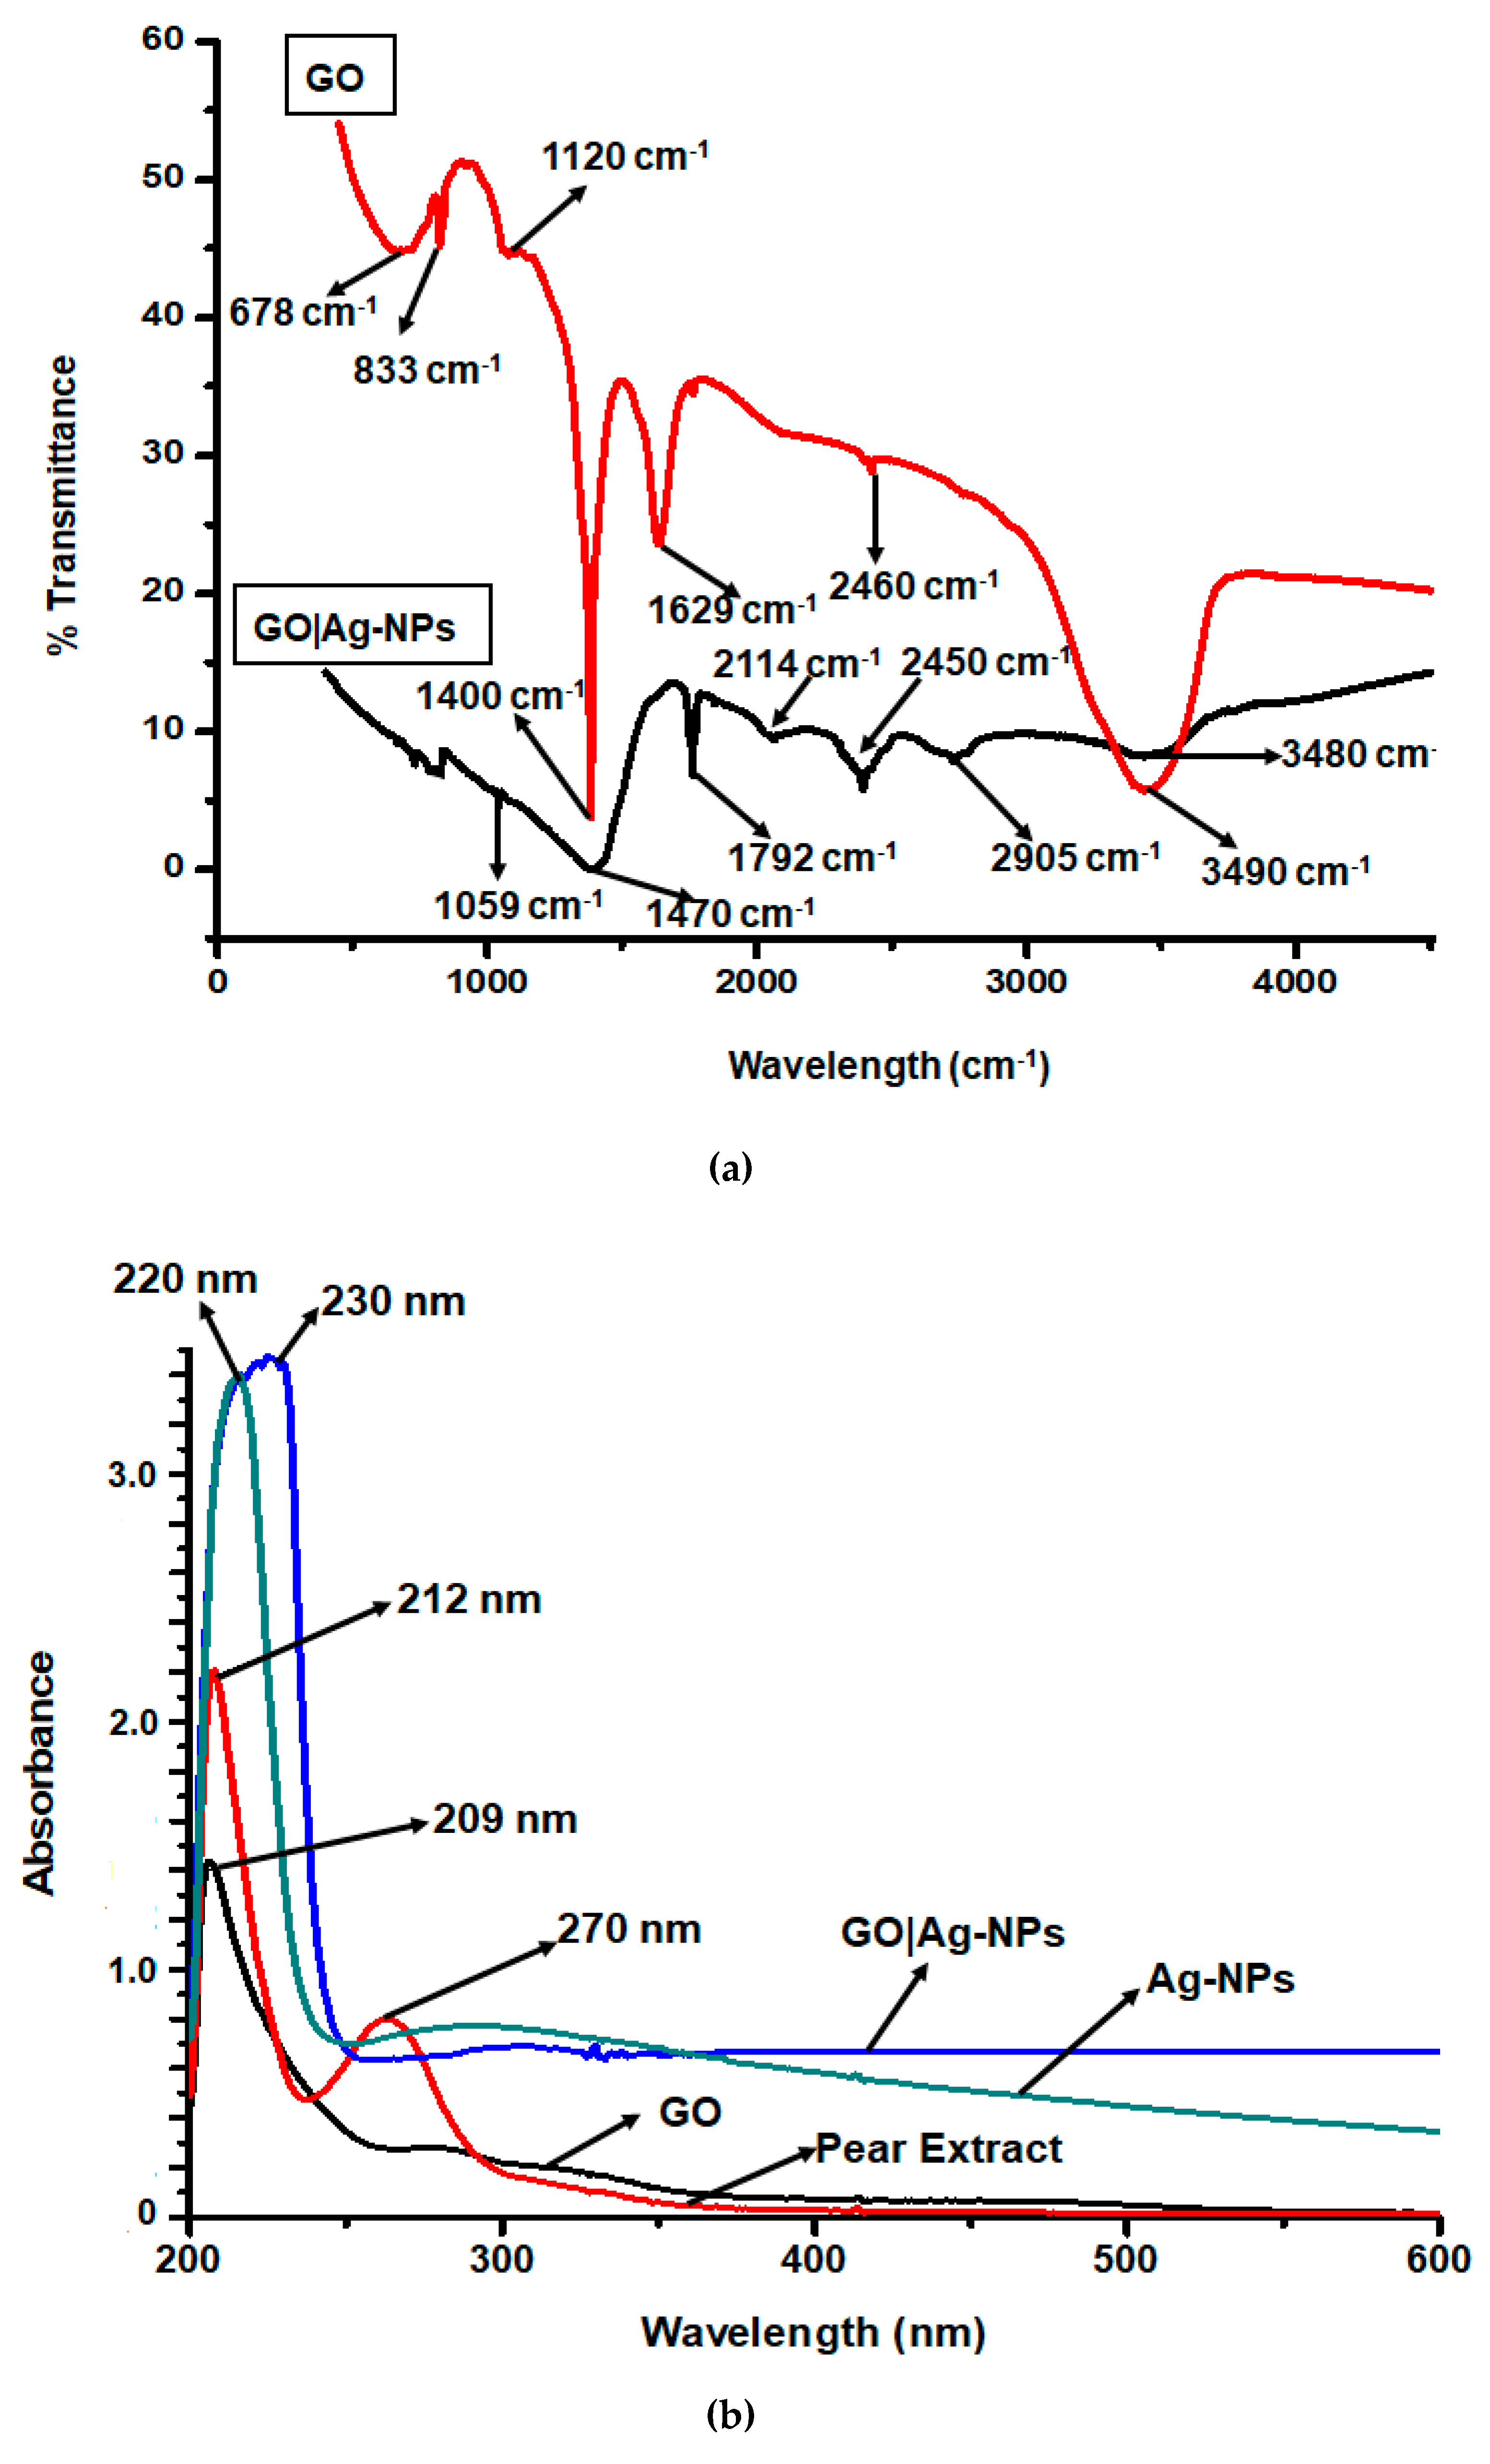
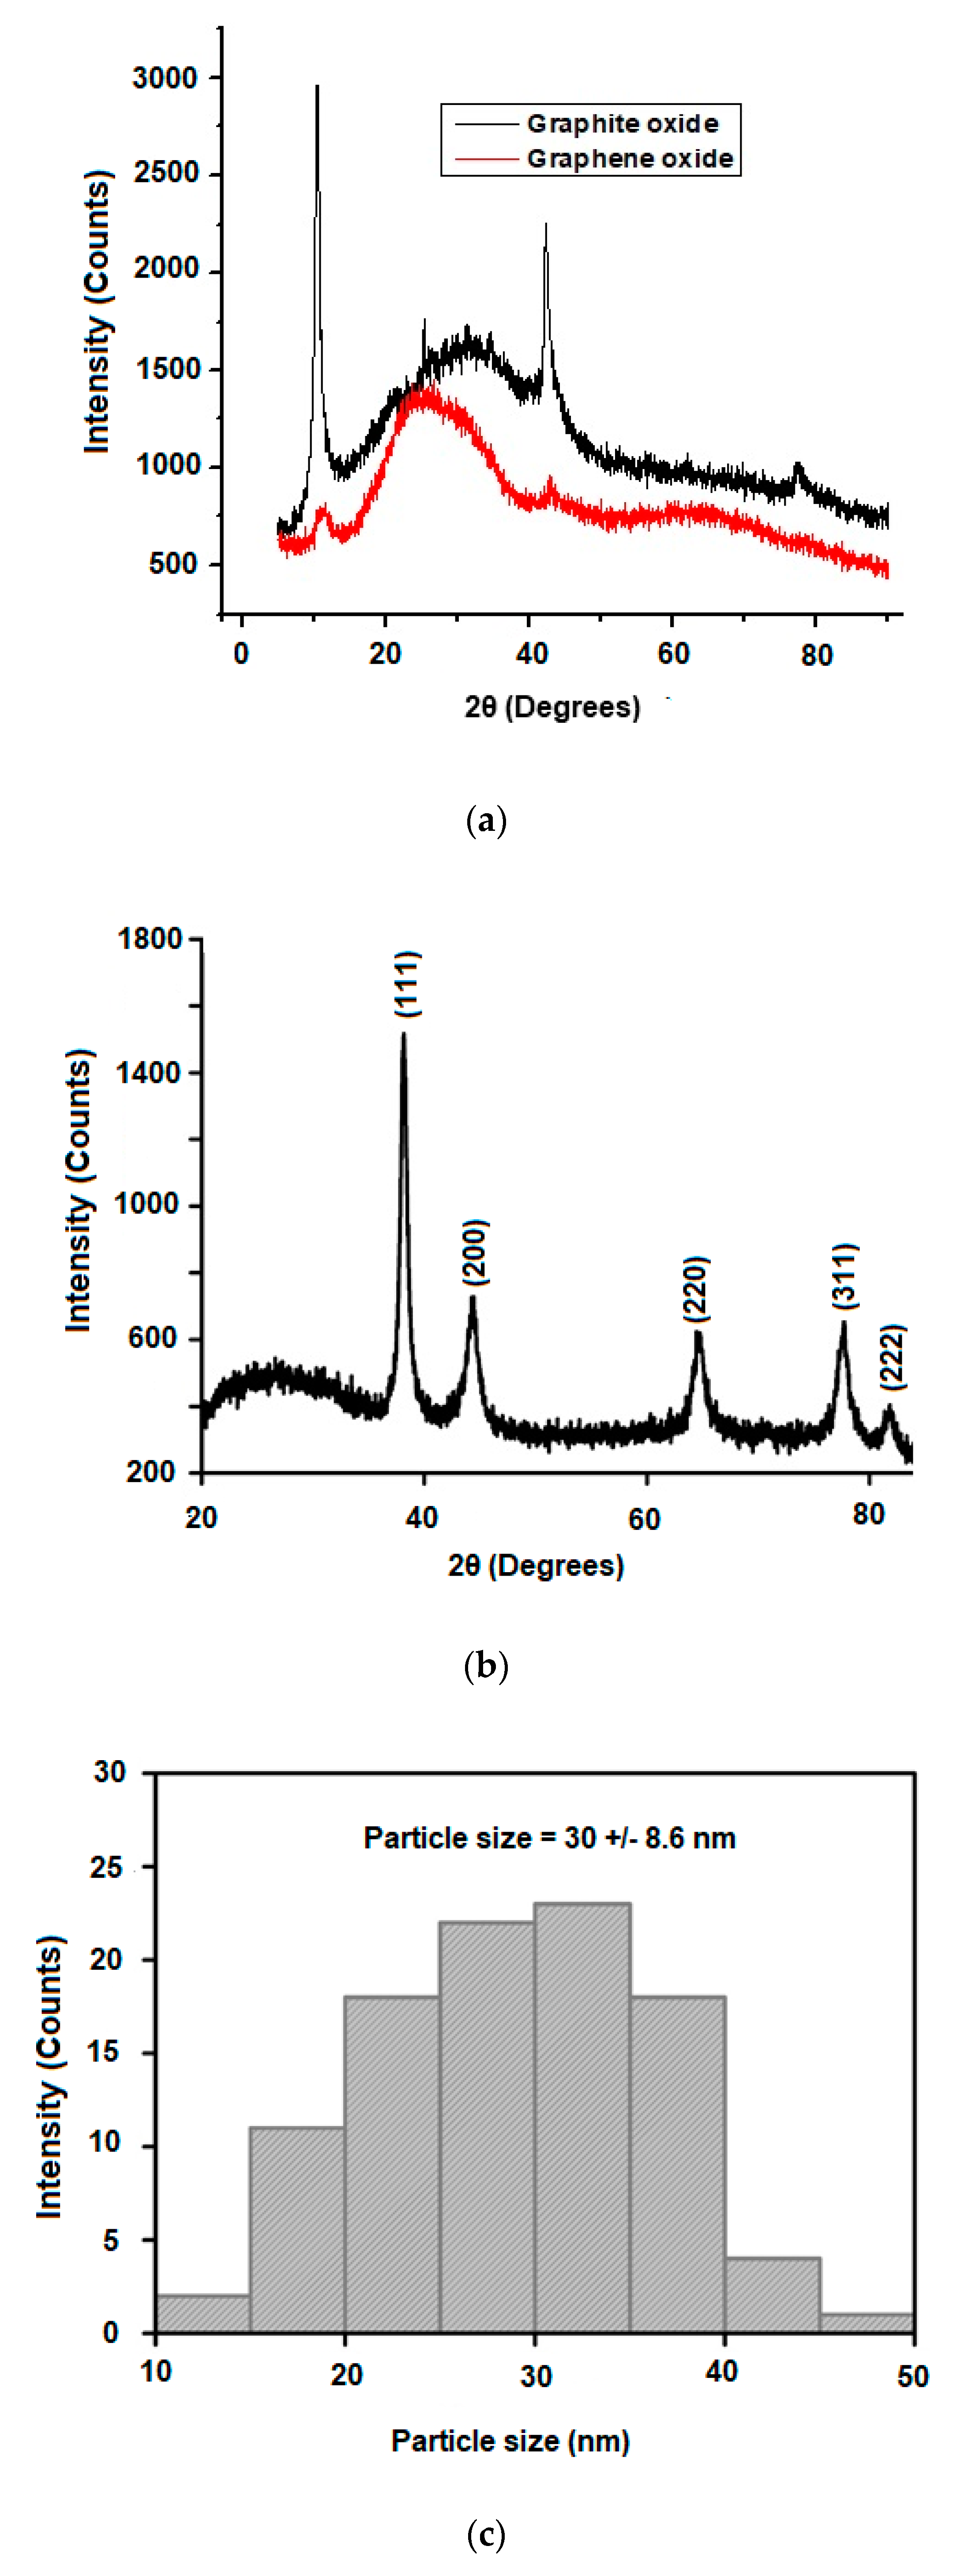
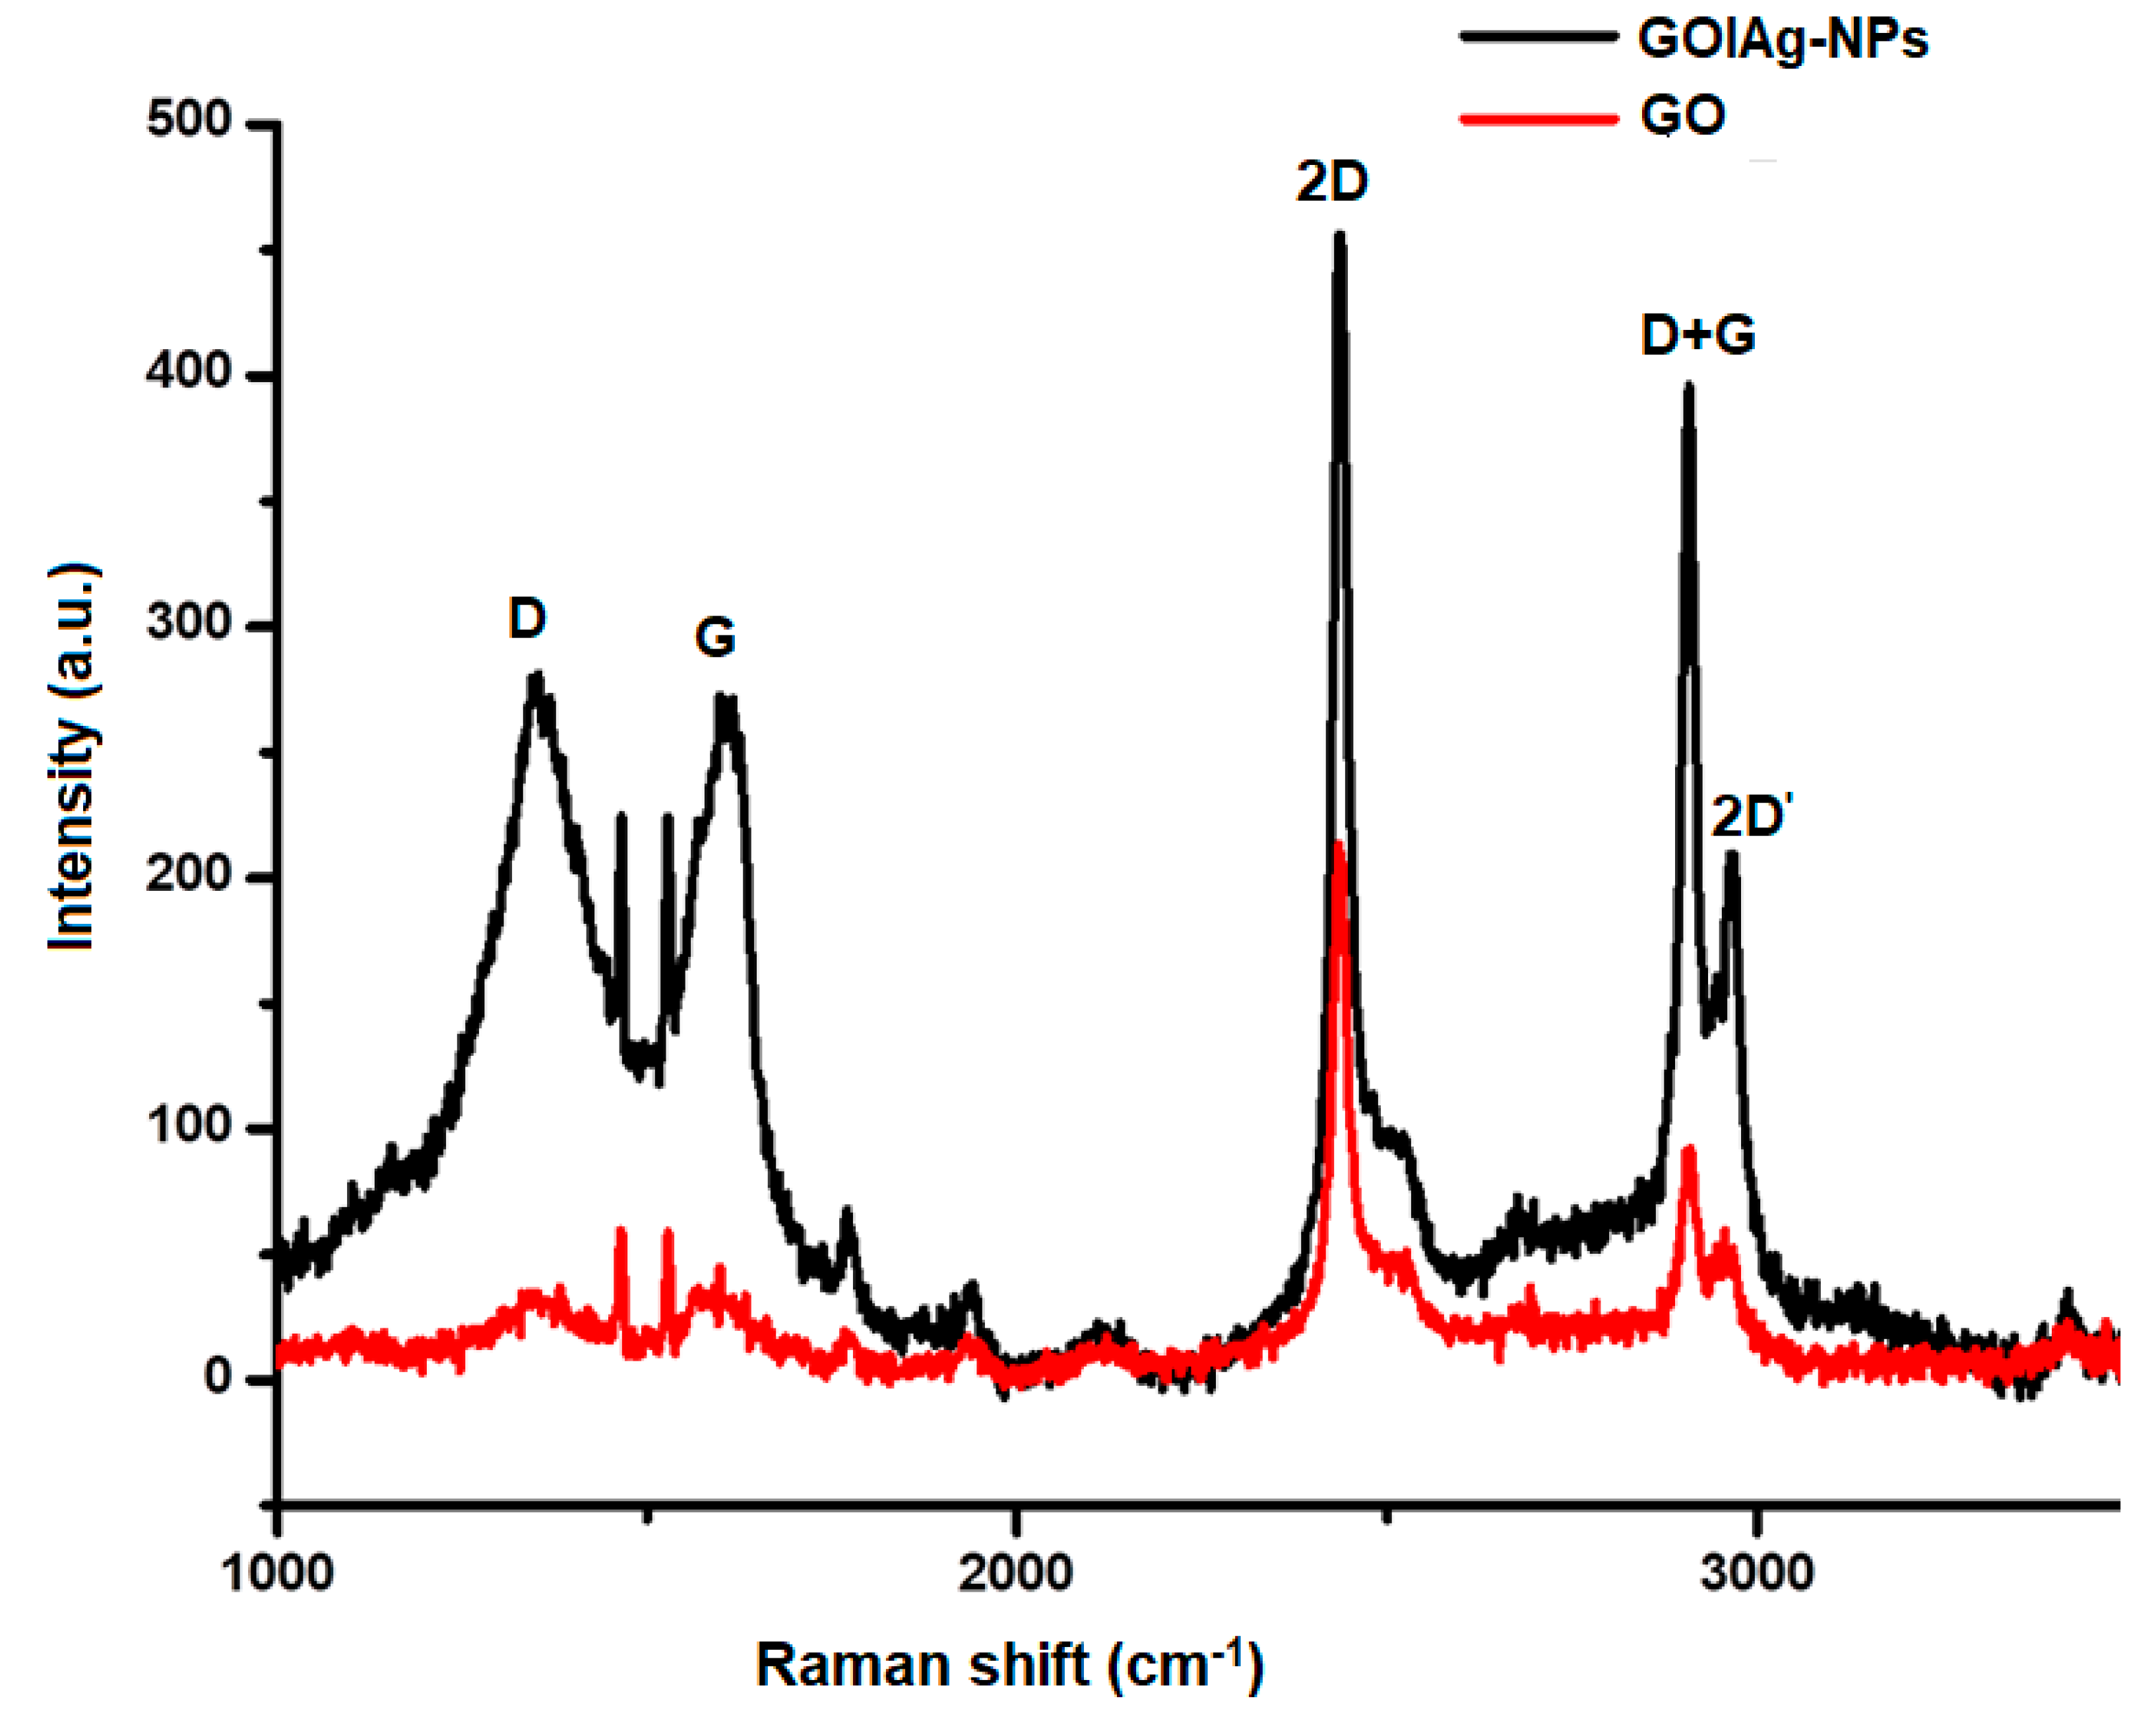
3.1. Optical and Structural Properties of GO|Ag-NPs Nanocomposites

Fourier Transform Infrared Spectroscopy (FTIR) was used to verify the structure of GO nanocomposites, as illustrated in Figure 1a. The spectrum shows dominant absorption bands at 1400, 1629 and 3490 cm−1, slightly shifted compared to some reported studies. The band centred at 1400 cm−1 results from the C–N stretching vibration of graphite-silver nitrate being reduced to GO|AgNPs nanocomposites [21]. The band at 3490 cm−1 corresponds to hydroxy (O-H) groups of water molecules found during the oxidation of GO and the transition band at approximately 1629 cm−1 is attributed to C=O bonds in carboxylic acids found at the edge of the graphene sheets [22]. Furthermore, the bands at 833 and 678 cm−1 correspond to C-O-C bonds of epoxy or alkoxy groups. Additionally, the data received for GO|Ag-NPs nanocomposites revealed an adsorption band for hydroxy (–OH) groups at 3480 cm−1 caused by stretching vibration of water molecules. The spectrum shows a significant decrease in the intensity of this stretching frequency resultant from the interaction of GO with the pear extract that produced C=O groups on the surface. Similarly, in a study involving the synthesis of GO|Ag-NPs nanocomposites using Tilia amurenis, the absorption band was observed at 3434 cm−1 [23,24]. Additionally, in another study which used glucose as the reducing agent for the synthesis of GO|Ag-NPs nanocomposites, this reduced intensity was also observed, coupled to a slight shift in the value of the absorption band, a common observation caused by the varying properties of the used organic materials [25]. The absorption band at 2450 cm−1 results from anti-symmetric and symmetric stretching vibration of =CH2, while the band at 1792 cm−1 is attributed to the presence of carboxyl C=O groups from carboxylic acid and carbonyl groups at the edge of graphene oxide [26]. The new band at 2114 cm−1 is ascribed to sp. hybridised C.
These findings were also observed in a study by Chettri et al. [27], in which GO|Ag-NPs nanocomposites were synthesised using Psidium guajava. The band at 1470 cm−1 is related to the presence of flavanoids contributed by the pear extract, while the alkoxy C–O groups are recognised by the band at 1059 cm−1 [28]. A study by Oliveira et al. [29] involving the FTIR analysis and quantification of phenols and flavonoids also confirmed these findings. The undefined peak at approximately at 830 cm−1 corresponds to C-Cl stretching in the alkyl groups due to the presence of Ag-NPs in the nanocomposite [30]. The stretching frequency at 1059 cm−1 corresponds to C–OH bonds attributed to the presence of polyphenols in the pear extract. Generally, the GO|Ag-NPs nanocomposite spectrum showed a significant decrease in the intensity of the stretching frequency of the oxygenated functional groups resultant from the presence of the nanoparticles. These results clearly reveal that GO was successfully exfoliated and reduced and that strong interactions existed between Ag-NPs and the remaining surface hydroxyl groups [31].
Furthermore, the GO|Ag-NPs nanocomposites were analysed using Ultraviolet Visible Spectroscopy (UV-Vis), as illustrated in Figure 1b. The GO|Ag-NPs spectrum showed an absorption band at 230 nm displaying characteristics contributed by the surface plasmon resonance (SPR) absorption features of Ag-NPs; as also indicated in the Ag-NPs spectrum illustrated at 220 nm [30]. Similar findings were also observed in a study by Lin-jun et al. [32], where a similar nanocomposite was synthesised through a reduction process using a facile one pot process. The shoulder at approximately 300 nm is attributed to electronic π-π transitions of C-C aromatics [33] and the pear extract spectrum indicates an absorption band at 270 nm characteristic of polyphenols and flavonoids [34,35]. The location and the shape of the GO|Ag-NPs absorption band is related to the particle size and distribution where, in this study, the low SPR band is attributed to the fact that small nanocomposites were developed as indicated below.

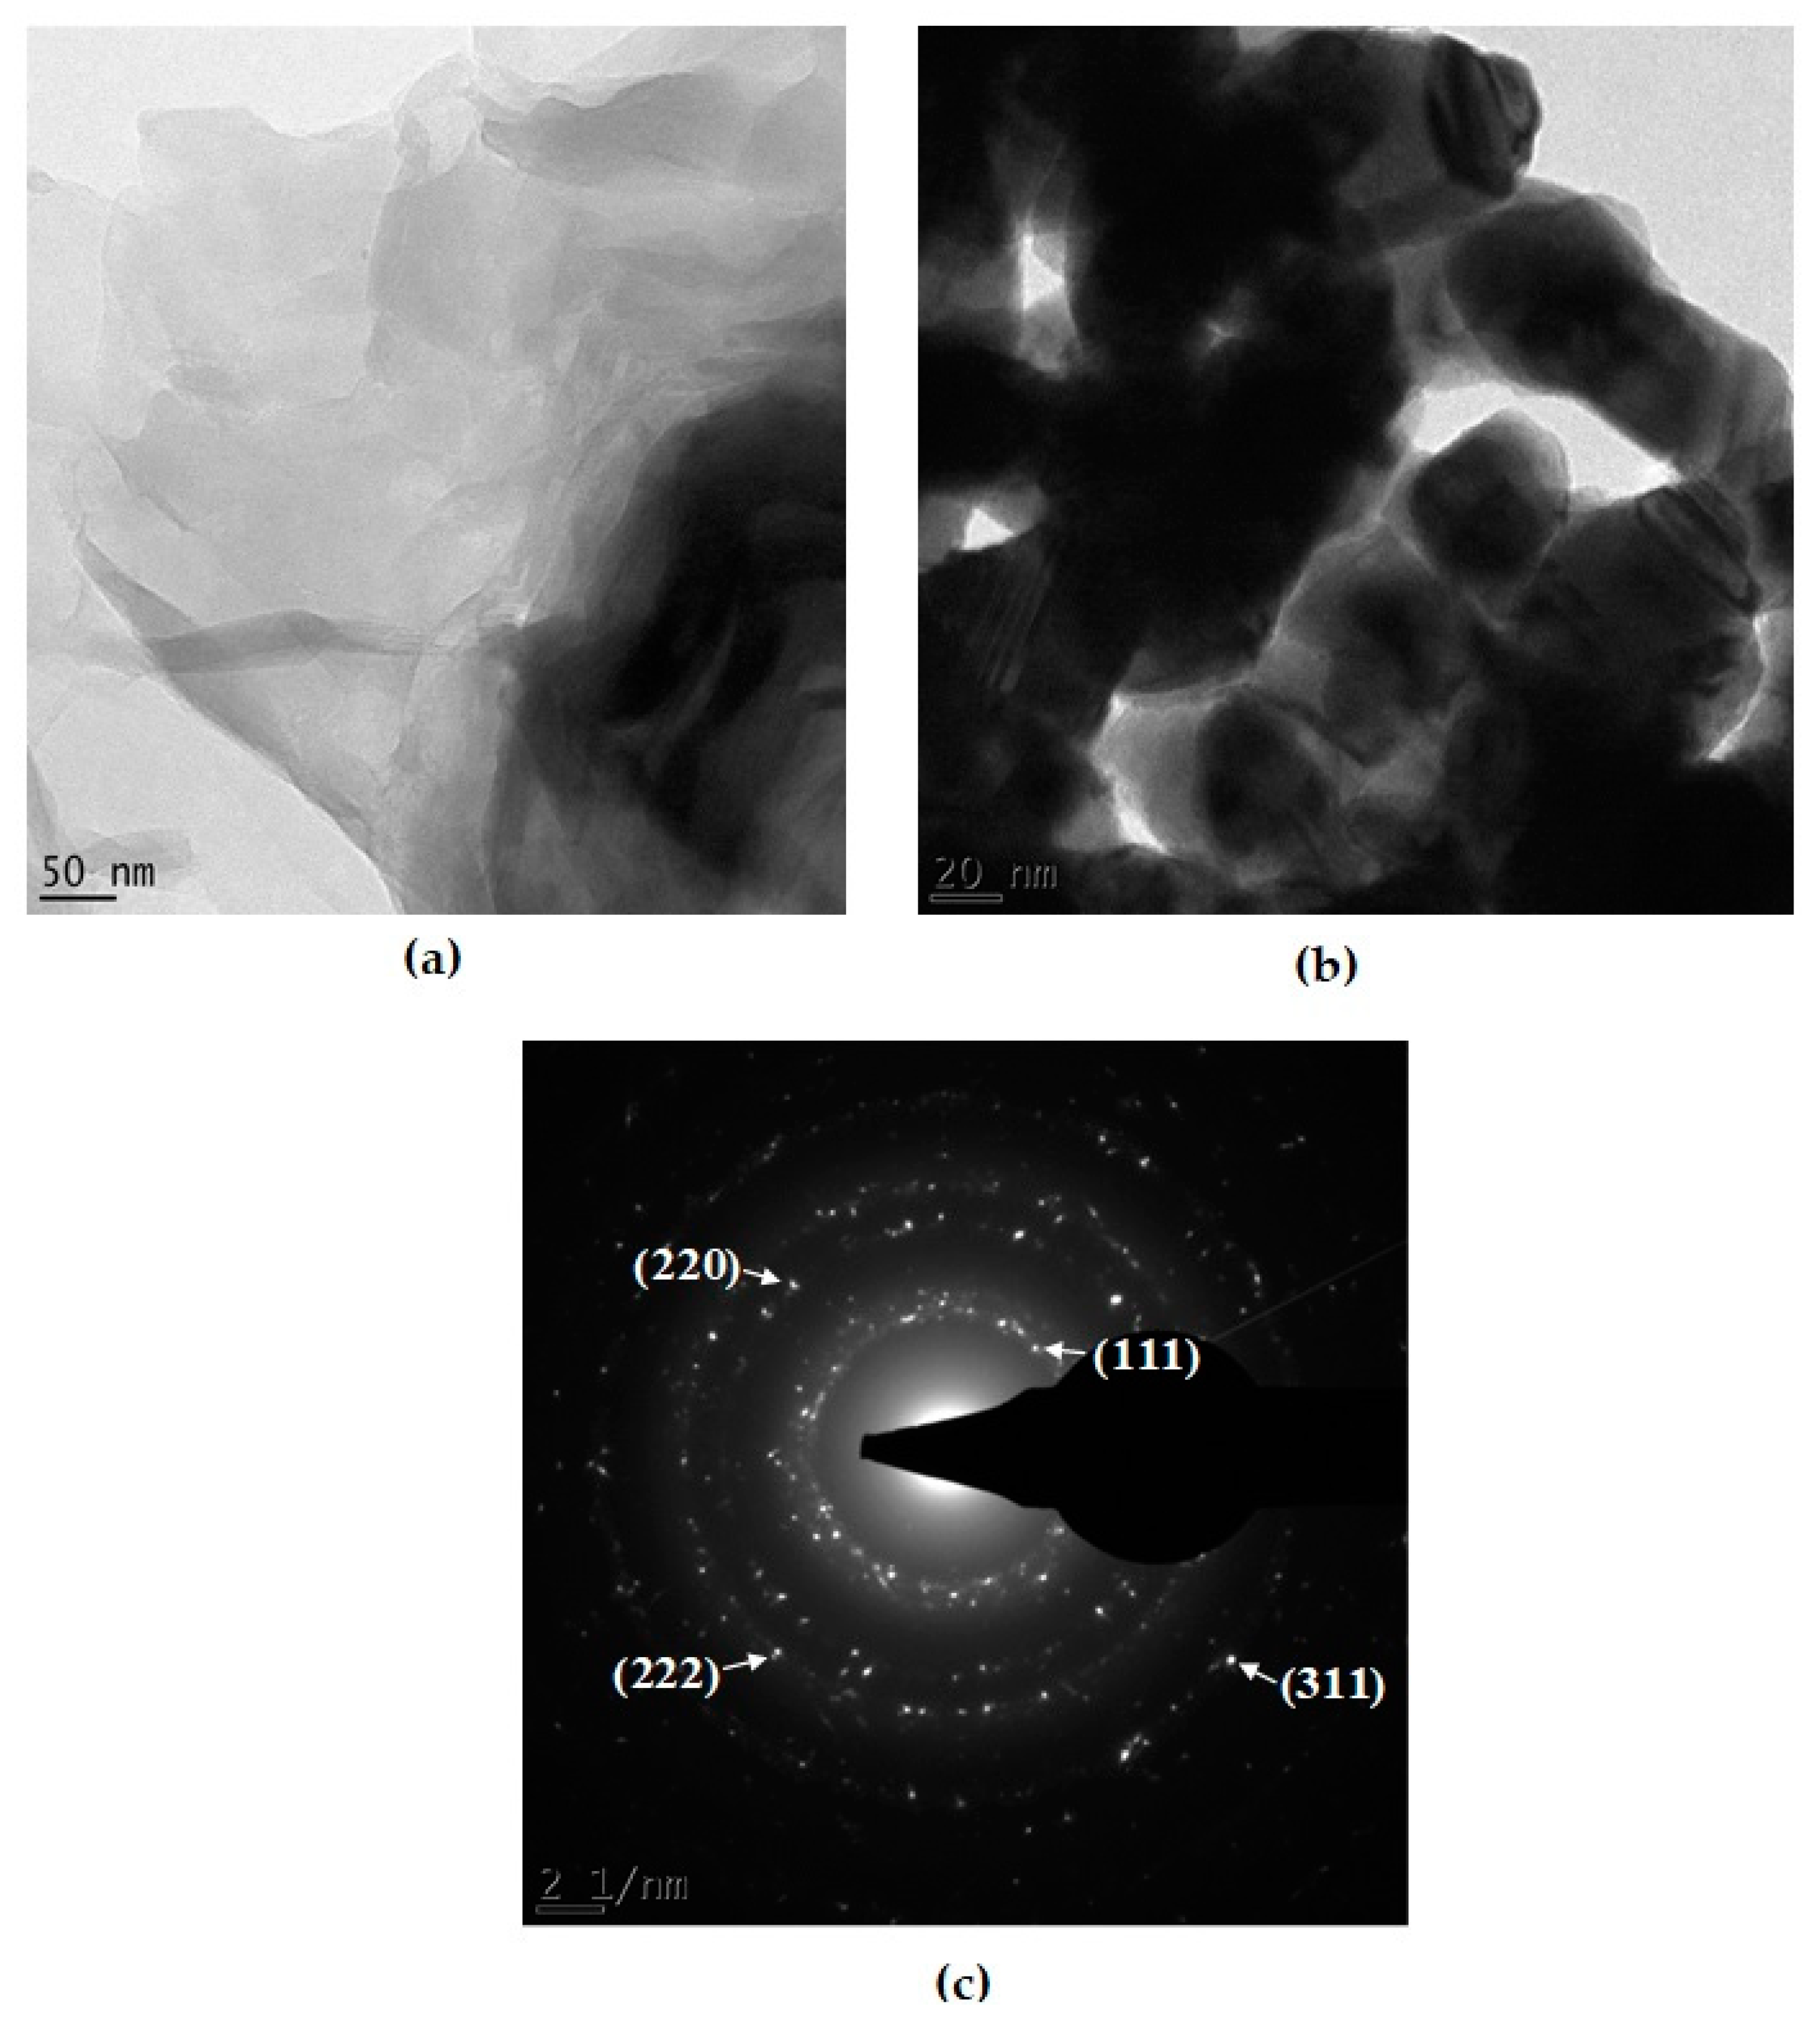
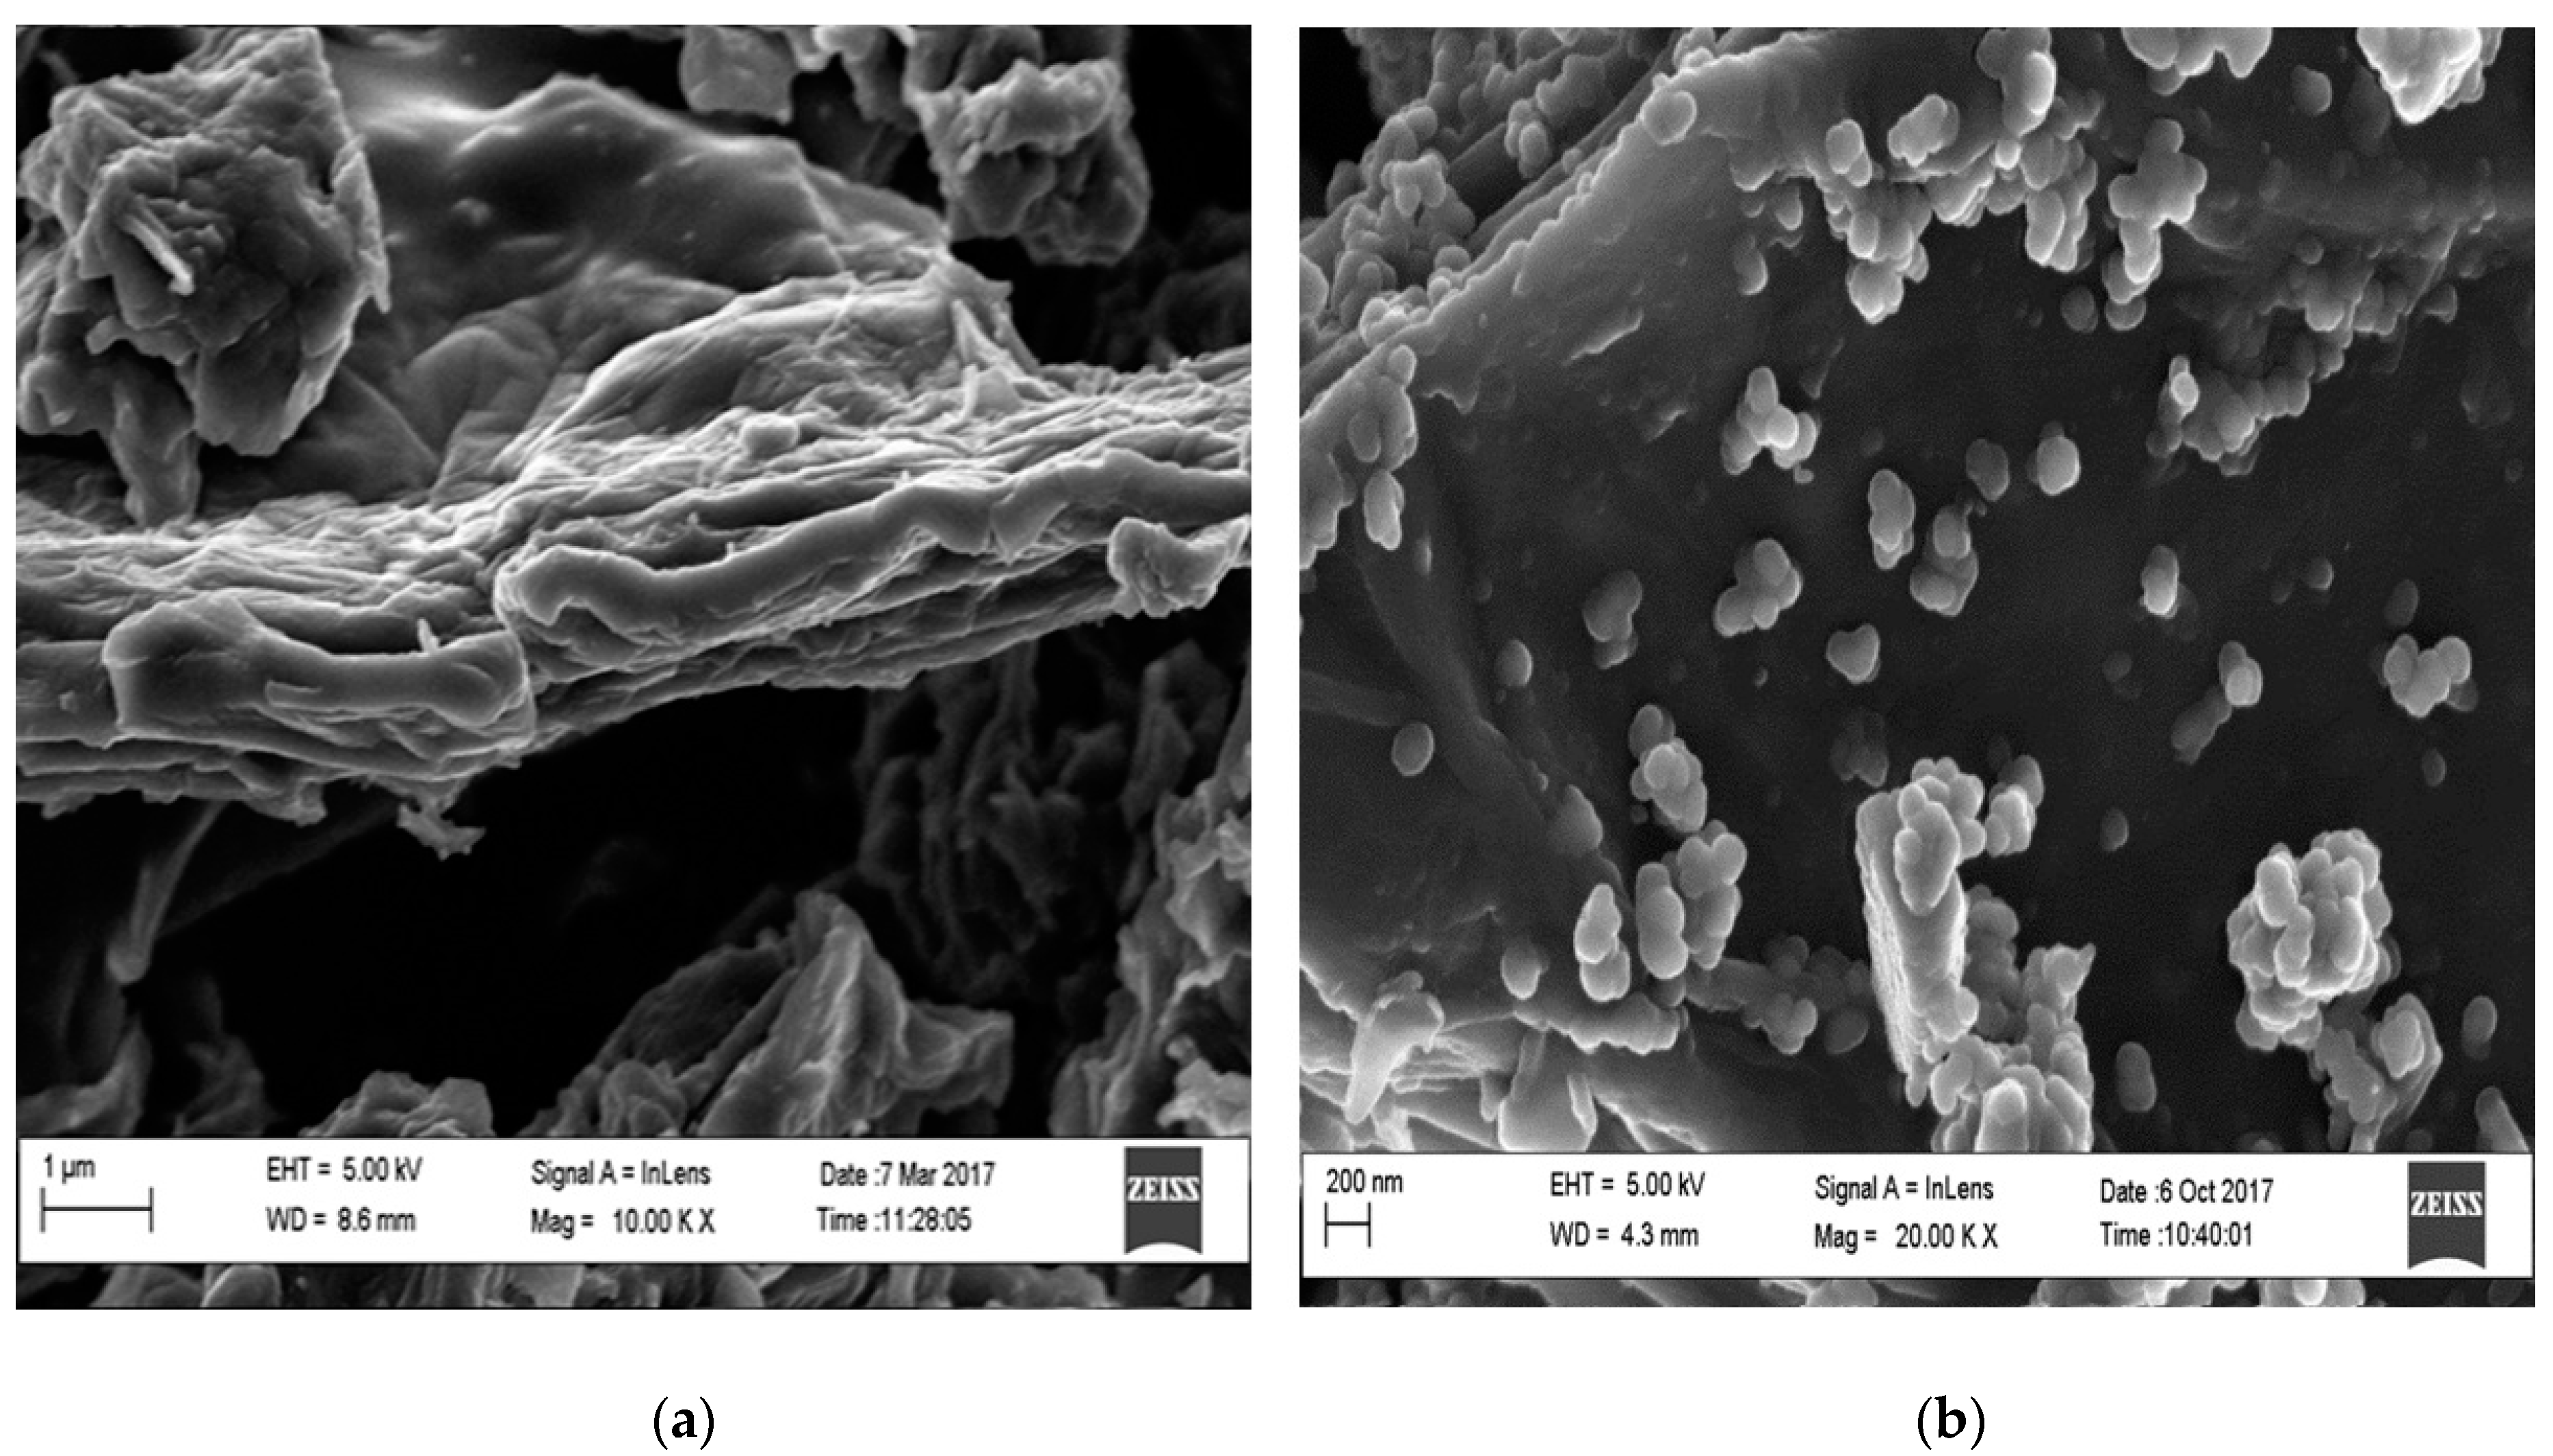
3.2. Morphological Properties of GO|Ag-NPs Nanocomposites

High-resolution transmission electron microscopy (HR-TEM) analyses were carried out to observe and to determine the morphology and the crystalline nature of the GO|Ag-NPs nanocomposites. Figure 2a shows the HR-TEM image of GO observed here as transparent sheets with folded edges. Figure 2b illustrates the nanocomposites in which the nanoparticles are seen attached on the GO sheets and the GO sheets are seen to congregate together to form multi-layered transparent sheets. The obtained selected area diffraction (SAED) pattern indicated in Figure 2c confirmed the crystalline nature of silver nanoparticles and showed bright circular rings corresponding to the (111), (220), (311) and (222) planes, an indication of the crystallinity of the nanoparticles [30]. A study by Surumaran et al. [36] indicated that the visible clear inner ring in the SAED microgram is an indication of the (002) crystal plane of graphene adorned with Ag-NPs, which confirms the formation of the GO|Ag-NPs nanocomposite.
The results obtained from the X-ray diffraction (XRD) patterns (Figure 3a) are in good agreement with the SAED observations and confirm the crystalline structure of the nanoparticles with Bragg reflection peaks at 38.17°, 44.43°, 64.58° and 77.64°, corresponding to the (111), (200), (222) and (310) face-centred cubic Ag-NPs [37]. The majority of the nanoparticles in the GO|Ag-NPs nanocomposite were determined to be approximately 30 to 35 nm in diameter, as illustrated in Figure 3b, with some at various other diameters, a reflection of the multi crystalline nature of the nanoparticles. A study by Srirangam and Parameswara revealed similar SAED images after the synthesis of Ag-NPs using the leaf extract of Malachra capitata [38].
Furthermore, the morphology of GO and GO|Ag-NPs were further studied using HR-SEM (Figure 4a,b) illustrating the Ag-NPs on top of GO layers. The micrograph (Figure 4b) shows that some silver nanoparticles are well dispersed on the surface of the GO sheets while a few are seen to be aggregated. The presence of Ag-NPs indicated no noteworthy morphological changes towards GO shown in Figure 4b. Additionally, the Ag-NPs can be seen to be well stationed and well mounted on GO sheets and edges [39].
To verify the synthesis of Ag-NPs on GO layers, the structural characteristics of GO were further confirmed using Raman spectroscopy. Figure 5 provides a spectrum of GO|Ag-NPs compared to that for GO. Included herein are high intensity D and G bands near 1350 and 1580 cm−1 assigned to the breathing mode of the k-point phonons with A1g symmetry and the introduction of E2g phonons of carbon sp2 atoms, respectively. The elevated intensity of the D peak affirms the high curvature of the Ag-NPs’ surfaces attached on small flawed structures of GO caused by the attachment of epoxide and hydroxyl groups on the carbon basal plane [40,41,42]. These peaks also confirm the small domain nature of GO caused by the high curvature of Ag-NPs surfaces which also has the possibility of inducing significant strain on the lattice of GO. The high-intensity G band is caused by enhanced isolated double bonds and it seems to be upshifted by 20 cm−1 with respect to GO (1560 cm−1) resulting from the introduction of Ag by electron-phonon coupling. Furthermore, a 2D band is composed at approximately 2460 cm−1, D + G bands at 2703 cm−1 and a 2D band at 2980 cm−1. This 2D band results from the reduction of GO and Ag-NPs in the presence of pear extracts and serves to confirm the presence of GO layers in the prepared nanocomposites [40,41,42].

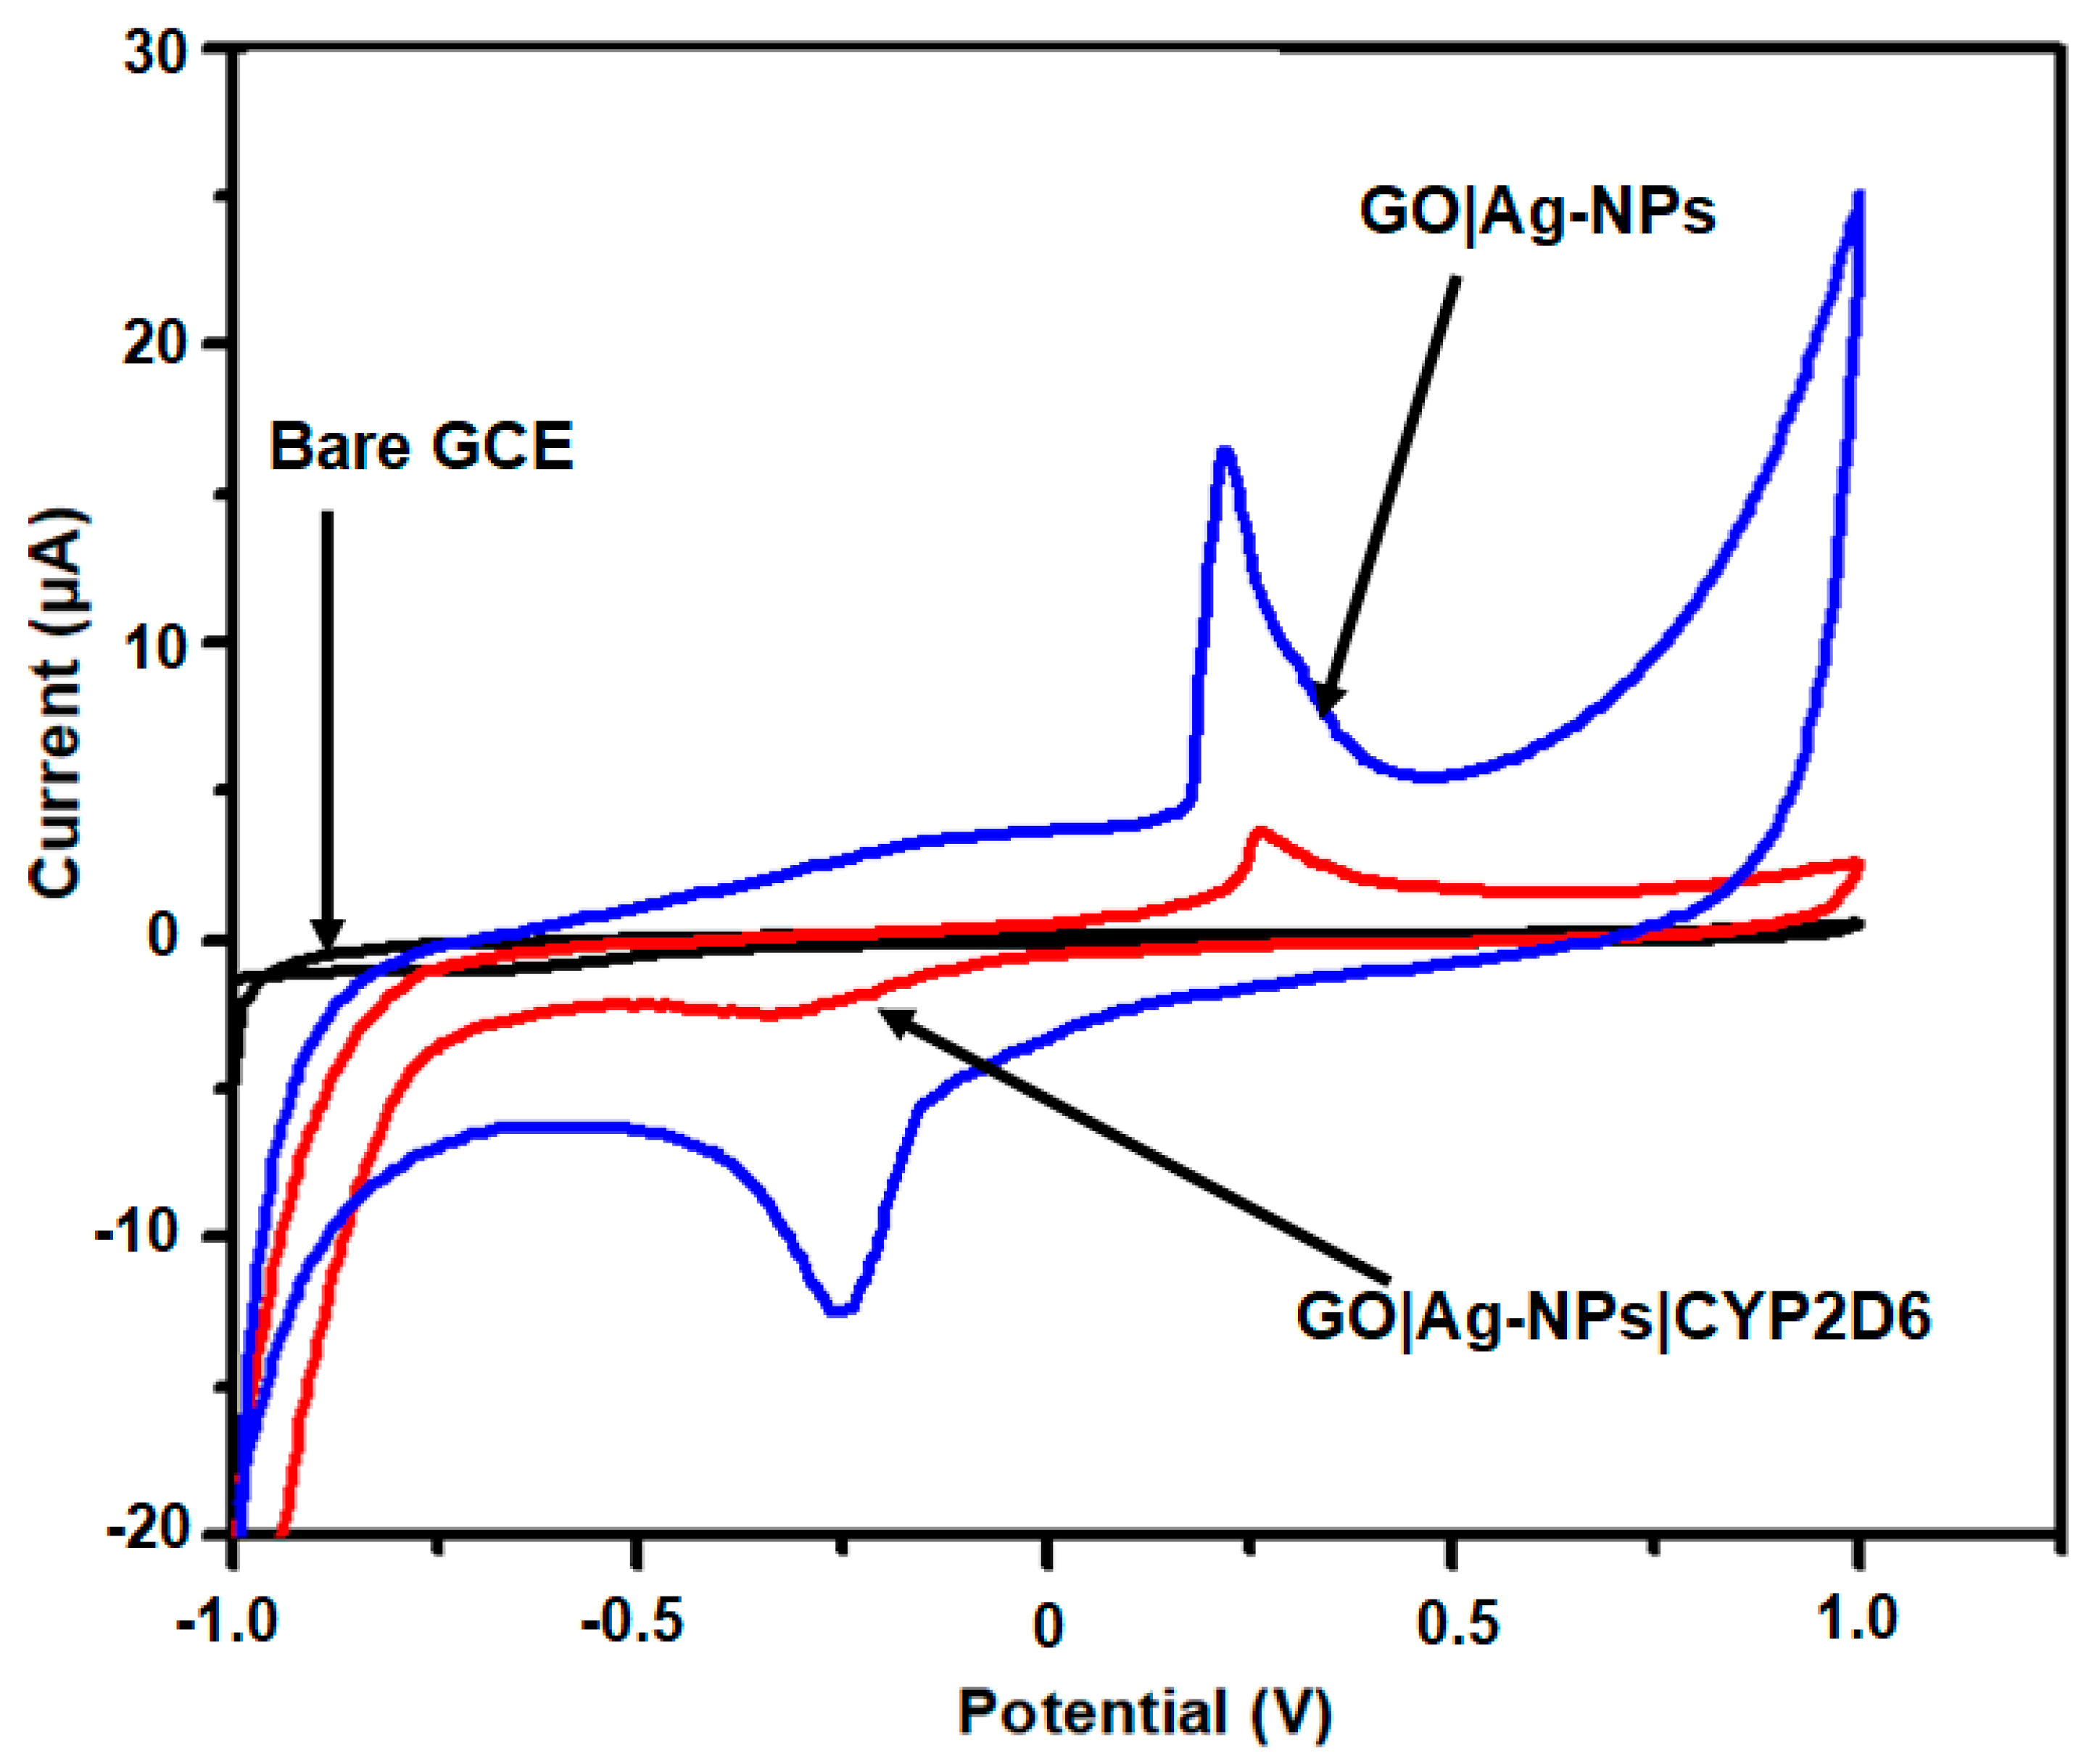
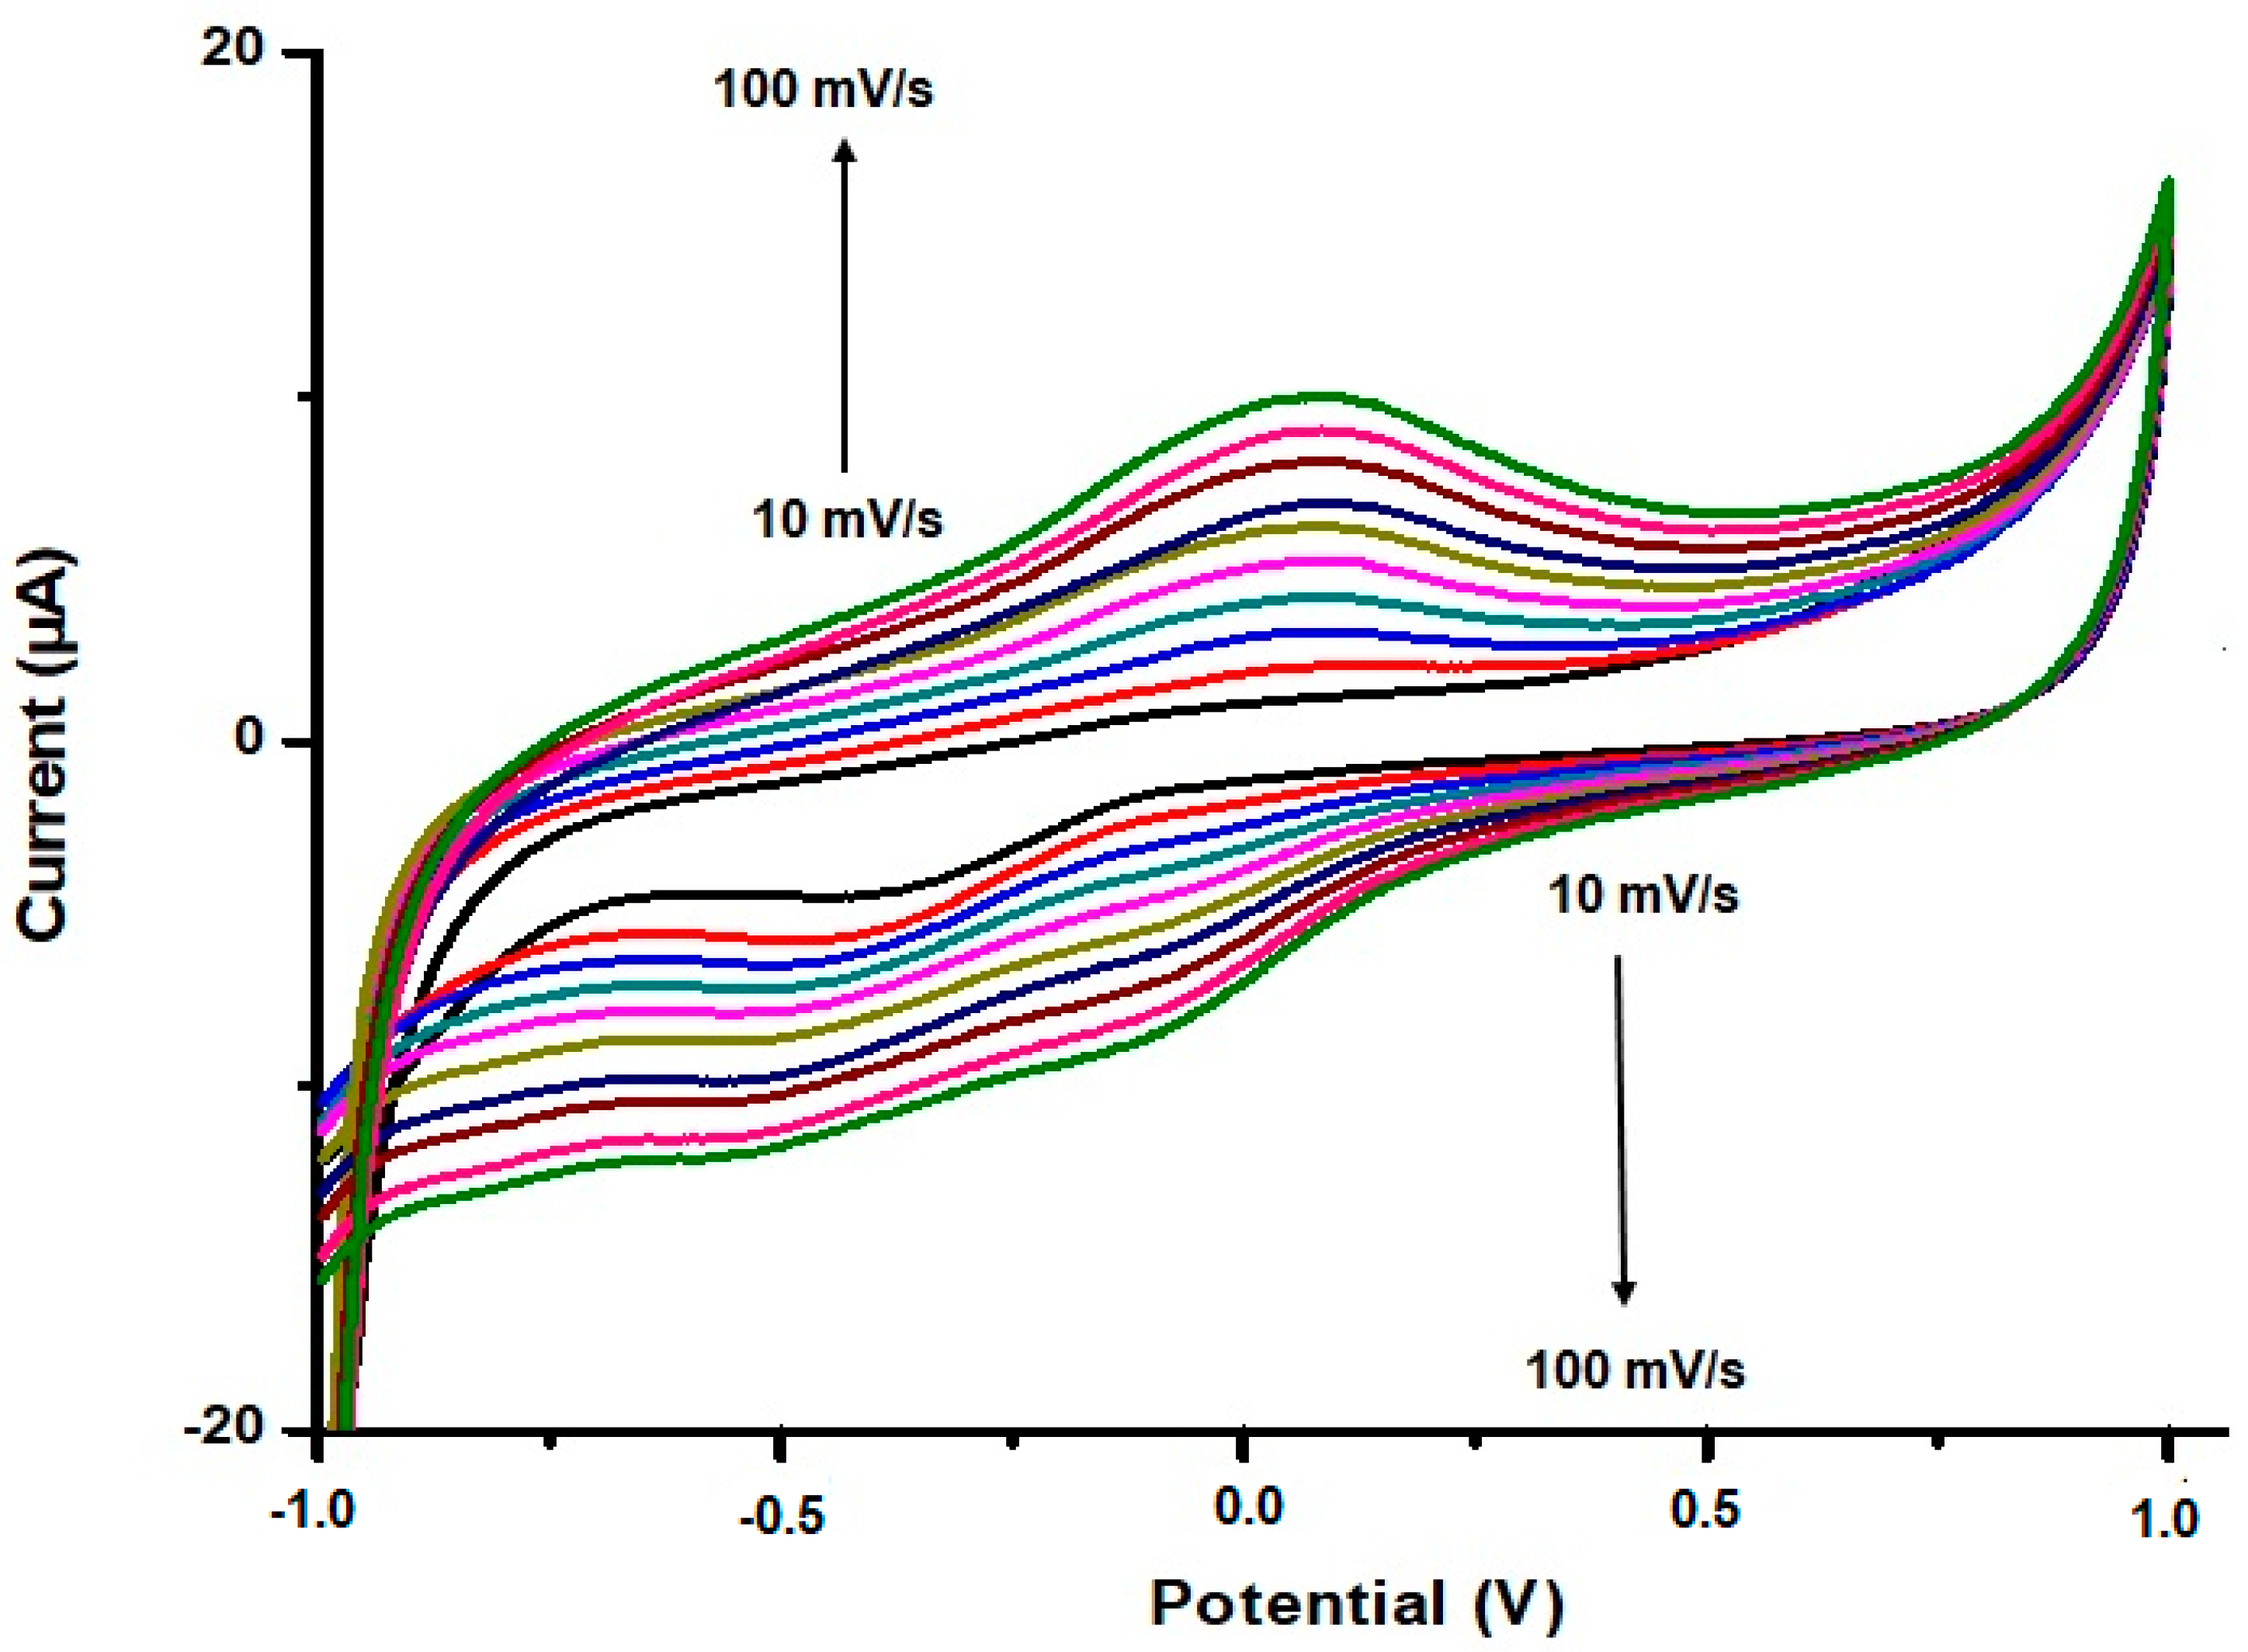
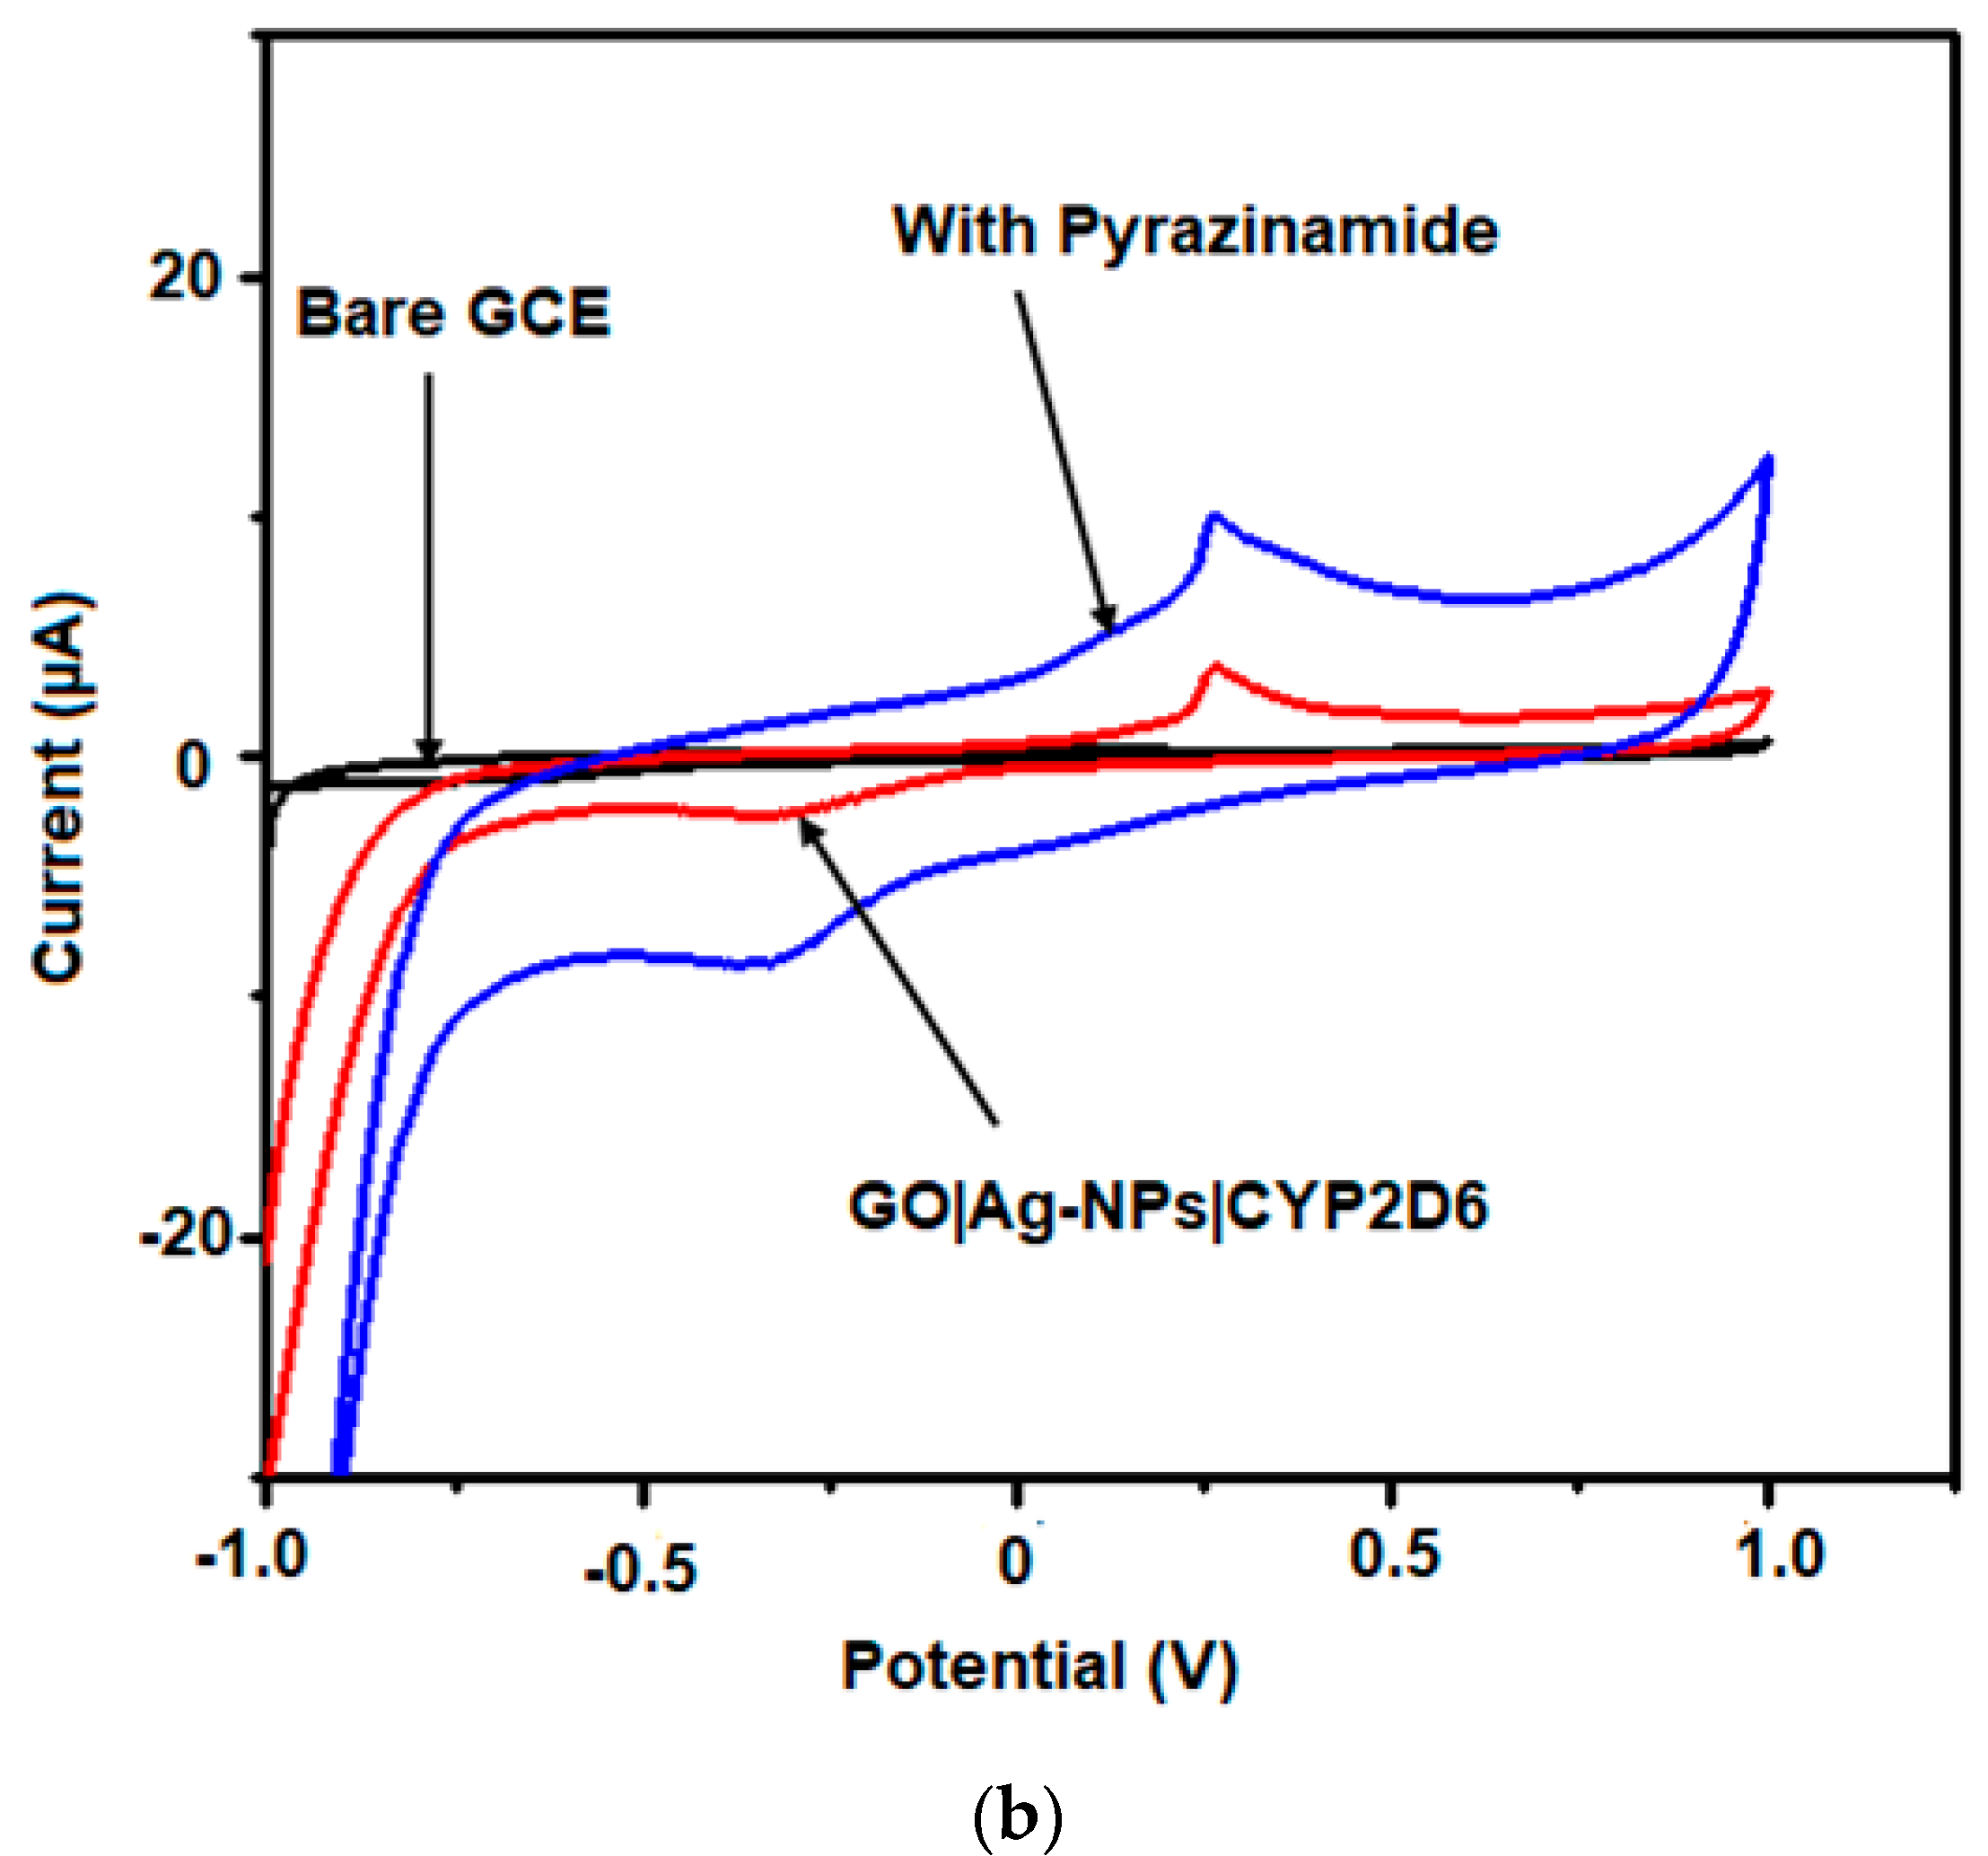
3.3. Electrochemical Studies of GO|Ag-NPs|CYT2D6||GCE Nanobiosensors

A sensitive and simple electrochemical method was proposed for the determination of pyrazinamide (PZA) and ethambutol (EMB). For the first time, CYP2D6 was immobilised onto green method GO|Ag-NPs modified glassy carbon electrodes (GO|Ag-NPs|CYT2D6||GCE) and reported for the determination of PZA and EMB using CV. Following the immobilisation of the enzyme, it was fundamental to monitor whether the enzyme was attached onto the nanocomposite or not and to ascertain whether or not the resultant nanobiosensor possessed the necessary electro-activity for the desired application. As seen in Figure 6, the immobilisation of CYP2D6 saw a reduction in the current response as opposed to the voltammogram depicting only GO|Ag-NPs. It can be seen that the enzyme only reduced the current but did not hinder the performance of the sensor platform. The redox peak observed after the immobilisation of CYP2D6 is attributed to the Fe3+/Fe2+ transition taking place at the enzyme active site while the GO|Ag-NPs transition is not fully defined [43,44]. When the modified electrode was analysed at different scan rates, the electrochemical properties of the nanobiosensor revealed the possibility of determining the surface concentration (Γ*) and the diffusion coefficient (De) value for the enzyme modified nanocomposite. The experimental conditions to ascertain these findings included attaching the GO|Ag-NPs|CYT2D6 nanocomposite onto GCE and submerging it in 0.1 M, pH7.4 phosphate buffer solution. The analysis of the GO|Ag-NPs|CYP2D6||GCE electrode was achieved using CV by accessing the peak current response upon the change in the scan rate (from 10 to 120 mV s−1), which was seen to increase after each increment in the scan rate, as illustrated in Figure 7. CV displayed that the cathodic and anodic peak currents varied linearly with the scan rate and a slight shift in potential to more positive values with increasing scan rate was observed for the developed nanobiosensor. This clearly indicates that these nanocomposites were conductive while transferring electrons between the nanobiosensor and GCE [45,46,47].
Studies on the peak current dependency on the scan rate (plot not shown) revealed a diffusion-controlled process taking place at the electrode surface [48,49]. The calculated value (7.1854 × 10⁻³ mol cm−2) for the surface concentration (Γ*) of the GO|Ag-NPs|CYP2D6||GCE nanobiosensor was determined using the Brown Anson equation (Equation (1)). From the equation, F is the Faraday constant (96,485 C mol−1), R is the gas constant (8.314 J mol−1 K−1), A is the surface area of the glassy carbon electrode (0.043 cm2), T is the operating absolute temperature of the system (298 K), n is equal to 1 and is the number of electrons transferred in this reaction, Ip is the maximum current value (0.98 µA) as depicted in Figure 7 and ν is the scan rate (V s−1) corresponding to the chosen maximum current value.
I p = n 2 F 2 Γ * A ν 4 RT
Additionally, using the same data set, the diffusion coefficient (De) for GO|Ag-NPs|CYP2D6||GCE was determined using the Randel–Sevcik Equation (Equation (2)), where a value of 4.7909 × 10⁻⁴ cm2 s−1 was determined.
I p = ( 2.69 × 10 5 ) n 3 / 2 AD e 1 / 2 C ν 1 / 2
The surface concentration value was seen to be higher than that observed prior to the attachment of the enzyme (5.2811 × 10⁻³ mol cm−2), while the value of the diffusion coefficient was seen to be less (2.3501 × 10⁻⁴ cm2 s−1) than that determined in the absence of the enzyme. These findings are attributed to the fact that upon enzyme attachment, the amount of materials on GCE increased, causing an elevated value of the surface concentration, and in doing so the electron flow was slowed down, thus the reduced diffusion coefficient value [48,49].

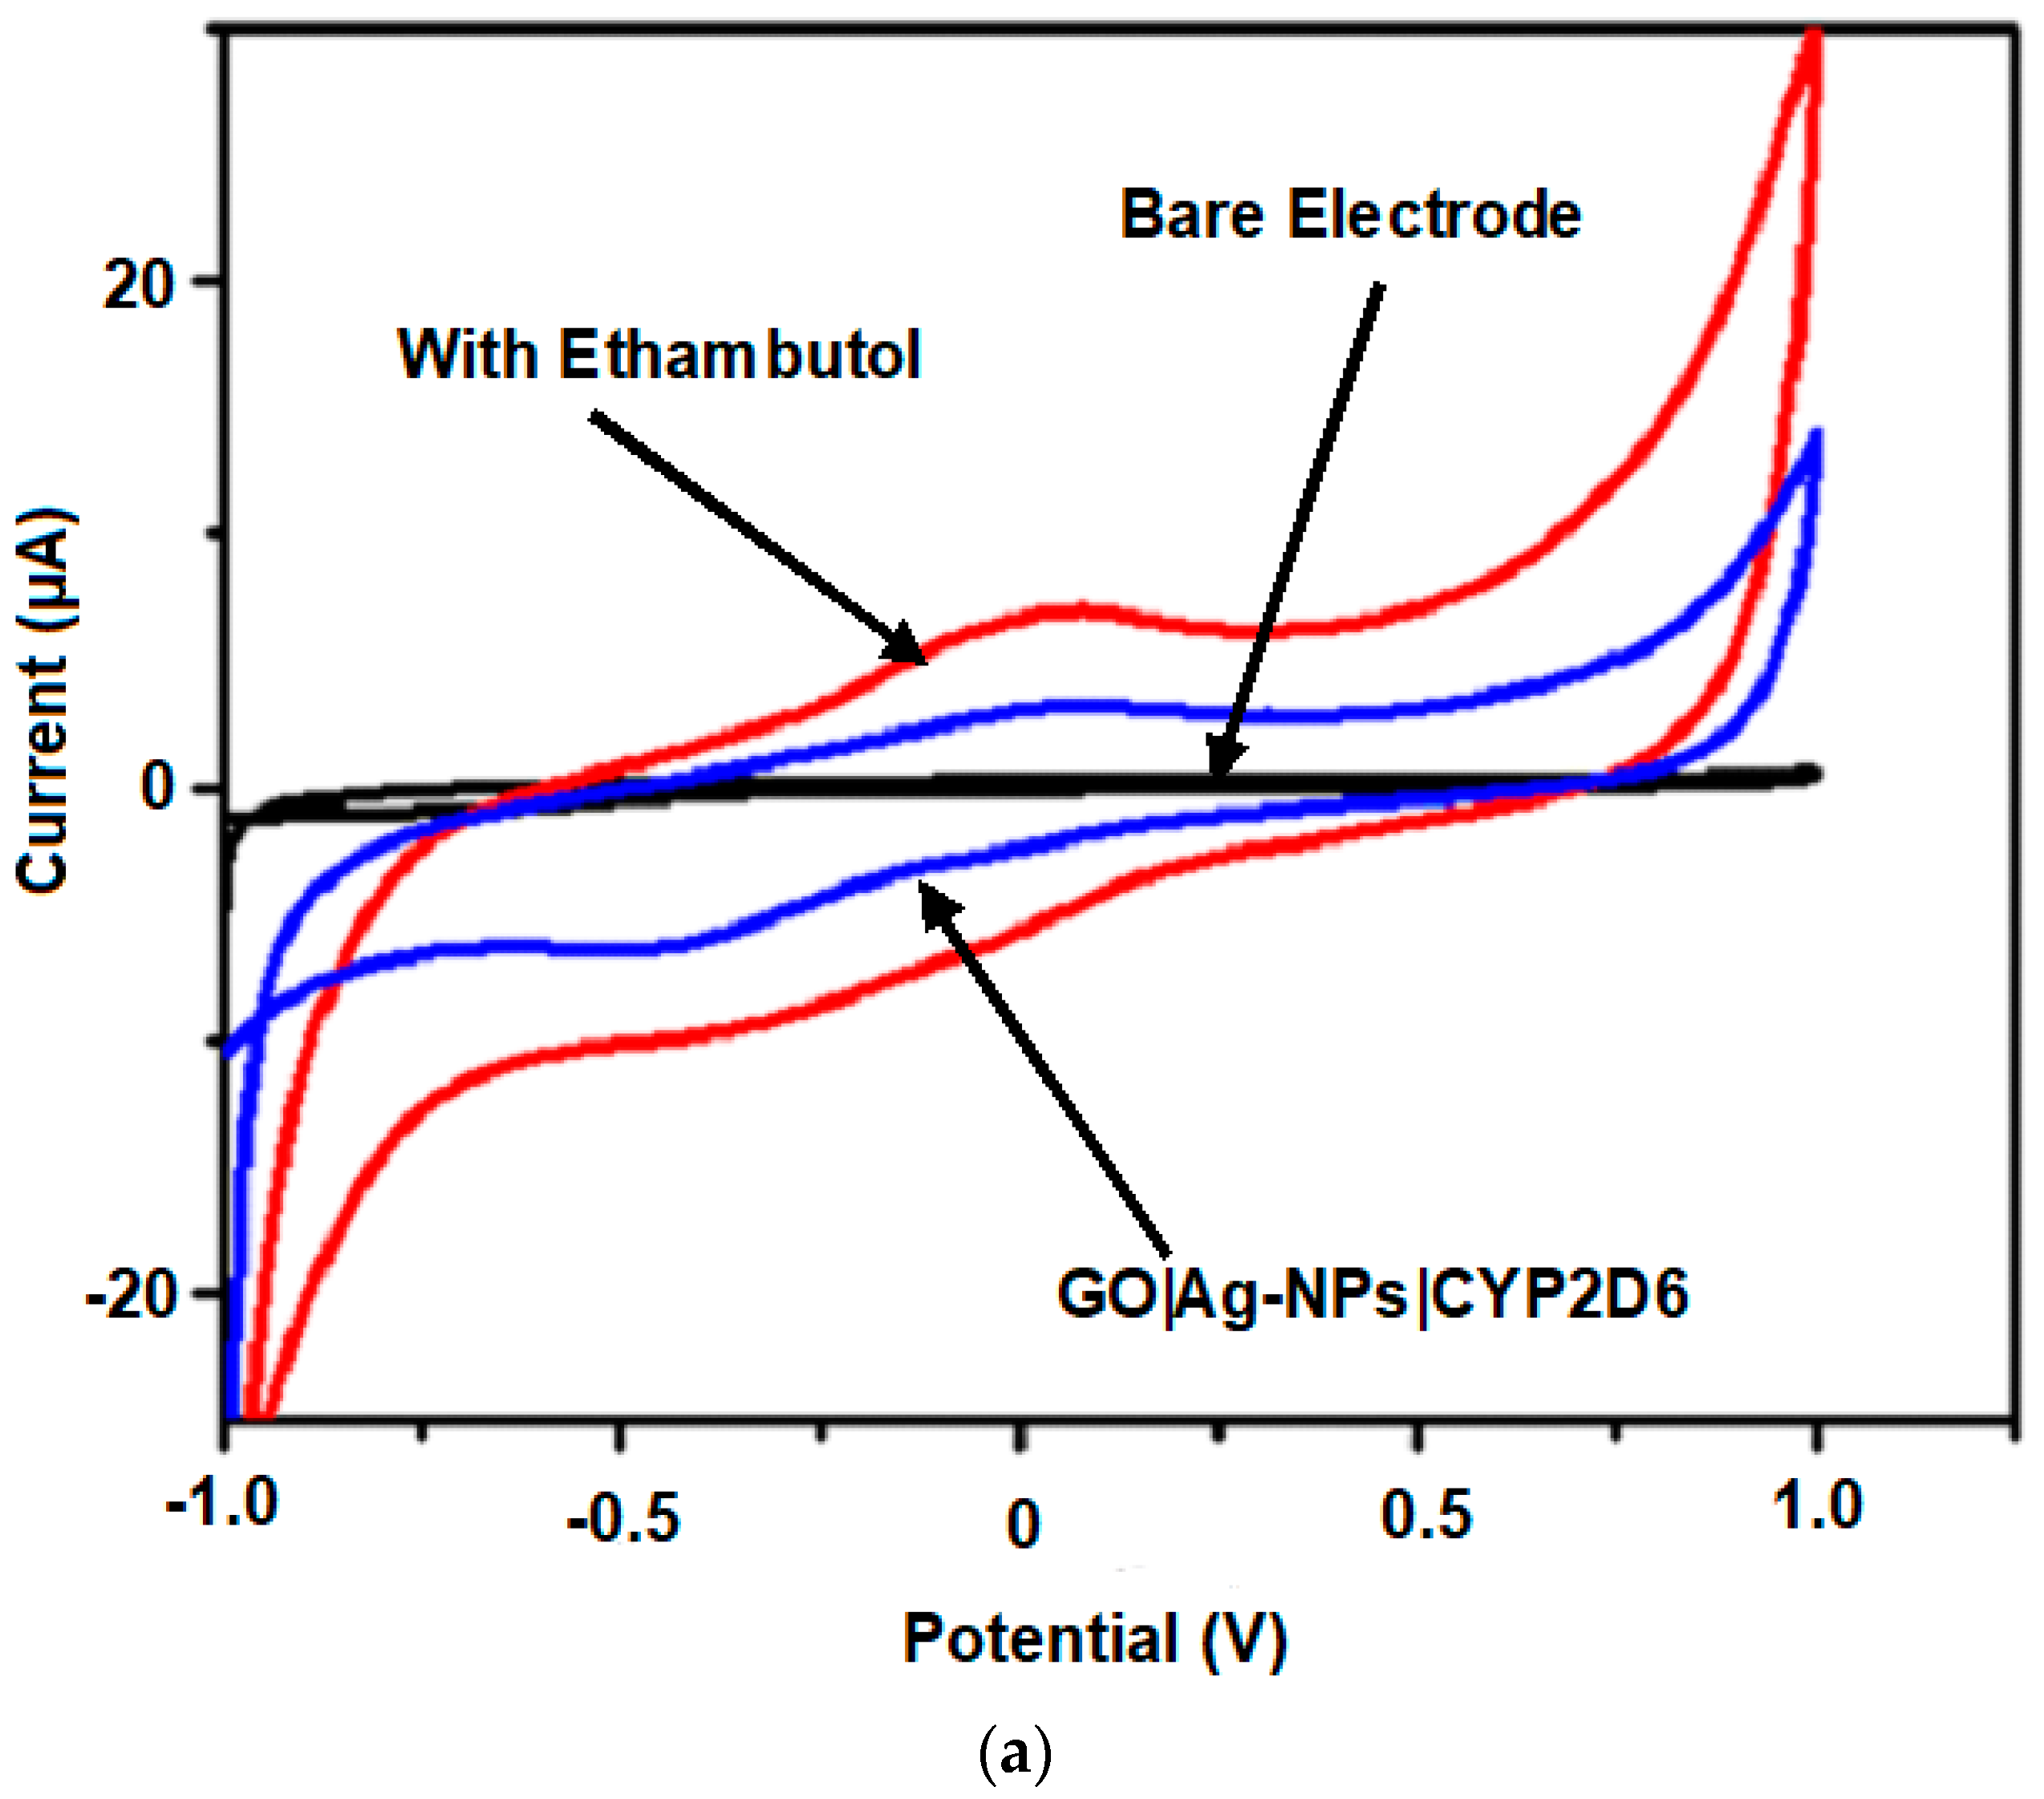
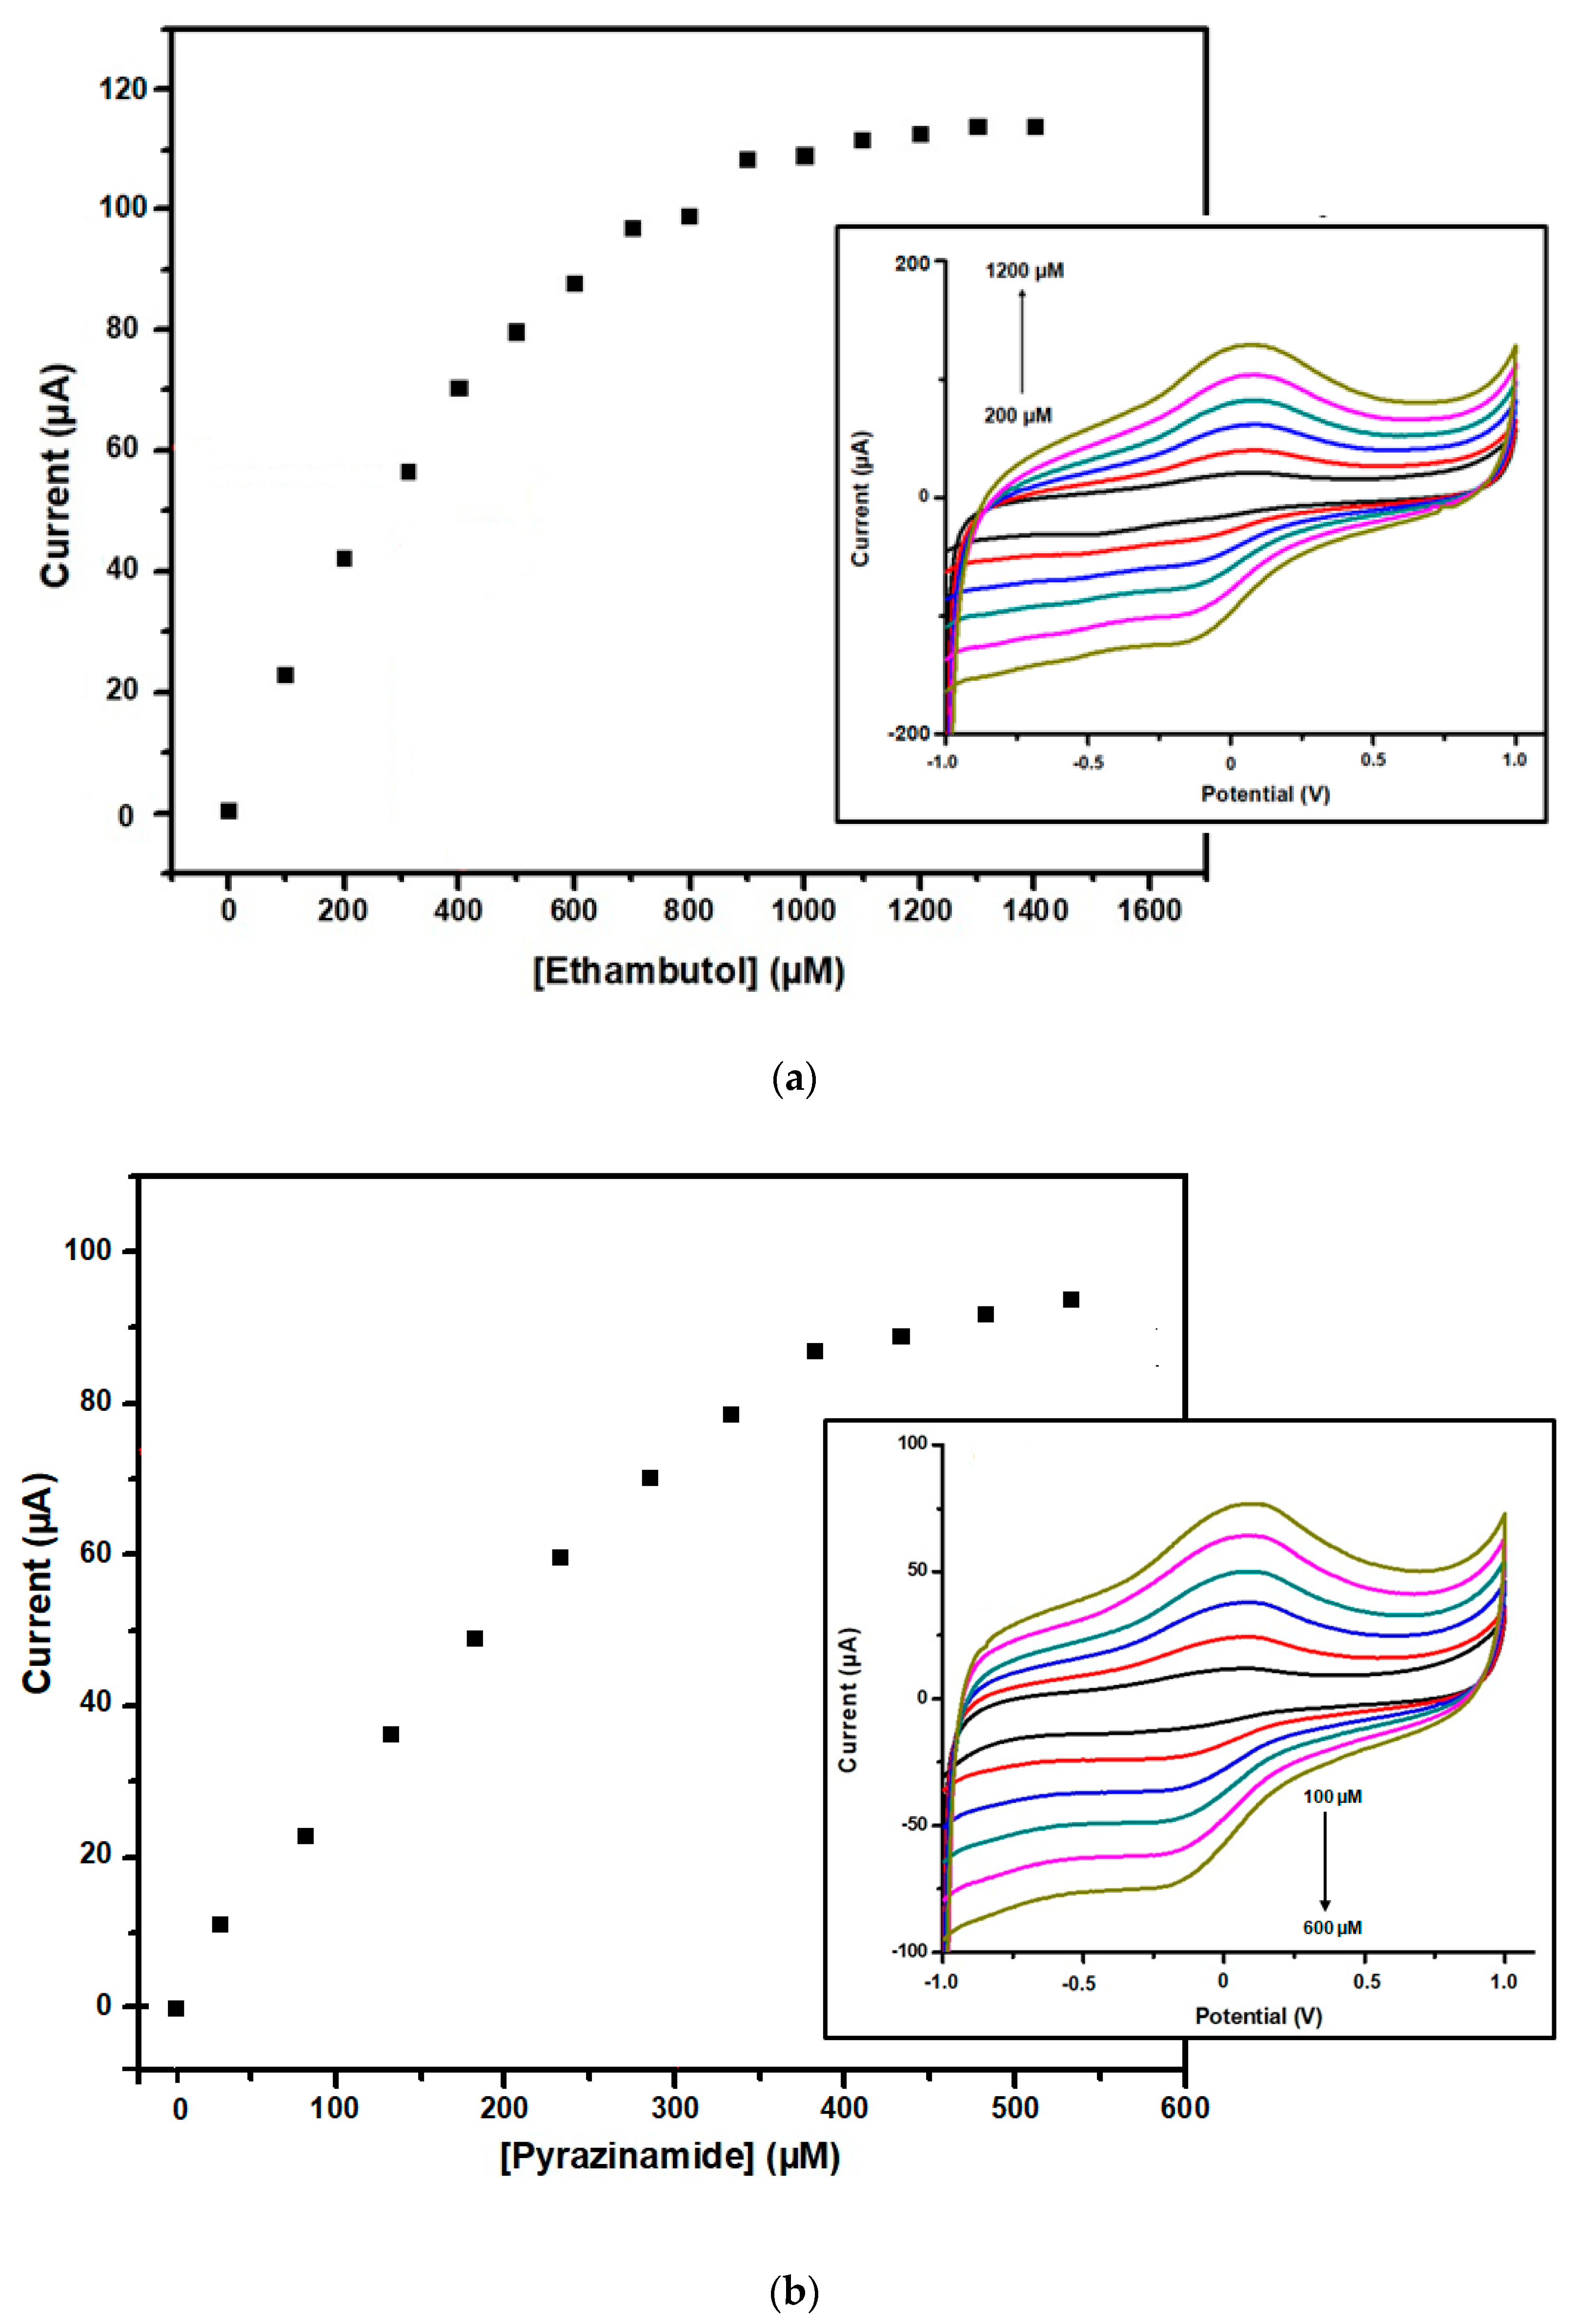
3.4. Electrochemical Detection of EMB and PZA at GO|Ag-NPs|CYP2D6||GCE Biosensors

The electrochemical behaviours of EMB and PZA were studied using GO|Ag-NPs|CYP2D6||GCE nanobiosensors and investigated using CV. Figure 8a illustrates the CV of 50 µM of EMB, and Figure 8b illustrate that of 50 µM PZA initially added in 0.1 M, pH 7.4 PBS at a scan rate of 50 mV s−1 against the GO|Ag-NPs|CYP2D6||GCE nanobiosensor under nitrogen saturated conditions. The oxidation of EMB and PZA was observed at 0.14 and 0.36 V, respectively, and their anodic currents were several-fold more than those observed for bare GCE and GO|Ag-NPs|CYP2D6||GCE.
This is attributed to the stable nature of the nanocomposites as well as their increased surface area due to the presence of graphene and CYP2D6 which possesses amino acids and carboxylic active sites in its structure, further enhancing the conductivity at the surface of the already conductive nanocomposite [50]. CV was also employed in the detection of the drugs of interest and from the observed reactions, their linear ranges, detection limits (LOD) and quantifications (LOQ) were also determined. The respective responses of the GO|Ag-NPs|CYP2D6||GCE nanobiosensors towards EMB and PZA were investigated in pH 7.4, 0.1 M PBS under anaerobic conditions at 50 mV s−1. Redox waves were observed on the voltammograms when human plasma infused with different concentrations of EMB and PZA were added independently against the nanobiosensors where increased oxidation currents were observed, as shown in Figure 9a,b for each drug profile.
The current responses observed upon independently detecting EMB (Figure 9a (insert)) and PZA (Figure 9b (insert)) at different concentrations were used to plot calibration curves (Figure 9a for EMB and Figure 9b for PZA). A concentration range of 200–2800 µM was studied for EMB and a sensitivity of 0.0748 μA µM−1 was determined at the linear concentration range of 200–1200 µM. For PZA, a concentration range of 100–1100 µM was studied and a sensitivity of 0.1715 μA µM−1 was determined at the linear concentration range of 100–600 µM. This indicates that a responsive and comfortable environment was created by the GO|Ag-NPs|CYP2D6||GCE nanobiosensor for the successful biocatalytic reaction to take place. The calibration curves resulted in Michaelis–Menten profiles for each drug biotransformation studied, resulting in the determination of the parameters IMAX and KM, which were assigned the values 0.2383 mA and 0.1464 mM (146.7 µM) for EMB, whereas for PZA, IMAX was 0.0973 mA and KM was 0.0138 mM (1.6989 µM).
The obtained LOD value for EMB was determined to be 0.6791 × 10⁻² nM, and for PZA it was determined to be 0.2962 × 10⁻² nM. The obtained LOD values for both of these drugs indicated that the method used in this study is great and is within the desired range. Furthermore, the obtained LOQ values for each system were determined to be 0.8975 × 10⁻² nM for PZA and 0.02057 nM for EMB. The determined lower LOD and LOQ are similar to previously reported studies, as shown in Table 1. Of great significance is the fact that both the LOD and LOQ values are lower than the peak plasma concentrations of both PZA and EMB, a good indication that the developed nanobiosensors have great potential of being used in real human samples. The most commonly reported maximum observed plasma concentration (Cmax) value of EMB found is < 2 mg mL−1 in adults, and <1 mg mL−1 is common in children; that is, after 10 h of administration, irrespective of their CYP2D6 genotype [51]. Additionally, it has been reported that Cmax for PZA is > 35 μg mL−1 after 24 h of administration in both adults and some children [52]. These results are demonstrative of good nanobiosensor systems that can detect low drug concentrations among tuberculosis diagnosed patients.

3.5. Stability and Repeatability

The stability and repeatability of the GO|Ag-NPs|CYP2D6||GCE nanobiosensors stored at 4 °C for 14 days was investigate, during which they were subjected to a constant concentration of each drug on a daily basis. After this time period, the current responses observed for the detection of 50 μM EMB and 50 μM PZA each retained more than 85% of their original response. On average, the nanobiosensors reduced by a fraction of approximately 15%, signifying that the nanobiosensors developed in this study have long-term stability. Thereafter, the relative standard deviation (R.S.D) for ten successive measurements for 50 μM EMB and 50 μM PZA were determined to be 3.6% and 2.9%, respectively, a good indication of the repeatable nature of the developed novel sensing platforms.
Cytochrome P450-based nanobiosensors, such as the one developed in this study, are encouraging substitutes for the fast measurements of various drugs using simple, inexpensive, rapid and in some cases reusable apparatus. They also have the added advantage of good sensitivity, selectivity, and accuracy [53,54]. Furthermore, the use of electron transfer mediators such as electroactive polymers, nanomaterials and modified graphene oxide, such as those reported herein, have seen an improvement in the electron transfer between the cytochrome enzymes and electrode surfaces [55]. However, there are some drawbacks associated with the application of these sensors, resulting mainly from reduced signals caused by interfering chemicals present in the reaction medium and fouling agents [56].

4. Conclusions

This study reported a novel and simple nanobisensor which has been developed and characterised for the detection of the tuberculosis treatment drugs ethambutol and pyrazinamide. The study illustrated the successful synthesis of electroactive GO|Ag-NPs nanocomposite using pear extracts where cyclic voltammetry was used to evaluate the properties required for their use in sensor development. The characterisation of the nanocomposites was achieved using Fourier Transform Infra-red Spectroscopy, Ultraviolet-Visible Spectroscopy, Raman Spectroscopy, High-resolution Scanning Electron Microscopy and High-resolution Transmission Electron Microscopy. The nanocomposites indicated a stable platform for the immobilisation of the enzyme cytochrome P450–2D6 (CYP2D6), where the platform served as a point of attachment for the enzyme as well as an efficient electron mediator between the redox centre of CYP2D6 and the glassy carbon electrode surface. The study confirmed that the GO|Ag-NPs|CYP2D6||GCE nanobiosensor was successful in the oxidative catalysis of pyrazinamide and ethambutol into respective water-soluble materials. The resultant catalytic current responses were amperometrically monitored by the cyclic voltammetric technique, where an increase in current was observed for the individual analytes. Moreover, from the calibration curves, linear ranges were established in which sensitivity to the drugs, the limit of detection and the limit of quantitation were determined. Additionally, the Michaelis–Menten kinetics parameters IMAX and KM were also established beyond the linear range. The limits of detection and quantification for each drug were determined to be lower than the human peak plasma concentrations of the drugs, suggesting that the developed nanobiosensors are well suited in the detection of Tuberculosis treatment drugs in real human samples.

Author Contributions

Conceptualization, S.T. and Y.M.; formal analysis, N.M.; investigation, S.N.; resources, E.I.; writing—original draft preparation, R.F.A.; supervision, T.M.; funding acquisition, R.F.A. All authors have read and agreed to the published version of the manuscript.

Funding

This research was funded by the National Research Foundation (NRF), South Africa, grant numbers 116258 and 99158.

Acknowledgments

We thank the staff at iThembaLabs, SensorLab, the Chemistry and Physics Departments at the University of the Western Cape for the analysis of samples generated from this study. The National Research Foundation, South Africa and the Council for Scientific and Industrial Research, South Africa are appreciated for funding the students involved in this study.

Conflicts of Interest

The authors declare no conflict of interest. The funders had no role in the design of the study; in the collection, analyses, or interpretation of data; in the writing of the manuscript, or in the decision to publish the results.

References

  1. Khan, A.K.; Rashid, R.; Murtaza, G.; Zahra, A. Gold nanoparticles: Synthesis and applications in drug delivery. Trop. J. Pharm. Res. 2014, 13, 1169–1177. [Google Scholar] [CrossRef]
  2. Gou, X.C.; Liu, J.; Zhang, H.L. Monitoring human telomere DNA hybridization and G-quadruplex formation using gold nanorods. Anal. Chim. Acta 2010, 668, 208–214. [Google Scholar] [CrossRef] [PubMed]
  3. Pacławski, K.; Streszewski, B.; Jaworski, W.; Luty-Błocho, M.; Fitzner, K. Zinc oxide formation via zinc nitrate complex ions reduction with glucose in the batch and in the flow microreactor systems. Colloid Surf. A 2012, 413, 208–215. [Google Scholar] [CrossRef]
  4. Venugopal, K.; Rather, H.A.; Rajagopal, K.; Shanthi, M.P.; Sheriff, K.; Illiyas, M.; Rather, R.A.; Manikandan, E.; Uvarajan, S.; Bhaskar, M.; et al. Synthesis of silver nanoparticles (AgNPs) for anticancer activities (MCF 7 breast and A549 lung cell lines) of the crude extract of Syzygium aromaticum. J. Photochem. Photobiol. 2017, 167, 282–289. [Google Scholar] [CrossRef]
  5. Sharma, P.; Tuteja, S.K.; Bhalla, V.; Shekhawat, G.; Dravid, V.P.; Suri, C.R. Bio-functionalized graphene–graphene oxide nanocomposite based electrochemical immunosensing. Biosens. Bioelectron. 2013, 39, 99–105. [Google Scholar] [CrossRef] [Green Version]
  6. Bunch, J.S.; Van Der Zande, A.M.; Verbridge, S.S.; Frank, I.W.; Tanenbaum, D.M.; Parpia, J.M.; Craighead, H.G.; McEuen, P.L. Electromechanical resonators from graphene sheets. Science 2007, 31, 490–493. [Google Scholar] [CrossRef] [PubMed] [Green Version]
  7. Zbeda, S.; Pokpas, K.; Titinchi, S.; Jahed, N.; Baker, P.G.; Iwuoha, E.I. Few-layer Binder Free Graphene Modified Mercury Film Electrode for Trace Metal Analysis by Square Wave Anodic Stripping Voltammetry. Int. J. Electrochem. Sci. 2013, 8, 11125–11141. [Google Scholar]
  8. Nasrollahzadeh, M.; Sajjadi, M.; Sajadi, S.M.; Issaabadi, Z. Interface science and technology. In Green Nanotechnology; Nasrollahzadeh, M., Sajjadi, M.S., Sajadi, S.M., Issaabadi, Z., Eds.; Academic Press: London, UK, 2019; Volume 28, pp. 145–198. [Google Scholar] [CrossRef]
  9. Li, X.; Wanga, T.; Zhou, B.; Gao, B.; Cao, J.; Huang, L. Chemical composition and antioxidant and anti-inflammatory potential of peels and flesh from 10 different pear varieties (Pyrus spp.). Food Chem. 2014, 152, 531–538. [Google Scholar] [CrossRef]
  10. Lee, K.H.; Cho, J.Y.; Lee, H.J.; Ma, Y.K.; Kwon, J.; Park, S.H.; Park, S.H. Hydroxycinnamoylmalic acids and their methyl esters from pear (Pyrus pyrifolia Nakai) fruit peel. J. Agric. Food Chem. 2011, 59, 10124–10128. [Google Scholar] [CrossRef]
  11. Ko, P.Y.; Lin, S.D.; Tu, S.T.; Hsieh, M.C.; Su, S.L.; Hsu, S.R.; Chen, Y.C. High Diabetes Mellitus Prevalence with Increasing Trend Among Newly-Diagnosed Tuberculosis Patients in an Asian Population: A Nationwide Population-Based Study. Prim. Care Diabetes 2016, 10, 148–155. [Google Scholar] [CrossRef]
  12. Zumla, A.; Hafner, R.; Lienhardt, C.; Hoelscher, M.; Nunn, A. Advancing the development of Tuberculosis therapy. Nat. Rev. Drug Discov. 2012, 11, 171–172. [Google Scholar] [CrossRef] [PubMed]
  13. Yang, H.; Li, F.; Shan, C.; Han, D.; Zhang, Q.; Niu, L.; Ivaska, A. Covalent functionalization of chemically converted graphene sheets via silane and its reinforcement. J. Mater. Chem. 2009, 19, 4632–4638. [Google Scholar] [CrossRef]
  14. Chinnasamy, T.; Senthilkumar, K.; Periyakaruppan, A. Specific detection of Mycobacterium sp. genomic DNA using dual labeled gold nanoparticle based electrochemical immunosensor. Anal. Biochem. 2011, 417, 73–79. [Google Scholar] [CrossRef]
  15. Kumar, S.; Pai, A.G.; Tungenwar, P.N.; Bhandarwar, A.H. Isolated primary tuberculosis of spleen—A rare entity in the immuno-competent patient. Int. J. Surg. Case Rep. 2017, 30, 93–96. [Google Scholar] [CrossRef]
  16. Galashev, A.E.; Galasheva, A.A. Mercury removal from graphene by bombardment with xenon clusters: Computer simulation. High Energy Chem. 2015, 49, 347–351. [Google Scholar] [CrossRef]
  17. Grossman, R.F.; Hsueh, P.R.; Gillespie, S.H.; Blasi, F. Community-acquired pneumonia and tuberculosis: Differential diagnosis and the use of fluoroquinolones. Int. J. Infect. Dis. 2014, 18, 14–21. [Google Scholar] [CrossRef] [Green Version]
  18. Hassanein, H.A.; Elbadry, M.I. Selective immunoglobulin M deficiency in an adult with miliary tuberculosis: A clinically interesting coexistence. A case report and review of the literature. Int. J. Mycobacteriol. 2016, 5, 106–110. [Google Scholar] [CrossRef] [Green Version]
  19. Sabooni, K.; Khosravi, M.H.; Pirmohammad, H.; Afrasiabian, S.; Moghbel, N.; Shahverdi, E.; Konjedi, M.A.; Shahverdi, A. Tuberculosis peritonitis with features of acute abdomen in HIV infection. Int. J. Mycobacteriol. 2015, 4, 151–153. [Google Scholar] [CrossRef] [Green Version]
  20. Kowada, A. Cost-effectiveness of interferon-γ release assay versus chest X-ray for tuberculosis screening of employees. Am. J. Infect. Control. 2011, 39, e67–e72. [Google Scholar] [CrossRef]
  21. Zaaba, N.I.; Foo, K.L.; Hashim, U.; Tan, S.J.; Lui, W.; Voon, C.H. Synthesis of Graphene Oxide using Modified Hummers Method: Solvent Influence. Procedia Eng. 2017, 184, 469–477. [Google Scholar] [CrossRef]
  22. Mathew, P.; Kuo, Y.H.; Vazirani, B.; Eng, R.H.; Weinstein, M.P. Are three sputum acid-fast bacillus smears necessary for discontinuing tuberculosis isolation? J. Clin. Microbiol. 2002, 40, 3482–3484. [Google Scholar] [CrossRef] [PubMed] [Green Version]
  23. Kowada, A.; Deshpande, G.A.; Takahashi, O.; Shimbo, T.; Fukui, T. Cost effectiveness of interferon-gamma release assay versus chest X-ray for tuberculosis screening of BCG-vaccinated elderly populations. Mol. Diagn. Ther. 2010, 14, 229–236. [Google Scholar] [CrossRef] [PubMed]
  24. Gurunathan, S.; Han, J.W.; Park, J.H.; Kim, E.; Choi, Y.; Kwon, D.; Kim, J. Reduced graphene oxide–silver nanoparticle nanocomposite: A potential anticancer nanotherapy. Int. J. Nanomed. 2015, 10, 6257–6276. [Google Scholar] [CrossRef] [PubMed] [Green Version]
  25. Chook, S.W.; Chia, C.H.; Sarani, Z.; Ayob, M.K.; Chee, K.L.; Neoh, H.M.; Huang, N.M. Silver nanoparticles-graphene oxide nanocomposite for antibacterial purpose. Adv. Mater. Res. 2012, 364, 439–443. [Google Scholar] [CrossRef]
  26. Kudin, K.N.; Ozbas, B.; Schniepp, H.C.; Prud’Homme, R.K.; Aksay, I.A.; Car, R. Raman spectra of graphite oxide and functionalized graphene sheets. Nano Lett. 2008, 8, 36–41. [Google Scholar] [CrossRef]
  27. Chettri, P.; Vendamani, V.S.; Tripathi, A.; Singh, K.M.; Pathak, A.P.; Tiwari, A. Green synthesis of silver nanoparticle-reduced graphene oxide using Psidium guajava and its application in SERS for the detection of methylene blue. Appl. Surf. Sci. 2017, 406, 312–318. [Google Scholar] [CrossRef]
  28. Drewniak, S.; Muzyka, R.; Stolarczyk, A.; Pustelny, T.; Kotyczka-Morańska, M.; Setkiewicz, M. Studies of reduced graphene oxide and graphite oxide in the aspect of their possible application in gas sensors. Sensors 2016, 16, 103. [Google Scholar] [CrossRef]
  29. Oliveira, R.N.; Mancini, M.C.; de Oliveira, F.C.S.; Passos, T.M.; Quilty, B.; Thiré, R.M.S.; McGuinness, G.B. FTIR analysis and quantification of phenols and flavonoids of five commercially available plants extracts used in wound healing. Matéria 2016, 11743, 767–779. [Google Scholar] [CrossRef] [Green Version]
  30. Simmons, J.A. Risk of cancer from diagnostic X-rays. Lancet 2004, 363, 1908–1909. [Google Scholar] [CrossRef]
  31. Li, F.; Jiang, X.; Zhao, J.; Zhang, S. Graphene oxide: A promising nanomaterial for energy and environmental applications. Nano Energy 2015, 16, 488–515. [Google Scholar] [CrossRef] [Green Version]
  32. Lin-Jun, H.; Yan-Xin, W.; Jian-Guo, T.; Yao, W.; Ji-Xian, L.; Ji-Qing, J.; Wei, W. Preparation of Graphene/Silver Nanohybrid Composite with Good Surface-Enhanced Raman Scattering Characteristics. Int. J. Electrochem. Sci. 2016, 11, 398–405. [Google Scholar]
  33. Zhang, H.; Liu, W.; Yang, L.; Liu, J.; Wang, Y.; Mao, X.; Wang, J.; Xu, X. Fabrication of Reduced Graphene Oxide-Ag Nanocomposites and Analysis on the Interaction with BSA. J. Nanomater. 2019, 2019, 7. [Google Scholar] [CrossRef] [Green Version]
  34. Anouar, E.L.; Gierschner, J.; Duroux, J.; Trouillas, P. UV/Visible spectra of natural polyphenols: A time-dependent density functional theory study. Food Chem. 2012, 131, 79–89. [Google Scholar] [CrossRef]
  35. Hung-Ju Chen, H.; Inbaraj, B.S.; Chen, B. Determination of Phenolic Acids and Flavonoids in Taraxacum formosanum Kitam by Liquid Chromatography-Tandem Mass Spectrometry Coupled with a Post-Column Derivatization Technique. Int. J. Mol. Sci. 2012, 13, 260–285. [Google Scholar] [CrossRef] [PubMed] [Green Version]
  36. Sukumaran, S.S.; Rekha, C.R.; Resmi, A.N.; Jinesh, K.B.; Gopchandran, K.G. Raman and scanning tunneling spectroscopic investigations on graphene-silver nanocomposites. J. Sci. Adv. Mater. Devices 2018, 3, 353–358. [Google Scholar] [CrossRef]
  37. Song, J.Y.; Kim, B.S. Rapid biological synthesis of silver nanoparticles using plant leaf extracts. Bioprocess Biosyst. Eng. 2009, 32, 79–84. [Google Scholar] [CrossRef]
  38. Srirangam, G.M.; Parameswara Rao, K. Synthesis and charcterization of silver nanoparticles from the leaf extract of Malachra capitata (L.). Rasayan J. Chem. 2017, 10, 46–53. [Google Scholar] [CrossRef]
  39. Lee, J.; Shin, S.; Kang, S.; Lee, S.; Seo, J.; Lee, T. Highly Stable Surface-Enhanced Raman Spectroscopy Substrates Using Few-Layer Graphene on Silver Nanoparticles. J. Nanomater. 2015, 2015, 7. [Google Scholar] [CrossRef]
  40. Akhavan, O.; Ghaderi, E. Photocatalytic reduction of graphene oxide nanosheets on TiO2 thin film for photoinactivation of bacteria in solar light irradiation. J. Phys. Chem. C. 2009, 113, 20214–20220. [Google Scholar] [CrossRef]
  41. Stankovich, S.; Dikin, D.A.; Piner, R.D. Synthesis of graphene-based nanosheets via chemical reduction of exfoliated graphite oxide. Carbon 2007, 45, 1558–1565. [Google Scholar] [CrossRef]
  42. Wang, P.; Liu, Z.G.; Chen, X.; Meng, F.L.; Liu, J.H.; Huang, X.J. UV irradiation synthesis of an Au-graphene nanocomposite with enhanced electrochemical sensing properties. J. Mater. Chem. A 2013, 1, 9189–9195. [Google Scholar] [CrossRef]
  43. Ajayi, R.F.; Nxusani, E.; Douman, S.F.; Jonnas, A.; Baker, P.G.L.; Iwuoha, E.I. An Amperometric Cytochrome P450-2D6 Biosensor System for the Detection of the Selective Serotonin Reuptake Inhibitors (SSRIs) Paroxetine and Fluvoxamine. J. Nano Res. 2016, 44, 208–228. [Google Scholar] [CrossRef]
  44. Cui, D.; Mi, L.; Xu, X.; Lu, J.; Qian, J.; Liu, S. Nanocomposites of graphene and cytochrome P450 2D6 isozyme for electrochemical-driven tramadol metabolism. Langmuir 2014, 30, 11833–11840. [Google Scholar] [CrossRef] [PubMed]
  45. Ferrari, A.G.F.; Foster, C.W.; Peter, J.; Kelly, P.J.; Brownson, A.C.; Banks, C.E. Determination of the Electrochemical Area of Screen-Printed Electrochemical Sensing Platforms. Biosensors 2018, 8, 10. [Google Scholar] [CrossRef] [Green Version]
  46. Thu, N.T.A.; Duc, H.V.; Hai Phong, N.; Cuong, N.D.; Hoan, N.T.V.; Quang Khieu, D. Electrochemical Determination of Paracetamol Using Fe3O4/Reduced Graphene-Oxide-Based Electrode. J. Nanomater. 2018, 2018, 15. [Google Scholar] [CrossRef] [Green Version]
  47. Peik-See, T.; Pandikumar, A.; Nay-Ming, H.; Hong-Ngee, L.; Sulaiman, Y. Simultaneous electrochemical detection of dopamine and ascorbic acid using an iron oxide/reduced graphene oxide modified glassy carbon electrode. Sensors 2014, 14, 15227–15243. [Google Scholar] [CrossRef]
  48. Devasenathipathy, R.; Mani, V.; Chen, S. Highly selective amperometric sensor for the trace level detection of hydrazine at bismuth nanoparticles decorated graphene nanosheets modified electrode. Talanta 2014, 124, 43–51. [Google Scholar] [CrossRef]
  49. Wu, L.; Song, B.; Keer, L.M.; Gu, L. Molecular Dynamics Investigation of Graphene Nanoplate Diffusion Behavior in Poly-α-Olefin Lubricating Oil. Crystals 2018, 8, 361. [Google Scholar] [CrossRef] [Green Version]
  50. Bostick, C.D.; Mukhopadhyay, S.; Pecht, I.; Sheves, M.; Cahen, D.; Lederman, D. Protein bioelectronics: A review of what we do and do not know. Rep. Prog. Phys. 2018, 81, 026601. [Google Scholar] [CrossRef] [Green Version]
  51. Raoof, J.B.; Ojani, R.; Beitollahi, H.; Hosseinzadeh, R. Electrocatalytic oxidation and highly selective voltammetric determination of L-cysteine at the surface of a 1-[4-(ferrocenyl ethynyl) phenyl]-1-ethanone modified carbon paste electrode. Anal. Sci. 2006, 22, 1213–1220. [Google Scholar] [CrossRef] [Green Version]
  52. Zhu, M.; Burman, W.J.; Starke, J.R.; Stambaugh, J.J.; Steiner, P.; Bulpitt, A.E.; Ashkin, D.; Auclair, B.; Berning, S.E.; Jelliffe, R.W.; et al. Pharmacokinetics of ethambutol in children and adults with tuberculosis. Int. J. Tuberc. Lung Dis. 2004, 8, 1360–1367. [Google Scholar] [PubMed]
  53. Iwuoha, E.I.; Ngece, R.; Klink, M.; Baker, P. Amperometric responses of CYP2D6 drug metabolism nanobiosensor for sertraline: A selective serotonin reuptake inhibitor. IET Nanobiotech. 2007, 4, 62–67. [Google Scholar] [CrossRef] [PubMed]
  54. Shumyantseva, V.V.; Ivanov, Y.D.; Bistolas, N.; Scheller, F.W.; Archakov, A.I.; Wollenberger, U. Direct Electron Transfer of Cytochrome P450 2B4 at Electrodes Modified with Nonionic Detergent and Colloidal Clay Nanoparticles. Anal. Chem. 2004, 76, 6046–6052. [Google Scholar] [CrossRef] [PubMed]
  55. Shumyantseva, V.V.; Bulko, T.V.; Bachmann, T.T.; Bilitewski, U.; Schmid, R.D.; Archakov, A.I. Electrochemical Reduction of Flavocytochromes 2B4 and 1A2 and Their Catalytic Activity. Arch. Biochem. Biophy. 2002, 377, 43–48. [Google Scholar] [CrossRef]
  56. Rocchitta, G.; Spanu, A.; Babudieri, S.; Latte, G.; Madeddu, G.; Galleri, G.; Nuvoli, S.; Bagella, P.; Demartis, M.I.; Fiore, V.; et al. Enzyme Biosensors for Biomedical Applications: Strategies for Safeguarding Analytical Performances in Biological Fluids. Sensors 2016, 16, 780. [Google Scholar] [CrossRef] [Green Version]
  57. Cheemalapati, S.; Devadas, B.; Chen, S.M.; Ali, M.A.; Al-Hemaid, F.M. Electrochemical determination of selected antihypertensive and antituberculosis drugs at a tyrosine-modified electrode. Anal. Methods 2014, 6, 6774–6782. [Google Scholar] [CrossRef]
  58. Bergamini, M.F.; Santos, D.P.; Zanoni, M.V.B. Electrochemical behavior and voltammetric determination of pyrazinamide using a poly-histidine modified electrode. J. Electroanal. Chem. 2013, 690, 47–52. [Google Scholar] [CrossRef] [Green Version]
  59. Devadas, B.; Cheemalapati, S.; Chen, S.M.; Ali, M.A.; Al-Hemaid, F.M. Highly sensing graphene oxide/poly-arginine-modified electrode for the simultaneous electrochemical determination of buspirone, isoniazid and pyrazinamide drugs. Ionics 2015, 21, 547–555. [Google Scholar] [CrossRef]
  60. Ferraz, B.R.L.; Leite, F.R.F.; Malagutti, A.R. Simultaneous determination of ethionamide and pyrazinamide using poly (L-cysteine) film-modified glassy carbon electrode. Talanta 2016, 154, 197–207. [Google Scholar] [CrossRef]
Figure 1. (a) FTIR and (b) UV-vis spectra of Ag-NPs, GO|Ag-NPs and pear extracts.
Processes 08 00879 g001
Figure 2. HR-TEM image of (a) graphene oxide (GO), (b) GO|Ag-NPs and (c) SAED pattern of GO|Ag-NPs.
Processes 08 00879 g002
Figure 3. XRD pattern of (a) graphite and graphene oxide (b) GO|Ag-NPs and the (c) histogram for GO|Ag-NPs.
Processes 08 00879 g003
Figure 4. High-resolution scanning electron microscopy (HR-SEM) images showing (a) GO and (b) GO|Ag-NPs.
Processes 08 00879 g004
Figure 5. Raman spectra of GO and GO|Ag-NPs.
Processes 08 00879 g005
Figure 6. Cyclic voltammetry (CV) of bare glassy carbon electrode (GCE), GO|Ag-NPs|GCE and GO|Ag-NPs|CYT2D6|GCE in pH 7.4, 0.1 M PBS buffer solution at 50 mV s−1.
Processes 08 00879 g006
Figure 7. CV analysis of GO|Ag-NPs|CYP2D6||GCE at 10 mV s−1 interval scan rate intervals.
Processes 08 00879 g007
Figure 8. CV of bare GCE, GO|Ag-NPs|CYP2D6 and (a) 50 µM of ethambutol and (b) 50 µM of pyrazinamide at 50 mV s−1.
Processes 08 00879 g008aProcesses 08 00879 g008b
Figure 9. (a) Calibration curve for the EMB nanobiosensor and CV of the detection of EMB (insert). The currents plotted are cathodic currents measured at −0.5 V and subtracted from current at 0 µM EMB. (b) Calibration curve for the PZA nanobiosensor and the CV for the detection of PZA (insert). The currents plotted are cathodic currents measured at −0.5 V and subtracted from current at 0 µM.
Processes 08 00879 g009
Table 1. Comparison studies for tuberculosis drug biosensors.
BiosensorLinear Range (µM)LOD (nM)References
Tyrosine (Tyr) modified glassy carbon electrode for electrochemical determination of Ethambutol drug.20–1000 6930[57]
Determination of pyrazinamide using a poly-histidine modified electrode10–100 570[58]
Sensing graphene oxide/poly-arginine-modified electrode for electrochemical determination of pyrazinamide drug.25–1600 3280[59]
l-cysteine (poly(l-Cys)) on a glassy carbon electrode (GCE) for electrochemical determination of pyrazinamide drug.0.5–51113[60]
Graphene-silver biosensors for ethambutol 200–12000.0067Current study
Graphene-silver biosensors for pyrazinamide100–6000.0029Current study

