Experimental and Statistical Validation of Data on Mesh-Coupled Annular Distributor Design for Swirling Fluidized Beds


Abstract
1. Introduction
2. Materials and Methods
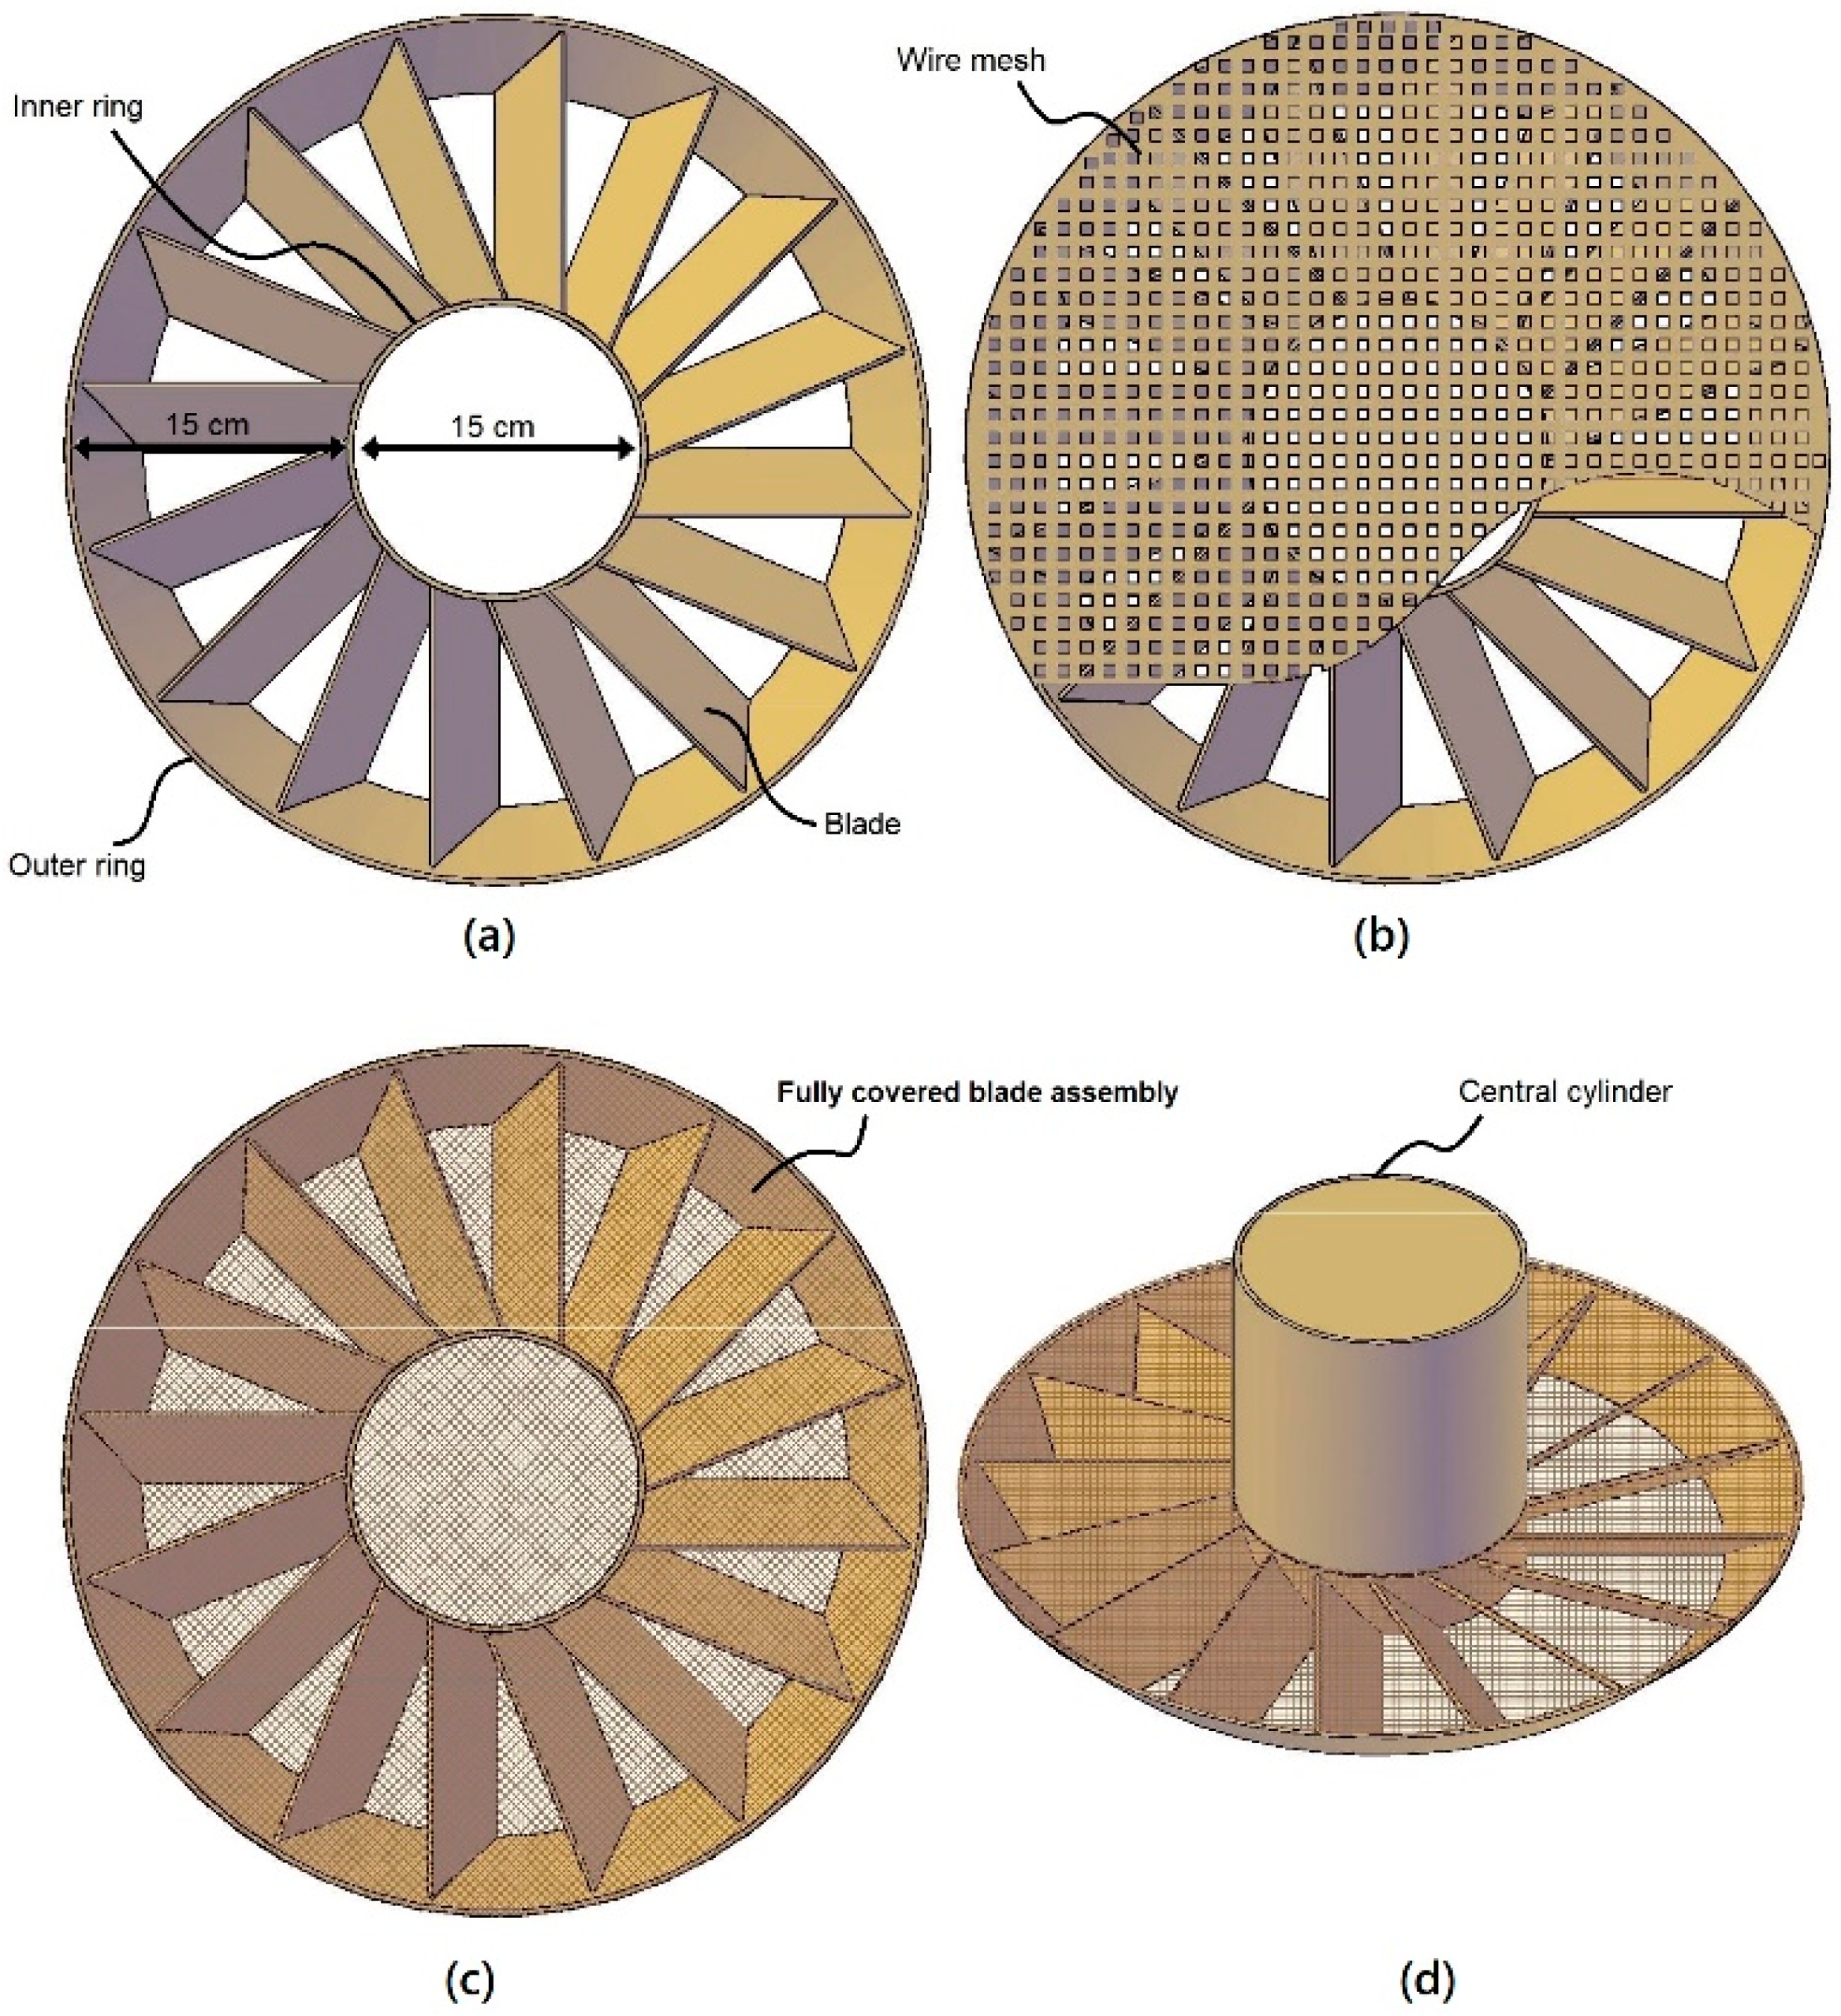
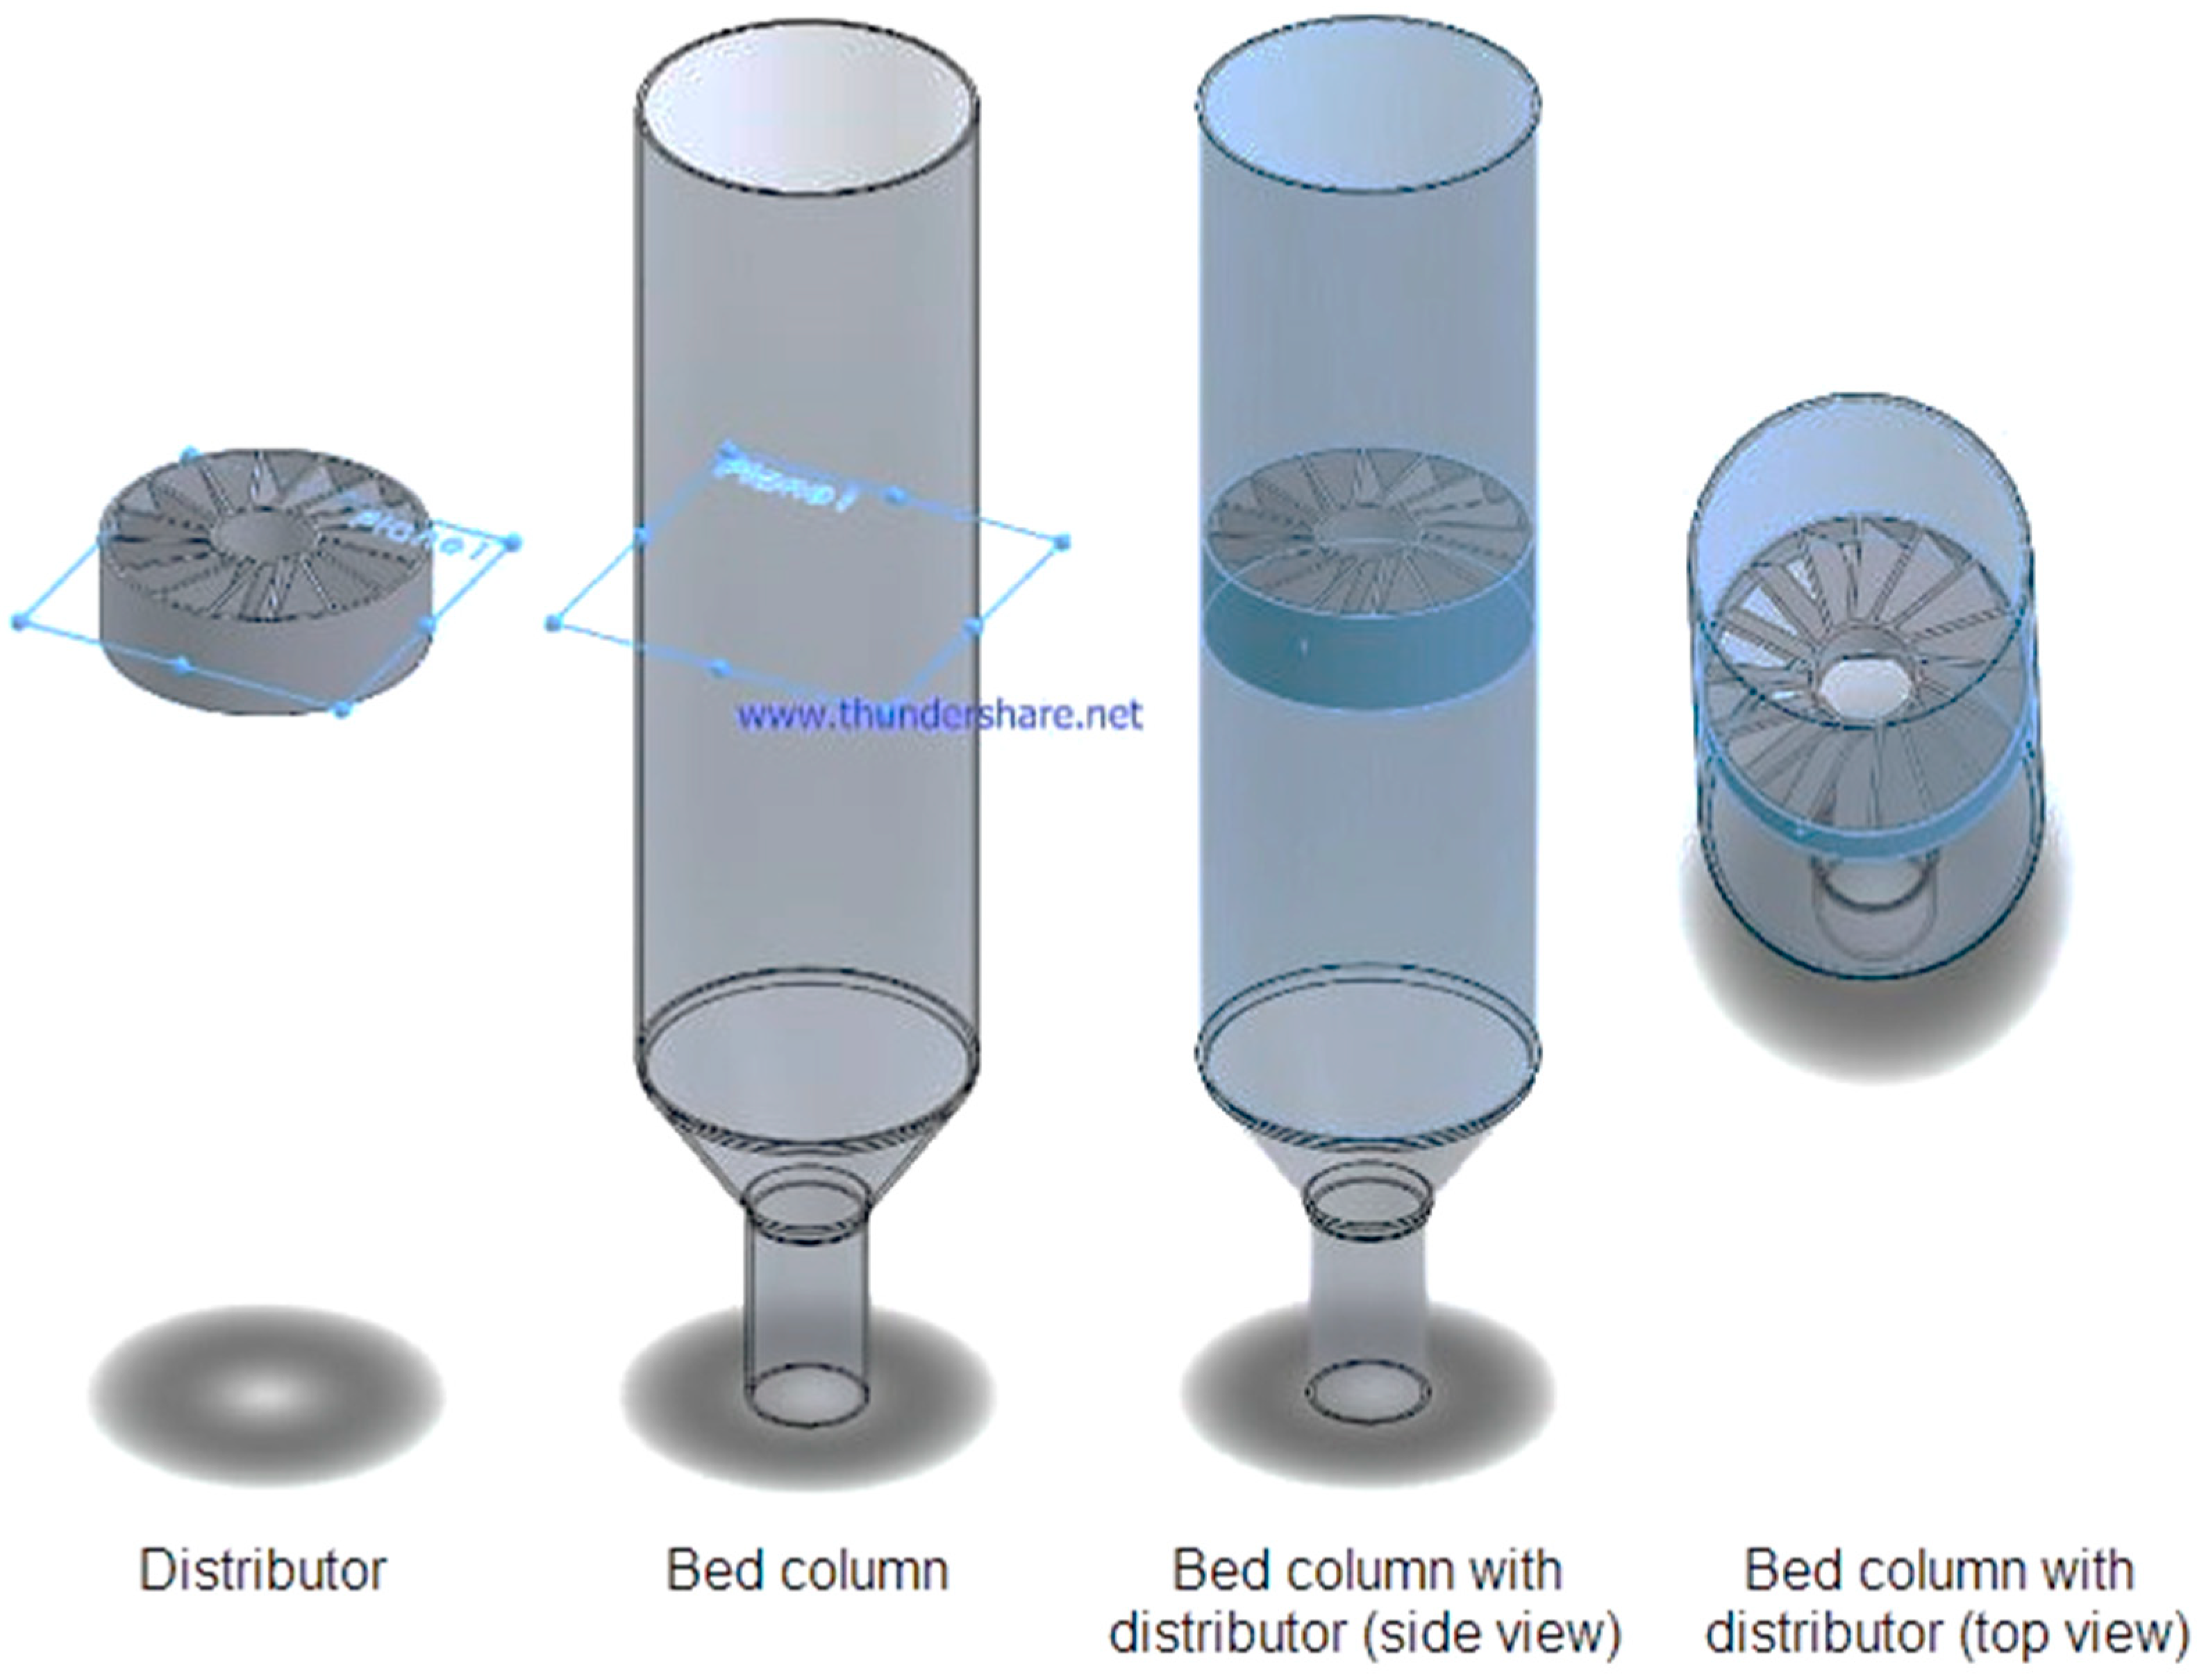
2.1. Distributor Geometry
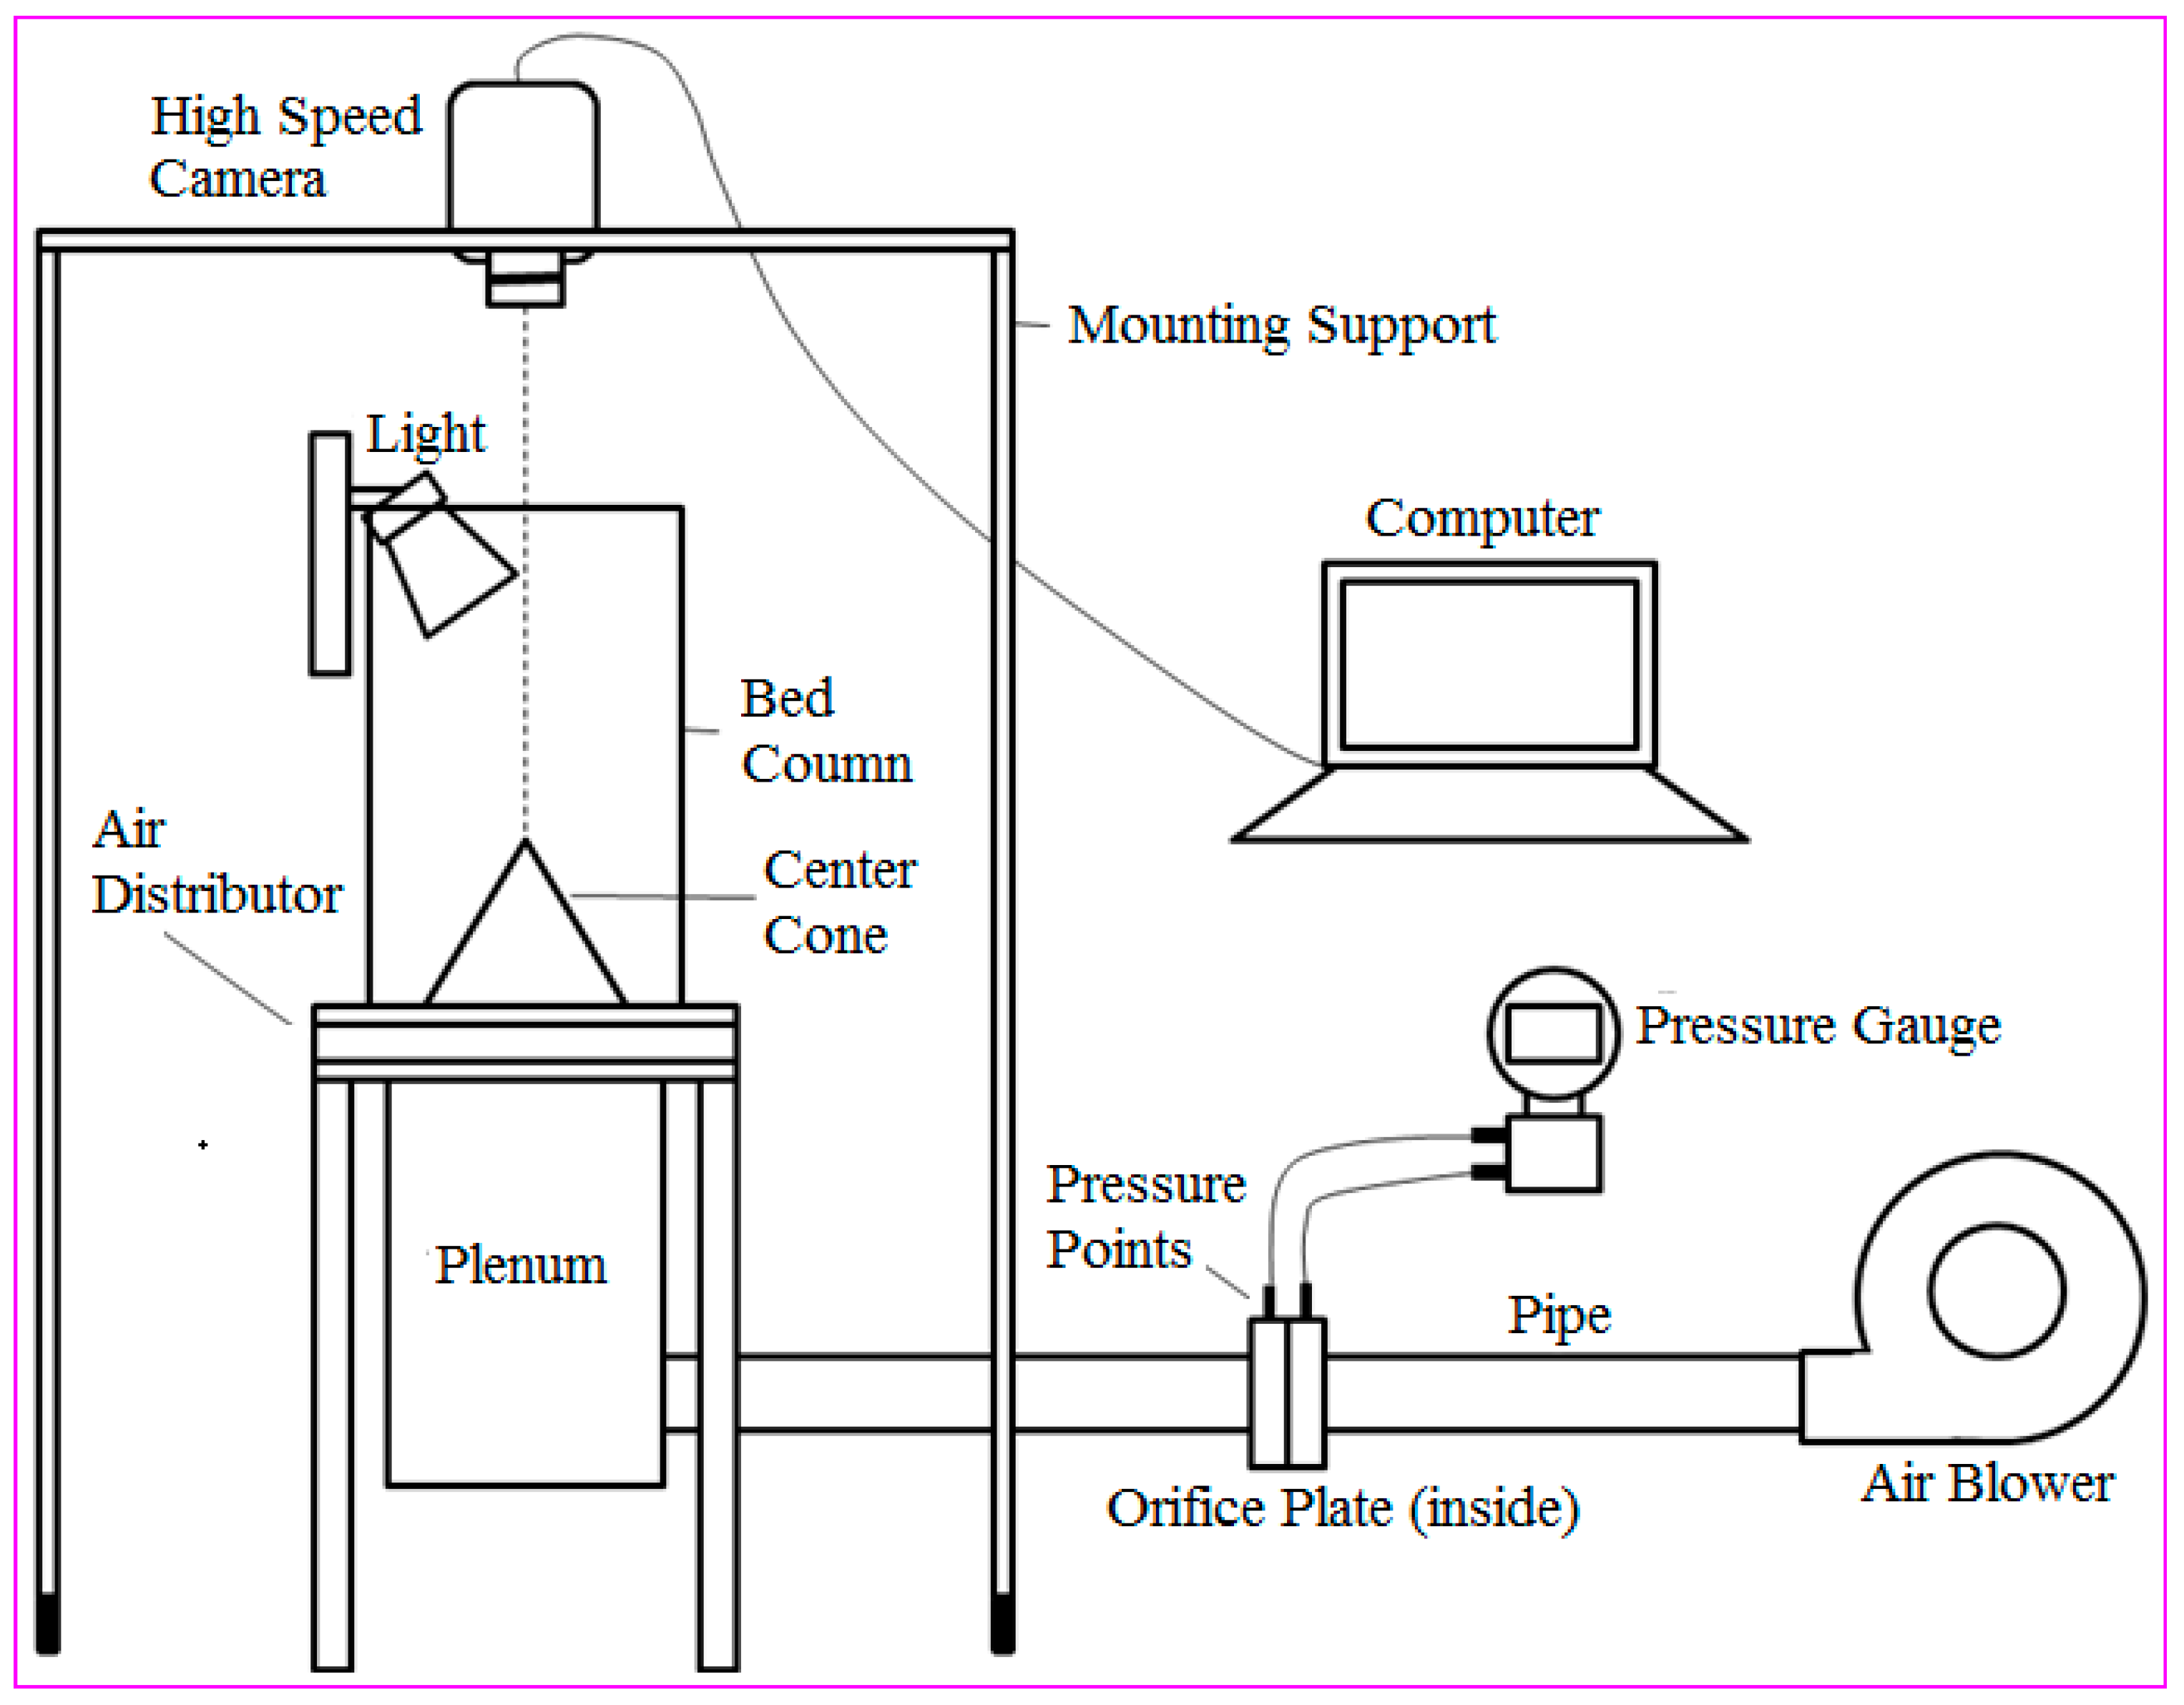
2.2. Imaging and PIV Analysis
2.3. Statistical Analysis
3. Results and Discussion
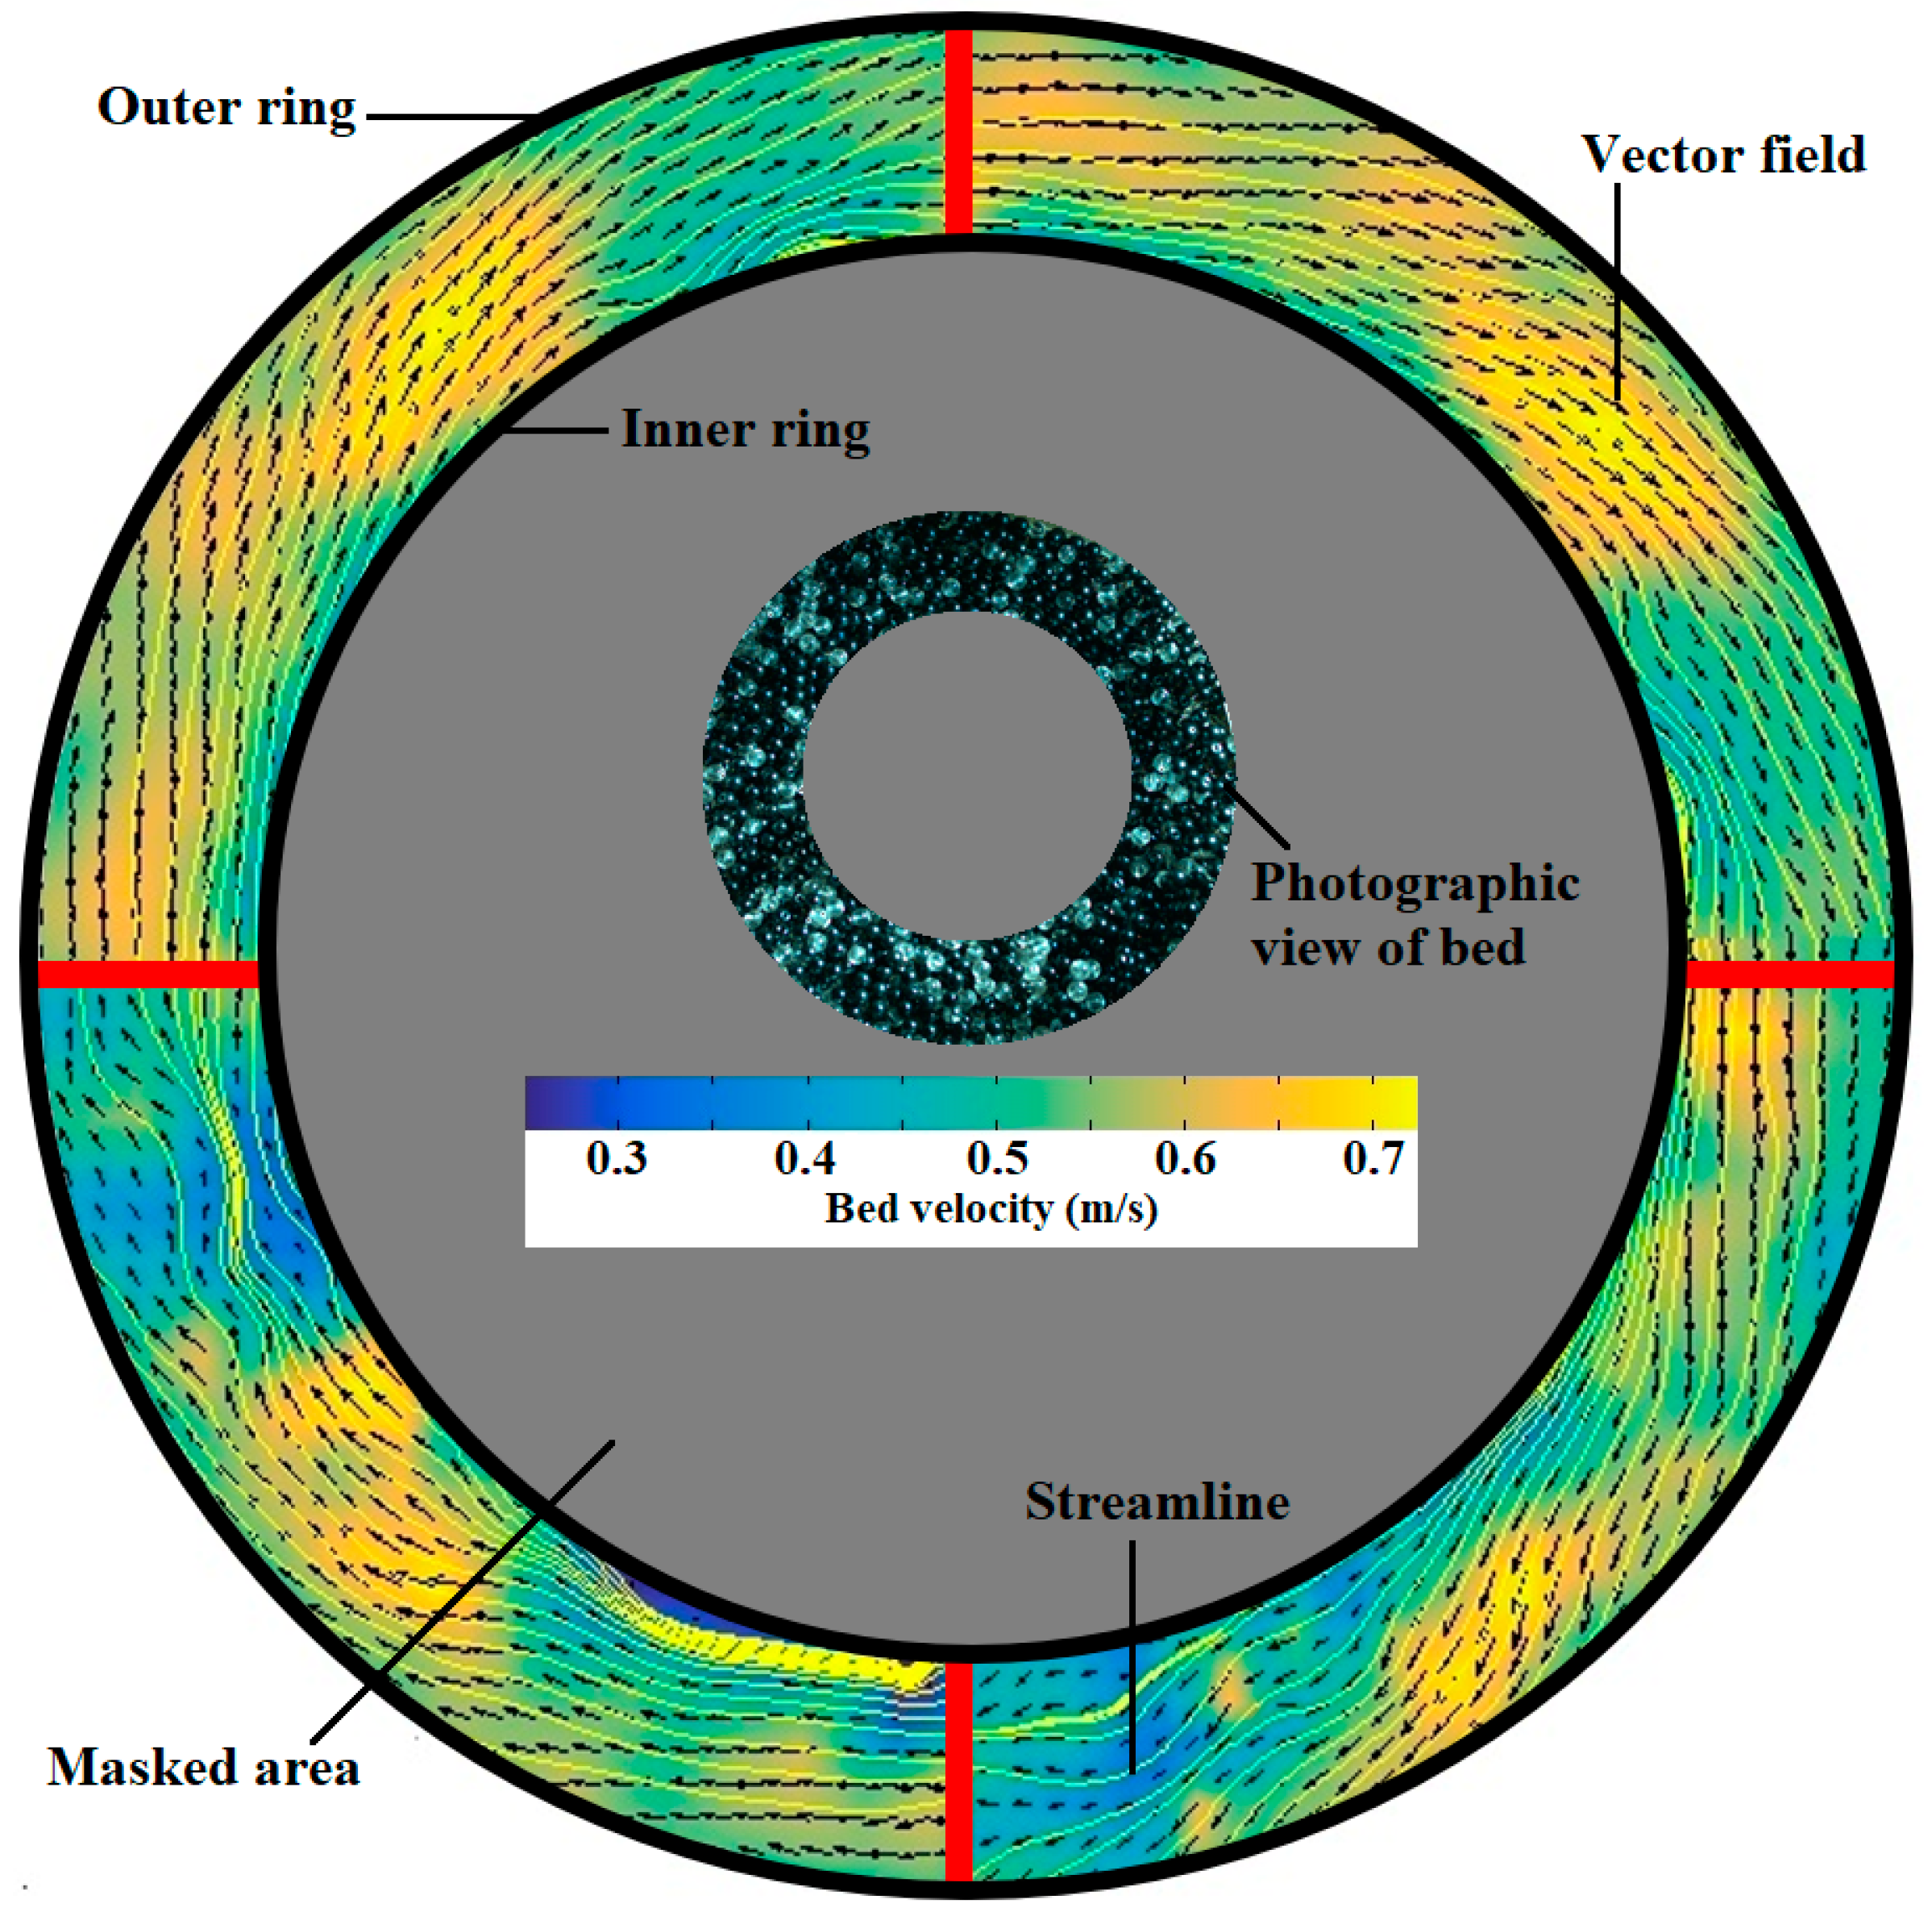
3.1. Velocity Vector Field
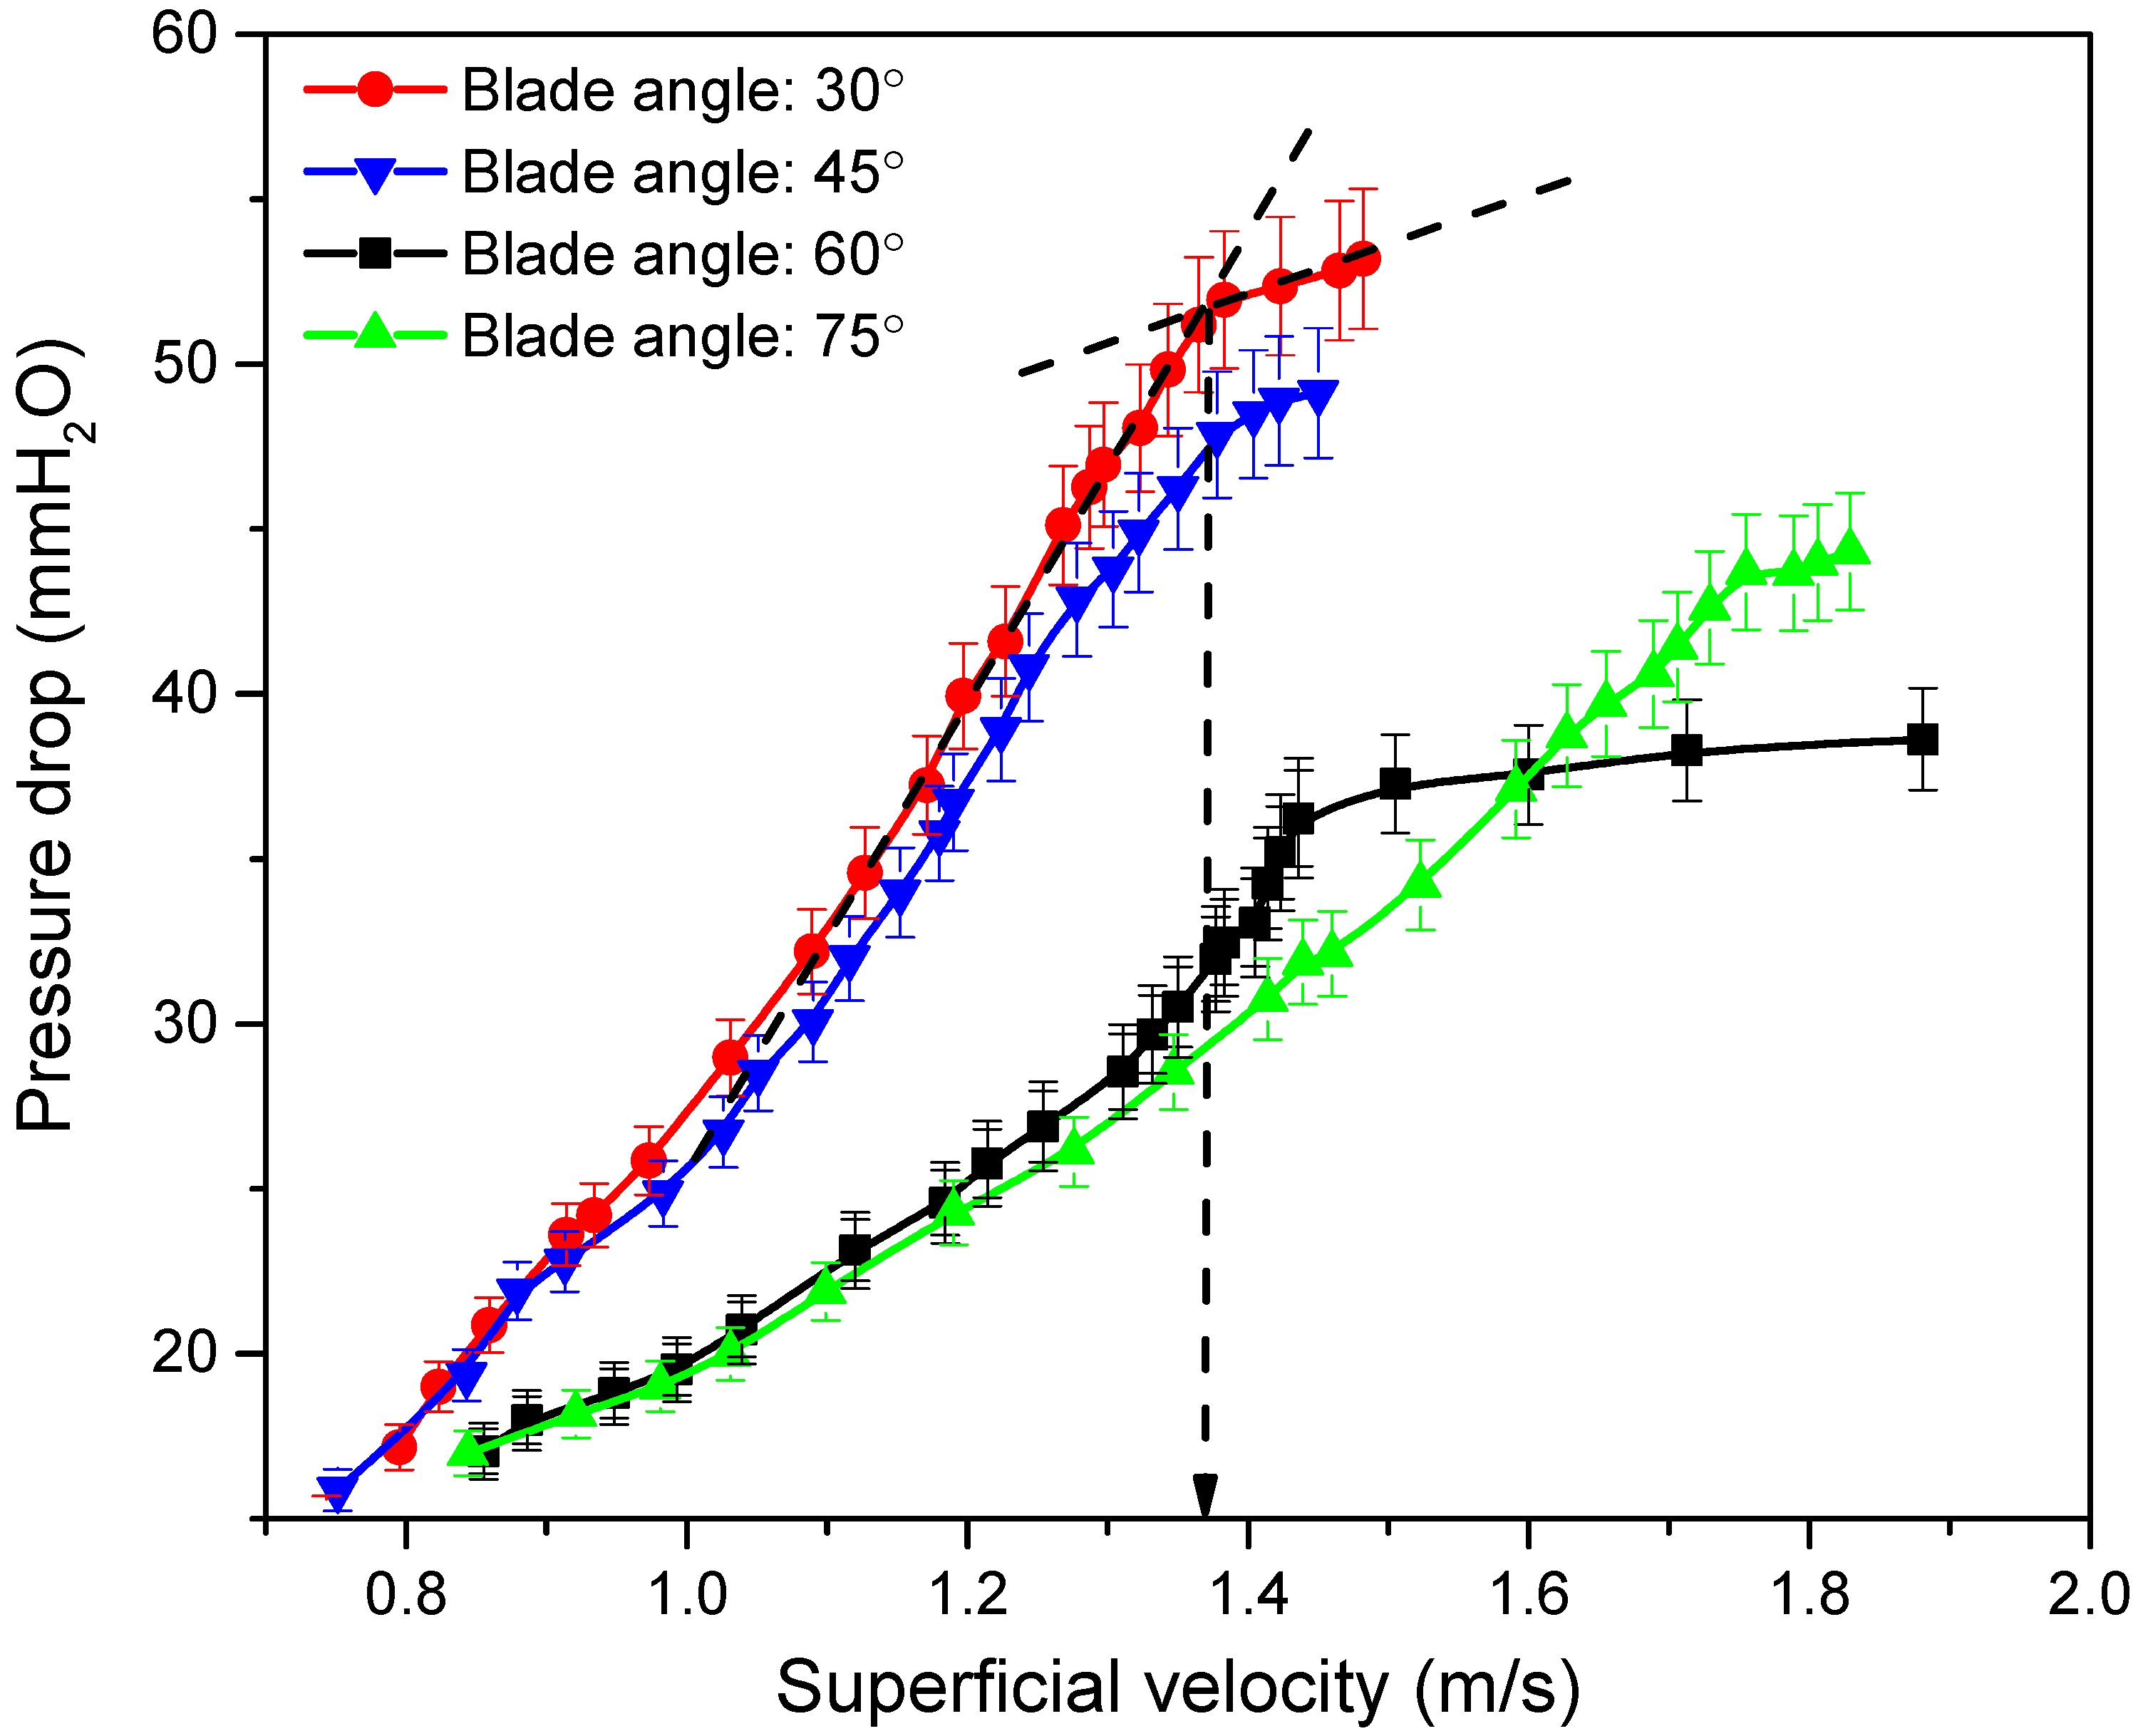
3.2. The Effect of Blade Angle on Um
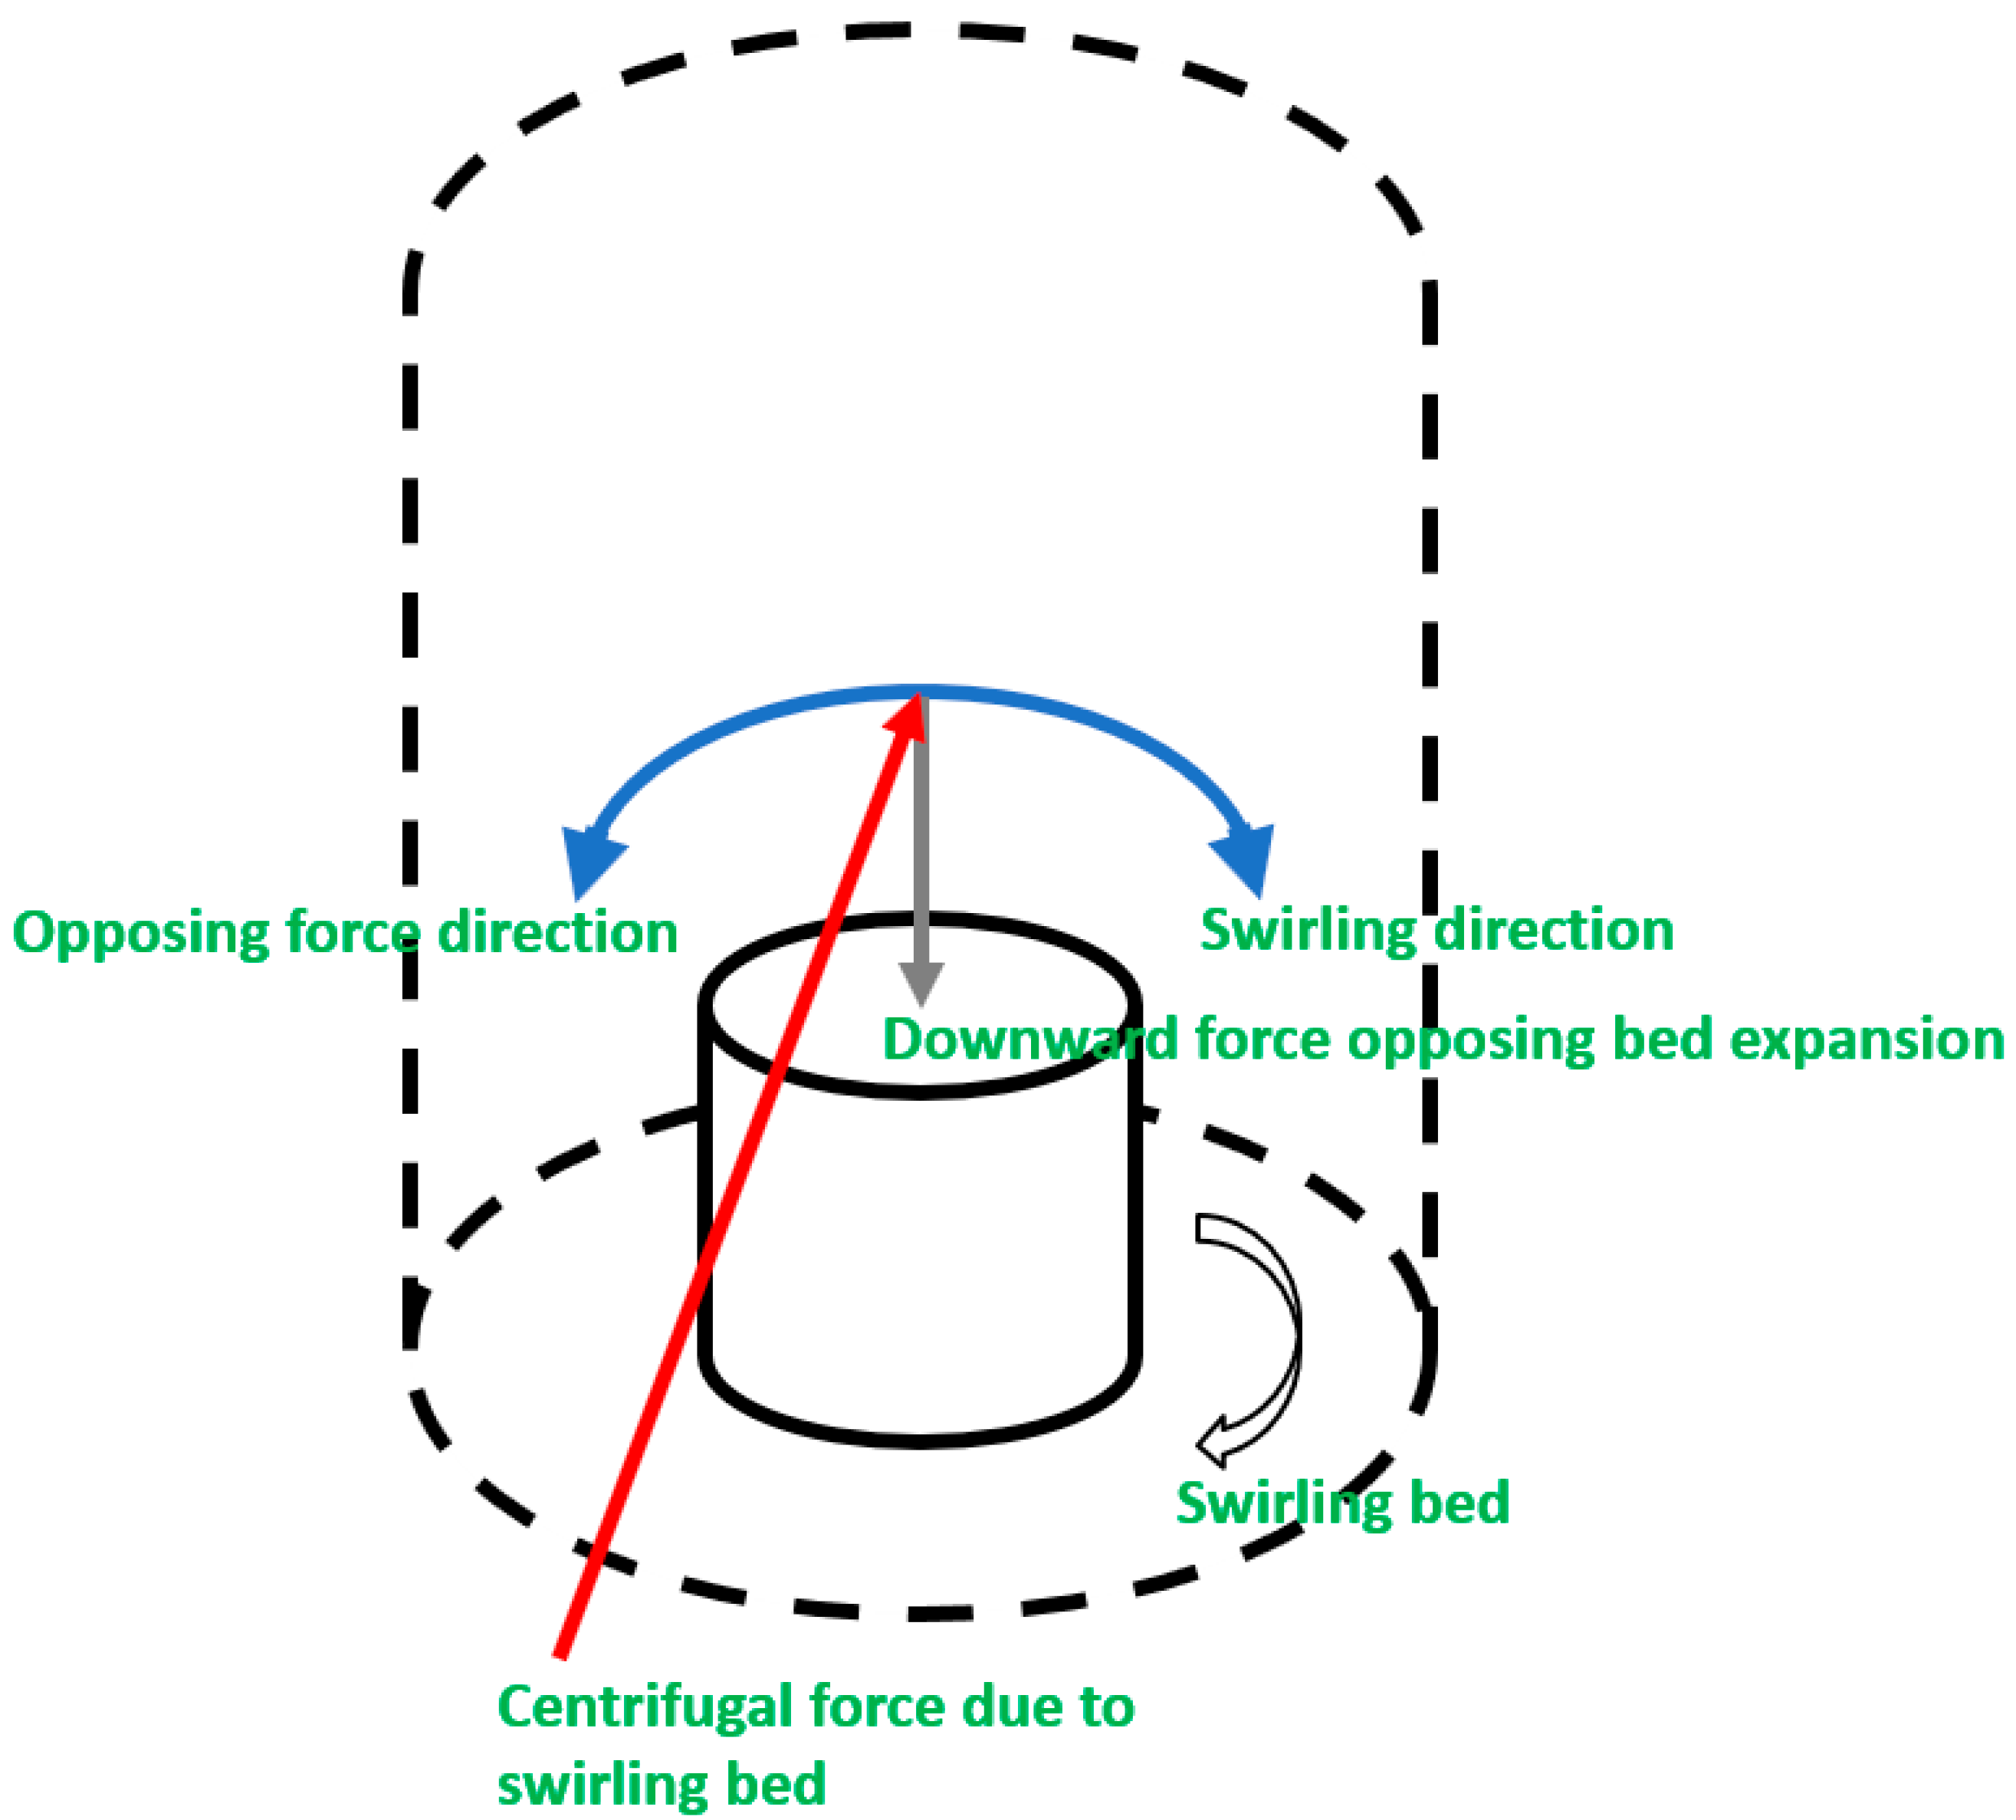
3.3. Review of SFB Parameters
3.4. Comparison of Velocimetry and Statistical Data
4. Conclusions
Author Contributions
Funding
Conflicts of Interest
References
- Naz, M.Y.; Sulaiman, S.A. PTV profiling of particles motion from the top and side of a swirling fluidized bed. J. Instrum. 2016, 11, 05019–05036. [Google Scholar] [CrossRef]
- Miin, C.S.; Sulaiman, S.A.; Raghavan, V.R.; Heikal, M.R.; Naz, M.Y. Hydrodynamics of multi-sized particles in stable regime of a swirling bed. Korean J. Chem. Eng. 2015, 32, 2361–2367. [Google Scholar] [CrossRef]
- Shukrullah, S.; Javed, M.A.; Naz, M.Y.; Khan, Y.; Alkanhal, M.A.S.; Anwar, H. PIV and Statistical Analysis of a Swirling Bed Process Carried out Using a Hybrid Model of Axial Blade Distributor. Processes 2019, 7, 697. [Google Scholar] [CrossRef]
- Aworinde, S.M.; Holland, D.J.; Davidson, J.F. Investigation of a swirling flow nozzle for a fluidised bed gas distributor. Chem. Eng. Sci. 2015, 132, 22–31. [Google Scholar] [CrossRef]
- Brown, L.F.; Fogler, H.S. Fluidized Bed Reactors, Diffusion and Reaction in Porous Catalysts. In Professional Reference Shelf; University of Michigan: Ann Arbor, MI, USA, 2008. [Google Scholar]
- Ergun, S.; Orning, A.A. Fluid flow through randomly packed columns and fluidized beds. Ind. Eng. Chem. 1949, 41, 1179–1184. [Google Scholar] [CrossRef]
- Wen, C.; Yu, Y. A generalized method for predicting the minimum fluidization velocity. Aiche J. 1966, 12, 610–612. [Google Scholar] [CrossRef]
- Chitester, D.C.; Kornosky, R.M.; Fan, L.-S.; Danko, J.P. Characteristics of fluidization at high pressure. Chem. Eng. Sci. 1984, 39, 253–261. [Google Scholar] [CrossRef]
- Shu, J.; Lakshmanan, V.I.; Dodson, C.E. Hydrodynamic Study of a Toroidal Fluidized Bed Reactor. Chem. Eng. Process. 2000, 39, 499–506. [Google Scholar] [CrossRef]
- Ouyang, F.; Levenspiel, O. Spiral distributor for fluidized beds. Ind. Eng. Chem. Process Des. Dev. 1986, 25, 504–507. [Google Scholar] [CrossRef]
- Sreenivasan, B.; Raghavan, V.R. Hydrodynamics of a Swirling Fluidized Bed. Chem. Eng. Process. 2002, 41, 99–106. [Google Scholar] [CrossRef]
- Batcha, M.F.M.; Raghavan, V.R. Experimental Studies on a Swirling Fluidized Bed with Annular Distributor. J. Appl. Sci. 2011, 11, 1980–1986. [Google Scholar] [CrossRef][Green Version]
- Kumar, S.H.; Murthy, D. Minimum superficial fluid velocity in a gas–solid swirled fluidized bed. Chem. Eng. Process. Process Intensif. 2010, 49, 1095–1100. [Google Scholar] [CrossRef]
- Rasteh, M.; Farhadi, F.; Bahramian, A. Hydrodynamic characteristics of gas–solid tapered fluidized beds: Experimental studies and empirical models. Powder Technol. 2015, 283, 355–367. [Google Scholar]
- Naz, M.Y.; Sulaiman, S.A.; Shukrullah, S.; Ghaffar, A.; Khan, Y.; Ahmad, I. PIV investigations on particle velocity distribution in uniform swirling regime of fluidization. Granul. Matter 2017, 19, 40. [Google Scholar] [CrossRef]
- Fang, C.; Hong, L. Particle image velocimetry for combustion measurements: Applications and developments. Chin. J. Aeronaut. 2018, 31, 1407–1427. [Google Scholar]
- Soto, G.; Pahuamba, E.; Ramírez, F.; Cruz-Reyes, J.; del Valle, M.; Tiznado, H. Swirling fluidized bed plasma reactor for the preparation of supported nanoparticles. Revista Mexicana de Ingeniería Química 2019, 19, 867–875. [Google Scholar] [CrossRef]
- Naz, M.Y.; Shukrullah, S.; Sulaiman, S.A.; Khan, Y.; Alkanhal, M.A.S.; Ghaffar, A. Particle image velocimetry analysis of a swirling bed operation by using a mesh-coupled annular air distributor. J. Braz. Soc. Mech. Sci. Eng. 2019, 41, 366. [Google Scholar] [CrossRef]
- Rahimpour, F.; Zarghami, R.; Mostoufi, N. Effect of distributor on fluidized bed hydrodynamics. Can. J. Chem. Eng. 2017, 95, 2221–2234. [Google Scholar]
- He, H.; Lu, X.; Shuang, W.; Wang, Q.; Kang, Y.; Yan, L.; Liu, H. Statistical and frequency analysis of the pressure fluctuation in a fluidized bed of non-spherical particles. Particuology 2014, 16, 178–186. [Google Scholar] [CrossRef]
- Naz, M.Y.; Sulaiman, S.A.; Bou-Rabee, M.A. Particle tracking velocimetry investigations on density dependent velocity vector profiles of a swirling fluidized bed. Dry. Technol. 2017, 35, 193–202. [Google Scholar] [CrossRef]
- Josephkunju, P.C. Influence of Angle of Air Injection and Particles in Bed Hydrodynamics of Swirling Fluidized Bed. Ph.D. Thesis, School of Engineering, Cochin University of Science and Technology, Kochi, India, 2008; pp. 1–171. [Google Scholar]
- Venkiteswaran, V.K.; Jun, C.J.; Sing, C.Y.; Sulaiman, S.A.; Raghavan, V.R. Variation of bed pressure drop with particle shapes in a swirling fluidized bed. J. Appl. Sci. 2013, 12, 2598–2603. [Google Scholar] [CrossRef]
- Faizal, M.; Batcha, M.; Salleh, H.; Raghavan, V.R. Studies on Biomass Drying Apparatus Using Swirling Fluidization Technique. In Proceedings of the 3rd Malaysian Technical Universities Conference on Engineering and Technology, Kuantan, Malaysia, 20–22 June 2009. [Google Scholar]
- Rees, A.C.; Davidson, J.F.; Dennis, J.S.; Fennell, P.S.; Gladden, L.F.; Hayhurst, A.N.; Sederman, A.J. The nature of the flow just above the perforated plate distributor of a gas-fluidised bed, as imaged using magnetic resonance. Chem. Eng. Sci. 2006, 61, 6002–6015. [Google Scholar] [CrossRef]
- Akbari, V.; Borhani, T.N.G.; Godini, H.R.; Hamid, M.K.A. Modelbased analysis of the impact of the distributor on the hydrodynamic performance of industrial polydisperse gas phase fluidized bed polymerization reactors. Powder Technol. 2004, 267, 398–411. [Google Scholar] [CrossRef]
- Yudin, A.S.M.; Anuar, S.; Oumer, A.N. Improvement on particulate mixing through inclined slotted swirling distributor in a fluidized bed: An experimental study. Adv. Powder Technol. 2016, 27, 2102–2111. [Google Scholar] [CrossRef]
- Fernández-Pérez, M.; Garrido-Herrera, F.J.; González-Pradas, E.; Villafranca-Sánchez, M.; Flores-Céspedes, F. Lignin and ethylcellulose as polymers in controlled release formulations of urea. J. Appl. Polym. Sci. 2008, 108, 3796–3803. [Google Scholar] [CrossRef]
- Sulaiman, S.A.; Miin, C.S.; Naz, M.Y.; Raghavan, V.R. Particle Image Velocimetry of a Swirling Fluidized Bed at Different Blade Angles. Chem. Eng. Technol. 2016, 39, 1151–1160. [Google Scholar] [CrossRef]


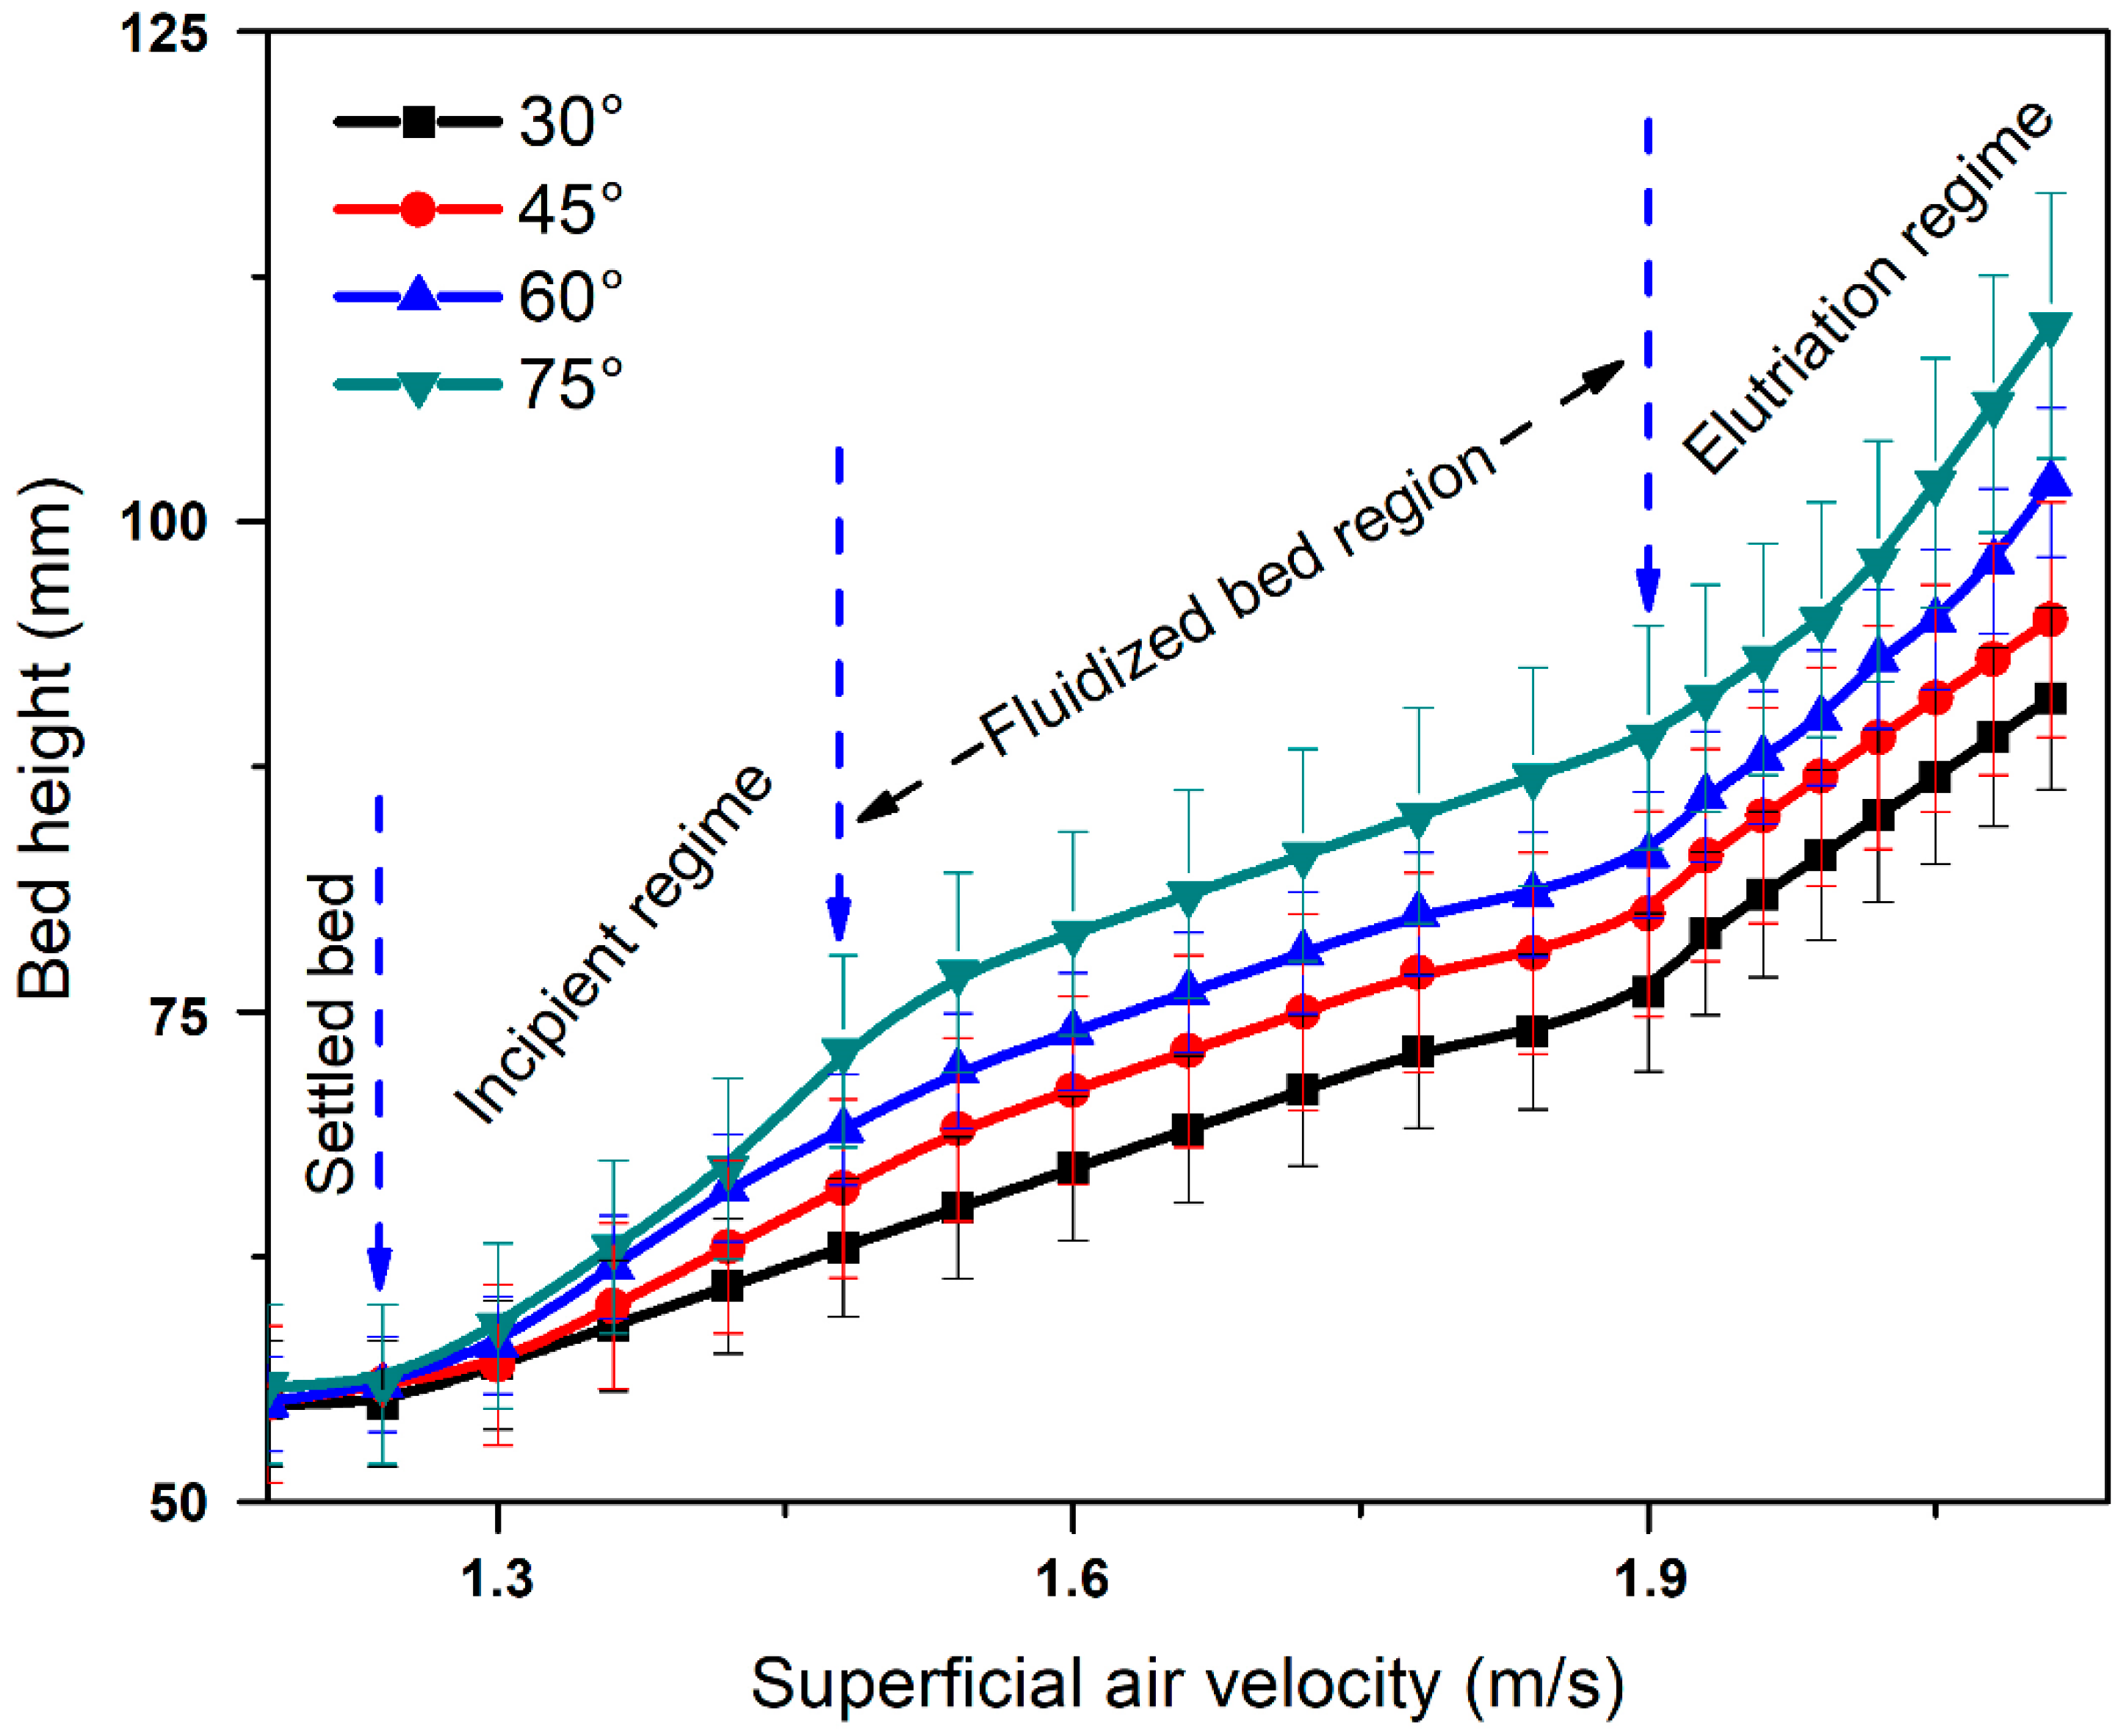
| Fluidizing Regime | Fluid Velocity | Features | Notes |
|---|---|---|---|
| Settled bed | 0 < U < Um | Particles are quiescent. Air flows through interstices. Follows Darcy′s law. | |
| Particulate regime | U < Um < Ub | Bed expends homogeneously. Surface is well-defined. Pressure drop is steady | This regime was missing in case of large particles. |
| Bubbling regime | Ub < U < Us | Voids form near the air distributor. The voids rise and grow in the form of bubbles. Pressure drop fluctuates by the passage of bubbles | Bubbling, slugging, turbulent and fast regimes are often collectively called aggregative fluidization. |
| Slugging regime | Us < U < Uu | Bubbles nearly fill the cross-section of the bed. Bed diameter and depth will affect the fluidization. Pressure drop fluctuates vigorously. | Amplitude of the pressure fluctuation can be as high as 80% of the average pressure drop; this regime may not exist for shallow beds. |
| Uniform swirling regime | Uu < U < Ut | Bubbles disappear and bed material start to swirl | Most of the industrial process with SFBs are carried out in this regime. |
| Turbulent regime | Ut < U < Ue | Small cavities and particle clusters move to and fro. It is difficult to distinguish the bed surface. Local mixing is intensive. | |
| Elutriation regime | Ue < U | Particles are transported out of the bed | Used to separate particles of different sizes. |
| Reference | Distributor | Parameters | Findings |
|---|---|---|---|
| Rahimpour et al. [19]. | Perforated Plate | Time, frequency and space domains, superficial air velocity, pressure drop | Distributor underperforms in case of fine particles, especially at low superficial velocity. Low pressure fluctuations were observed. |
| Rees et al. [25] | Perforated Plate | Superficial air velocity, pressure drop | Voids or bubble streams were observed even at U < Um. Dead zones were formed between the orifices of distributor. Jet length was increased with an increase in U/Um ratio. |
| Akbari et al. [26] | Perforated Plate | Drag coefficient, time step, number of nodes and specularity coefficient in CFD | The distributor configuration affects the bed flow parameters. Fluidization starts with bubbles, which disturb the flow field. Better gas–solid mixing was observed above the entrance region due to jet formation. Some dead zones were also seen in the bed. |
| Rahimpour et al. [19]. | Porous plate | Time, frequency and space domains, superficial air velocity, pressure drop | The bubble clustering rate was very large, although the pressure drop across porous plate was double than the pressure drop across a perforated distributor. |
| Yudin et al. [27] | Inclined slotted | Particulate mixing and uniform fluidization | swirling motion resulted in uniform mixing of particles. The swirling flow pattern was obvious for shallow beds while two-layers motion was observed in case of deep beds. |
| Sánchez-Prieto et al. [28] | Bubble cap | Temperature, pressure drop, air flow | The pressure drop was high due to small discharge coefficient. The bed hydrodynamics were affected by the operating temperature. |
| Aworinde et al. [4,5] | Nozzle | Superficial air velocity, pressure drop | The lateral dispersion promoted by the swirl of nozzle, which caused better gas–solid contact. Smaller and less frequent bubbles were produced in the bed. The pressure drop was higher due to swirl in the helix and secondary flow friction. The drawbacks included higher operating cost and energy consumption. |
| Akbari et al. [26] | Sparger | Entrance region hydrodynamics, time step, drag coefficient, number of node, and specularity coefficient | The flow structure significantly affected by the entrance configuration. The flow field was homogeneous with smaller bubble sizes through the bed. Dead zones were spotted at the corners of the sparger distributor due to particles clustering. |
| Kumar and Murthy [13] | Swirled fluidized bed | The inlet diameter, number of inlets, settled bed height, diameter of column, properties of bed material | A swirl flow in bed material was achieved by the tangential flow of air via multiple fluid inlets, located at the base of bed column. The minimum swirl velocities were measured about 1.2–1.3 times the Um of conventional fluidized beds. The pressure drop across the bed decreased due to larger opening areas between the blades. |
| Josephkunju [22] | Annular distributor | Particle size, particle density, blade inclination angle | Pressure drop increased along radial direction until 90 mm. Pressure drop decreased for larger blade angles. Pressure drop showed inverse relationship with diameter and size of particles. |
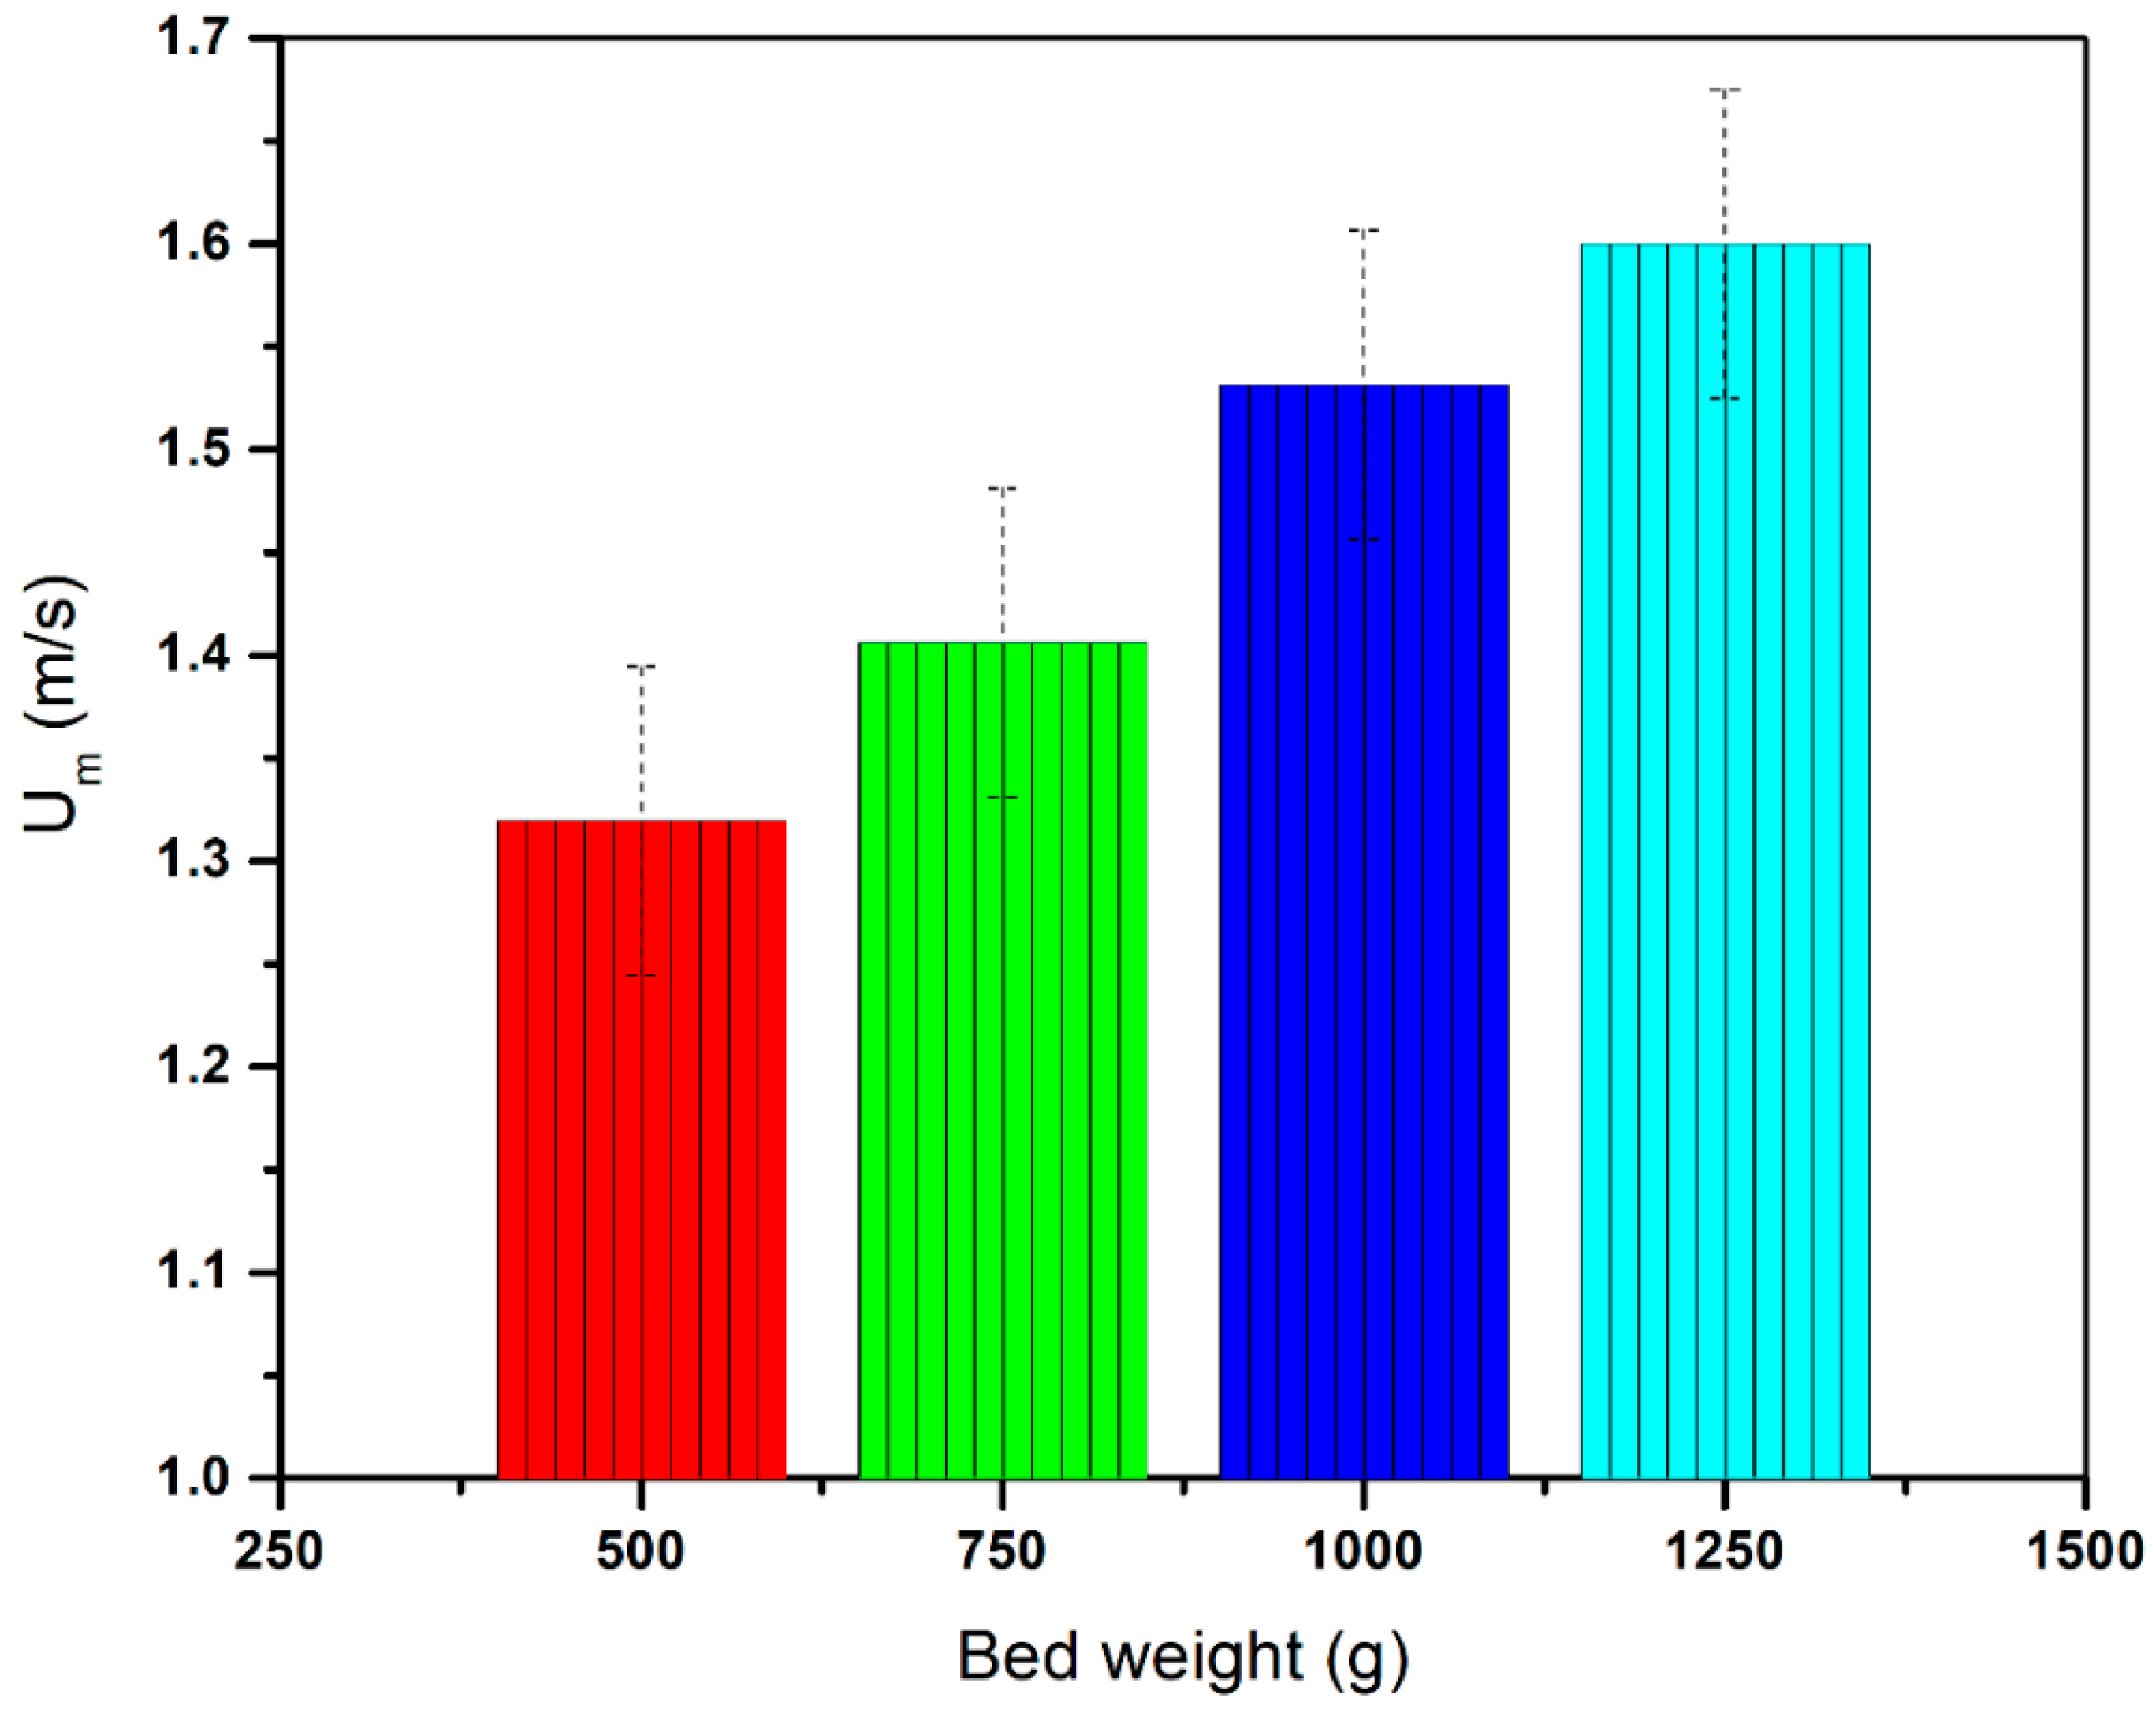
| Venkiteswaran et al. [23] | Annular distributor | Particle shape, pressure drop, bed weight, superficial air velocity | The pressure drop increase with bed weight. The highest pressure drop was measured for spherical shape. The pressure drop kept on increasing even after incipient fluidization due to centrifugal weight of bed material. |
| Naz et al. [15] | Annular distributor | Pressure drop, blade fin angle, superficial velocity, blade angle | Bed velocity exhibited Gaussian distribution on radial line. The optimized superficial velocity was 2.3 m/s. No bubbles were found in the bed due to swirling motion. Fall back of particles into the plenum chamber was a major drawback of the setup. |
| Sulaiman et al. [29] | Annular distributor | Distributor pressure, blade angle, superficial air velocity, particle shape, bed weight | The bed velocity increases with an superficial velocity and decreases with bed weight. Gaussian distribution of bed velocity was observed. A 3° increase in angle caused 18% decrease in particle velocity. |
| Batcha and Raghavan [12] | Annular distributor | Number of blades, blade angle, bed velocity, pressure drop | An annular assembly of 30 blades with inclination angle of 10° was found as an optimum configuration. Variations in pressure drop were nominal. |
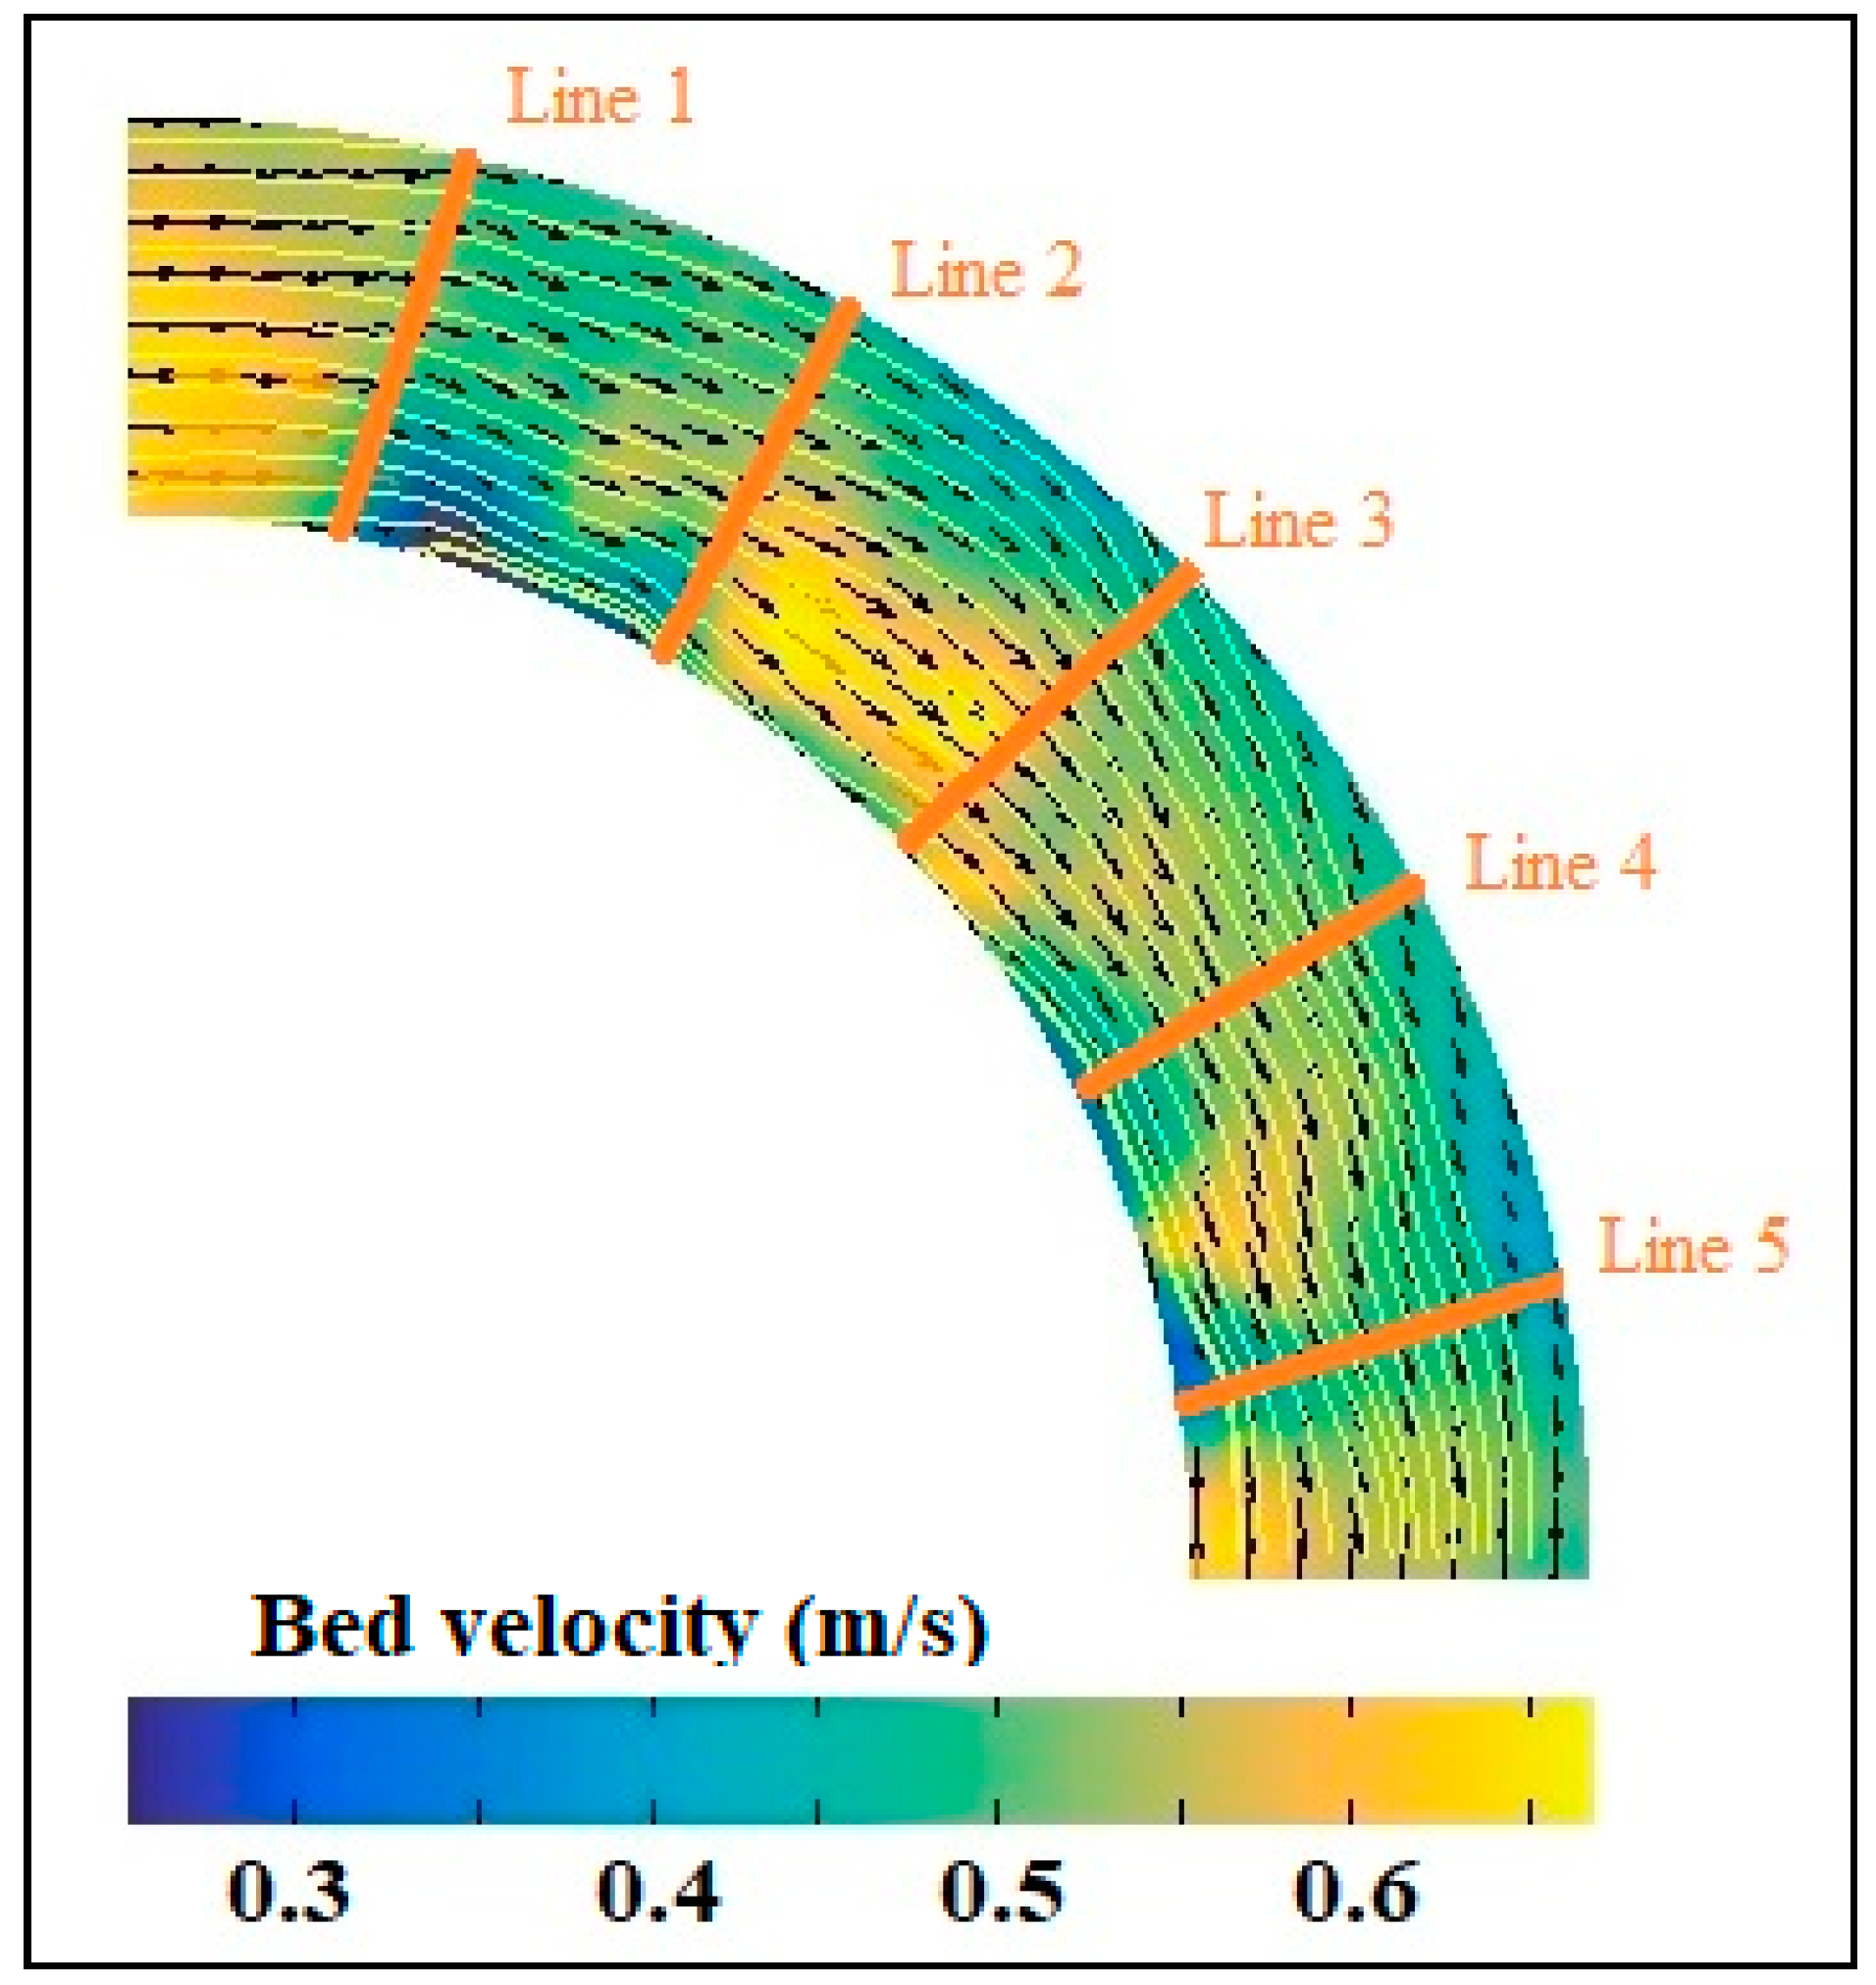
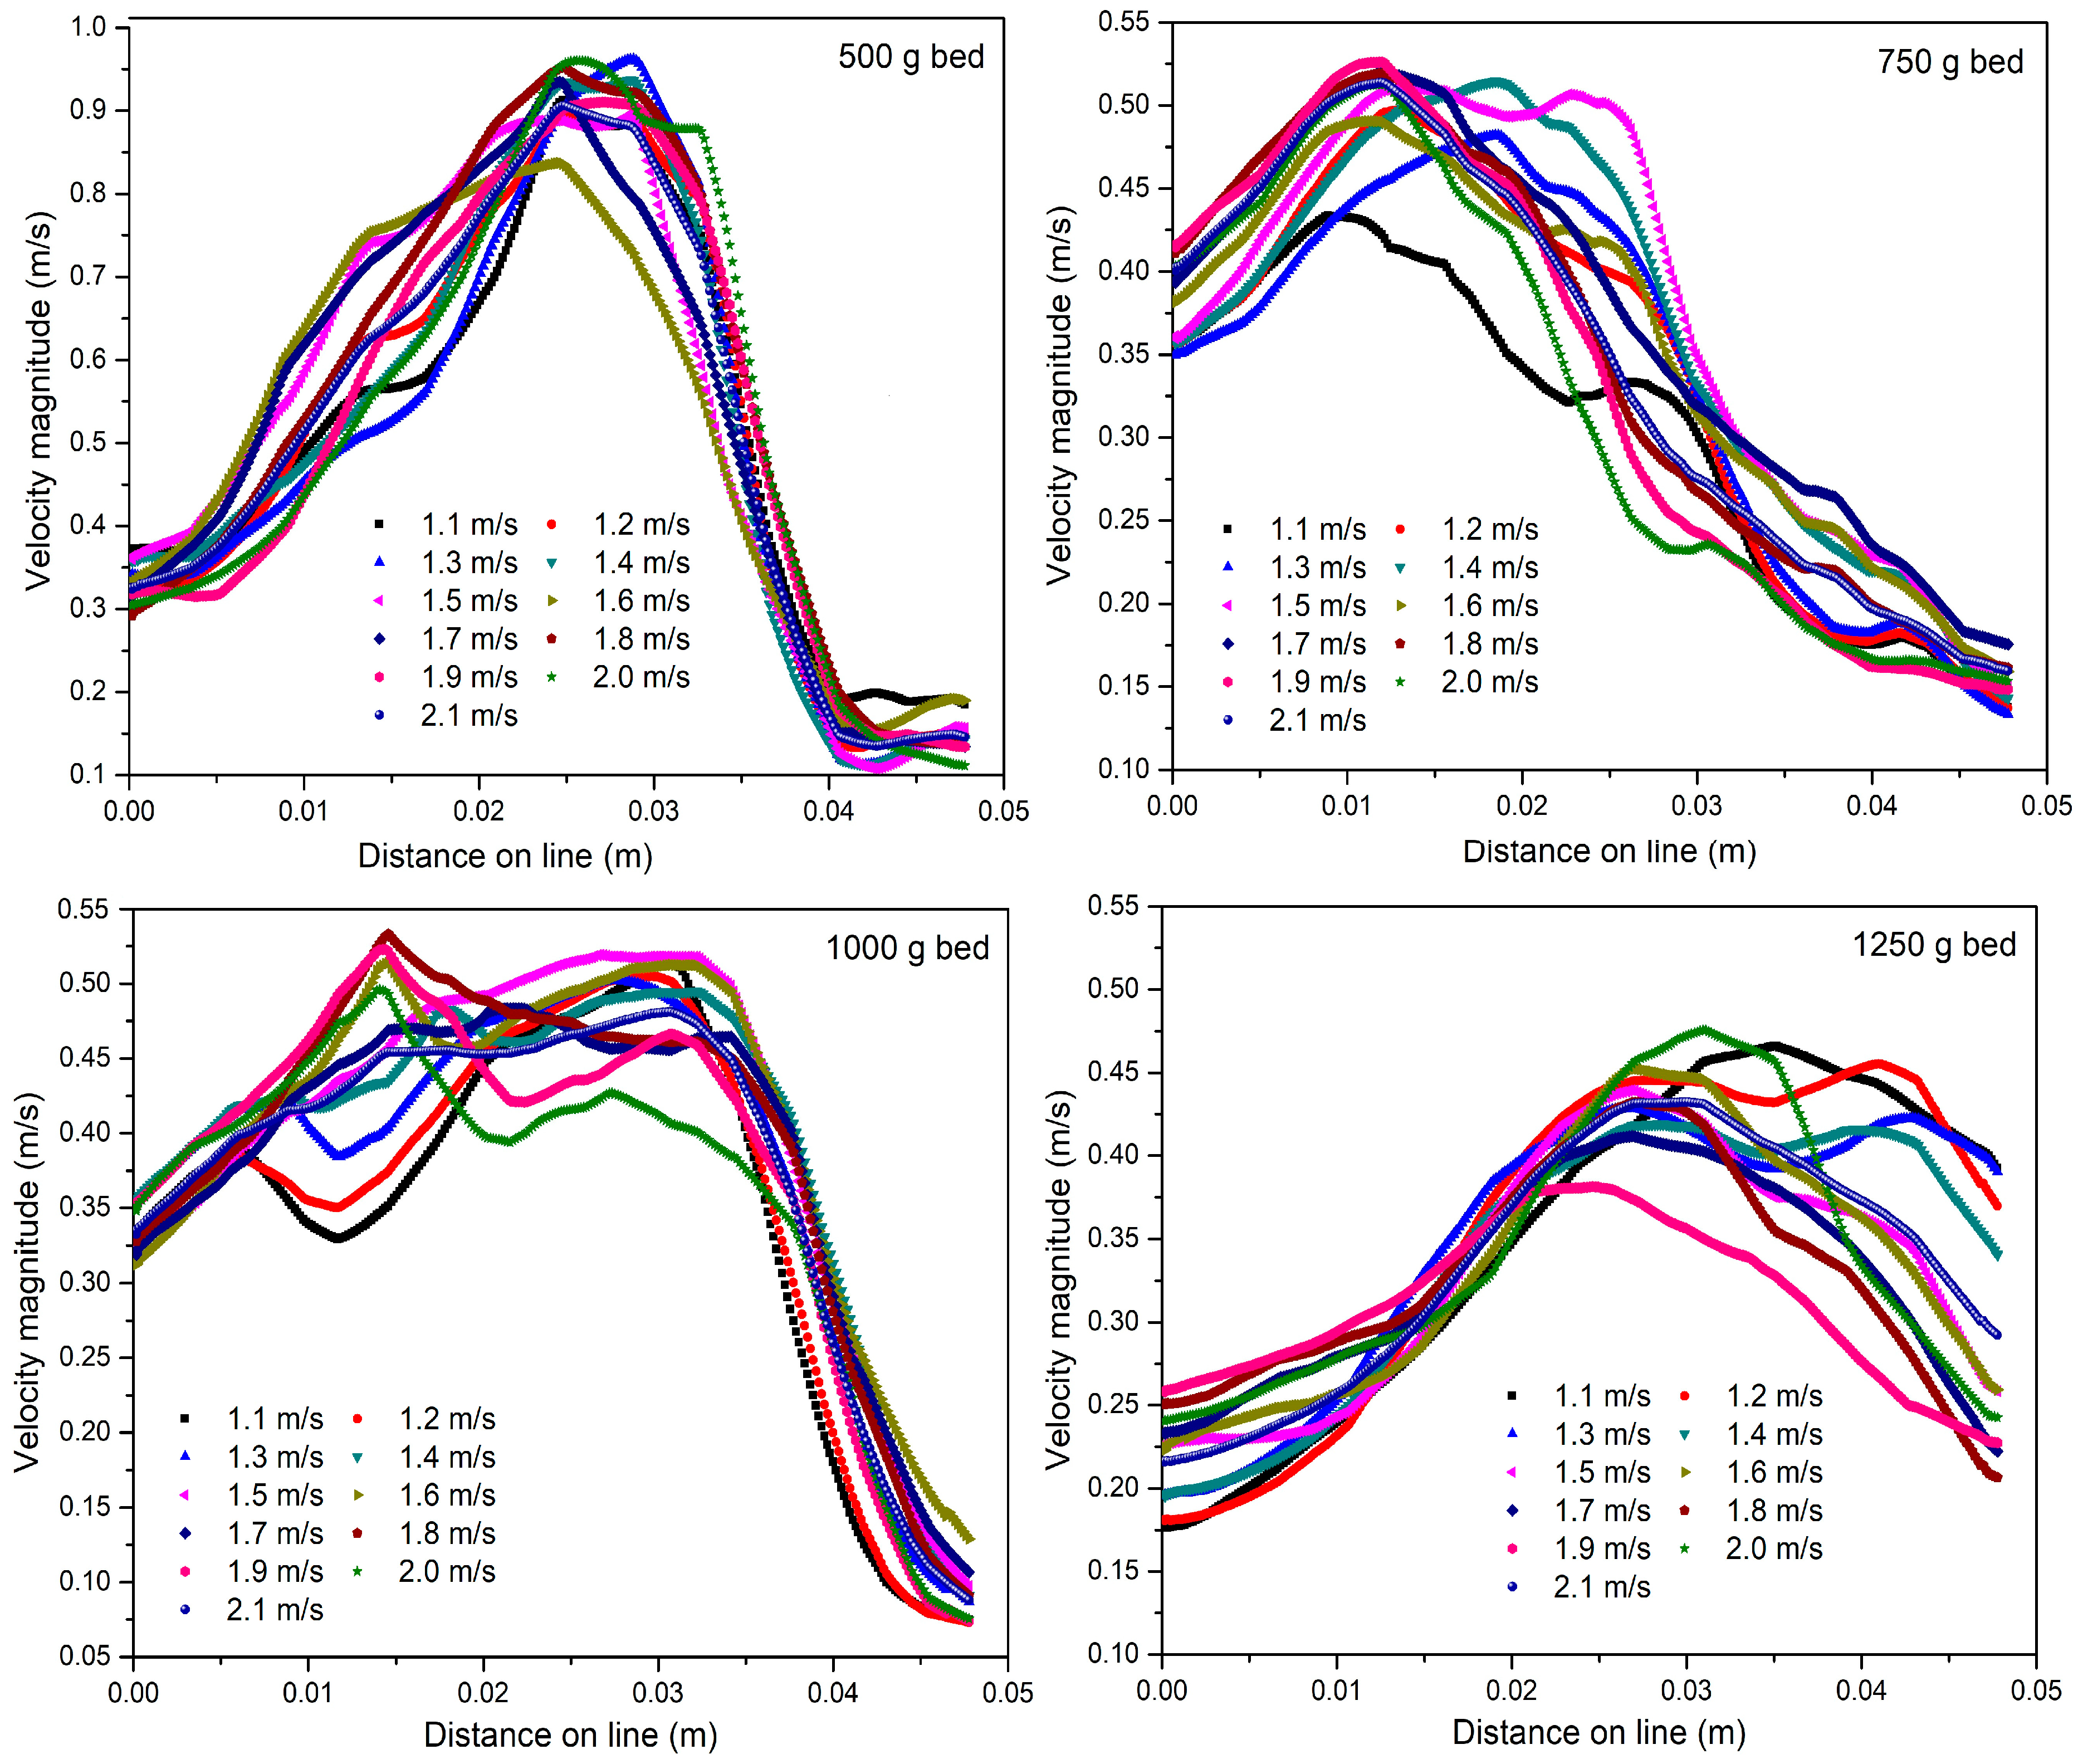
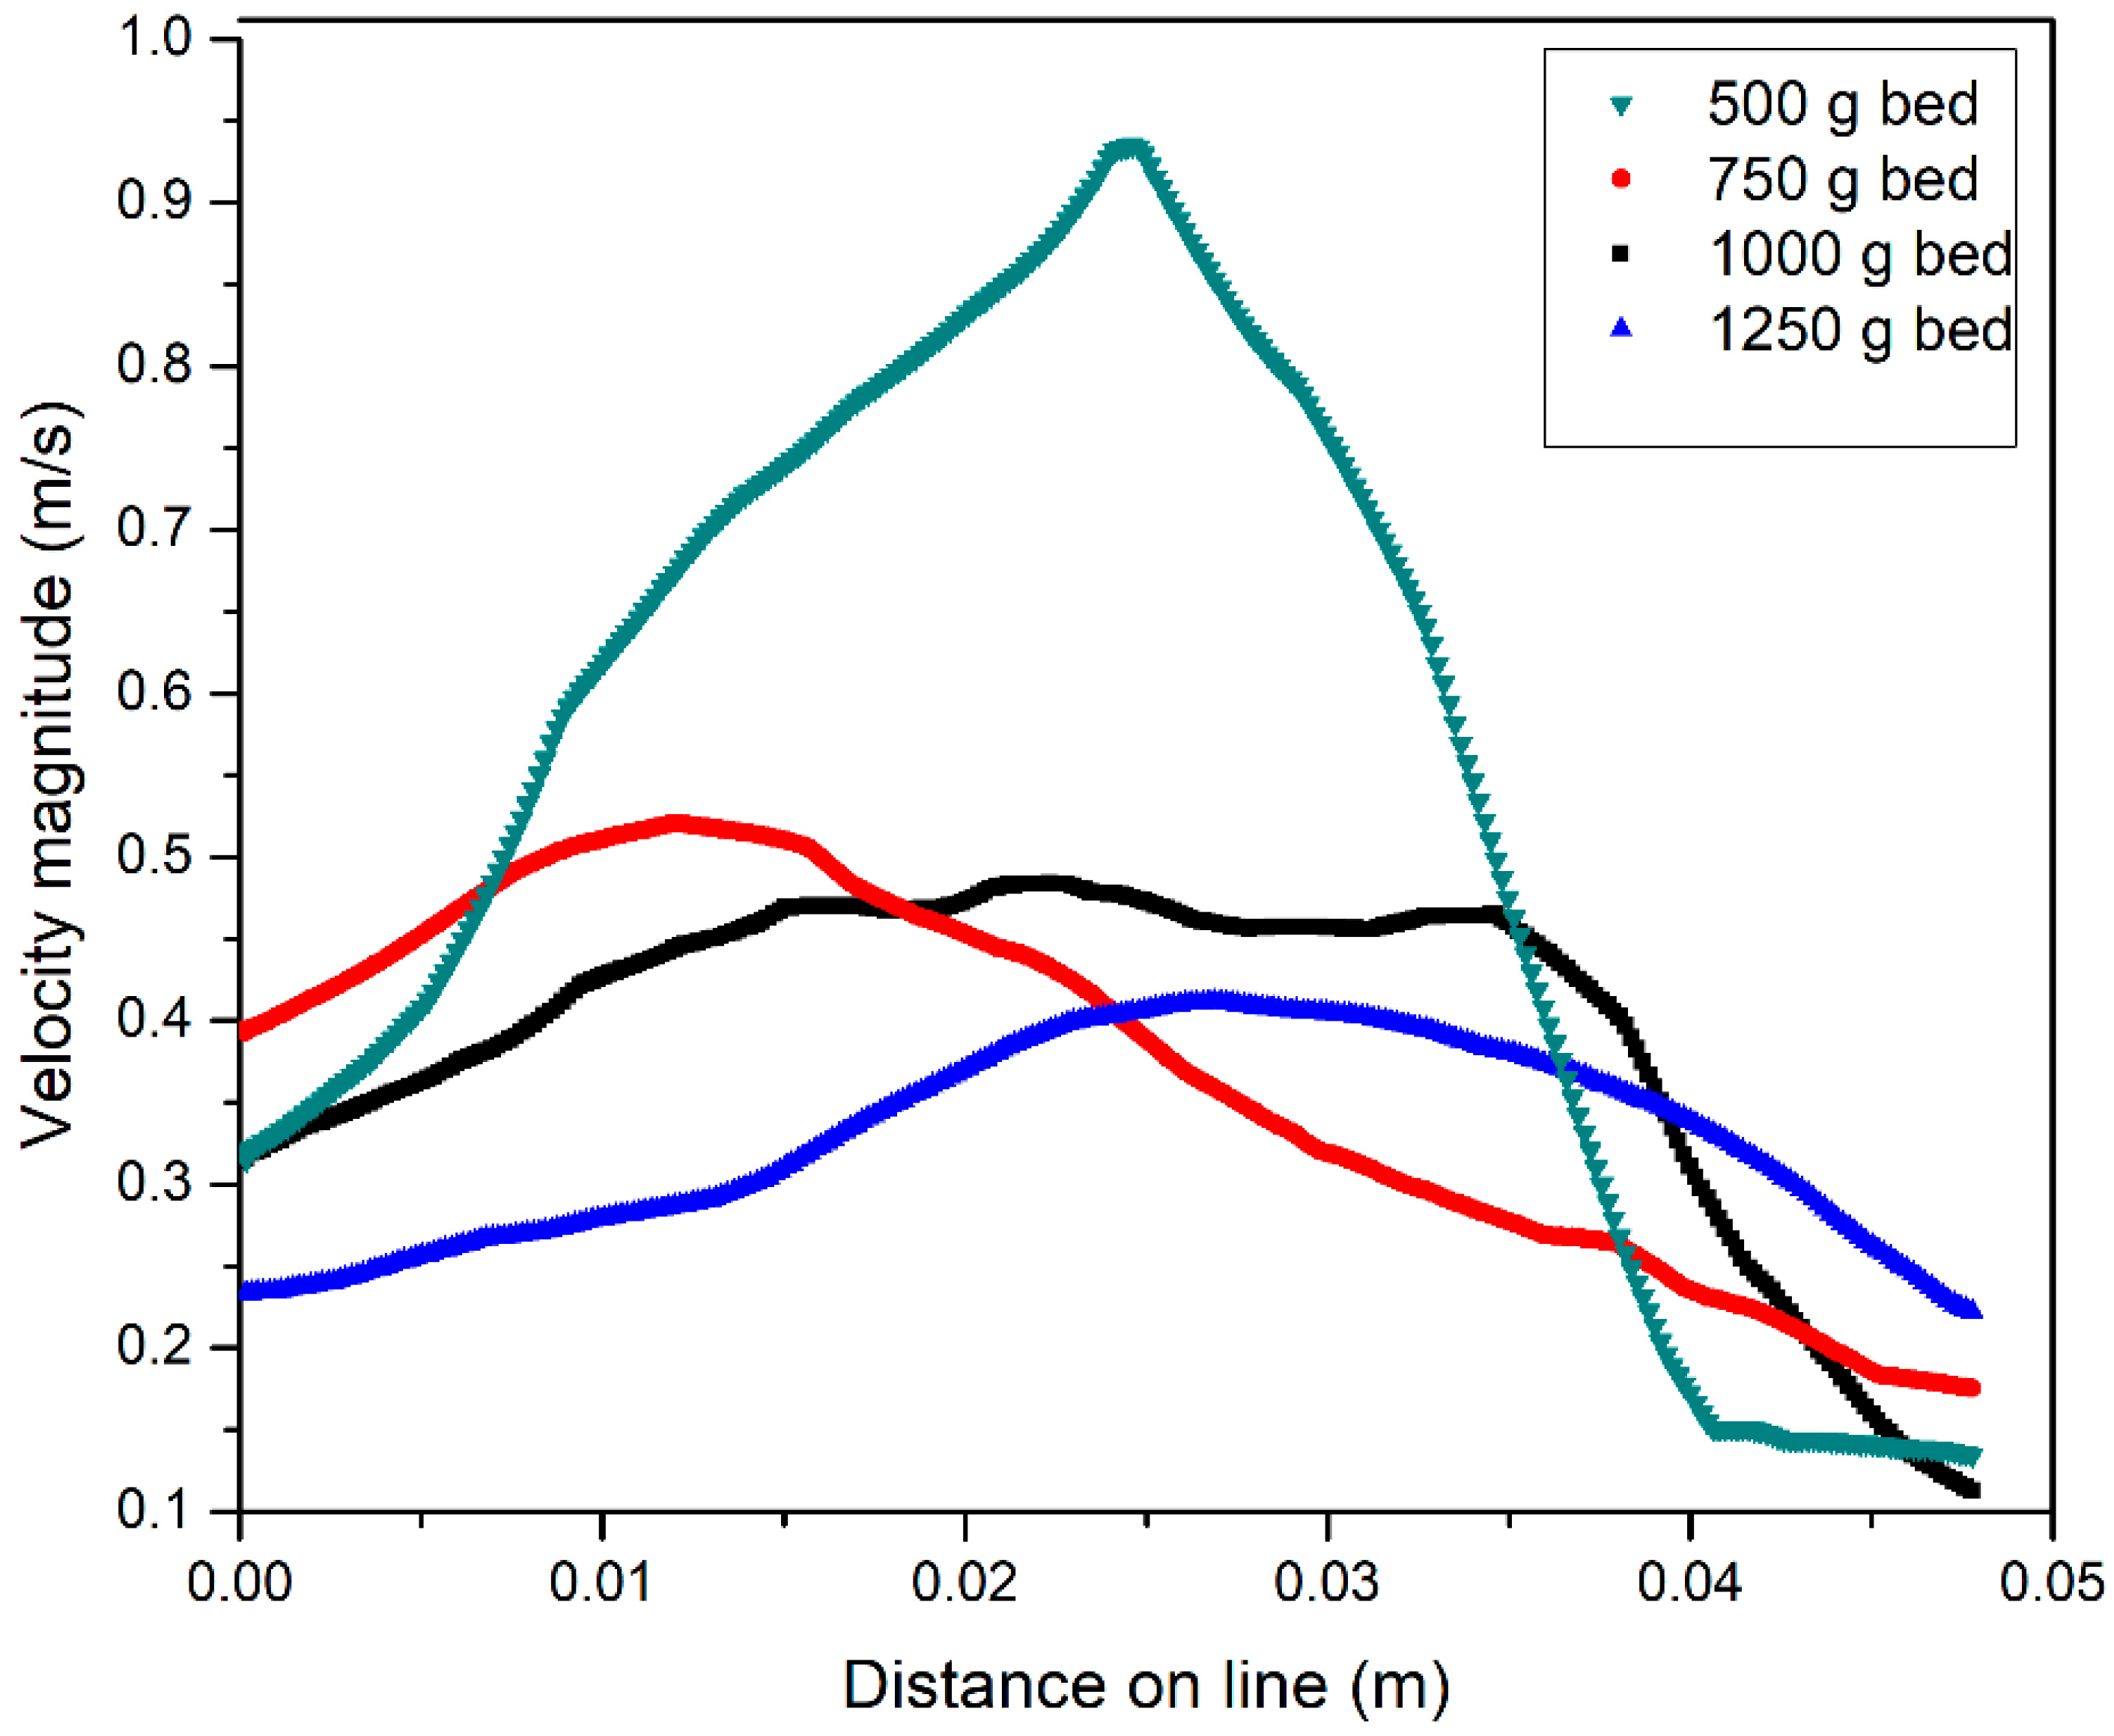
| Current study | Mesh-coupled annular blade distributor | Bed weight, superficial velocity, blade angle, pressure drop, bed velocity | All the batches except 500 g showed almost similar velocity trends with peak velocities between 0.41 m/s and 0.51 m/s. The velocity magnitude of 500 g bed exhibited sharp increase with radial distance and reached peak value of 0.93 m/s. Thereafter, velocity started decreasing at the same rate by following a Gaussian distribution pattern. At 40 mm on the line, the bed attained constant velocity of 0.15 m/s. As the superficial velocity rises, the lighter bed materials migrate towards the outer wall. Owing to the packing effect near the wall, the particles travel at comparable velocities. |
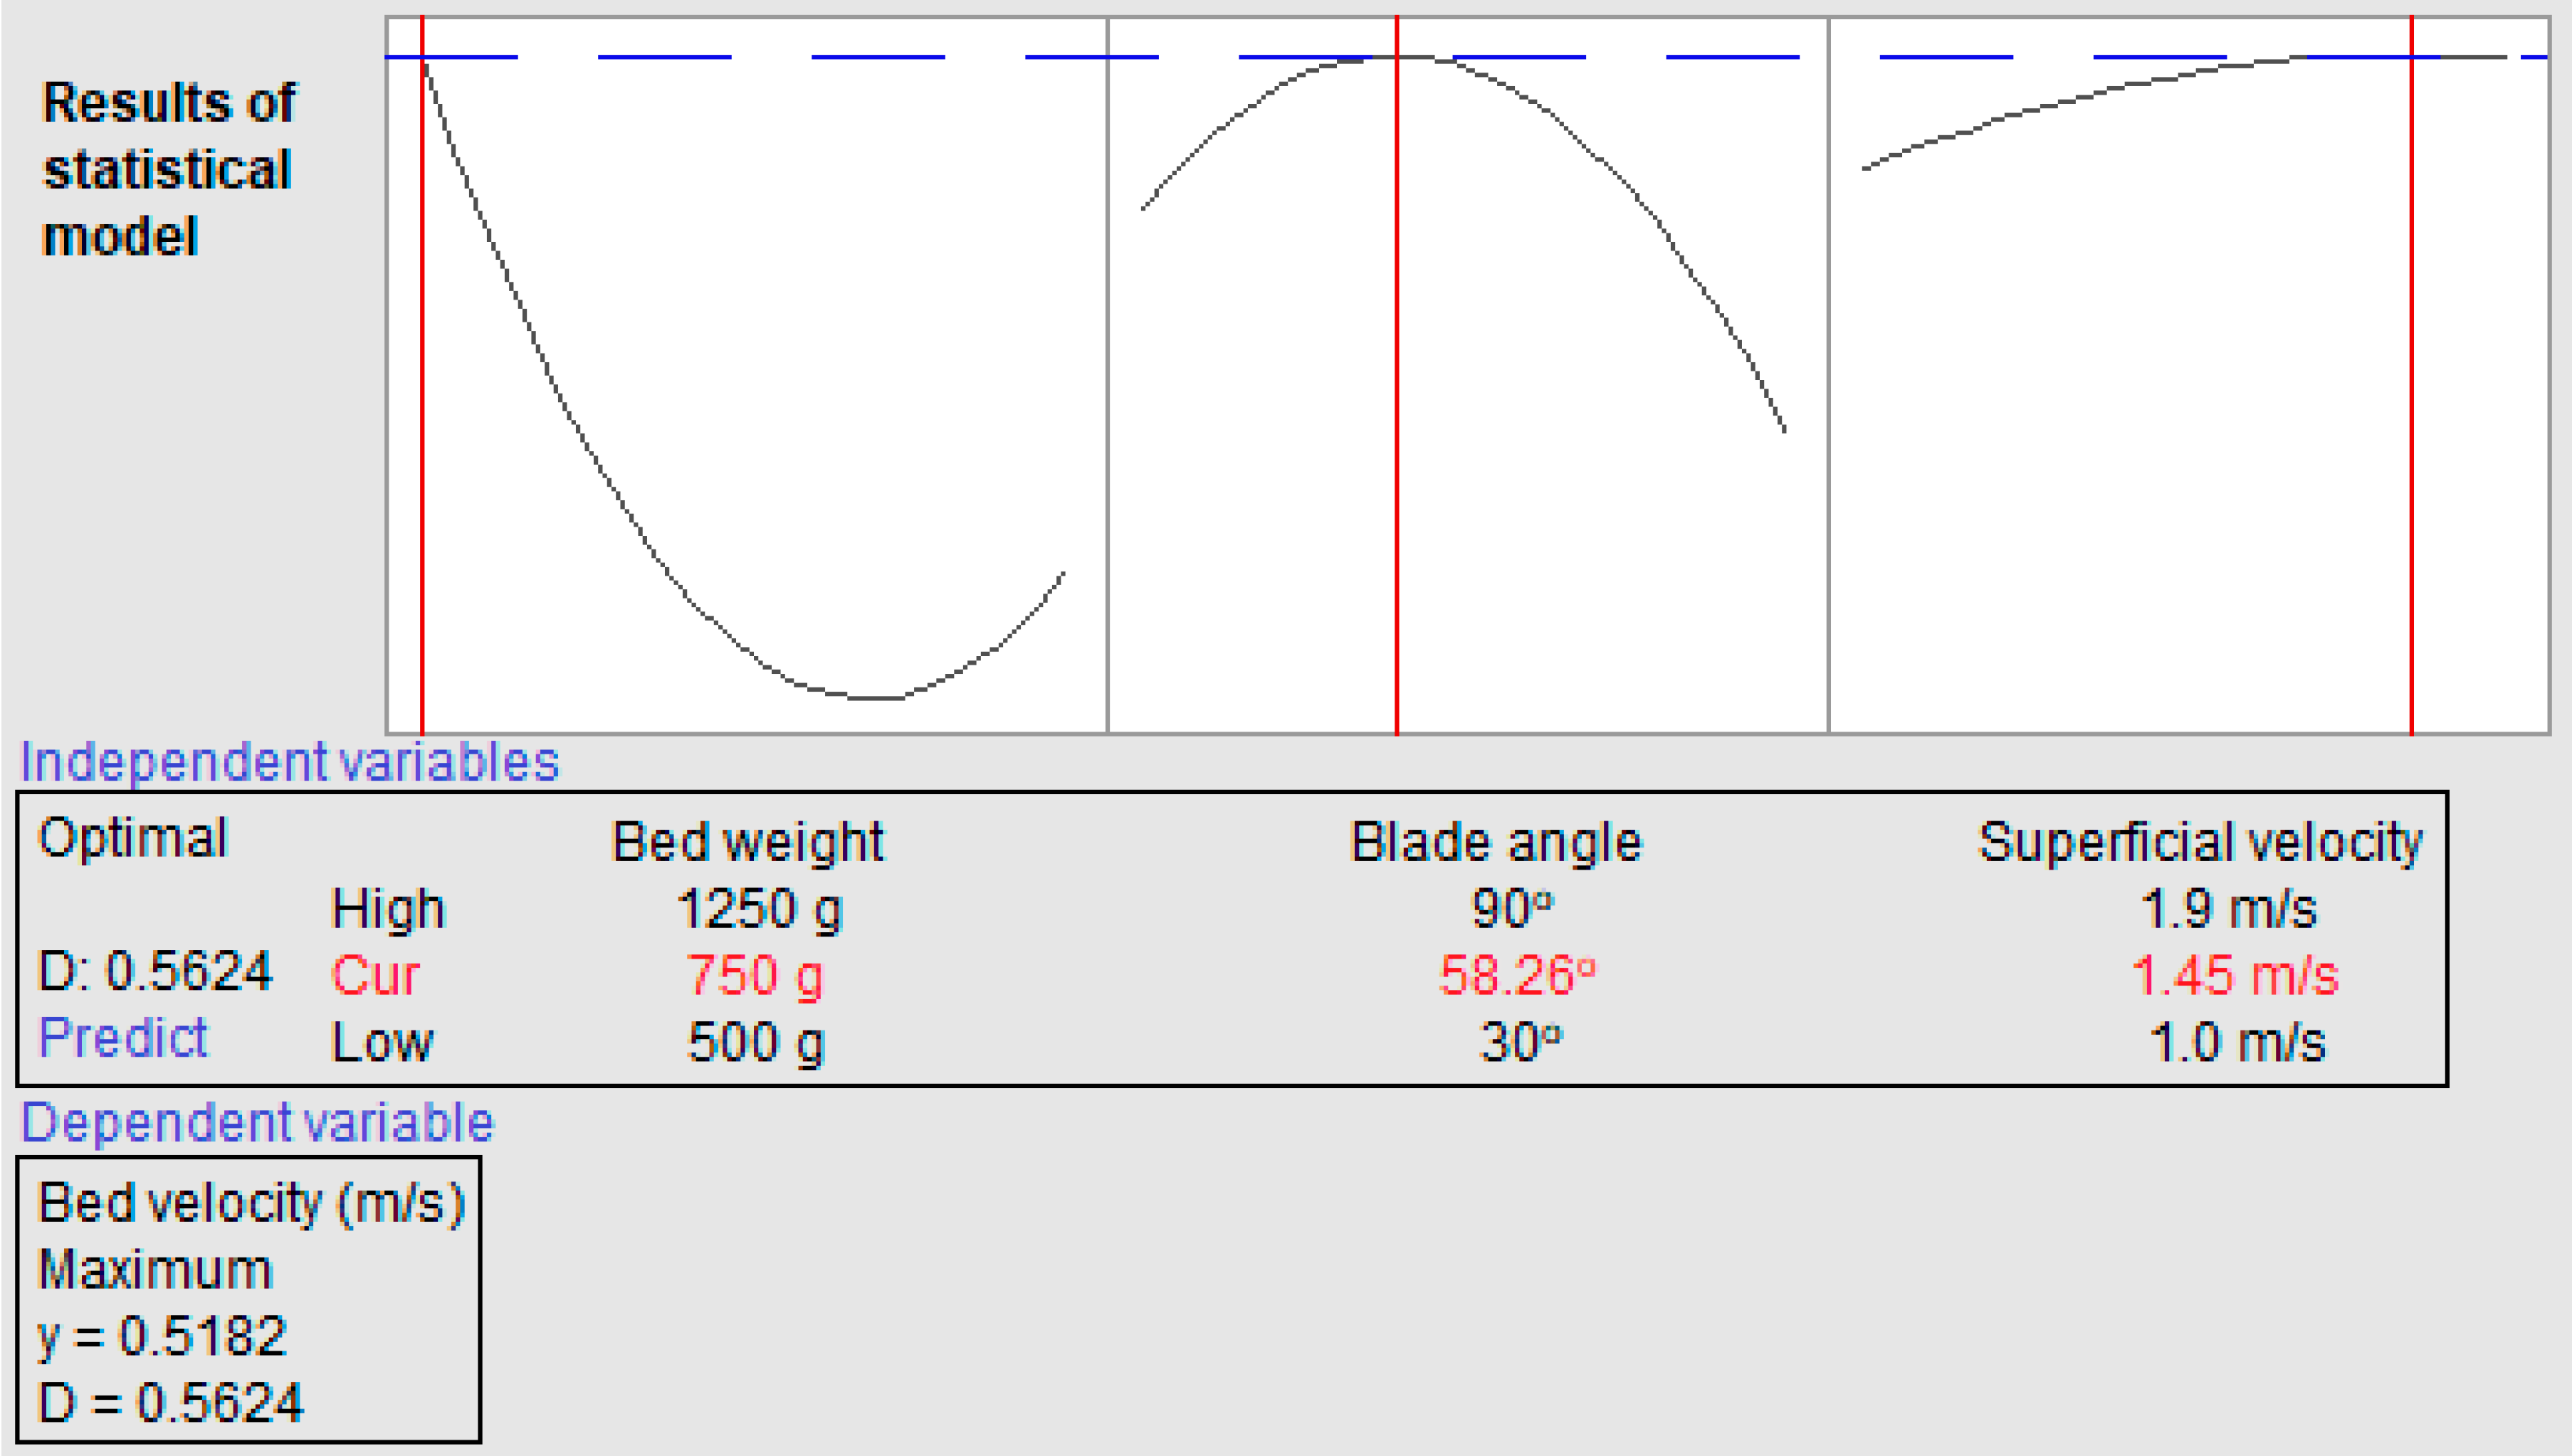
| Analysis | Bed Weight (g) | Blade Angle (°) | Usup (m/s) | Response Parameter (Bed Velocity in m/s) |
|---|---|---|---|---|
| Statistical | 750 g | 58.26° | 1.45 m/s | 0.518 m/s |
| Experimental | 750 g | 60° | 1.41 m/s | 0.5 m/s |
© 2020 by the authors. Licensee MDPI, Basel, Switzerland. This article is an open access article distributed under the terms and conditions of the Creative Commons Attribution (CC BY) license (http://creativecommons.org/licenses/by/4.0/).
Share and Cite
Shukrullah, S.; Naz, M.Y.; Ghaffar, A.; Khan, Y.; Al-Arainy, A.A.; Meer, R. Experimental and Statistical Validation of Data on Mesh-Coupled Annular Distributor Design for Swirling Fluidized Beds. Processes 2020, 8, 632. https://doi.org/10.3390/pr8050632
Shukrullah S, Naz MY, Ghaffar A, Khan Y, Al-Arainy AA, Meer R. Experimental and Statistical Validation of Data on Mesh-Coupled Annular Distributor Design for Swirling Fluidized Beds. Processes. 2020; 8(5):632. https://doi.org/10.3390/pr8050632
Chicago/Turabian StyleShukrullah, Shazia, Muhammad Yasin Naz, Abdul Ghaffar, Yasin Khan, Abdulrehman Ali Al-Arainy, and Rashed Meer. 2020. "Experimental and Statistical Validation of Data on Mesh-Coupled Annular Distributor Design for Swirling Fluidized Beds" Processes 8, no. 5: 632. https://doi.org/10.3390/pr8050632
APA StyleShukrullah, S., Naz, M. Y., Ghaffar, A., Khan, Y., Al-Arainy, A. A., & Meer, R. (2020). Experimental and Statistical Validation of Data on Mesh-Coupled Annular Distributor Design for Swirling Fluidized Beds. Processes, 8(5), 632. https://doi.org/10.3390/pr8050632