1. Introduction
Napier grass (
Pennisetum purpureum Schumach), known also as elephant grass, is a perennial grass found in tropical regions. Its high yield, easy cultivation, nutrient availability and versatility make it widely popular for use as a fodder crop. Annual production yields of the grass vary depending on cultivars, harvest cycles, fertilization, and climates. The reported Napier grass yield in temperate climates was 20–40 ton/ha [
1], while the yield in tropical climates was higher at 50–67 ton/ha [
2,
3]. Napier grass is classified as a lignocellulosic biomass. Its structural compositions varies depending on weather, variety, and age. Reports on its composition covered 31–41% cellulose and 15–47% hemicellulose [
4,
5,
6,
7]. Hydrolysis of its structure yields glucose and xylose, which are monomeric sugars that serve as substrates in microbial fermentation to produce various biochemical including biofuels.
Napier grass plantation in Thailand has been for agricultural purposes. As the country has continuously promoted biofuel production, Napier grass is considered as an energy crop. Thailand’s 10 Year (2012–2021) Alternative Energy Development Plan has placed the grass as one of the focused energy plants [
8]. Napier grass has been successfully used in biogas production [
8,
9,
10]. Studies on the use of Napier grass for other biofuels production also exist, including for bioethanol production. Pretreatments play an important role in production of liquid fuels. A study showed a higher ethanol yield when using pretreated versus non-pretreated grasses, mainly due to increases in sugar yields obtained in hydrolysis [
11].
Pretreatment of Napier grass is an important step to prepare it for further hydrolysis. The process alters physical structure of the biomass so that enzyme has a better access to the cellulose chain of the biomass and improves hydrolysis [
12,
13]. Studies have been investigating various methods of pretreatment, primarily physical and chemical methods, with the aim to obtain high sugar yields. Some examples of the pretreatments focused on Napier grass included the uses of various alkalis, e.g., aqueous ammonia, Ca(OH)
2, NaOH, alkali H
2O
2 [
14,
15,
16], and ammonia gas [
17,
18], dilute acid [
14], acid-peroxide [
19], acid-alkali [
20], steam explosion [
14,
21], hydrothermal treatment [
11], and nitrogen explosive decompression [
22].
In the current study, we attempted to determine a simple and viable process for ethanol production from Napier grass. The works in each pretreatment and hydrolysis step involved the use of response surface methodology in order to determine the suitable conditions for each pretreatment and hydrolysis routes.
Despite various pretreatment methods available, we chose to investigate the chemical pretreatment of mechanically ground Napier grass due to its operational simplicity. We also chose NaOH and H2SO4 as they are common chemicals that are already in use by industries. The suitable conditions for enzymatic hydrolysis of the each pretreatment methods were then determined to obtain the process that resulted in the highest sugar released from the grass. Upon obtaining suitable pretreatment and hydrolysis conditions, ethanol production was investigated using hydrolysate obtained from enzymatic hydrolysis of pretreated grass, through separated hydrolysis and fermentation (SHF), and using the pretreated grass, through simultaneous saccharification and fermentation (SSF). Two yeast strains were used in fermentations, a common yeast and a xylose-fermenting yeast. We evaluated the ethanol production using such combination of substrates and yeasts and suggested the process for ethanol production from Napier grass based on the results of the study.
2. Materials and Methods
2.1. Preparation of Napier Grass
Napier grass (Pennisetum purpureum Schumach) Pakchong 1 aged 90–150 days was harvested from the Demonstration field of the Faculty of Agriculture, Khon Kaen University, Thailand. Stems were cut approximately 5 cm above the ground. They were then chopped and oven dried at 70 °C. The dried stems were then milled and sieved through a 10-mesh screen to obtain dried grass used in the study.
2.2. Alkali and Dilute Acid Pretreatments
Pretreatments using alkali and acid followed a similar procedure. In the case of alkali pretreatment, dried Napier grass was soaked in 200 mL sodium hydroxide solution at 15%
w/
v loading in 500 mL high-pressure laboratory bottles and heated in an autoclave. For acid pretreatments, dried Napier grass or alkali-pretreated grass was soaked in sulfuric acid and heated in an autoclave. The concentration, time, and temperature of the pretreatment were varied according to the values shown in
Table 1. After pretreatment, solid fractions were collected and washed until the pH was neutral. They were then dried at 70 °C prior to analysis and enzymatic hydrolysis.
Design Expert® (version 7.0 demo, Stat-Ease, Minneapolis, MN, USA, 2005) was used in designing the experimental runs and analysis of results. Box–Benkhen design was applied for all experiments. Treated grasses were analyzed for their susceptibility to cellulase hydrolysis which was used as responses in all pretreatments. Mathematical models obtained from program analysis were used to predict the conditions that resulted in the highest susceptibility for each of the pretreatment methods.
2.3. Enzymatic Hydrolysis
Pretreated grasses were hydrolyzed using a cellulase, Cellic® CTec2 (Novozymes, Bagsvaerd, Denmark). Grass was added into 100 mL of 50 mM citrate buffer solution (pH 5.0) in a 500-mL laboratory bottle. The enzyme was then added and mixed, and the mixture was incubated in a water bath at 50 °C with constant mixing. The hydrolysis reaction was stopped by boiling the content for 5 min. The liquid fraction was analyzed for reducing sugar.
Operation factors that were evaluated in enzymatic hydrolysis included enzyme dosage, incubation time and substrate loading (
Table 1). The Box–Benkhen design was used in designing experimental runs with the help of Design Expert
® software (version 7.0 demo, Stat-Ease, Minneapolis, MN, USA, 2005). The analysis of data was also carried out using the program. Suitable conditions for hydrolysis by the enzyme were determined based on the maximum amount of reducing sugars obtained from model prediction.
2.4. Ethanol Fermentation via SHF and SSF
Saccharomyces cerevisiae TISTR 5339 (Thailand Institute of Scientific and Technological Research, Bangkok, Thailand) and Scheffersomyces shehatae ATCC 22984 (The American Type Culture Collection, Manassas, VA, USA) were used in all fermentations. Yeast stocks were maintained in 30% glycerol. They were propagated twice in Yeast Malt (YM) agar. Liquid medium used in fermentation was prepared from enzymatic hydrolysate of alkali-treated grass supplemented with 2 g/L autolyzed yeast powder (FM801, Angel Yeast, Yichang, China) for S. cerevisiae or 6 g/L for S. shehatae. Fermentations were carried out in 250 mL Erlenmeyer flasks.
In inoculum preparation, a few single colonies were inoculated in diluted hydrolysate medium whose glucose was adjusted to 10 g/L. It was incubated at 30 °C with shaking at 200 rpm for 24 h. Ten percent of the first seed inoculum was transferred to a fresh hydrolysate medium with 20 g/L glucose and incubated at the same conditions for another 24 h.
In separate hydrolysis and fermentation (SHF), 10 mL of inoculum was transferred to 100 mL of hydrolysate medium. For simultaneous saccharification and fermentation (SSF), 100 mL of 15% w/v slurry of alkali-treated grass in water, supplemented with autolyzed yeast powder, were used as substrate and medium for fermentation. Ten mL of inoculum was added together with 40 Filter Paper Unit (FPU)/ggrass of cellulase, Cellic® CTec2, to start the cultivation. Fermentation conditions were 30 °C with shaking at 100 rpm. Samples were taken at intervals and analyzed for cell growth, sugars, and ethanol concentrations.
2.5. Analysis
Grasses after pretreatment were analyzed by assessing their susceptibility to cellulase hydrolysis (“susceptibility test” in short). One gram of dried grass was hydrolyzed by 30 FPU/g of cellulase (Cellic® CTec2) in 50 mM citrate buffer (pH 5.0) for 72 h at 50 °C. Results from the analysis were reported as susceptibility with the unit of gram of reducing sugar per liter (gRS, suscepibility/L).
Structural compositions of grasses before and after pretreatments were analyzed based on extractive-free biomass following the NREL procedure [
23] and ASTM standard test E1758-01(2007). Surfaces of grasses were observed under scanning electron microscope (S-3000N, Hitachi, Tokyo, Japan).
Number of cells was reported as cells/mL and determined using cell count on hemocytometer. Reducing sugar was analyzed using dinitrosalicylic acid colorimetric assay. High-performance liquid chromatography (LC-20A, Shimadzu, Kyoto, Japan) was used to determine concentrations of glucose, xylose, and ethanol. It was equipped with an Aminex HPX-87H (Bio-Rad, Hercules, CA, USA) column and a refractive index detector (RID-6A, Shimadzu, Kyoto, Japan) for analysis. Column temperature was set at 40 °C. The mobile phase was 5 mM sulfuric acid, flowing at 0.75 mL/min.
3. Results
3.1. Pretreatments of Napier Grass
Prior to hydrolysis of Napier grass by enzyme or using it in fermentation, pretreatment of the grass is necessary in order to obtain biomass that is more vulnerable to further hydrolysis. Investigations in using alkali, acid and their combinations in pretreatment of Napier grass were carried out to determine for suitable conditions when applying each pretreatment regime.
3.1.1. Alkali Pretreatment
In order to obtain pretreatment conditions using alkali, NaOH concentrations (
A in molarity), treatment temperature (
B in °C) and time (
C in min) were varied within the value ranges indicated in
Table 1. By using the Box–Behnken design, experimental runs and their respective results were obtained as shown in
Table 2. The data fitted well with this following quadratic equation with R-squared value of 0.9843.
The analysis of variance (ANOVA) for the model (
Table 3, NaOH) indicated that all the factors had a significant effect on the susceptibility of the grass to cellulase hydrolysis. In addition, interactions between NaOH concentration and temperature (A, B) and between temperature and time (B, C) also had significant effects as demonstrated in
Figure 1. The plots indicate that an increase in the concentration of NaOH resulted in an increase in reducing sugar obtained from the susceptibility test until the concentration was approximately 2 M; then the sugar started to decrease. Furthermore, the time taken in pretreatment has shown its dependence on the temperature used (
Figure 1b). At low pretreatment temperature, the grass was more susceptible to cellulase hydrolysis with longer treatment time whereas time had little effect at high treatment temperature.
The equation predicted the pretreatment conditions that resulted in the highest susceptibility (39.3 gRS, susceptibility/L) of 15% dried grass to be 1.99 M NaOH, 95.7 °C and 116 min. A verification test using these conditions in pretreating Napier grass resulted in 38.4 g/L of reducing sugar obtained from the susceptibility test, which was a 2.2% deviation from the model prediction.
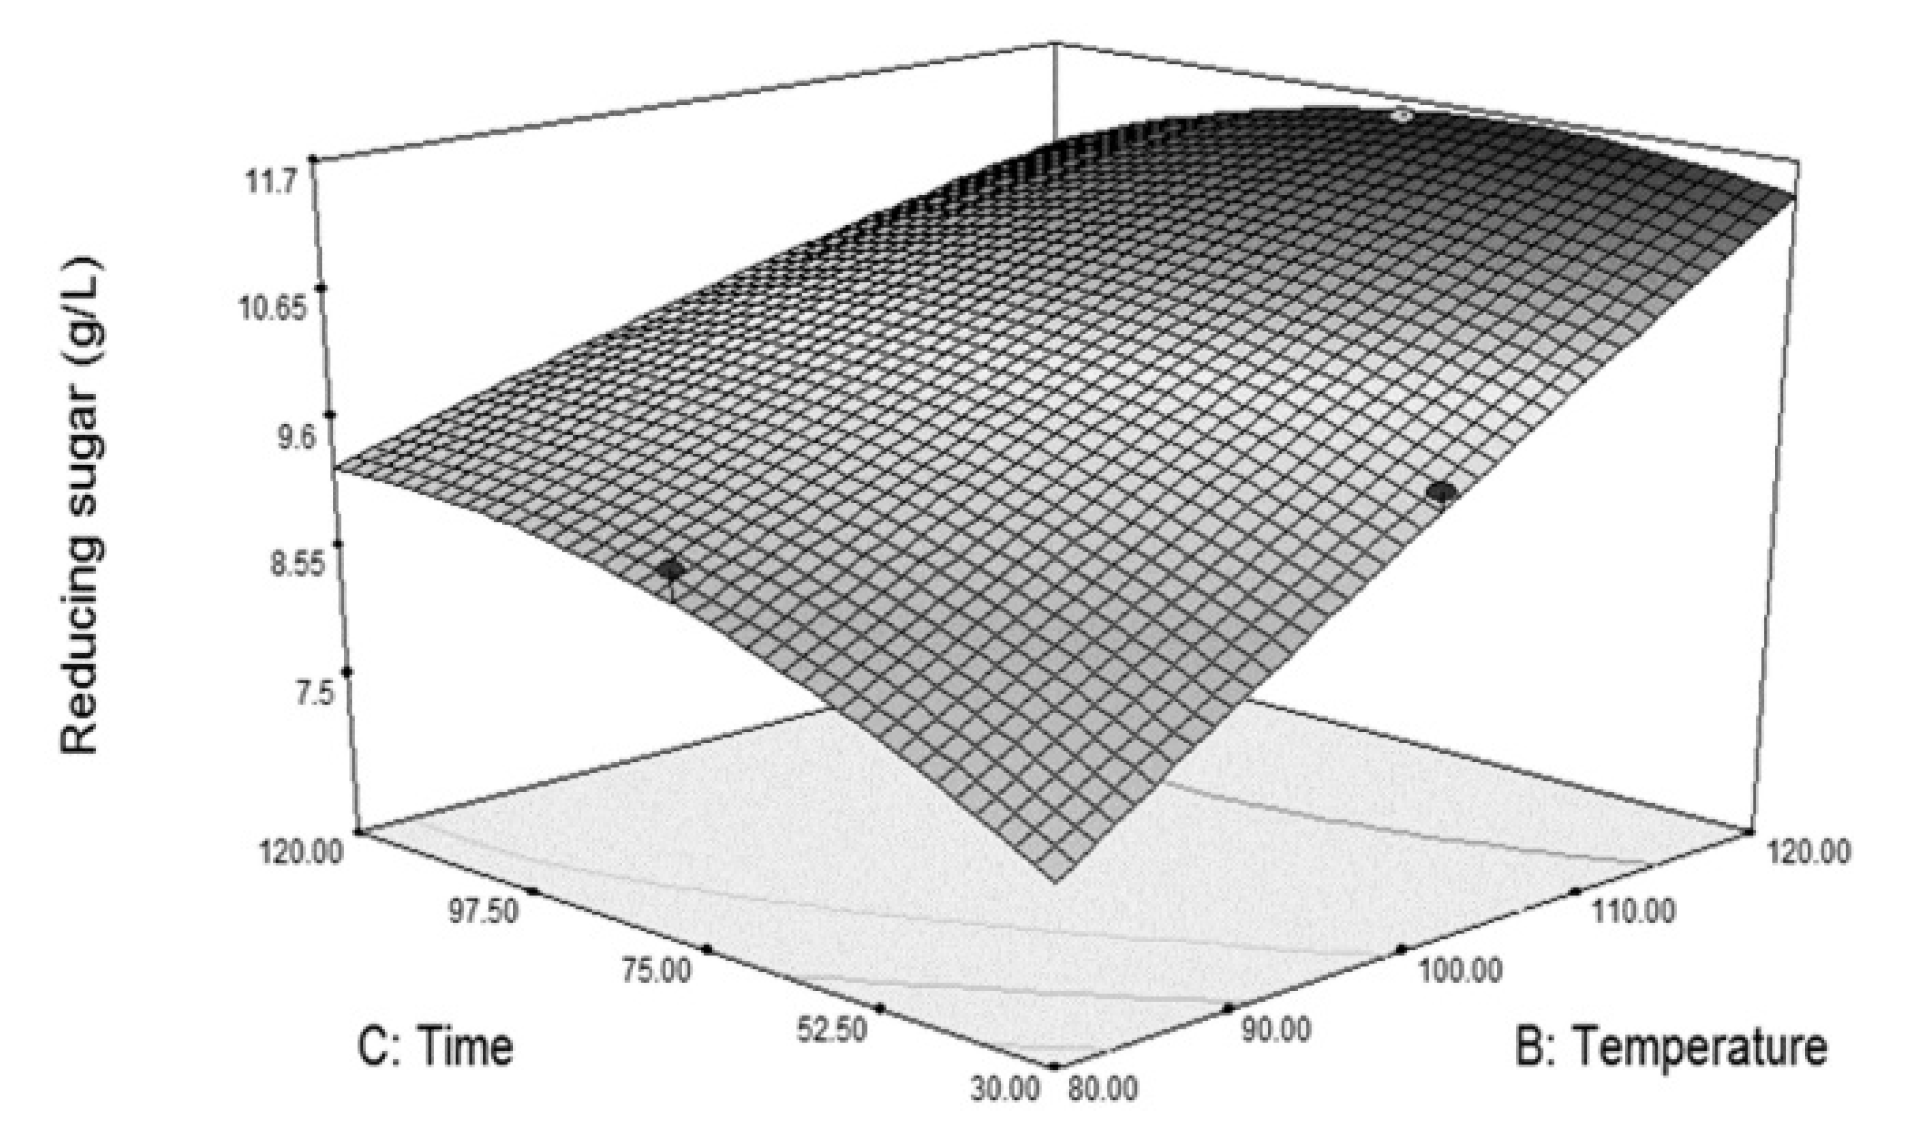
3.1.2. Dilute Acid Pretreatment
In the investigation for suitable conditions in pretreatment of Napier grass by dilute acid, three factors of interest were H
2SO
4 concentration (
A in %
v/
v), temperature (
B in °C) and time (
C in min). Their levels as indicated in
Table 1 was applied to the Box–Behnken design and the results of 17 experimental runs are shown in
Table 4. The data were fitted with a quadratic equation. The resulting equation gave the best fit with R-squared value of 0.9053:
Analysis of variance for the model (
Table 3, H
2SO
4) suggested that the main factors that posed significant influence on the susceptibility of the grass to cellulase hydrolysis at 95% confidence level were H
2SO
4 concentration (
A) and temperature (
B). Time was also significant but at a higher significance level (α = 0.1). In pretreatment with dilute acid, interaction between factors did not significantly affect the susceptibility of the grass. Nonetheless, the interaction between time and temperature (
BC) was significant at a 90% confidence level. The surface plot in
Figure 2 shows that temperature affected the susceptibility strongly when using a short pretreatment time. Its effect was lesser at longer treatment time. Furthermore, combination of high temperature and long treatment time exerted detrimental effects on the susceptibility of the grass at 5% H
2SO
4.
The quadratic model predicted the maximum reducing sugar from susceptibility test to be 11.6 g/L. The respective conditions were pretreating the grass at 15% loading with 5% v/v H2SO4 at 120 °C for 56 min. The verification test resulted in 11.4 ± 0.1 g/L of reducing sugar from susceptibility test. Although the predicted R-squared of this model was low, these results of the conditions were still valid since the conditions were similar to those of run number 11. The small difference in pretreatment time between run number 11 and the predicting value was insignificant, as the pretreatment time did not have a significant effect on the susceptibility test result.
According to the susceptibility results in
Table 4, it should be noted that dilute acid pretreatment was generally inferior to alkali pretreatment. Lower reducing sugar released in susceptibility test indicated that the pretreated grass was less susceptible to cellulase hydrolysis.
3.1.3. Alkali Followed by Acid Pretreatment
In this pretreatment, Napier grass was firstly pretreated with NaOH under the best conditions. The NaOH-treated grass was subjected to the treatment using the same factors as in the dilute acid pretreatment but the levels were adjusted as shown in
Table 1. The results from all 17 experimental runs showed that the difference between the lowest and highest values of reducing sugars from susceptibility test was quite narrow (
Table 5). This circumstance indicated the more profound effect of alkali pretreatment on the biomass such that further treatment by acid resulted in small changes in susceptibility values.
Analysis of variance (
Table 3, NaOH + H
2SO
4) suggested that acid concentration and temperature were the two factors that influenced the susceptibility of the grass to cellulase hydrolysis at 97.6% and more than 99.9% confidence levels, respectively. The ANOVA also indicated that there was no interaction between factors.
The experimental data was fitted to a quadratic model with the resulting equation:
This equation fitted well with the experimental data with R-squared value of 0.9139. The model predicted the best conditions that yielded the highest susceptibility of 33.5 g
RS,susceptibility/L to be the use of 2.53%
v/
v H
2SO
4 at 62 °C for 60 min at 15% grass loading. Although the lack of fit test was shown as significant (
p-value = 0.0018) and the predicted R-squared was negative, the result of the independent susceptibility test using the predicted conditions (33.0 ± 0.5 g
RS,susceptibility/L) was very close to the predicted value. This situation was possible regardless of the significant lack of fit and due to the following supporting reason. Since the time was not a significant factor and there was no interaction between factors, it would not affect the response. Considering runs with the same temperature, the optimum values of acid concentration (2.53%
v/
v) laid between run 9 and 10 (
Table 5) where the temperature was 75 °C. The responses of the two runs were very similar at 31.6 and 31.9 g
RS,susceptibility/L. Following the same principle, optimum temperature (62 °C) laid between values in run 10 and 11 (
Table 5) where acid concentration was the same. The responses of the 2 runs were also similar at 31.9 and 33.3 g
RS,susceptibility/L. From these explanations, it was evident that changes in acid concentration and temperature between those ranges barely affected the responses. Therefore, the confirmation test using the predicted conditions was valid. However, low predicted R-squared values indicated that this equation is not suitable for predicting the response of the conditions that were not at the experimental points.
3.2. Physical Structure and Composition of Napier Grass after Pretreatments
Napier grass obtained after the three pretreatment regimes were analyzed for their physical structures and structural compositions. The results in
Table 6 demonstrated that all pretreatments are able to reduce the amount of lignin in Napier grass, although at different capability. Reduction in lignin content was more pronounced when treating with NaOH than using the acid. The acid directly affects the hemicellulose part of the grass as reflected in the more than 50% reduction in hemicellulose in the pretreated samples. NaOH also dissolves some hemicellulose causing a drop in hemicellulose content, although not to the same extent caused by the dilute acid. As the results of pretreatment, an increase in the cellulose fraction was evident.
When matching the susceptibility data to the structural composition of the pretreated grasses, it is evident that the presence of lignin relates to a much lesser vulnerability of the biomass to hydrolysis by cellulase. Although the pretreated grasses have similar polysaccharide contents, they do not result in the same level of hydrolysis as indicated by the resulting reducing sugar from the susceptibility test.
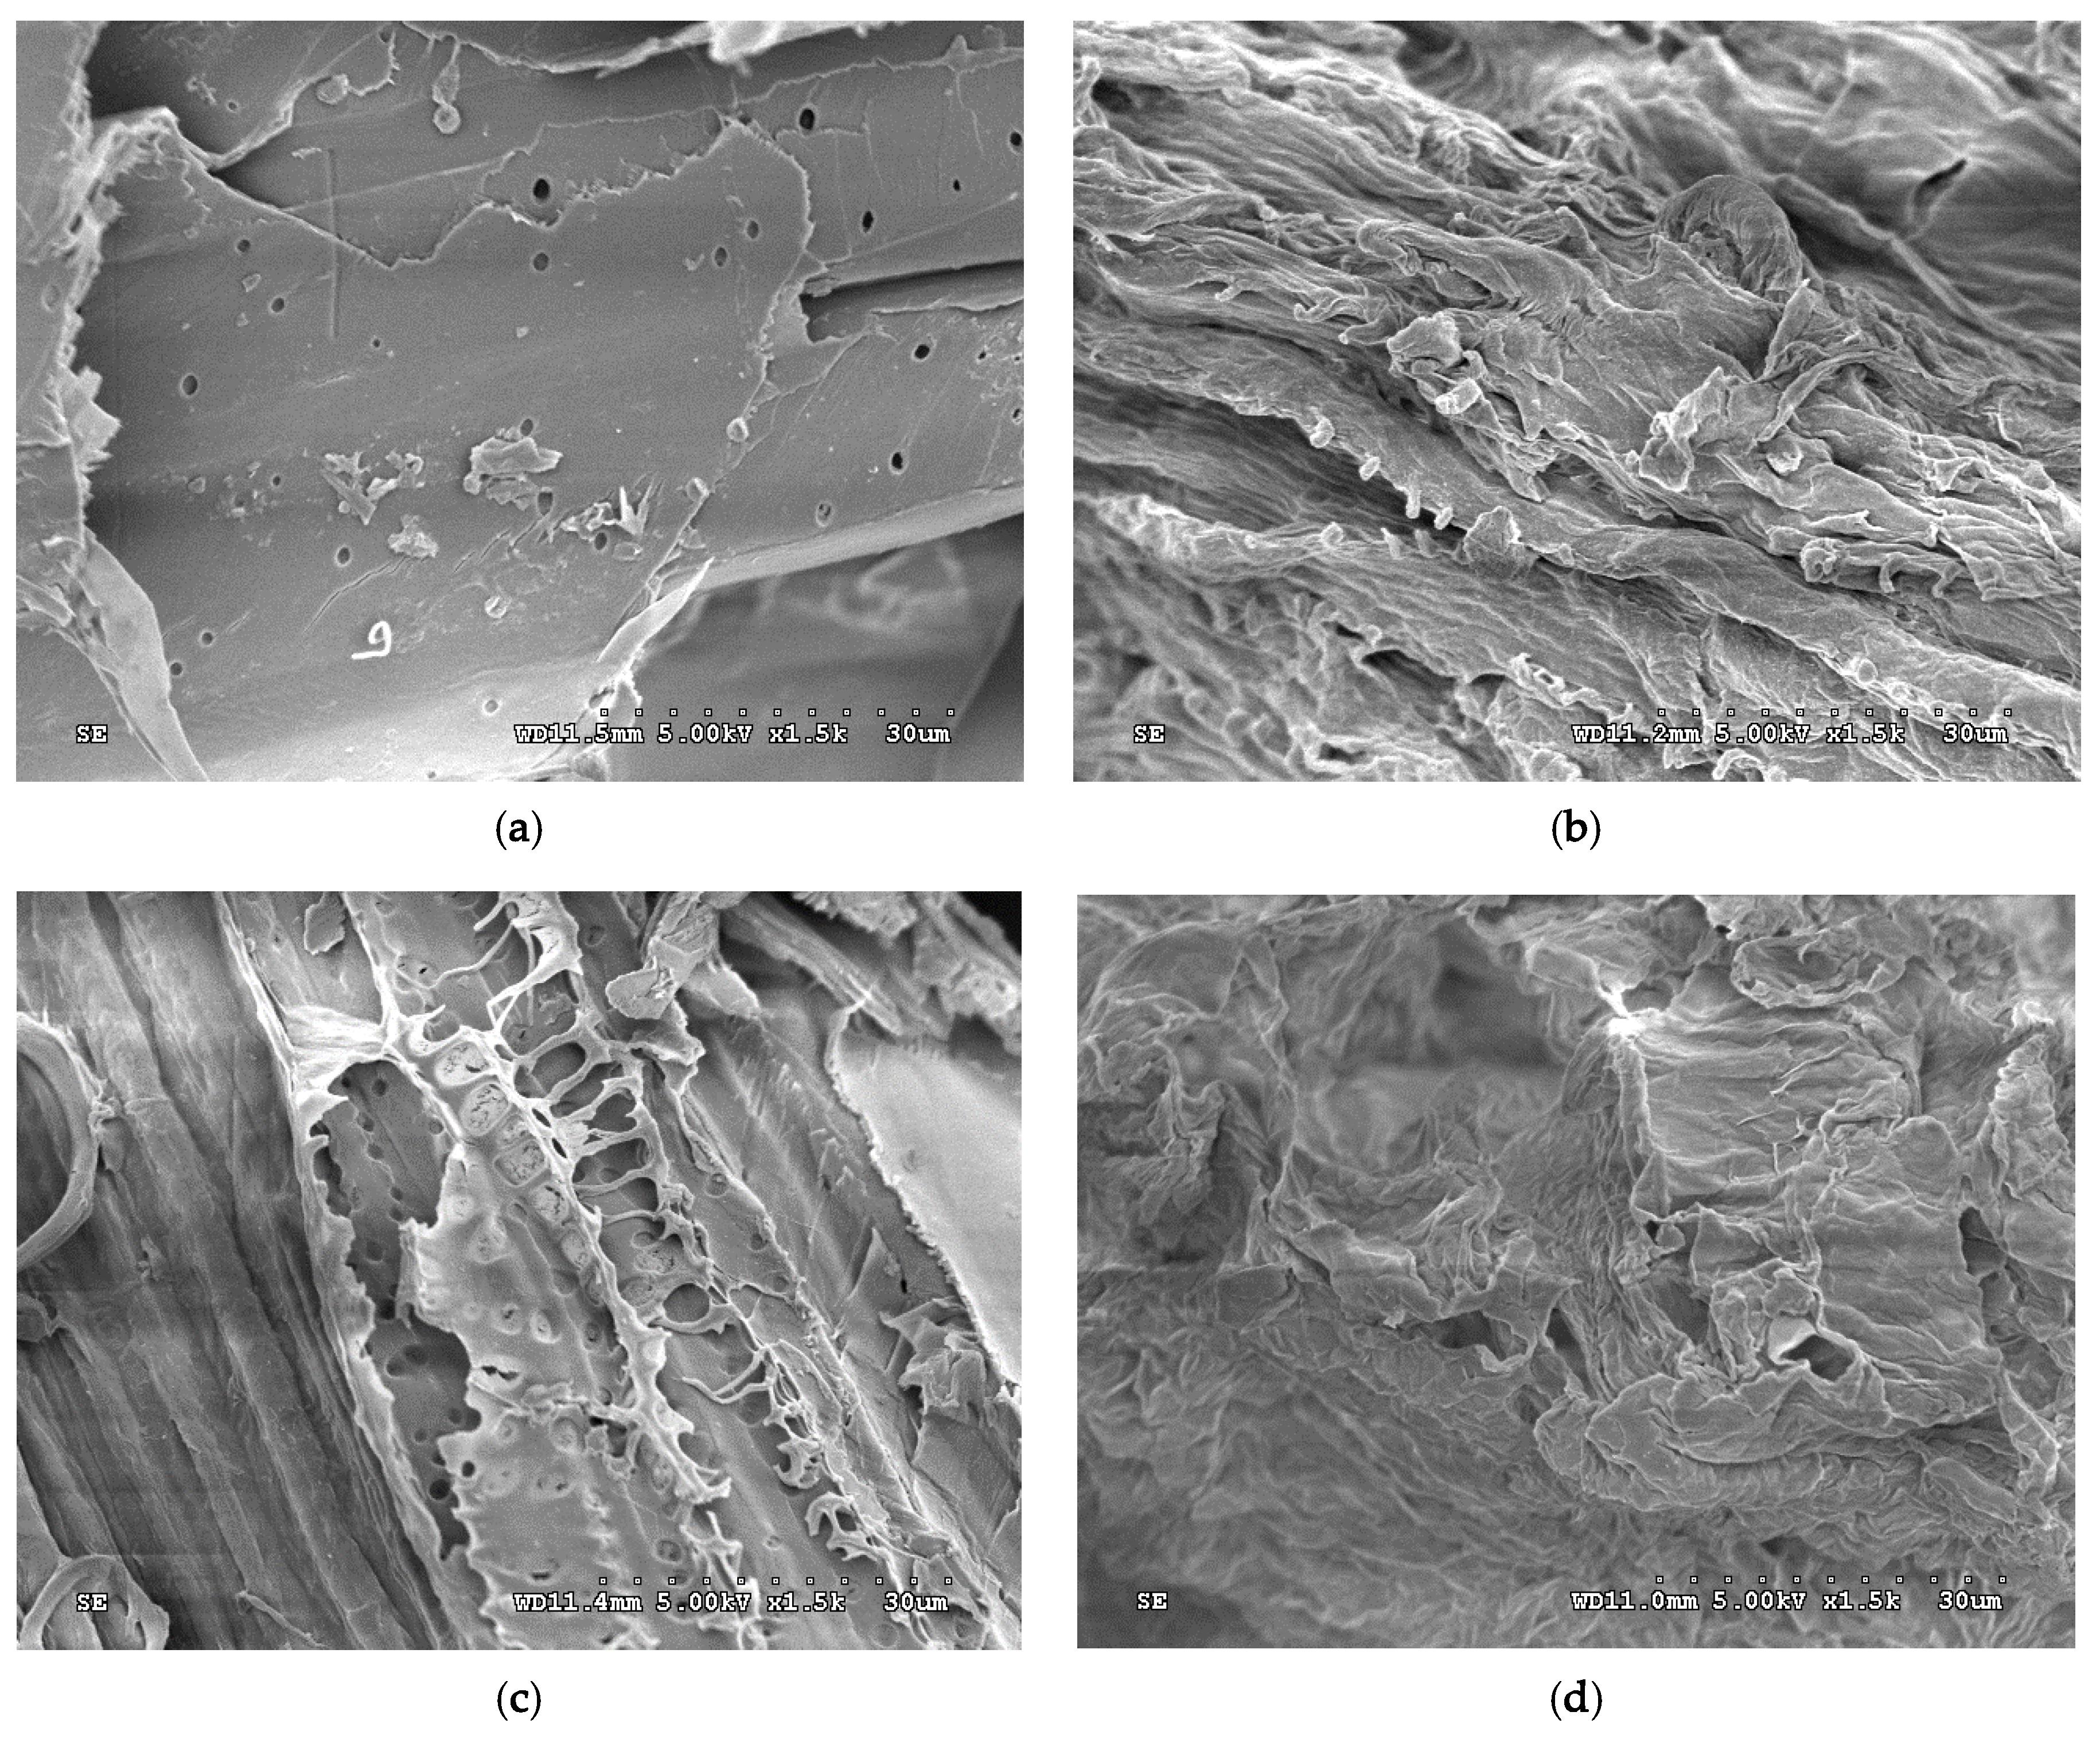
Surfaces of native grass observed under SEM shows smooth and packed-layer surface (
Figure 3a). The layering surface still exists but with loose, wrinkled, and swelling appearance after the pretreatment with NaOH, both with and without acid pretreatment (
Figure 3b,d). A different effect when using acid pretreatment is observed such that the grass appeared fibrous with signs of degradation but the appearance is still packed (
Figure 3c).
According to the results on susceptibility to cellulase hydrolysis, the structural compositions and the physical structures of the grass, we conclude that the pretreatment of 15% dried grass by 1.99 M NaOH at 95.7 °C for 116 min is suitable as it makes the grass most susceptible to further enzymatic hydrolysis. The treatment with dilute acid following the NaOH pretreatment is not necessary, as the susceptibility did not improve with the extra treatment.
3.3. Enzymatic Hydrolysis of Pretreated Grass
Although the previous results on pretreatment methods have suggested the use of NaOH alone in pretreating the Napier grass, we decided to investigate the enzymatic hydrolysis of the grass from all three pretreatment methods. Pretreated grasses were dried prior to the hydrolysis. The hydrolysis conditions followed those shown in
Table 1. The reducing sugar concentration in the liquid hydrolysate was the response used for the analysis of the results and the prediction of the suitable hydrolysis conditions.
The experimental results of enzymatic hydrolysis of grass pretreated with the three methods were demonstrated in
Table 7. In general, both pretreatments involving NaOH resulted in similar reducing sugar concentrations and the values were significantly higher than that treated with dilute acid. The ANOVA of the results in
Table 8 show that all factors (enzyme dosage, hydrolysis time, and substrate loading) affect the amount of sugar obtained in the liquid hydrolysate, except for the grass pretreated with H
2SO
4 where enzyme dosage does not affect the reducing sugar obtained.
Quadratic equations for predicting the suitable hydrolysis conditions for the pretreated grass using different pretreatment regimes are as follows:
Grass pretreated with NaOH:
Grass pretreated with H
2SO
4:
Grass pretreated with H
2SO
4 followed by NaOH:
where y = reducing sugar (g/L),
A = enzyme dosage (FPU/g),
B = hydrolysis time (h) and
C = substrate loading (%
w/
v). All model equations have high R-squared values, which indicate that the models fit well with the experimental data. In addition, the high values of predicted R-squared suggest that the model equations can be used to predict the reducing sugar obtained from the hydrolysis.
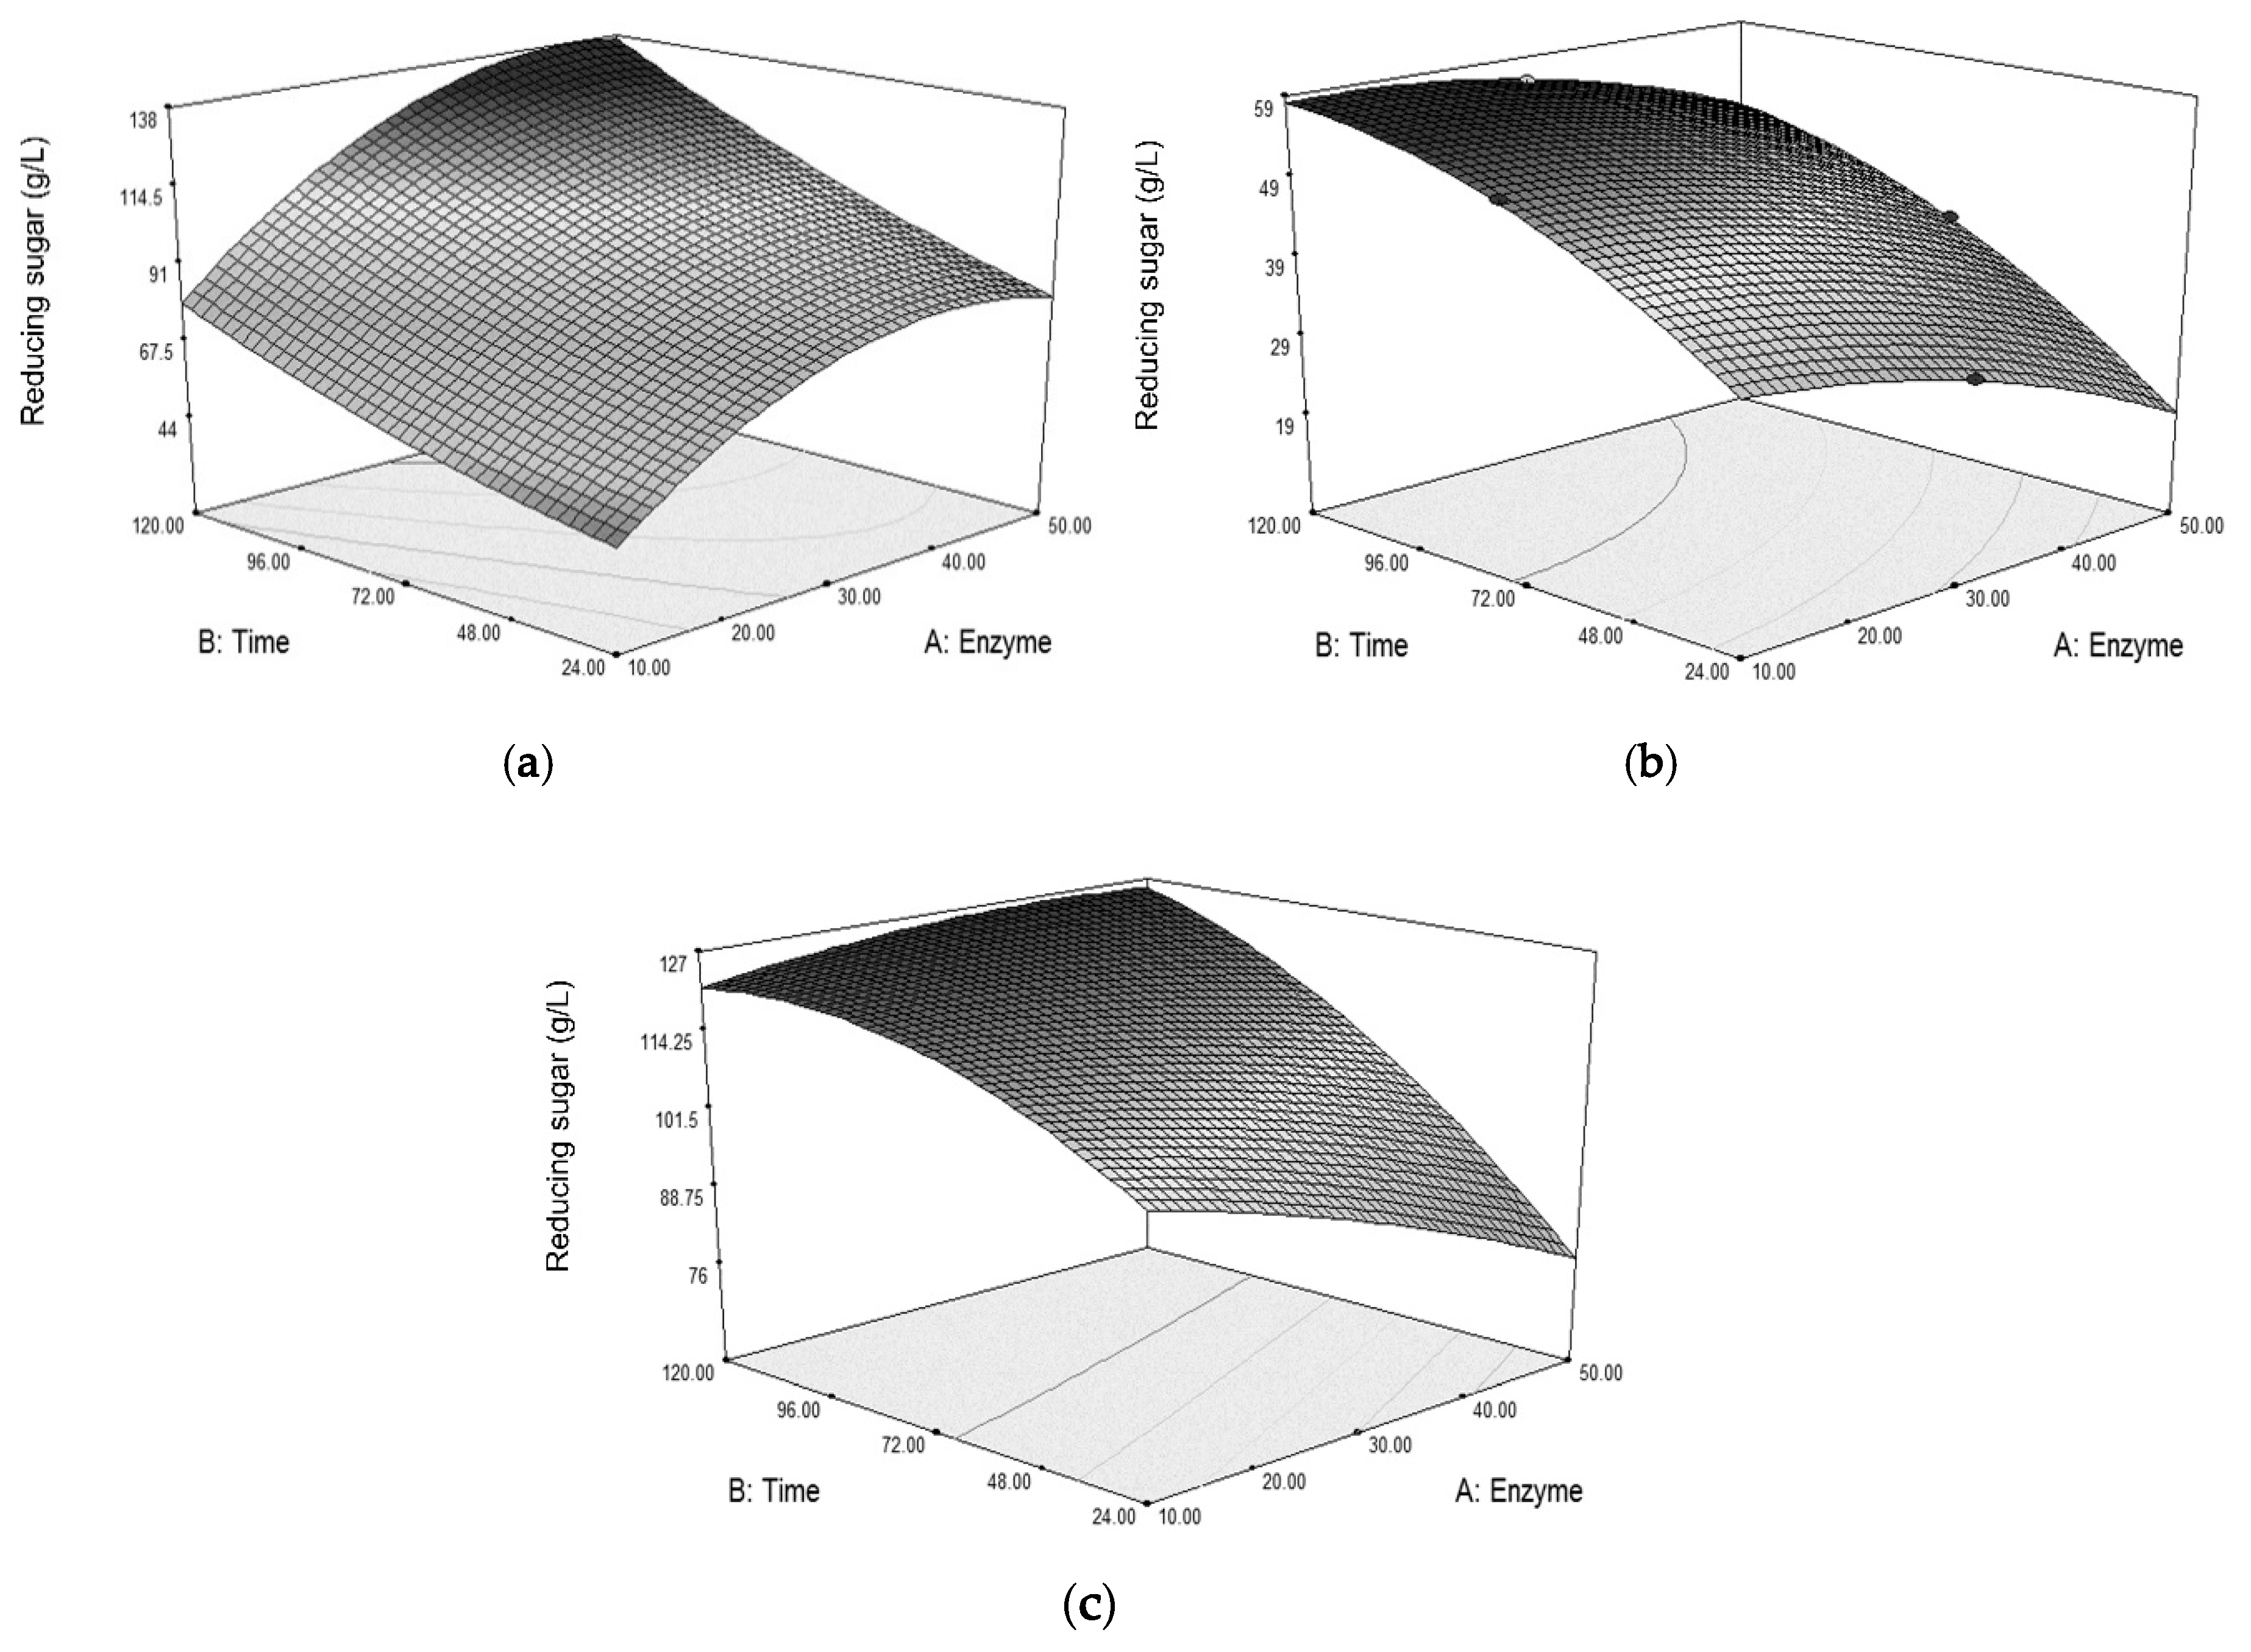
The surface plots in
Figure 4 show the reducing sugar concentrations obtained from varying enzyme dosages and times when hydrolyzing grasses from different pretreatments. Hydrolysis time greatly affects the sugar obtained, such that longer time results in higher sugar concentration. By observing the surface shapes, the pretreatment involving the dilute acid causes a different response pattern of sugar obtained from hydrolysis when compared with the pretreatment with NaOH alone. Pretreating the grass with dilute acid seems to gain some benefit from the use of lower enzyme dosage with a long hydrolysis time, as shown in
Figure 4b,c. While removing lignin by NaOH could loosen the grass structure and allow for more cellulase accessibility to the cellulose, dissolving hemicellulose by dilute acid could also increase the cellulose accessibility [
24]. Since the cellulose accessibility is the major factor on cellulase hydrolysis [
12,
13], the extra increase in this accessibility allows better penetration of the enzyme during hydrolysis even at a lower enzyme dosage.
The hydrolysis conditions obtained from the model equations for pretreated grasses of different pretreatment regimes are shown in
Table 9, together with the predicted and actual reducing sugar concentrations obtained from the hydrolysis. Pretreatment solely with NaOH resulted in the highest reducing sugar concentrations when the pretreated grass was hydrolyzed with cellulase. Confirmation tests using the predicted optimal conditions were carried out for all pretreated grasses and the reducing sugar concentrations were very close to the predicting values.
According to the results, cellulase hydrolysis of Napier grass pretreated with NaOH and with NaOH followed by H2SO4 resulted in similar reducing sugar concentrations, with the slightly higher concentration in the pretreatment with NaOH. The sugar concentrations obtained from the NaOH-pretreated grasses were high and in accordance with the polysaccharide contents in the pretreated grasses. However, the amount of sugar obtained from the acid-pretreated grass was much lower, regardless of the similar polysaccharide contents. These results emphasized the importance of cellulase susceptibility of the biomass on the hydrolysis rather than the polysaccharide contents of the biomass.
Both regimes involving the use of NaOH in pretreatment could be used for preparing liquid hydrolysates for fermentations due to the high sugar concentrations obtained. However, based on the number of steps involved and the higher sugar concentration obtained, we chose to pretreat the Napier grass in a single step with NaOH followed by cellulase hydrolysis to prepare the hydrolysate as a substrate for ethanol fermentation. To pretreat the Napier grass, 15% dried grass is to be soaked in 1.99 M NaOH and subjects to wet heat at 95.7 °C for 116 min. Dried pretreated grass is hydrolyzed using cellulase (Cellic® CTec2) at 40 FPU/g for 117 h and the grass loading of 15%.
3.4. Ethanol Production Potentials of Napier Grass
In evaluating the ethanol production potential, we employed two yeast strains, which are S. cerevisiae TISTR 5339 and S. shehatae ATCC 22984, and two fermentation techniques viz. SHF (separate hydrolysis and fermentation) and SSF (simultaneous saccharification and fermentation). The SHF technique utilizes liquid hydrolysate obtained from enzymatic hydrolysis of NaOH-pretreated Napier grass, while the SSF technique uses the NaOH-pretreated grass in the fermentation.
3.4.1. Ethanol Production by S. cerevisiae TISTR 5339
Ethanol production by
S. cerevisiae was carried out using two cultivation techniques, SHF and SSF. The liquid hydrolysate used in SHF contained 134.9 g/L reducing sugar, of which 90.8 g/L was glucose and 18.8 g/L was xylose. In SHF (
Figure 5a), the maximum ethanol of 44.7 g/L was obtained after 24 h cultivation. Glucose utilization was in accord with increasing ethanol concentration. Yeast growth also related to glucose utilization with the maximum specific growth rate of 2.79 ± 0.09 1/d. The growth ceased when glucose consumption ended. In addition, xylose decreased throughout the fermentation with the total xylose uptake of 6.71 g/L, which was 32.9% of the total amount. Slight increase of xylitol was observed with the final concentration of 2.47 g/L. The fermentation profiles suggested that ethanol was mainly produced from glucose with the yield of 0.49 g/g.
In ethanol production using SSF by
S. cerevisiae TISTR 5339 (
Figure 5b), glucose remained at a low level throughout the fermentation. Glucose was gradually released and taken up by the yeast to produce ethanol and 40.8 g/L of ethanol was produced after 36 h. Yeast growth appeared to be very slow at the beginning of the fermentation. The use of high solid loading in the fermentation could result in this initial apparent slow growth where clear separation of the solid and liquid phases was evident. The growing yeast could attach to the surface of the grass and undetected in the liquid phase. After 12 h, the physical appearance of the fermentation became slurry and the cells could detach from the grass into the liquid resulting in an increase in cell count. The maximum specific growth rate of 3.08 ± 0.03 1/d was slightly higher than that of SHF and the final cell count was slightly higher than that in SHF. Xylose accumulated during the first 24 h together with xylitol accumulation. The final xylitol concentration was 5.96 g/L. The simultaneous increase of xylose and xylitol indicated that xylitol was produced along with the release of xylose from the grass.
3.4.2. Ethanol Production by S. shehatae ATTC 22984
Both SHF and SSF were also employed in the study of ethanol production by
S. shehatae ATTC 22984 (
Figure 6a,b). The sugar concentrations in the Napier grass hydrolysate was similar to those used in the SHF study using
S. cerevisiae. In SHF, production of ethanol directly related to glucose utilization with the highest concentration of 31.3 g/L, which was significantly lower than that obtained using
S. cerevisiae. Xylose utilization observed during the fermentation was as expected as the yeast is a xylose-fermenting yeast. However, profile analysis suggested that xylose did not contribute to ethanol production but to xylitol production with the final xylitol concentration of 2.5 g/L. The growth profile in SHF showed the continuous growth during the first 48 h of fermentation. The uncoupling ethanol production after 48 h suggested a possibility of product inhibition effect on growth of
S. shehatae.
When cultivating
S. shehatae using SSF (
Figure 6b), the growth profile in relation to ethanol profile was similar to that occurred in SHF, suggesting also a possibility of growth inhibition by ethanol. The glucose profile showed a slight increase in concentration during the first 24 h before dropped and remained at low level throughout the fermentation. The small accumulation of glucose suggested a lower growth rate of the yeast as compared to the rate of sugar released from the grass by the action of enzyme. Accumulation of xylose confirmed the ineffective xylose utilization, especially at high ethanol concentration. The final ethanol concentration obtained from SSF was 34 g/L, which was significantly higher than that obtained from SHF. Along with ethanol production, xylitol was also produced and the final concentration was 3.33 g/L.
The summary in
Table 10 shows that
S. cerevisiae TISTR 5339 is able to deliver a superior ethanol production than
S. shehatae ATCC 22984, in terms of concentration, productivity, and ethanol yield.
S. shehatae, a xylose-fermenting yeast, did not deliver the expected xylose-fermenting ability when fermenting in hydrolysate that contained high glucose concentration. The overall ethanol production yield from Napier grass suggested that the grass could be used for ethanol production with the best yield of 187.4 g/kg of dried Napier grass obtained with SHF fermentation by
S. cerevisiae. The results of this study are in the range, or above the average, of other studies both in terms of concentration obtained during fermentation and in terms of ethanol yield based on the amount of biomass used (
Table 11).
4. Discussion
Regarding the use of dilute acid or NaOH for pretreatment of Napier or elephant grass, the results varied among several studies but they were all towards the same trend. A study showed that dilute acid reduced both lignin and hemicellulose contents of the grass, while NaOH treatment only reduced lignin content but not hemicellulose [
14]. Our results on dilute acid pretreatment followed a similar reduction trend of both lignin and hemicellulose. However, we found that NaOH solubilized not only lignin, but also the hemicellulose fraction (
Table 6). These results agreed with some other studies where hemicellulose reduction was reported in alkali treatment but to a smaller extent when compared to acid pretreatment [
20,
24]. Both lignin and hemicellulose removals by alkali pretreatment were also evident in other biomass, such as sweet sorghum straw [
25] and sugarcane bagasse [
26].
Treatment with NaOH alters Napier grass structure by causing swelling of the structures, while the acid-treated grass maintained a smooth surface, as evident in
Figure 3b,c. The swelling is the result of a saponification reaction at the ester bonds between 4-O-methylglucuronic acid and xylan by NaOH [
30]. The swelled structure allows enzymes to penetrate, resulting in a more efficient hydrolysis [
31]. This explanation supports the results shown in
Table 2,
Table 4 and
Table 5 where susceptibility to cellulase hydrolysis of the grass was higher when treated with NaOH as compared to dilute acid. Severity of pretreatment has shown effects on the hydrolysis step. The use of mild pretreatments such as hot water and dilute NaOH resulted in low ethanol concentrations obtained even with further enzymatic hydrolysis of pretreated biomass [
28,
32]. However, it should be noted that a suitable strength of pretreatment is also important. A study on the pretreatment of switch grass showed that a high level of delignification reduces the cellulose accessibility to cellulase due to the change in cellulose structure that led to the reduction in available surface area for enzyme adsorption [
13]. The result from that study explains our results in
Figure 1a where the susceptibility appeared to decrease when NaOH exceeded 2 M.
In addition, extra lignin removal in the grass pretreated with NaOH followed by H
2SO
4 (
Table 6) did not enhance the susceptibility of the grass to cellulose hydrolysis. The susceptibility indicates an ability of cellulase to access and hydrolyse a structure. The results agreed with those reported earlier that the key parameter for hydrolysis of lignocellulosic materials was cellulose accessibility, rather than lignin content or crystallinity of the biomass [
12,
13,
16].
The effect of alkali and dilute acid on the susceptibility of the grass during pretreatment process reflects on the results of hydrolysis studies. Since the dilute acid pretreatment resulted in the pretreated grass with the structure that was less susceptible to hydrolysis by cellulase, as indicated by its low susceptibility value, the enzyme dosage required for its hydrolysis was much lower than that for the alkali-treated grasses (
Table 9). Similar to the case of excessive delignification, a lesser area accessible by the enzyme resulted in lower sugars obtained from the hydrolysis of the grass pretreated by dilute acid. In addition, the lesser accessible area could cause the limit in hydrolysis even at low enzyme dosage, such that increase in enzyme dosage did not result in a further increase in reducing sugars as evident in
Figure 4b. ANOVA of the acid pretreated grass in
Table 8 also confirmed this result as the enzyme dosage did not exert a significant effect on the hydrolysis.
Regarding the fermentation for ethanol production, decrease in xylose during
S. cerevisiae fermentation was not expected, as the yeast is not reported as a xylose-fermenting yeast. The decrease may be the result of xylose transport into the cells. Xylose intake through glucose transport system was formerly reported in
S. cerevisiae [
33]. In addition,
S. cerevisiae also inherits xylose reductase and xylitol dehydrogenase activities. Xylose reductase is induced by xylose and xylitol produced accumulates without further conversion to ethanol [
33,
34].
When comparing the cultivations of
S. cerevisiae via SHF and SSF (
Table 10), it is evident that SHF yields higher ethanol concentration and productivity. The hydrolysis of Napier grass at its optimal temperature yields high sugar concentration, whereas the hydrolysis in SSF occurs at 30 °C at which the enzyme has lower activity. A 24-h hydrolysis test of pretreated Napier grass at 30 °C resulted in 119.1 g/L reducing sugar in which contained 82.1 g/L glucose and 14.1 g/L xylose. These values were slightly lower than the hydrolysate used in SHF. The maximum specific growth rate in SSF was, in contrary, slightly higher than that in SHF. Substrate inhibition on growth could explain the result obtained, as glucose at the concentration higher than 80 g/L showed an inhibition effect on
S. cerevisiae [
35]. Despite the higher ethanol obtained from SHF, the process involved the hydrolysis period, which resulted in a significantly lower overall ethanol productivity for the process. Reducing the hydrolysis time in SHF would improve this overall productivity value.
In SHF of
S. shehatae, which is a xylose-fermenting yeast, the yeast utilized only 33% of the xylose. The issue should not relate to the presence of inhibitors normally found in acid hydrolysate, as we used enzymatic hydrolysis. This result contradicts our initial assumption that the yeast could effectively utilize xylose. We based the assumption on our previous study that showed the yeast’s ability to ferment both glucose and xylose to ethanol [
36]. However, the current work involved the use of higher concentration of sugars (in hydrolysate). It could be possible that the higher ethanol concentration at the time glucose depleted in this study could have a more negative effect to xylose transport than in our previous work.
The use of SHF and SSF in ethanol production by
S. shehatae resulted differently from the cultivations of
S. cerevisiae. In this case, the SSF by
S. shehatae resulted in higher ethanol concentration regardless of a similar specific growth rate of the yeast between both fermentation techniques (
Table 10). By comparing the ethanol production profiles during the first 24 h of fermentation (
Figure 6), it is evident that the ethanol produced in SSF was higher than that in SHF, resulting also in a higher ethanol concentration obtained in SSF at the end of the fermentation. The faster ethanol production could be the result of lower sugar concentration during the fermentation that alleviated the substrate inhibition effect on product formation. The conversion yield of sugar in the hydrolysate appears more effective in SSF for
S. shehatae as the ethanol was higher than that obtained from SHF regardless of the lower sugar obtained from hydrolysis at 30 °C.


