Measuring the Renewable Energy Efficiency at the European Union Level and Its Impact on CO2 Emissions


Abstract
1. Introduction
2. Literature Review and Hypotheses Development
3. Materials and Methods
3.1. Sample Description
3.2. Description of the Variables Used in the Econometric Model
3.3. The Econometric Model
4. Results
4.1. A Description of the Indicators Used in the Model
4.2. The Econometric Model
5. Discussion of the Results
6. Conclusions
Funding
Acknowledgments
Conflicts of Interest
Abbreviations
| EU | European Union |
| RES | Renewable energy systems |
| CO2 | Carbon dioxide |
| GDP | Gross domestic product |
| COP | Communication on Progress |
| RPS | Regulated Product Submissions |
| SDG | Sustainable development goal |
| UNFCCC | United Nations Framework Convention on Climate Change |
| EVIEWS | Econometric Views |
| VIF | Variance Inflection Factor |
| EUROSTAT | Statistical Office of the European Union |
| COP | Conference of Parties |
| LMDI | Logarithmic Mean Divisia Index |
References
- Markandya, A.; Armstrong, B.G.; Hales, S.; Chiabai, A.; Criqui, P.; Mima, S.; Wilkinson, P. Public health benefits of strategies to reduce greenhouse-gas emissions: Low-carbon electricity generation. Lancet 2009, 374, 2006–2015. [Google Scholar] [CrossRef]
- Anderson, K.; Ryan, B.; Sonntag, W.; Kavvada, A.; Friedl, L. Earth observation in service of the 2030 Agenda for Sustainable Development. Geo-Spat. Inf. Sci. 2017, 20, 77–96. [Google Scholar] [CrossRef]
- Mohnen, V.A.; Goldstein, W.; Wang, W.C. The conflict over global warming: The application of scientific research to policy choices. Glob. Environ. Chang. 1991, 1, 109–123. [Google Scholar] [CrossRef]
- Bang, G. Energy security and climate change concerns: Triggers for energy policy change in the United States? Energy Policy 2010, 38, 1645–1653. [Google Scholar] [CrossRef]
- COP 21 Report. 2015. Available online: https://www.gouvernement.fr/en/cop21 (accessed on 25 September 2019).
- Sims, R.E.; Rogner, H.H.; Gregory, K. Carbon emission and mitigation cost comparisons between fossil fuel, nuclear and renewable energy resources for electricity generation. Energy Policy 2003, 31, 1315–1326. [Google Scholar] [CrossRef]
- Menyah, K.; Wolde-Rufael, Y. CO2 emissions, nuclear energy, renewable energy and economic growth in the US. Energy Policy 2010, 38, 2911–2915. [Google Scholar] [CrossRef]
- Kök, A.G.; Shang, K.; Yücel, Ş. Impact of electricity pricing policies on renewable energy investments and carbon emissions. Manag. Sci. 2016, 64, 131–148. [Google Scholar] [CrossRef]
- Tang, A.; Chiara, N.; Taylor, J.E. Financing renewable energy infrastructure: Formulation, pricing and impact of a carbon revenue bond. Energy Policy 2012, 45, 691–703. [Google Scholar] [CrossRef]
- Liu, X.; Zhang, S.; Bae, J. The impact of renewable energy and agriculture on carbon dioxide emissions: Investigating the environmental Kuznets curve in four selected ASEAN countries. J. Clean. Prod. 2017, 164, 1239–1247. [Google Scholar] [CrossRef]
- Fagiani, R.; Richstein, J.C.; Hakvoort, R.; De Vries, L. The dynamic impact of carbon reduction and renewable support policies on the electricity sector. Util. Policy 2014, 28, 28–41. [Google Scholar] [CrossRef]
- Walker, G.; Cass, N. Carbon reduction, the publicand renewable energy: Engaging with socio-technical configurations. Area 2007, 39, 458–469. [Google Scholar] [CrossRef]
- Johnson, E.P. The cost of carbon dioxide abatement from state renewable portfolio standards. Resour. Energy Econ. 2014, 36, 332–350. [Google Scholar] [CrossRef]
- Kaya, Y.; Yokobori, K. (Eds.) Environment, Energy, and Economy: Strategies for Sustainability; United Nations University Press: Tokyo, Japan, 1997. [Google Scholar]
- Li, W.; Ou, Q.; Chen, Y. Decomposition of China’s CO2 emissions from agriculture utilizing an improved Kaya identity. Environ. Sci. Pollut. Res. 2014, 21, 13000–13006. [Google Scholar] [CrossRef] [PubMed]
- Mavromatidis, G.; Orehounig, K.; Richner, P.; Carmeliet, J. A strategy for reducing CO2 emissions from buildings with the Kaya identity—A Swiss energy system analysis and a case study. Energy Policy 2016, 88, 343–354. [Google Scholar] [CrossRef]
- Jung, S.; An, K.J.; Dodbiba, G.; Fujita, T. Regional energy-related carbon emission characteristics and potential mitigation in eco-industrial parks in South Korea: Logarithmic mean Divisia index analysis based on the Kaya identity. Energy 2012, 46, 231–241. [Google Scholar] [CrossRef]
- Tu, M.; Li, Y.; Bao, L.; Wei, Y.; Orfila, O.; Li, W.; Gruyer, D. Logarithmic Mean Divisia Index Decomposition of CO2 Emissions from Urban Passenger Transport: An Empirical Study of Global Cities from 1960–2001. Sustainability 2019, 11, 4310. [Google Scholar] [CrossRef]
- Feng, Y.; Wang, X.; Du, W.; Liu, J. Effects of Air Pollution Control on Urban Development Quality in Chinese Cities Based on Spatial Durbin Model. Int. J. Environ. Res. Public Health 2018, 15, 2822. [Google Scholar] [CrossRef]
- Brand, C.; Goodman, A.; Ogilvie, D.; iConnect Consortium. Evaluating the impacts of new walking and cycling infrastructure on carbon dioxide emissions from motorized travel: A controlled longitudinal study. Appl. Energy 2014, 128, 284–295. [Google Scholar] [CrossRef]
- Schipper, L.; Banerjee, I.; Ng, W.S. Carbon dioxide emissions from land transport in India: Scenarios of the uncertain. Transp. Res. Rec. 2009, 2114, 28–37. [Google Scholar] [CrossRef]
- Ho, C.S.; Matsuoka, Y.; Simson, J.; Gomi, K. Low carbon urban development strategy in Malaysia—The case of Iskandar Malaysia development corridor. Habitat Int. 2013, 37, 43–51. [Google Scholar] [CrossRef]
- Parthan, B.; Osterkorn, M.; Kennedy, M.; Bazilian, M.; Monga, P. Lessons for low-carbon energy transition: Experience from the Renewable Energy and Energy Efficiency Partnership (REEEP). Energy Sustain. Dev. 2010, 14, 83–93. [Google Scholar] [CrossRef]
- Fernando, Y.; Hor, W.L. Impacts of energy management practices on energy efficiency and carbon emissions reduction: A survey of Malaysian manufacturing firms. Resour. Conserv. Recycl. 2017, 126, 62–73. [Google Scholar] [CrossRef]
- Schmidheiny, K. Short Guides to Micro Econometrics: The Multiple Linear Regression Model. 2016. Available online: http://www.schmidheiny. name/teaching/panel2up.pdf (accessed on 24 November 2019).
- Eurostat. Available online: http://ec.europa.eu/eurostat (accessed on 28 September 2019).
- Beaver, W.H.; Clarke, R.; Wright, W.F. The association between unsystematic security returns and the magnitude of earnings forecast errors. J. Account. Res. 1979, 316–340. [Google Scholar] [CrossRef]
- Dabholkar, P.A.; Thorpe, D.I.; Rentz, J.O. A measure of service quality for retail stores: Scale development and validation. J. Acad. Mark. Sci. 1996, 24, 3. [Google Scholar] [CrossRef]
- Busu, M. The Role of Renewables in a Low-Carbon Society: Evidence from a Multivariate Panel Data Analysis at the EU Level. Sustainability 2019, 11, 5260. [Google Scholar] [CrossRef]
- Nguyen Duc, D.; Nananukul, N. Advanced Methodologies for Biomass Supply Chain Planning. Processes 2019, 7, 659. [Google Scholar]
- Zhang, X.; Ao, X.; Cai, W.; Jiang, Z.; Zhang, H. A sustainability evaluation method integrating the energy, economic and environment in remanufacturing systems. J. Clean. Prod. 2019, 239, 118100. [Google Scholar] [CrossRef]
- Ma, M.; Ma, X.; Cai, W.; Cai, W. Carbon-dioxide mitigation in the residential building sector: A household scale-based assessment. Energy Convers. Manag. 2019, 198, 111915. [Google Scholar] [CrossRef]
- Busu, M. Applications of TQM Processes to Increase the Management Performance of Enterprises in the Romanian Renewable Energy Sector. Processes 2019, 7, 685. [Google Scholar] [CrossRef]
- Wang, Q.; Zeng, Y.E.; Wu, B.W. Exploring the relationship between urbanization, energy consumption, and CO2 emissions in different provinces of China. Renew. Sustain. Energy Rev. 2016, 54, 1563–1579. [Google Scholar] [CrossRef]
- Zhu, Q.; Peng, X. The impacts of population change on carbon emissions in China during 1978–2008. Environ. Impact Assess. Rev. 2012, 36, 1–8. [Google Scholar] [CrossRef]
- Busu, M. Assessment of the Impact of Bioenergy on Sustainable Economic Development. Energies 2019, 12, 578. [Google Scholar] [CrossRef]
- Zhang, Y.J.; Liu, Z.; Zhang, H.; Tan, T.D. The impact of economic growth, industrial structure and urbanization on carbon emission intensity in China. Nat. Hazards 2014, 73, 579–595. [Google Scholar] [CrossRef]
- Marques, A.C.; Fuinhas, J.A.; Manso, J.P. Motivations driving renewable energy in European countries: A panel data approach. Energy Policy 2010, 38, 6877–6885. [Google Scholar] [CrossRef]
- D’Adamo, I.; Rosa, P. Current state of renewable energies performances in the European Union: A new reference framework. Energy Convers. Manag. 2016, 121, 84–92. [Google Scholar] [CrossRef]
- EU. Regulation (EC) No 2150/2002 of the European Parliament and the Council on Waste Statistics. 2002. Available online: http://www.kluwerlawonline.com/abstract.php?id=EELR2003019 (accessed on 13 November 2019).


| Hypotheses | |
|---|---|
| H1 | Renewable energy use in the European Union member states has a significant and inverse impact on carbon emissions. |
| H2 | Energy productivity in the European Union countries is strongly correlated with carbon emissions. |
| H3 | Population level in European Union member states has a significant and direct impact carbon emissions. |
| H4 | Economic development has a significant impact on carbon emissions in European Union member states. |
| Variable | Name | Definition | Unit |
|---|---|---|---|
| (Y) | CO2 emissions | CO2 emission levels in European Union countries | Million tons |
| (X1) | Renewable energy | Renewable energy consumption in European Union member states as a percentage of total energy | Percentage (%) |
| (X2) | Energy productivity | Measure of the productivity of energy consumption in a given calendar year in European Union member states. This results from the division of the gross domestic product (GDP) by the gross inland consumption of energy | Euro/kg |
| (X3) | Population | Number of inhabitants in each European Union country | Millions |
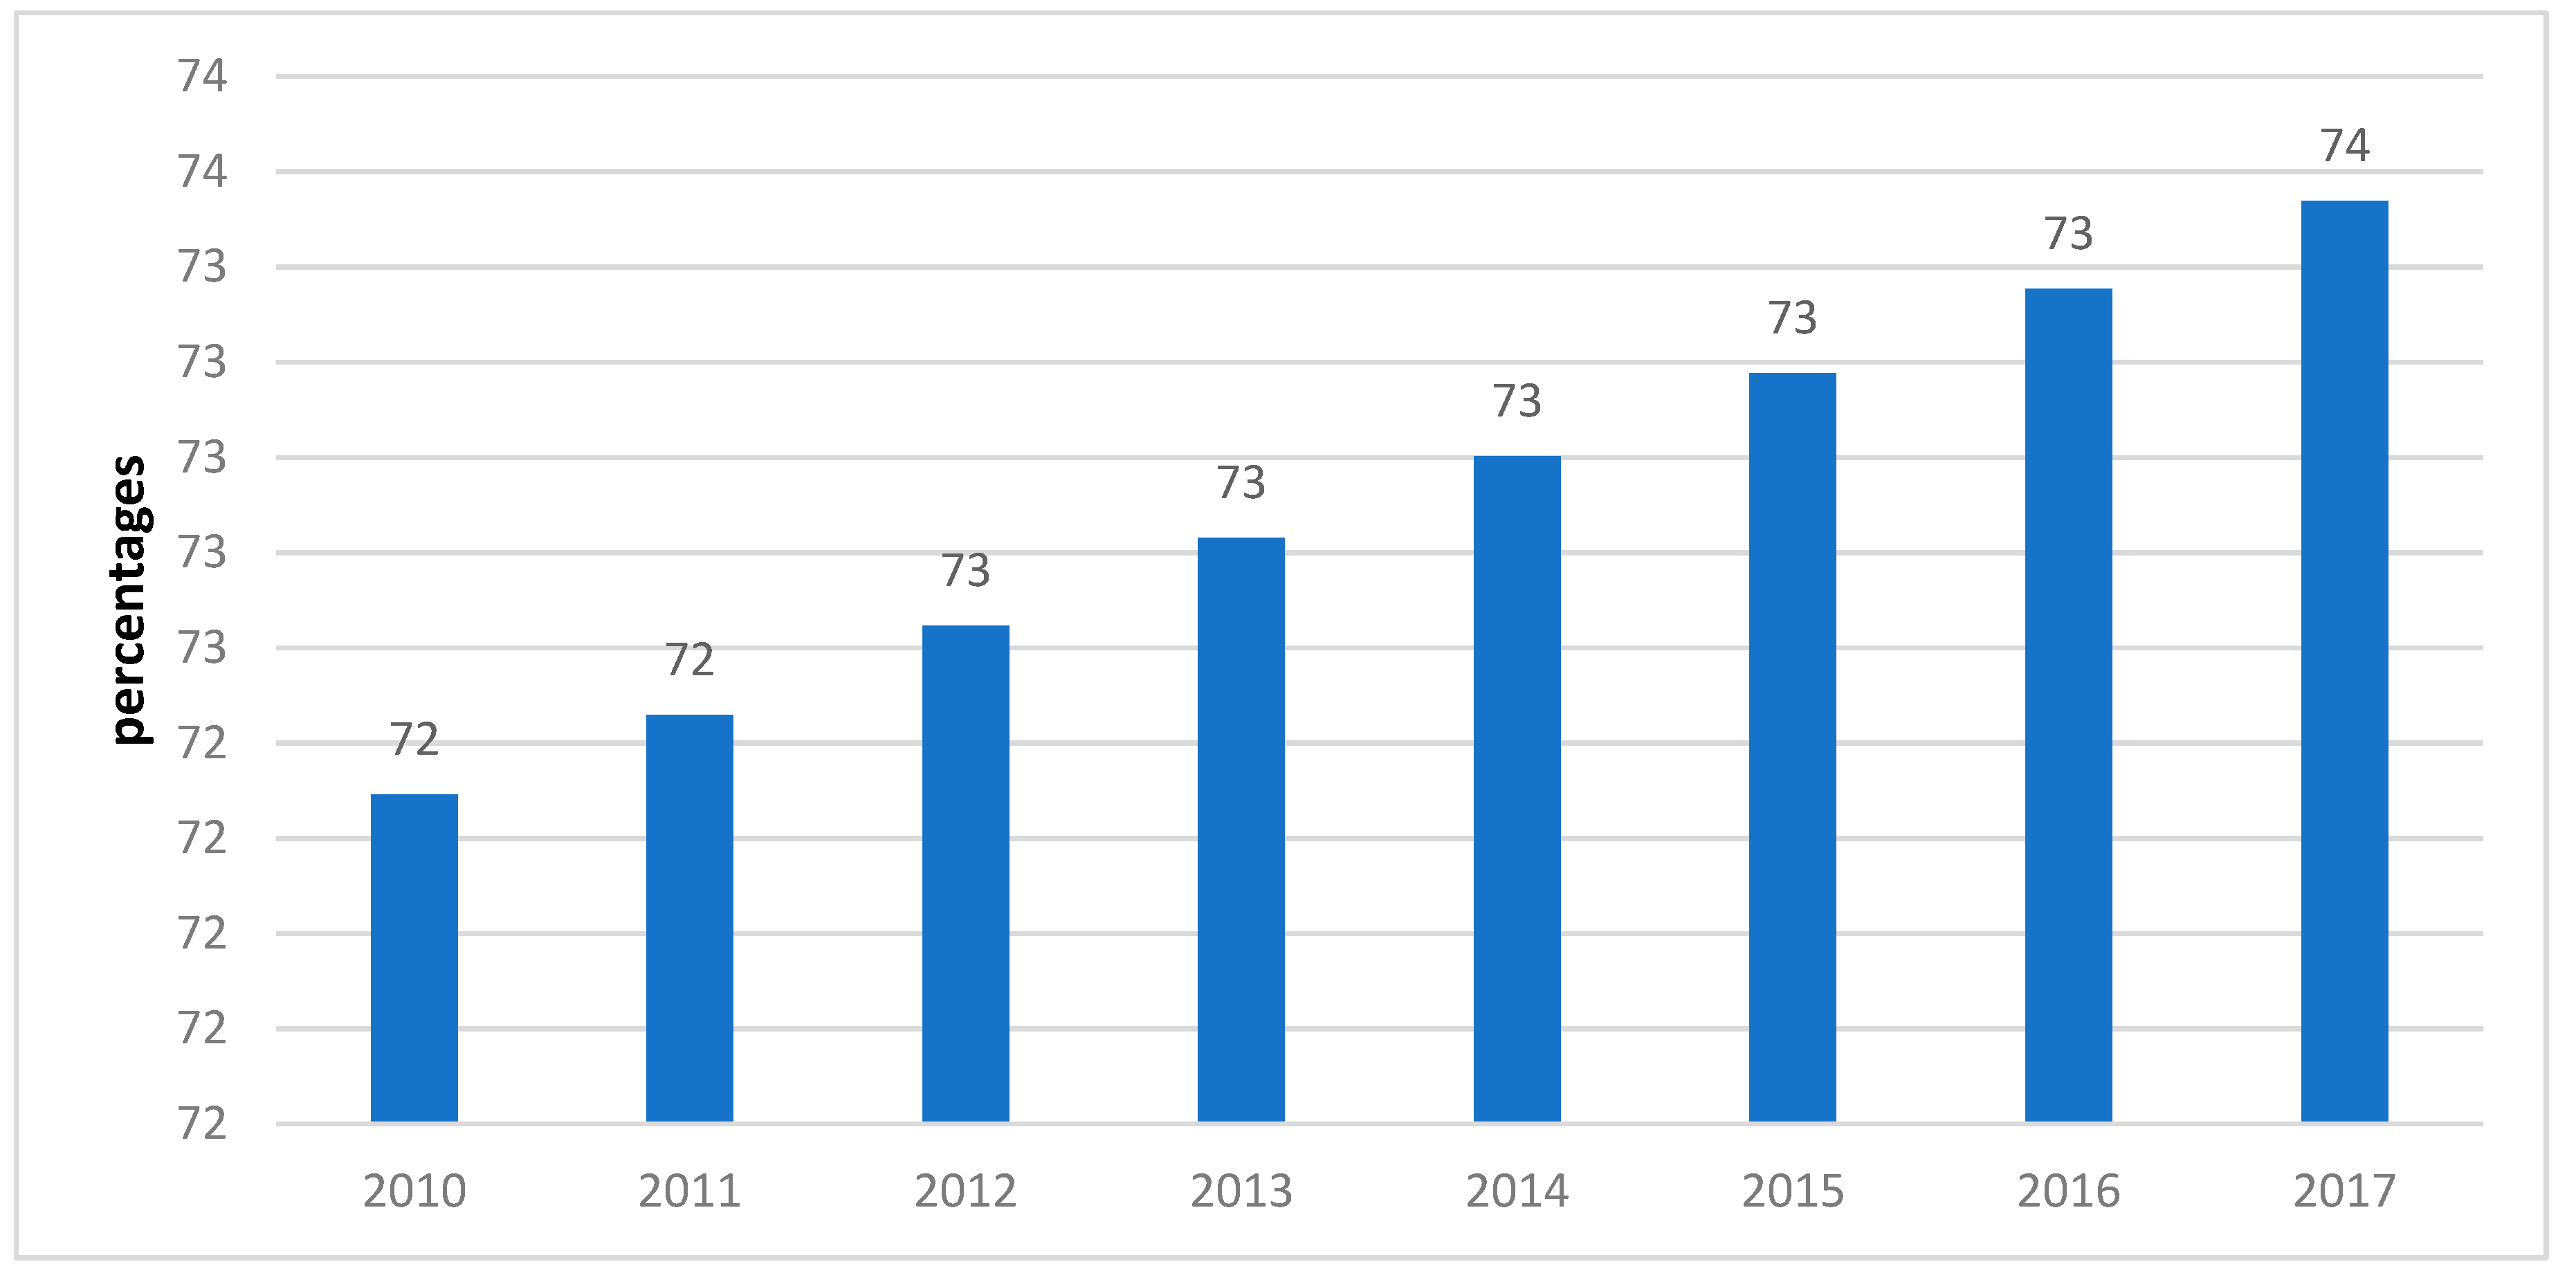
| (X4) | Urbanization | Percentage of total population living in urban areas at the European Union level | Percentage (%) |
| (X5) | Motorization | Passenger cars per 1000 inhabitants in European Union member states | Units |
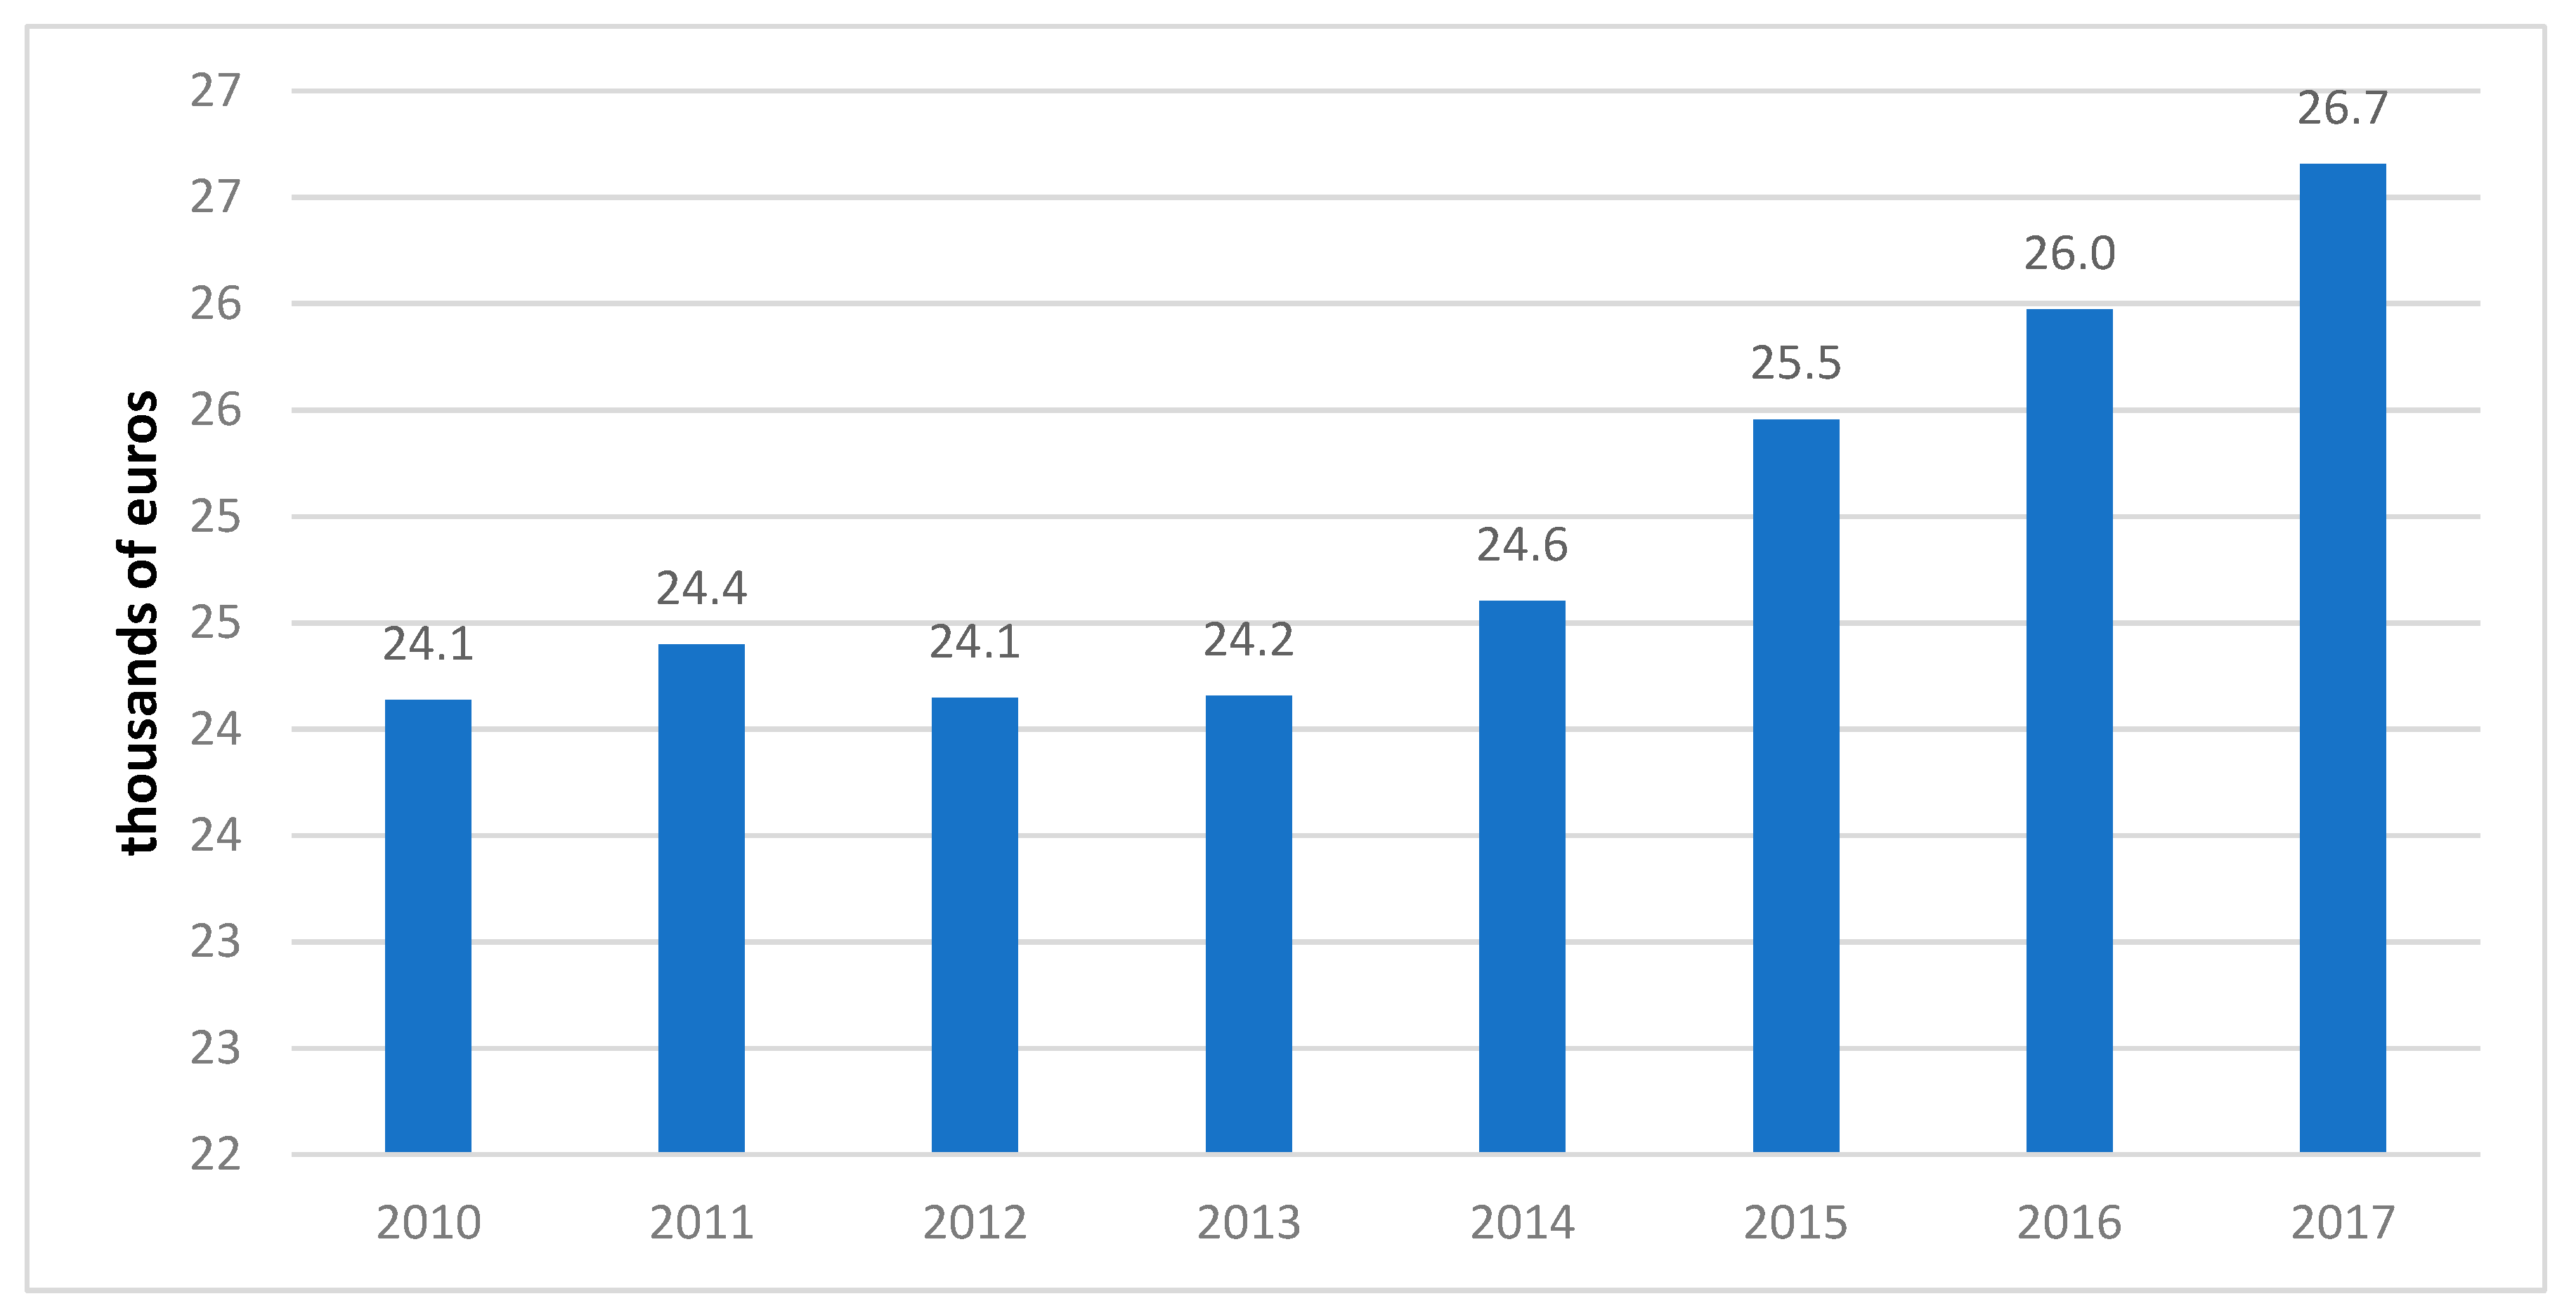
| (X6) | Real GDP per capita | Real GDP in European Union countries, in thousands of euro, divided by the number of inhabitants | Thousands of euro |
| Variable | Mean | Median | Standard Deviation | N |
|---|---|---|---|---|
| CO2 (Y) | 47.72 | 44.34 | 12.34 | 28 |
| Renewable energy (X1) | 17.70 | 18.21 | 3.45 | 28 |
| Energy productivity (X2) | 6.54 | 6.78 | 2.46 | 28 |
| Population (X3) | 18.14 | 19.20 | 3.24 | 28 |
| Urbanization (X4) | 73.21 | 68.56 | 4.82 | 28 |
| Motorization (X5) | 3791.09 | 3820 | 112.34 | 28 |
| Real GDP per capita (X6) | 24.94 | 26.12 | 3.21 | 28 |
| Variable | Y | X1 | X2 | X3 | X4 | X5 | X6 |
|---|---|---|---|---|---|---|---|
| Y | 1 | ||||||
| X1 | 0.712 | 1 | |||||
| X2 | 0.705 | 0.203 | 1 | ||||
| X3 | 0.648 | 0.184 | 0.129 | 1 | |||
| X4 | 0.602 | 0.196 | 0.189 | 0.126 | 1 | ||
| X5 | 0.589 | 0.278 | 0.205 | 0.104 | 0.134 | 1 | |
| X6 | 0.604 | 0.178 | 0.214 | 0.206 | 0.178 | 0.196 | 1 |
| Correlated Random Effects—Hausman Test | ||||
|---|---|---|---|---|
| Test Summary | Chi-Square Statistic | Chi-Square D.F. | Probability | |
| Random cross-section | 10.765397 | 8 | 0.0943 | |
| Dependent variable | Independent variable | Coefficient | Probability | R-squared |
| CO2 | Renewable energy (X1) | −0.108 | 0.042 | 0.42786 |
| Energy productivity (X2) | −0.105 | 0.038 | ||
| Population (X3) | 0.112 | 0.018 | ||
| Urbanization (X4) | 0.148 | 0.028 | ||
| Motorization (X5) | 0.178 | 0.023 | ||
| Real GDP per capita (X6) | 0.125 | 0.032 | ||
| Variance Inflation Factors Date: October 17, 2019 Time: 10:31 Sample: 2010–2017 Included Observations: 224 | |||
|---|---|---|---|
| Variable | Coefficient Variance | Uncentered VIF | Centered VIF |
| C | 6.456 | NA | |
| Renewable energy | 1.345 | 2.109 | 1.378 |
| Energy productivity | 1.102 | 2.302 | 1.786 |
| Population | 1.201 | 2.211 | 1.203 |
| Urbanization | 1.128 | 2.512 | 1.215 |
| Motorization | 1.832 | 2.214 | 1.405 |
| Real GDP per capita | 1.389 | 1.876 | 1.307 |
© 2019 by the author. Licensee MDPI, Basel, Switzerland. This article is an open access article distributed under the terms and conditions of the Creative Commons Attribution (CC BY) license (http://creativecommons.org/licenses/by/4.0/).
Share and Cite
Busu, M. Measuring the Renewable Energy Efficiency at the European Union Level and Its Impact on CO2 Emissions. Processes 2019, 7, 923. https://doi.org/10.3390/pr7120923
Busu M. Measuring the Renewable Energy Efficiency at the European Union Level and Its Impact on CO2 Emissions. Processes. 2019; 7(12):923. https://doi.org/10.3390/pr7120923
Chicago/Turabian StyleBusu, Mihail. 2019. "Measuring the Renewable Energy Efficiency at the European Union Level and Its Impact on CO2 Emissions" Processes 7, no. 12: 923. https://doi.org/10.3390/pr7120923
APA StyleBusu, M. (2019). Measuring the Renewable Energy Efficiency at the European Union Level and Its Impact on CO2 Emissions. Processes, 7(12), 923. https://doi.org/10.3390/pr7120923