Article

A Dispatching Optimization Model for Park Power Supply Systems Considering Power-to-Gas and Peak Regulation Compensation

1
School of Economics and Management, North China Electric Power University, Beijing 102206, China
2
Beijing Key Laboratory of New Energy and Low-Carbon Development, North China Electric Power University, Beijing 102206, China
3
State Grid Jibei Electric Power Economic Research Institute, Beijing 100000, China
*
Author to whom correspondence should be addressed.
Processes 2019, 7(11), 813; https://doi.org/10.3390/pr7110813
Submission received: 6 October 2019 / Revised: 25 October 2019 / Accepted: 28 October 2019 / Published: 4 November 2019

Abstract

:
To ensure the stability of park power supply systems and to promote the consumption of wind/photovoltaic generation, this paper proposes a dispatching optimization model for the park power supply system with power-to-gas (P2G) and peak regulation via gas-fired generators. Firstly, the structure of a park power system with P2G was built. Secondly, a dispatching optimization model for the park power supply system was constructed with a peak regulation compensation mechanism. Finally, the effectiveness of the model was verified by a case study. The case results show that with the integration of P2G and the marketized peak regulation compensation mechanism, preferential power energy storage followed by gas storage had the best effect on the park power supply system, which minimized the clean energy curtailment to 11.18% and the total cost by approximately $120.190 and maximized the net profit by approximately $152.005.

1. Introduction

Due to the fluctuation and randomness of wind/photovoltaic power generation, the issue of energy curtailment in China is still serious [1]. According to data from the National Energy Administration of China, the amount of wind power curtailment reached 10.5 billion kW·h in the first half of the year 2019 [2]. Wind/photovoltaic power curtailment is an obstacle to the development of clean energy in China and may cause greater economic losses. Therefore, research on the consumption of wind/photovoltaic power generation is still of great practical significance.
Power-to-gas (P2G) technology can, to a great extent, reduce wind/photovoltaic curtailment. Unconsumed electricity can be converted into natural gas via P2G and then into electricity in reverse through gas-fired generators (GFG), which plays a positive role in the consumption of clean energy generation [3]. Therefore, P2G can change the coupling modes of different energies [4]. In the previous studies on P2G, Gholizadeh et al. [5] evaluated and enhanced the security of P2G in networked energy hubs. Yang et al. [6] and Ye et al. [7] proposed optimal dispatching models for the multi-energy systems, which provided a new optimization method for the flexible operation of integrated energy systems. P2G technology can promote the level of renewable energy consumption in a hybrid system, as demonstrated by Marco et al. [8] and Hassan et al. [9]. Fischer al. [10] looked into the use of on-site storage and a model predictive controller and came up with possible solutions for P2G in a smart city context. All of the studies highlighted that P2G is an effective tool to promote the coupling of electricity and gas as well as clean energy consumption. Miguel et al. [11] analyzed the prospect of P2G in Portugal, while Garcia et al. [12] expanded the scope of research and extended it to Europe. Although the P2G is promising, it is still in the early stage of development [13]; thus, it is necessary to continue to study in this field.
Gas-fired power generation is the key for P2G to participate in the power-gas-power cycle. GFGs are quick to start/stop, have an easily adjustable output, and operate flexibly, which are suitable for peak regulation. Ghasemi et al. [14] looked into the importance of the gas-fired power plant location in a power-gas system with respect to peak regulation. Zhao et al. [15] studied the economy of peak regulation only via GFG, while Zhong et al. [16] analyzed the economy of peak regulation via GFG and electric vehicles under the battery-to-gas mode.
Peak regulation compensation is a method that is used to encourage the GFG to participate in peak regulation [17]. The importance of peak regulation compensation and its optimization have been discussed in the studies of Li et al. [18], Yang et al. [19], and Na et al. [20]. However, the above studies did not take P2G into consideration in their models.
In terms of the peak regulation of GFG, fuzzy clustering [21], mixed integer programming [22], and cooperative game models [16] were adopted to study its technological economy. With regard to P2G, Gil et al. [23] used the two-stage optimal power flow method to evaluate the impact of P2G technology on power and natural gas networks; the operational risks and costs of electrical systems due to wind power uncertainty were analyzed with the Conditional Value at Risk (CVaR) theory by Xu et al. [24], while Tan et al. [25] improved the CVaR theory to study the integrated energy system along with robust optimization. Weiler et al. [26] used three dimensional (3D) urban modeling tools in heat pump and co-generation systems.
Although previous research referred to integrated energy systems with P2G for energy coupling and power curtailment reduction, the role that the P2G plays in peak regulation to promote wind/photovoltaic consumption is absent, since peak regulation is so important in the current situation where China is trying to construct an electricity spot market and the production of clean energy is being encouraged to replace conventional fossil energy for sustainable development. Also, the economy of peak regulation via GFGs with the compensation mechanism was studied without the consideration of P2G’s effect in prior literature. Hence, the research questions of this paper focus on three aspects. First, is the combination of P2G and peak regulation via GFG with compensation better for wind/photovoltaic consumption? Second, does this combination help with making more profit for industrial parks? Third, does the use of the energy storage device and P2G lead to different results? To answer the research questions, this study contributes in the following way, compared with the previously published papers:
First, more attention is paid to the optimization effect of the P2G on the park power supply system. In that case, whether the P2G, as an incentive, is conducive to clean energy utilization and the reduction of GFG’s costs is found out. Second, the marketized peak regulation compensation mechanism, as another incentive, is introduced to better encourage GFG to cooperate with clean energy units for more clean energy consumption. Finally, with the integration of P2G and peak regulation compensation, scenarios, including different use orders of the energy storage device and the gas storage tank with the P2G, are designed in order to analyze which order is better for making the maximum profit for the system. The analysis result could serve as a reference for the practical application of these two devices.

2. Dispatching Optimization Model for the Park Power Supply System

To mitigate the clean energy curtailment without profit loss, a dispatching optimization model for the park power supply system needs to be constructed. In this section, the structure of the park power supply system is described, followed by the output model construction of different types of equipment. Finally, objective functions are established with constraints.

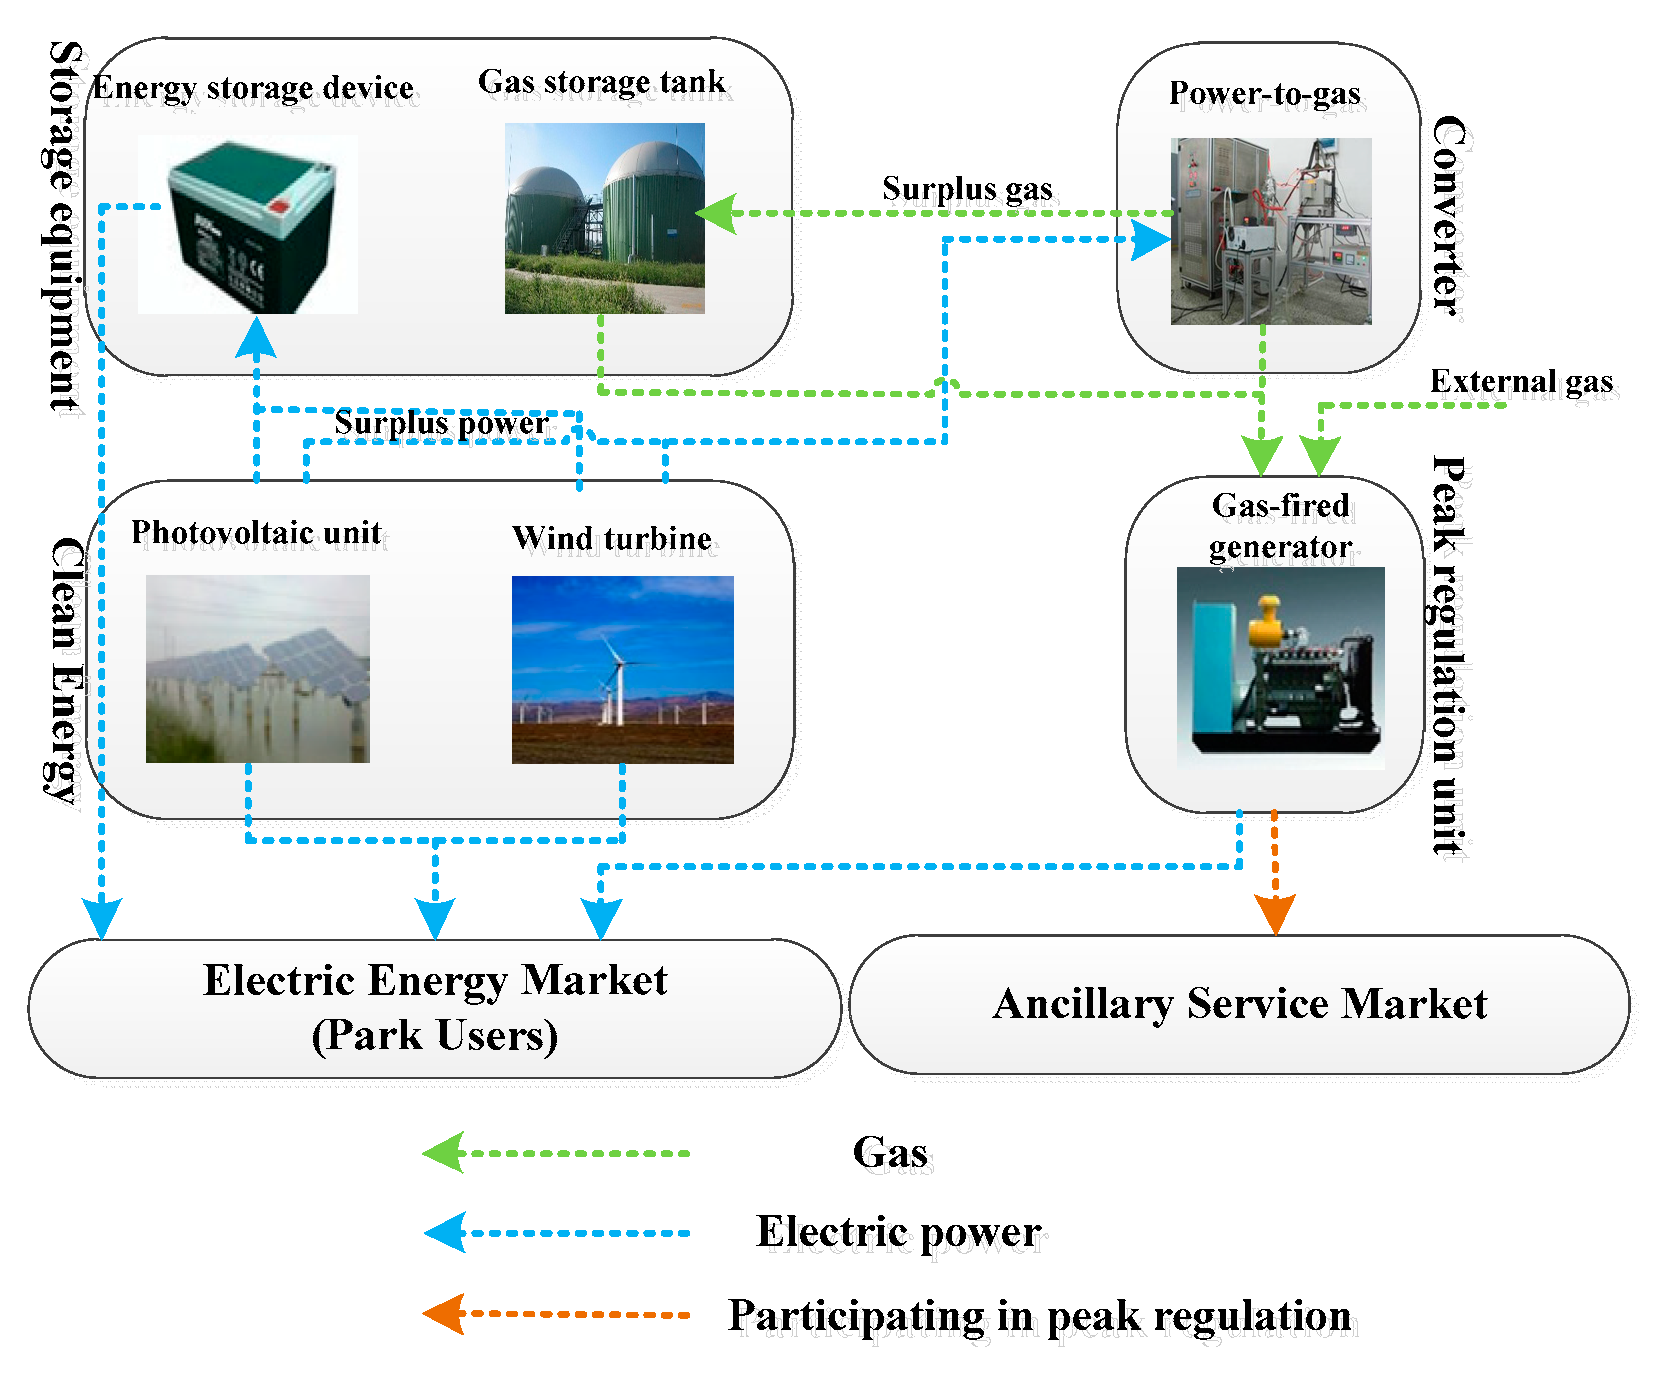
2.1. Structure of the Park Power Supply System with the P2G

The power supply system includes a wind turbine (WT), photovoltaic unit (PVU), energy storage device (ESD), P2G, gas storage tank, and GFG (see Figure 1). Priority is given to wind/photovoltaic power supply in the park, and the surplus power is input into the P2G or stored in the ESD. P2G is set to convert the surplus power into CH4, and CH4 is only used for power generation. The surplus CH4 will be stored in the gas storage tank. Also, the WT, PVU, P2G, and gas storage tank (P2G and gas storage tank are defined as PGST in this paper) only participate in the internal transactions, and the GFG participates in the ancillary service market. When the wind/photovoltaic power generation cannot meet the power load of users in the park, the GFG provides the peak regulation service.

2.2. Output Models of Equipment

The available equipment in the constructed park power supply system includes clean energy units (WT and PVU), GFG, PGST, and ESD. Before building the dispatching optimization model, the output models of different kinds of equipment are given below.
The WT output is affected by the wind speed. When wind speed is within the acceptable range for the unit, the power output of the unit increases as the wind speed increases. However, if it exceeds the acceptable range, that is, the wind speed is too slow or too fast, the WT will not start in order to avoid damage to the body. The specific output model is detailed in [27]. The PVU output model generally coincides with the β distribution, which is detailed in [28].
The generation efficiency of GFG is greatly affected by its output, which decreases as the output decreases. The third-order efficiency model is adopted in this paper, which can better analyze the impact of output fluctuations on the system. The specific model [29] is
g i , g ( t ) = F G T ( t ) η G ( t )
where F G T ( t ) is the natural gas consumption of the GFG at time t (kW·h); g i , g ( t ) is the output of the GFG at time t (kW·h); and η G ( t ) is the generation efficiency of the GFG at time t (%).
P2G is one of the key conditions for realizing bidirectional energy coupling in the power-gas system. The reaction processes are detailed in [30]. The comprehensive energy conversion efficiency of power-to-CH4 is about 45–60%. The power-to-CH4 model and the state of gas storage [25] are illustrated as
Q P 2 G ( t ) = E P 2 G ( t ) φ P 2 G / H C V
S g ( t ) = S g ( T 0 ) + t = 1 T ( Q P 2 G ( t ) Q o ( t ) )
where Q P 2 G ( t ) is the CH4 production of the P2G at time t (m3); E P 2 G ( t ) is the power consumption of P2G at time t (kW·h); φ P 2 G is the P2G conversion efficiency (%); H C V is the high calorific value of natural gas (39 MJ/m3) [31]; S g ( t ) is the gas volume in the gas storage tank at time t (m3); S g ( T 0 ) is the initial gas volume (m3); and Q o ( t ) is the gas volume from the gas storage tank to the GFG at time t (m3).

2.3. Peak Regulation Compensation Mechanism

Due to China’s complicated electricity market, which is still developing, the peak regulation service (belonging to the ancillary service market) is an effective way to promote the consumption of clean energy generation. According to the “Market Regulation Measures for Power Peak Regulation Service” in a certain area of China, the peak regulation service is divided into basic (unpaid) and paid peak regulation based on a load rate of 52% (i.e., a peak regulation rate of 48%). The basic peak regulation service is provided when the peak regulation rate of a unit is less than 48%; the paid peak regulation service is provided when the peak regulation rate is more than 48% or a unit is started up or shut down for peak regulation.
The compensation mechanism involves units submitting the day-ahead quotations for peak regulation, and then the peak regulation service is provided according to the order from low to high. The current clearing price is taken as a settlement price, that is, the maximum quotation for the peak regulation compensation occurring in the unit in the statistical period of the same day. The peak regulation service follows the principle of “basic peak regulation taking precedence over paid peak regulation, and low-priced peak regulation taking precedence over high-priced peak regulation, on the premise of the safe operation of the power grid”. The peak regulation compensation model is described as
P a ( t ) = { P 1 ,   45 % < R load 52 % P 2 ,   40 % < R load 45 % P 3 ,   R load 40 %
R load = g ( t ) C ( t )
where P a ( t ) is the compensation price at time t ($/kW·h); P 1 , P 2 , and P 3 are the current clearing prices under different peak regulation rates ($/kW·h); R load is the load rate of unit w at time t (%); C ( t ) is the capacity of unit w (kW); and g ( t ) is the available output of unit w at time t (kW·h).

2.4. Objective Functions

As illustrated above, to reduce clean energy wastage by GFG actively participating in peak regulation and gain more profit at the same time, the dispatching optimization model (including the objective functions and constraints) based on the system net profit, the wind/photovoltaic curtailment rate, and the GFG cost is constructed.
The economic benefit is the most important focus of the park power supply system; therefore, the net profits are considered. Firstly, the net profit model of WT and PVU is given by
Z w p v = j = 1 J m = 1 M t = 1 24 [ g j , w ( t ) × ( p   p a r k ( t ) c w ) + g m , p v ( t ) × ( p   p a r k ( t ) c   p v ) ]
where Z w p v is the net profit of the WT and PVU ($); g j , w ( t ) and g m , p v ( t ) are the outputs of the WT and the PVU at time t, respectively (kW·h); p   p a r k ( t ) is the internal power price in the park ($/kW·h); and c w and c   p v are the unit costs of the WT and the PVU ($). The unit cost covers unit power generation, operation, and maintenance costs.
The GFG costs mainly cover power generation, operation, and maintenance costs, and the income is from selling electricity and obtaining peak regulation compensation, so the net profit model is given by
Z g = i = 1 I t = 1 24 [ g i , g ( t ) × ( p   p a r k ( t ) c g ) + G i , g × P a ( t ) ]
c g = F G T ( t ) × ρ g + c g * × g i , g ( t )
where Z g is the net profit of the GFG ($); P a ( t ) is the peak regulation compensation price of the GFG at time t ($/kW·h); G i , g is the compensable electricity at time t (kW·h); c g is the power generation cost of the GFG ($); ρ is the natural gas price ($/m3); and c g * is the unit operation and maintenance cost ($).
Therefore, the net profit of the park is given by
f 1 = max R = max ( Z w p v + Z g c P G S T c E S D ) .
Therein,
c P G S T = g P G S T ( t ) × c P G S T *
c E S D = g E S D ( t ) × c E S D *
where R is the system’s net profit ($); c P G S T and c E S D stand for the costs of the PGST and the ESD respectively, both of which only refer to the operation and maintenance costs ($); c P G S T * and c E S D * are the unit operation and maintenance costs of the PGST and the ESD ($); and g E S D ( t ) and g P G S T ( t ) are the storage capacity (kW).
Following the concern on net profits in the park, the clean energy consumption is also what this paper mainly focuses on; therefore, the objective of clean energy curtailment rate is given by
f 2 = min I = min ( U c U t × 100 % )
where I is the clean energy curtailment rate (%); U c is the actual clean energy curtailment (kW·h); and U t is the total clean energy power generation (kW·h).
To ensure more electricity from clean energy units can be consumed, the GFG acts as a bridge between clean energy units and P2G; therefore, its cost is one of this paper’s focuses. The objective of the minimum GFG costs is analyzed to motivate more willing cooperation with clean energy units. The corresponding objective is given by
f 3 = min c g .

2.5. Constraints

The constraints used in this paper include the supply and load balance, the running constraints of different types of equipment, and the reserve capacity of the system.
The constraint of the system power balance is stated as
i = 1 I g i , g + j = 1 J g j , w + m = 1 M g m , p v = D
where g i , g , g j , w , and g m , p v are the available outputs of GFG, WT, and PVU respectively (kW·h); and D is the load demand (kW·h).
The running constraints of GFG, WT, and PVU are detailed in [32].
The constraint of the system’s reserve capacity is
g = 1 G [ g max ( t ) ( 1 θ ) ] ( 1 l ) D ( t ) + R ( t )
where D ( t ) is the load demand at time t (kW·h); R ( t ) is the system reserve demand at time t (kW); l is the line loss rate (%); θ is the unit self-use rate (%); and g max ( t ) is the maximum output at time t (kW·h).
Since the objective functions with the above constraints are mixed integer programming problems, the General Algebraic Modeling System (GAMS) software is a good solution tool. The mixed-integer programming models and the GAMS are detailed in [33].

3. Case Study

3.1. Scenario Settings

To verify the effectiveness of the proposed model, four scenarios based on different types of storage equipment and the different use priorities were set up (see Table 1).
The different types of storage equipment were as follows:
  • In Scenario 1 (S1), the park power supply system employed an energy storage device (ESD) to store the unconsumed wind/photovoltaic power generated to be sold in the next period;
  • In Scenario 2 (S2), the park power supply system employed a P2G and a gas storage tank (PGST) to convert the unconsumed wind/photovoltaic power generated into natural gas to be stored in the gas storage tank as the fuel for power generation.
The different storage equipment use priorities were as follows:
  • In Scenario 3 (S3), the park power supply system employed a PGST and an ESD. The unconsumed wind/photovoltaic power generated was preferentially converted into natural gas via the P2G and stored in the gas storage tank as the fuel for power generation, and then the surplus was stored in the ESD.
  • In Scenario 4 (S4), the park power supply system employed a PGST and an ESD. The unconsumed wind/photovoltaic power generated was preferentially stored in the ESD, and then the surplus was converted into natural gas via the P2G and stored in the gas storage tank as the fuel for power generation.

3.2. Basic Data

A park power supply system used in an area of China was selected for the case study. In this park, clean energy units, gas-fired generators (GFGs), an ESD, and a PGST were employed. The clean energy units contained a wind turbine (WT) and a photovoltaic unit (PVU), and the PGST included a P2G and a gas storage tank. Besides, there were four GFGs in the park (the specific parameters are shown in Table 2 and Table 3). The capacity of the ESD was 1000 kW, the maximum charging/discharging power was 200 kW, the charging/discharging loss was 0.4, and the initial energy storage was set to be 0; the unit cost of operation and maintenance was 0.071 $/kW·h.
The power load demand and the output of clean energy units in this park are illustrated in Figure 2. Given the uncertainty of wind and photovoltaic power generation, the output data of the clean energy units on a typical day were selected for this research. GFGs satisfied the load demand that WT and PVU could not cope with.
Based on the load demand in the park, a day was divided into three periods: 8:00–15:00 and 19:00–22:00 were the peak periods, 23:00–4:00 was the valley period, and 5:00–7:00 and 16:00–18:00 were the flat periods. For the given periods, the power price data are presented in Table 4, according to the actual prices of a province in China. In addition to power prices, the natural gas price was 0.488 $/m3 (for convenient calculation, it was converted into the unit calorific value price, 0.049 $/kW·h).
Besides selling electricity, GFGs participate in peak regulation to gain profit, which increases clean energy consumption. In the light of peak regulation compensation mechanism, GFGs propose their quotations the day before operation. The quotation standards under different peak regulation rates are shown in Table 5.
According to the load demand and peak regulation rate of each unit, the day-ahead peak regulation quotations of all GFGs during each period were generated randomly, and these are displayed in Table 6.

3.3. Results Analysis

3.3.1. Wind/Photovoltaic Curtailment

WT, PVU, GFG, and ESD were the units providing power. The power output of PGST was in the form of gas-fired power generation. Figure 3 shows the output of different types of equipment in each scenario, and Table 7 shows the clean energy curtailment rates of different scenarios. The results indicate that the available outputs of the WT and PVU were basically the same in different scenarios, but the wind/photovoltaic curtailment differed accordingly. The curtailment rate in the S1 was the highest, reaching 16.70%, whereas when the PGST was employed, the curtailment rate decreased (12.37% in S2), as did the GFG output. Moreover, in the scenario where both the PGST and ESD were employed, because of the different priorities of using the two devices, different results occurred for the wind/photovoltaic curtailment and the GFG output. The curtailment rate in S3 decreased to 11.59% compared with that in S2, but that in S4 decreased more—11.18%. Thus, the method of ‘energy storage preferentially, then gas storage’ has the best effect on reducing wind/photovoltaic curtailment.

3.3.2. GFG Costs

For different scenarios, the GFG costs during different periods are shown in Table 8.
Table 8 indicates that, with the participation of the PGST, the GFG costs decreased significantly, especially in flat and peak periods. Compared with S1, the GFG costs in S2 decreased by $220.160, because the GFG used gas from the P2G instead of purchasing it from the outside; thus, its generation cost decreased. The GFG costs in S3 and S4 were both lower than that of S2 by $41.430 and $72.680, respectively, which indicates that with the combination of the ESD and the GPST, the costs were further reduced. Additionally, compared with S3, the costs in S4 decreased by $31.249, so the different priorities of using the PGST and the ESD affect the GFG costs, and the method of ‘energy storage preferentially, then gas storage’ has a better effort.

3.3.3. System Economic Benefits

In view of the above four scenarios, taking the transactions in the electric energy market and ancillary service market into account, the results of system economic benefits in different scenarios are shown in Table 9.
As presented in Table 9, the scenario with PGST (namely, S2) earned $116.090 more and cost $66.034 less than S1 where the PGST was not considered. This demonstrates that the P2G can effectively reduce the total cost and increase the net profit. Under the joint operation of the PGST and the ESD, the method of ‘energy storage preferentially, then gas storage’ (namely, S4) minimized the total cost of the system and maximized its net profit.

4. Conclusions

To promote clean energy consumption to mitigate resource wastage and encourage gas-fired generators to collaborate with clean energy units, the construction of a dispatching optimization model with P2G and the peak regulation compensation mechanism for GFG was carried out in this paper. The model tends to pursue the maximum net profit of the park power supply system and the minimum clean energy curtailment rate and GFG costs. After conducting a case study, it was found out that systems with P2G can effectively promote clean energy consumption in comparison with ones involving no P2G. Additionally, with the joint operation of the PGST and the ESD, the method of ‘energy storage preferentially, then gas storage’ can maximize benefits.
Due to the high installation capacity of clean energy units but insufficient peak regulation sources and immature market mechanism development in China, marketized compensation is still an important means to encourage conventional generators to participate in peak regulation for clean energy consumption, and P2G not only increases the consumption but also reduces GFG costs, being a novel means in the power industry. As P2G technology develops (lower investment and higher conversion efficiency), it will be more practical and popular in the future.
In future research, the effect of P2G on CO2 emission reduction (environmentally) will be taken into account and how much it can gain for the park power supply system in terms of green certificate trading and carbon trading (economically) will be investigated. Also, more marketized peak regulation compensation means and more types of peak regulation units based on local resource advantages will be discussed, respectively.

Author Contributions

Supervision, Z.T.; Writing—Original draft preparation, Y.Q. and H.L.; Writing—Review and editing, Q.Y. and L.J.; Formal analysis, L.L. and S.Y.; Software, G.D.

Funding

This work was partially supported by the Project funded by China Postdoctoral Science Foundation (2019M650024), the National Nature Science Foundation of China (Grant Nos. 71904049,71874053, 71573084), the Beijing Social Science Fund(18GLC058) and the 2018 Key Projects of Philosophy and Social Science Research, Ministry of Education, China (18JZD032).

Conflicts of Interest

The authors declare no conflict of interest.

References

  1. Pu, L.; Wang, X.; Tan, Z.; Wu, J.; Long, C.; Kong, W. Feasible electricity price calculation and environmental benefits analysis of the regional nighttime wind power utilization in electric heating in Beijing. J. Clean. Prod. 2019, 212, 1434–1445. [Google Scholar] [CrossRef]
  2. Renewable Energy Grid Operation in the First Half of 2019. Available online: http://www.nea.gov.cn/2019-07/25/c_138257185.htm (accessed on 25 July 2019).
  3. Stephen, C.; Pierluigi, M. Integrated modeling and assessment of the operational impact of power-to-Gas (P2G) on electrical and gas transmission networks. IEEE Trans. Sustain. Energy 2015, 6, 1234–1244. [Google Scholar]
  4. Ju, L.; Zhao, R.; Tan, Q.; Lu, Y.; Tan, Q.; Wang, W. A multi-objective robust scheduling model and solution algorithm for a novel virtual power plant connected with power-to-gas and gas storage tank considering uncertainty and demand response. Appl. Energy 2019, 250, 1336–1355. [Google Scholar] [CrossRef]
  5. Gholizadeh, N.; Vahid-Pakdel, M.J.; Mohammadi-ivatloo, B. Enhancement of demand supply’s security using power to gas technology in networked energy hubs. Int. J. Electr. Power Energy Syst. 2019, 109, 83–94. [Google Scholar] [CrossRef]
  6. Yu, J.; Ma, M.; Guo, L.; Zhang, S. Reliability evaluation of integrated electrical and natural-gas system with power-to-gas. Proc. CSEE 2018, 38, 708–715. [Google Scholar]
  7. Yang, D.; Xi, Y.; Cai, G. Day-Ahead Dispatch Model of Electro-Thermal Integrated Energy System with Power to Gas Function. Appl. Sci. 2017, 7, 1326. [Google Scholar] [CrossRef]
  8. Marco, B.; Gabriele, F. Optimising energy flows and synergies between energy networks. Energy 2019, 173, 400–412. [Google Scholar]
  9. Hassan, A.; Patel, M.K.; Parra, D. An assessment of the impacts of renewable and conventional electricity supply on the cost and value of power-to-gas. Int. J. Hydrogen Energy 2019, 44, 9577–9593. [Google Scholar] [CrossRef]
  10. Fischer, D.; Kaufmann, F.; Oliver, S.L.; Christoper, V. Power-to-gas in a smart city context—Influence of network restrictions and possible solutions using on-site storage and model predictive controls. Int. J. Hydrogen Energy 2018, 43, 9483–9494. [Google Scholar] [CrossRef]
  11. Miguel, C.V.; Mendes, A.; Madeira, L.M. An Overview of the Portuguese Energy Sector and Perspectives for Power-to-Gas Implementation. Energies 2018, 11, 3259. [Google Scholar] [CrossRef]
  12. Garcia, D.A.; Barbanera, F.; Cumo, F.; di Matteo, U.; Nastasi, B. Expert Opinion Analysis on Renewable Hydrogen Storage Systems Potential in Europe. Energies 2016, 9, 963. [Google Scholar] [CrossRef]
  13. Liu, W.; Wen, F.; Xue, Y.; Zhao, J.; Dong, Z.; Zheng, Y. Cost characteristics and economic analysis of power-to-gas technology. Autom. Electr. Power Syst. 2016, 40, 1–11. [Google Scholar]
  14. Masoud, G.; Rajabi, M.H.; Amin, H. Importance of gas-fired power plants location in integrated operation of power and natural gas systems: Peak load condition analysis. In Proceedings of the 26th Iranian Conference on Electrical Engineering, Mashhad, Iran, 8–10 May 2018; pp. 1227–1232. [Google Scholar]
  15. Zhao, C.; Zhang, H.; Li, F.; Yuan, J. Economic research on gas CHP and peaking generation in Beijing. Int. Pet. Econ. 2017, 25, 99–105. [Google Scholar]
  16. Zhong, K.; Wang, D.; Yang, G.; Fu, J. Peak shaving analysis of electric vehicle and gas turbine under B2G mode. Electrotech. Appl. 2018, 37, 47–52. [Google Scholar]
  17. Shen, W.; Zhen, W.; Zhou, D.; Gao, Y. Wind power peak Regulation pricing model under wind and fire alternative trading mechanism—A case study of wind Power Integration, Gansu Province. In Proceedings of the 2018 China International Conference on Electricity Distribution, Tianjin, China, 17–19 September 2018. [Google Scholar]
  18. Li, Y.; Li, H. Improvement of compensation mechanism on peak-regulating auxiliary service for thermal power unit with energy saving dispatch. Heilongjiang Electr. Power 2014, 26, 194–197. [Google Scholar]
  19. Yang, Z.; Li, K.; Wang, N.; Jin, Z.; Song, S.; Guo, X. A Model of Considering the Economic Analysis and Environmental Protection for Thermal Power Compensation on Peak Regulation. J. Eng. Thermophys. 2018, 39, 2124–2130. [Google Scholar]
  20. Na, C.; Yuan, J.; Zhu, Y.; Xue, L. Economic Decision-Making for Coal Power Flexibility Retrofitting and Compensation in China. Sustainability 2018, 10, 348. [Google Scholar] [CrossRef]
  21. Wang, Y.; Tian, Y.; Wu, M.; Geng, J. Two-part electricity price model for peak load regulation of natural gas power based on fuzzy clustering. Proc. CSEE 2017, 6, 38–46. [Google Scholar]
  22. Kong, D.; Long, H.; Li, G.; Liu, Y. Research on equivalent smoothing strategy of PV output based on micro energy system. Acta Energy Sol. Sin. 2017, 9, 33–41. [Google Scholar]
  23. Gil, M.; Duenas, P.; Reneses, J. Electricity and natural gas interdependency: Comparison of two methodologies for coupling large market models within the European regulatory framework. IEEE Trans. Power Syst. 2016, 31, 361–369. [Google Scholar] [CrossRef]
  24. Xu, Z.; Zhang, Y.; Chen, Z.; Lin, X.; Chen, B. Bi-level optimal capacity configuration for power to gas facilities considering operation strategy and investment subject benefit. Autom. Electr. Power Syst. 2018, 42, 76–84. [Google Scholar]
  25. Tan, Z.; Tan, Q.; Yang, S.; Ju, L.; De, G. A Robust Scheduling Optimization Model for an Integrated Energy System with P2G Based on Improved CVaR. Energies 2018, 11, 3437. [Google Scholar] [CrossRef]
  26. Weiler, V.; Stave, J.; Eicker, U. Renewable Energy Generation Scenarios Using 3D Urban Modeling Tools Methodology for Heat Pump and Co-Generation Systems with Case Study Application . Energies 2019, 12, 403. [Google Scholar] [CrossRef]
  27. Cheng, J.; Choobineh, F. A Novel Wind Energy Conversion System with Storage for Spillage Recovery. J. Power Energy Eng. 2015, 3, 33–38. [Google Scholar] [CrossRef]
  28. Wang, Y.; Lu, Y.; Ju, L.; Wang, T.; Tan, Q.; Wang, J.; Tan, Z. A Multi-objective Scheduling Optimization Model for Hybrid Energy System Connected with Wind-Photovoltaic-Conventional Gas Turbines, CHP Considering Heating Storage Mechanism. Energies 2019, 12, 425. [Google Scholar] [CrossRef]
  29. Ju, L.; Zhang, Q.; Tan, Z.; Wang, W.; Xin, H.; Zhang, Z. Multi-agent-system-based coupling control optimization model for micro-grid group intelligent scheduling considering autonomy-cooperative operation strategy. Energy 2018, 157, 1035–1052. [Google Scholar] [CrossRef]
  30. Andrea, M.; Ettore, B.; Gianfranco, C. Applications of power to gas technologies in emerging electrical systems. Renew. Sustain. Energy Rev. 2018, 92, 794–806. [Google Scholar]
  31. Wei, Z.; Zhang, S.; Sun, G.; Zang, H.; Chen, S.; Chen, S. Power-to-gas Considered Peak Load Shifting Research for Integrated Electricity and Natural-gas Energy Systems. Proc. CSEE 2017, 37, 4601–4609. [Google Scholar]
  32. Yang, S.; Tan, Z.; Ju, L.; Lin, H.; De, G.; Tan, Q.; Zhou, F. An Income Distributing Optimization Model for Cooperative Operation among Different Types of Power Sellers Considering Different Scenarios. Energies 2018, 11, 2895. [Google Scholar] [CrossRef]
  33. Wang, J. Optimization of Power System Operation Based on GAMS. Master’s Thesis, South China University of Technology, Guangzhou, China, 2014. [Google Scholar]
Figure 1. Park power supply system structure.
Processes 07 00813 g001
Figure 2. Power load demand of the park and output of clean energy units.
Processes 07 00813 g002
Figure 3. Unit output and wind/photovoltaic curtailment in different scenarios. (a) Unit output and wind/photovoltaic curtailment in S1. (b) Unit output and wind/photovoltaic curtailment in S2. (c) Unit output and wind/photovoltaic curtailment in S3. (d) Unit output and wind/photovoltaic curtailment in S4.
Processes 07 00813 g003aProcesses 07 00813 g003bProcesses 07 00813 g003c
Table 1. Four scenarios based on different types of storage equipment and their use priorities.
ScenarioEnergy Storage Device (ESD)P2G and Gas Storage Tank (PGST)Use Priority
S1//
S2//
S3PGST > ESD
S4ESD > PGST
Table 2. Equipment parameters of the wind turbine (WT), the photovoltaic unit (PVU), and the P2G and gas storage tank (PGST).
EquipmentCapacityUnit Cost ($/kW·h)Current Limitation (km3/h)Conversion EfficiencyUnit Operation and Maintenance Cost ($/kW·h)
Wind turbine (WT)10 (MW)0.049///
Photovoltaic unit (PVU)500 (kW)0.085///
P2G400 (kW)//60%0.078
Gas store tank50 (km3)/20~50/
Table 3. Equipment parameters of the gas-fired generators (GFGs)
GFGabcd
Capacity(kW)1000500500500
Generation efficiency60%60%60%60%
Unit operation and maintenance cost ($/kW·h)0.0980.0980.0980.098
Table 4. Price data.
CategoryItemPrice ($/kW·h)
Park power pricePeak period0.170
Valley period0.113
Flat period0.141
External power pricePeak period0.204
Valley period0.157
Flat period0.172
Table 5. Quotation intervals for peak regulation.
Peak Regulation Rate (PRR)Lower Limit ($/kW)Upper Limit ($/kW·h)
48% < PRR ≤ 55%0.0420.071
55% < PRR ≤ 60%0.0710.113
PRR > 60%0.1130.141
Table 6. gas-fired generators’ (GFGs’) day-ahead quotations for peak regulation (Unit: $/kW·h).
UnitGFG aGFG bGFG cGFG d
Times
10.0610.0560.0620.069
20.0660.0550.0630.069
30.0650.0540.0600.058
40.0600.0620.0590.066
50.0820.0940.0850.097
60.1080.1070.0780.113
70.0910.0780.1090.110
80.1390.1260.1350.132
90.1130.1310.1180.121
100.1250.1130.1140.139
110.1380.1400.1370.124
120.1310.1230.1400.117
130.1210.1320.1230.129
140.1230.1240.1150.122
150.1300.1170.1350.132
160.0890.1030.1070.092
170.1060.1050.0850.098
180.0960.0820.0970.084
190.1240.1300.1290.139
200.1260.1190.1300.132
210.1230.1360.1370.130
220.1350.1170.1380.122
230.0620.0550.0660.058
240.0540.0630.0660.065
Table 7. Clean energy curtailment rates in different scenarios.
Scenario1234
Clean energy curtailment rate16.70%12.37%11.59%11.18%
Table 8. GFG costs during different periods (Unit: $).
ScenarioS1S2S3S4
PeriodValley period26.44225.59325.59325.593
Flat period66.4584.6664.6660
Peak period1651.6931494.1741452.7441426.302
Total1744.5931524.4331483.0031451.754
Table 9. System total costs and net profit in different scenarios (Unit: $).
ScenarioS1S2S3S4
Total costs3728.5773662.5433641.0503608.387
Net profit2203.4362319.5262336.0692355.441

