Abstract
Droplet impact and spreading on spherical surfaces, often accompanied by heat transfer, are crucial in both industrial and natural settings. This study investigates droplet impact dynamics on a heated spherical surface under gravity at low Weber numbers. A new experimental setup was developed to capture the droplet spreading process, which was combined with a volume-of-fluid-based direct numerical simulation incorporating multiphase heat transfer. This hybrid experimental–numerical approach validated the simulation accuracy and enabled a quantitative analysis of key parameters—including spherical surface temperature, diameter ratio, and Weber number—on droplet spreading behavior. Parametric analyses reveal that an increase in spherical surface temperature slightly enhances the maximum spread coefficient. The maximum spread coefficient grows significantly with the Weber number but remains largely unaffected by the particle-to-droplet size ratio. Furthermore, the total heat flux strongly correlates with the droplet spreading area, reaching a peak at the maximum spread length.
1. Introduction
Droplet impact and spreading on heated spherical surfaces are always encountered in industries and nature, such as spray cooling [1], particle coating [2,3], catalytic cracking [4], and packaging technology [5]. Therefore, a better understanding of these systems (i.e., involving droplet impact on hot particle surfaces) enhances control over key engineering applications, such as fluidization, mixing, cooling, and coating. In addition, the thermal diffusion of droplets on hot surfaces is highly complex, involving two distinct stages: initial diffusion and equilibrium evaporation. Upon contact, the hot surface rapidly heats the droplet. This heat conduction quickly elevates the droplet’s surface temperature. Once the surface temperature reaches the ambient saturation point, a balance is established: the heat absorbed by the droplet equals the heat lost through evaporation. As a result, the evaporation rate stabilizes, and the droplet temperature remains constant at the saturation temperature. This initiates the steady-state thermal diffusion phase, during which heat transfer continues to drive evaporation [1]. Although brief and involving minimal heat transfer, the initial diffusion phase critically influences liquid coverage and subsequent heating stages. Furthermore, droplet spreading on heated spheres exhibits unique flow behavior resulting from the coupling of curvature and thermal effects. The temperature gradient generated by heating drives internal circulation within the droplet via thermal capillary effects [6]. Coupling with the curvature-induced surface tension gradient results in heat transfer characteristics distinct from those on flat surfaces. Therefore, a comprehensive study of heat transfer on a spherical surface is of great importance. Next, we briefly review the investigations of droplet impact on 2D surfaces. This motivates the present study as we attempt to close the gap in understanding related to droplet spreading dynamics on 3D spherical substrates.
Many researchers have studied droplet impact and spread on different surfaces. For example, Rioboo et al. investigated droplets on varying surface curvatures and morphologies [7,8]. Roux and Cooper-White divided droplet spreading on a dry and flat surface into four stages: kinetic, spread, relaxation, and wetting [9]. Subsequently, Sikalo et al. uncovered the surface-dependent mechanisms of droplet rebound on inclined surfaces and established the critical relationship between the Weber number and normal velocity component for governing contact and rebound [10]. In addition, other researchers examined droplet impact hydrodynamics on cylindrical surfaces with varying curvature and surface roughness [11,12,13], but all these studies focus on flat surfaces or cylindrical surfaces. Similar 2D surfaces have been used to demonstrate that rotational speeds combined with surface tension affect angular wetting length and area during droplet impact on rotating surfaces [14]. While Li et al. conducted visual experiments to investigate the dynamic behavior of droplets with varying properties impacting hydrophobic surfaces, their analysis was restricted to planar (2D) substrates [15]. Consequently, there remains a paucity of research that integrates experimental and simulation methods to investigate droplet spreading dynamics on 3D spherical substrates. The coupling of surface curvature and thermal gradients (e.g., temperature-driven Marangoni flow and curvature-induced surface tension variations) generates unique hydrodynamic and thermal behaviors that are not observed in 2D systems. Specifically, the double curvature of the sphere introduces hoop stresses and modifies the Laplace pressure, creating a flow regime distinct from planar impacts. While early research focused on planar surfaces, recent studies have shifted towards understanding the complex coupling of hydrodynamics and geometry on curved substrates. For instance, Fan et al. utilized direct numerical simulation to decompose the energy budget of viscous droplets impacting spherical particles, revealing that the competition between inertial convection and curvature-induced viscous dissipation differs fundamentally from planar impacts [16]. Furthermore, Cai et al. demonstrated that on spherical surfaces, the spreading dynamics are governed by a ‘liquid cap’ formation mechanism that is highly sensitive to the non-Newtonian rheology and diameter ratio, a phenomenon absent in 2D systems [17]. Consequently, understanding the specific thermal–hydraulic coupling on spherical particles—distinct from flat plates—remains a critical frontier for industrial applications.
So far, little attention has been paid to droplet spreading and heat transfer on heated 3D spherical particles. Guggilla et al. assessed the evaporation kinetics of droplet impacts on heated wet surfaces [18]. They found that under identical impact conditions, multiple-droplet impacts yield a higher spread coefficient compared to single-droplet impacts, whereas single-droplet impacts exhibit greater variability in spread coefficient and a higher heat transfer rate. Key influencing factors were identified: the Weber number enhances heat transfer; the Jacob number promotes evaporation but reduces the spread coefficient and cycle time; the Bond number increases spreading, thereby improving heat transfer and evaporation; and a fixed droplet diameter impedes spreading, leading to decreased heat transfer rates. Liu et al. investigated the spreading and freezing of supercooled water droplets impacting ice surfaces [19]. They found that supercooling significantly influences the droplets’ maximum spread coefficient. Additionally, they proposed a dimensionless freezing number to quantify freezing’s impact on viscous flow fields. Gurrala et al. [20] investigated evaporation phenomena via infrared imaging and shadowgraph techniques, focusing on pure ethanol and ethanol–water binary droplets deposited on cylindrical substrates. Their findings revealed that pure ethanol droplets exhibited enhanced spreading behavior accompanied by a smaller contact angle on curved surfaces, whereas binary droplets demonstrated reduced spreading characteristics under identical conditions. Xu and Shen quantitatively analyzed drag force and Nusselt number in droplet–particle collisions using a volume fraction model [21]. Other researchers experimentally investigated heat transfer mechanisms during continuous droplet impact on heated cylindrical surfaces, examining the effects of impact frequency, velocity, and input heat flux [15,22,23,24]. It is evident from the above studies that droplet spread and heat transfer on substrates are influenced by multiple parameters. Most investigations involve high Weber numbers and high impact kinetic energy, leading to phenomena such as droplet splashing, rebound, and finger-like fronts [25,26]. Recent research has significantly advanced the understanding of droplet dynamics on non-planar substrates. Zhuo et al. utilized the Thermal Lattice Boltzmann Method to elucidate the heat transfer mechanisms during impact on hot curved walls, highlighting how substrate curvature modifies vapor film morphology [27]. In the low-Weber-number regime, Mahato et al. demonstrated that the interplay between wettability and inertia dictates the transition from cylindrical to flattened morphologies, a finding critical for precision coating applications [28]. While these studies address high-temperature boiling or isothermal hydrodynamics, the specific coupling of heating with low-inertia (low Weber numbers) spreading on spherical particles remains underexplored.
Droplet spreading on spherical surfaces exhibits unique hydrodynamic and thermal behaviors distinct from planar or cylindrical counterparts due to the double curvature of the substrate. Unlike planar spreading, the liquid film on a sphere is subject to a modified Laplace pressure gradient, , which induces a hoop stress that significantly influences the recoiling dynamics. Furthermore, as the droplet spreads from the apex towards the equator, the radial outflow is increasingly opposed by the tangential component of gravity , a retarding force absent in horizontal planar impact. These geometric factors also couple with heat transfer; the wrapping of the liquid film alters the contact area-to-volume ratio, thereby modifying transient thermal boundary layer development.
This work presents a systematic investigation into droplets’ impact on 3D spherical substrates under thermal–curvature coupling at low Weber numbers. A new experimental apparatus has been developed to capture the spreading dynamics of droplet impact on a spherical surface. The research combines systematic experiments with a VoF-based direct numerical simulation (incorporating static contact angles and multiphase heat transfer). This dual approach validates simulation accuracy against experimental data and enables quantitative analysis of key parameters (e.g., spherical surface temperature, diameter ratio, and Weber number) on droplet spreading dynamics, bridging experimental observation and predictive simulation. We then use the validated simulation method to systematically examine the roles of spherical surface temperature, droplet-to-particle diameter ratio, and Weber number on spreading dynamics and heat flux. This study explicitly addresses the research gap of ‘low-Weber-number impact on heated spherical surfaces’, characterizing these unique curvature–thermal coupling effects. This comprehensive parametric analysis provides a framework for predicting droplet behavior on heated spheres, with implications for industrial applications like particle coating, spray cooling, and catalytic processes involving spherical substrates.
This paper is structured as follows: In Section 2, we describe the methodology, including the physical problem setup, simulation approach, and experimental setups. In Section 3, we introduce the validation of the numerical model against our experimental data and literature data. We present a detailed discussion of the results from our parametric study, examining the effects of spherical surface temperature, diameter ratio, and Weber number on droplet spread and heat transfer. Finally, we discuss our results in Section 4, where we summarize our main findings and present the conclusions.
2. Methodology
2.1. Problem Setup
As shown in Figure 1a, a droplet is released at the top position of a sphere with a height h onto the sphere surface; represents the velocity of the droplet upon contact with the spherical surface, is the diameter of the sphere, and is the diameter of the initial droplet. Figure 1b shows the droplet contacting the sphere’s surface and starting to spread. is the spreading arc length, is the angle corresponding to the liquid spreading arc length, and is the acceleration due to gravity. The following parameters are defined to scale up the droplet on a sphere.
q(t) is the transient total heat transfer rate calculated by integrating the conductive heat flux over the instantaneous wetted surface area.

Figure 1.
Schematic of droplet deformation upon contacting spherical particle surfaces: (a) prior to surface contact; (b) after surface contact.
Figure 1.
Schematic of droplet deformation upon contacting spherical particle surfaces: (a) prior to surface contact; (b) after surface contact.

To scale up the problem, we choose the reference scale as follows: reference length, reference velocity, and reference time.
Dimensionless parameters are defined in Equation (4), where, D* is the diameter ratio between sphere and droplets, Nu is the Nusselt number, the spreading coefficient β is defined as the spreading arc length normalized to the initial diameter of the droplet, t* is dimensionless time, We is the Weber number, Re is the Reynolds number, Pe is the Peclet number, and Fr the Froude number.
where is the surface tension of the liquid, is the density of the liquid, and represents the thermal diffusivity of the liquid. is the dynamic viscosity of the liquid, is the spatially averaged heat transfer coefficient derived from the total heat flux, and and are the constant spherical surface temperature and initial droplet temperature, respectively. is the thermal conductivity of the liquid, is the curved surface area of the sphere covered by the liquid phase (defined by the volume fraction at the boundary), and is the temperature gradient normal to the wall.
2.2. Simulation Method
2.2.1. Volume-of-Fluid (VoF) Approach
This work utilized the volume-of-fluid (VoF) approach [29] to simulate the two-phase flow of droplets on a spherical surface [30,31]. The VoF approach delineates immiscible fluids by specifying the volume fraction of each fluid phase within discrete cells. The tracking of the gas–liquid interface is achieved by solving the continuity equation for volume fraction, expressed as follows:
where and represent the volume fraction and local flow velocity of the liquid, res(pectively. The local properties of a fluid are determined by the presence of each phase component within each control volume. Therefore, the distribution of physical properties within a grid cell can be averaged based on the fluid volume fraction within that cell:
where and are the dynamic viscosities of the liquid and gas, respectively; and are the densities of the liquid and gas, respectively. and represent the volume fractions of the liquid and gas, respectively. The governing equations are as follows:
where is velocity, is pressure, is the acceleration due to gravity, and is the volumetric surface tension force. In this study, is modeled using the Continuum Surface Force (CSF) model proposed by Brackbill et al. [32]. The force is defined as , where is the surface tension coefficient, is the volume fraction, and is the interface curvature computed from the divergence of the unit surface normal (). This formulation transforms the surface tension into a continuous volumetric source term acting within the interfacial transition region. Additionally, energy conservation is governed by the following equation:
where T is the local temperature and cp is the specific heat capacity at constant pressure.
2.2.2. Simulation Setup
Setting up the simulation of droplets on a sphere can be considered axisymmetric. Figure 2a shows the computational domain for the simulation, with the height set to 5D0. The spherical surface is modeled as a no-slip wall with a fixed constant-temperature (isothermal) boundary condition, with the left side being an axisymmetric boundary and the others boundary conditions being pressure outlets. As shown in Figure 2b, a structured mesh was employed in this study, with local mesh refinement applied in the liquid flow region. Prior to analyzing the results, mesh independence verification was conducted to ensure the reliability of the outcomes. We used four different structured grid cells (i.e., 36,208, 76,531, 131,274, and 273,822) to test grid independence. As shown in Figure 3, grid independence was tested by comparing the spreading coefficient as a function of time through four grid resolutions. The maximum deviation between the grids of 131,274 cells and 273,822 cells is approximately 0.25%, which indicates convergence at this grid resolution. Consequently, we chose a grid cell of 131,274 for subsequent calculations.
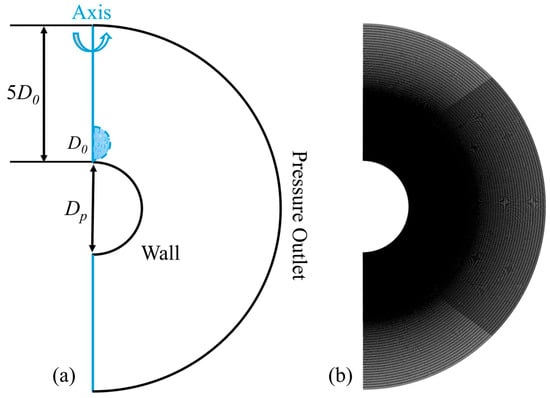
Figure 2.
Panel (a): schematic diagram of simulation model and computational domain; panel (b): structured mesh.
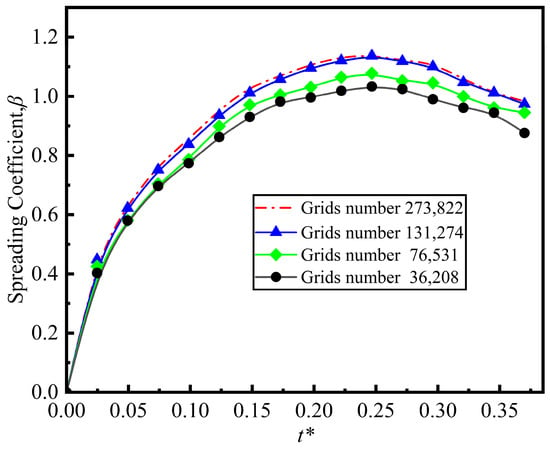
Figure 3.
Grid independent test by comparing spreading coefficient as function of time through four grid resolutions (cell number: 36,208, 76,531, 131,274, 273,822).
The Peclet number for this study was calculated based on the initial impact conditions and fluid properties at the initial droplet temperature ():
where is the thermal diffusivity. The Peclet number remains very high (Pe 1) throughout the brief contact process. As a result, convection dominates over conduction as the primary heat transfer mechanism within the droplet under all experimental conditions.
The governing equations of mass, momentum, and energy conservation were solved numerically using the commercial computational fluid dynamics (CFD) software (Fluent 2022 R2, ANSYS, Inc., Canonsburg, PA, USA). To accurately capture gas–liquid interface dynamics, we used a transient volume-of-fluid (VoF) model, employing the Geo-Reconstruct scheme for interface tracking due to its demonstrated robustness in handling geometrically complex, transient two-phase interfaces. Given the low Weber number characterizing the liquid phase, the flow was appropriately modeled as laminar and incompressible. The simulation utilized a pressure-based solver with the PISO (Pressure-Implicit with Splitting of Operators) algorithm for pressure–velocity coupling, which improves computational convergence efficiency through its implicit pressure–operator separation approach.
For spatial discretization, (1) a second-order upwind scheme was applied to the momentum and energy equations. (2) A body force weighted scheme was used for pressure term discretization. This combination ensures numerical accuracy, particularly in regions with significant body force effects.
Furthermore, the convergence criteria were set to residuals of 10−4 for the continuity, momentum, and volume fraction equations, and 10−6 for the energy equation to ensure numerical stability and precision. Temporal discretization was achieved using a second-order implicit time-stepping method, with all simulations executed using a time step of 0.1 ms and 30 iterations per time step to balance temporal resolution and computational cost.
2.3. Experimental Methods
As shown in Figure 4, an experimental apparatus was developed to observe droplet spreading dynamics. The system comprises four primary components: a droplet generation system, an image acquisition system, a temperature measurement system, and a data processing system. A microfluidic injection pump (LSP02-1A, DiChuang; Origin: Baoding, China) drives liquid through stainless steel microtubes within the platform, producing droplets. These droplets impinge upon a spherical surface to facilitate the examination of their dynamic behavior. Image capture is performed using a high-speed camera equipped with a Tokina Macro lens, operating at 2000 frames per second with a resolution of 1280 × 800 pixels. Surface temperature and its spatial uniformity are monitored using a contact thermocouple mounted on the bottom of the sphere. To minimize errors induced by parallax, the optical axis of the camera and the center of the sphere are aligned within the same horizontal plane.
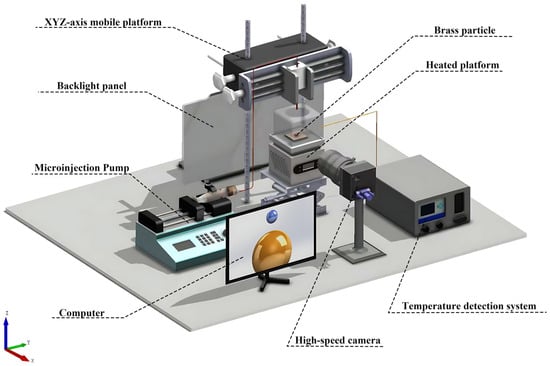
Figure 4.
Sketch of experiment setup.
The sphere is uniformly heated by the heating system. The sphere’s diameter is rather small (12 mm), which results in a surface area of 452 mm2, yielding a Biot Number < 0.1—confirming negligible temperature gradients due to dominant surface heat transfer over ambient dissipation effects. An adjustable support base enables micron-level X-Y coordinate alignment to minimize droplet–sphere deviation (see Figure 4) and maintain a maximum lateral impact offset of mm (approximately of ), while a 300 W metal halide lamp provides backlighting for imaging. Experiments were conducted at standard atmospheric pressure and 25 °C. The volume of droplets is 27.17 µL, and the droplet impacting initial velocity is 0.092 m/s. Weber number variations were achieved by changing the droplet releasing height.
3. Validation
To validate the simulation method, we chose parameters for both the experiment and simulation as follows: D0 = 3.73 mm, Dp = 12 mm, D* = 3.217, We = 0.44, Fr = 0.48, Pe = 2400, and T = 25 °C. The properties of air and liquids are presented in Table 1.

Table 1.
Fluid property parameters [33].
The impact conditions in this study are characterized by low Weber numbers (), placing the dynamics in the capillary–inertial regime. In this regime, the spreading velocity is moderate, resulting in a very low capillary number (). Theoretical scaling analysis indicates that as , the dynamic contact angle converges to the static equilibrium angle, rendering viscous dissipation at the contact line negligible. Consequently, the static contact angle (SCA) model is sufficient to capture the macroscopic spreading and retraction behaviors, as confirmed by the close agreement between the numerical and experimental results shown in Figure 5 [34,35]. Therefore, the static contact angle model is employed in our simulation. The static contact angle used in the simulations was measured experimentally as using the sessile drop method on the polished brass substrate at .
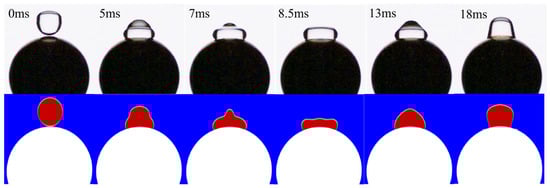
Figure 5.
Comparison of droplet impact dynamic behaviors between upper experimental droplet and lower simulation droplet, with conditions D* = 3.217, We = 0.44, Re = 342, Fr = 0.48, and T = 25 °C.
Figure 5 compares the dynamic evolution of droplet spreading observed experimentally (upper half) and numerically (lower half) under identical conditions. The simulation demonstrates strong agreement with the experimental results, accurately capturing the three distinct phases of the process. First is the initial stage (0 ms), during which all droplets are spherical. Next is the contact stage (5–9 ms), when the droplets gradually spread after coming into contact with the spherical surface, ultimately reaching a state of maximum spreading. The edge profiles observed experimentally and through simulation are similar. Finally, the retraction stage (13–18 ms) ensues, where the droplets gradually contract due to surface tension. After undergoing several oscillations, they eventually reach a quasi-steady state.
Figure 6 quantitatively compares the spread coefficients from the simulation, experiment, and literature [35]. As shown in Figure 6, the simulation demonstrates strong agreement with the experimental data and literature, accurately capturing the temporal evolution from inertial spreading to retraction. The maximum spread coefficient in the experiment reached 1.203, while the maximum simulated spread coefficient was 1.12. The maximum spread coefficient in the experiment was 5.4% larger than that in the simulation. Additionally, to further verify model robustness at higher inertia, data from the reference were utilized in the simulation. The droplet spread trends are consistent. The maximum spread coefficient in this model is 1.61, while the maximum spread coefficient in the reference literature is 1.65, with a deviation of 2.42%. This simulation effectively replicates the maximum spread coefficient, demonstrating the reliability of the research model. The simulated results align closely with the experimental observations, indicating that the selected numerical method accurately reproduces the dynamic behaviors of droplet deformation, spread, and retraction.
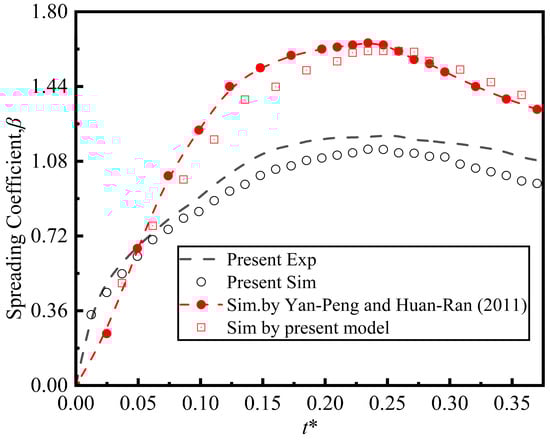
Figure 6.
Comparison of droplet spread coefficients as function of dimensionless time obtained from experiments, simulations, and literature (D0 = 4.8 mm, We = 15) [35].
4. Results and Discussion
4.1. Heat Transfer During Liquid Droplet Spread on a Spherical Surface
Figure 7 shows the temperature field of a liquid droplet on a hot spherical surface at t* = 0.1961. As seen from Figure 7, under conditions of constant temperature on a spherical surface, air heats up much faster than liquid droplets because air has a significantly lower heat capacity than water. It is also seen from Figure 7 that a localized high-temperature zone forms only at the edge of the solid–liquid interface, resulting from the brief contact time between the droplet and the hot spherical surface. The temperature decreases radially along a gradient, while the curved surface morphology enhances heat concentration at the contact edge.
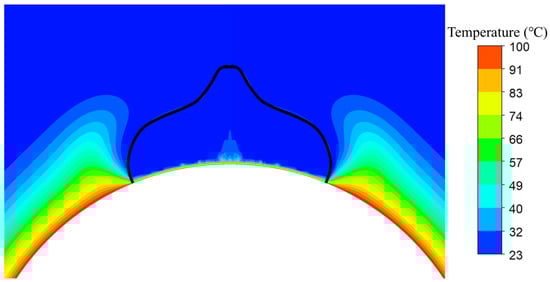
Figure 7.
Temperature field of liquid droplet on hot spherical surface (t* = 0.1961, D* = 3.217, We = 0.44, Re = 342, Fr = 0.48, T = 100 °C).
As a droplet spreads across a spherical surface, its contact area with the heated surface increases. This leads to a corresponding increase in the local Nusselt number along the spreading direction. Figure 8 shows the distribution of the local Nusselt number along the X-axis (the spreading direction, as indicated in Figure 1) on the spherical surface at different time intervals. As depicted in Figure 8, the local Nusselt number is notably high where the droplet initially contacts the sphere, while it remains relatively low elsewhere after the droplet has spread. This suggests that heat transfer between the droplet and the spherical surface is most significant during initial contact. Additionally, Figure 8 reveals that the local Nusselt number reaches a peak of 287 at t* = 0.0493, but declines by t* = 0.1829. This decrease occurs because the film flow velocity slows over time, weakening the intensity of convective heat exchange.
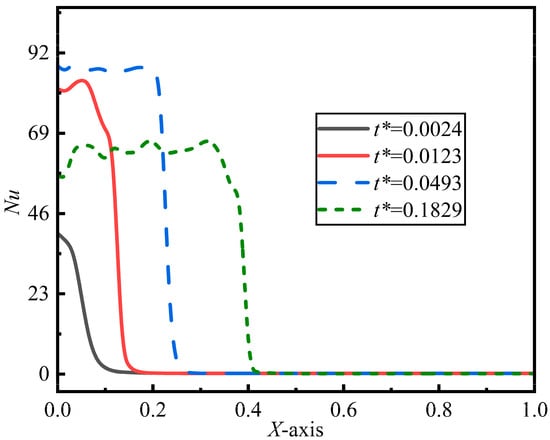
Figure 8.
Distribution of local Nusselt number along spread direction of droplets at different dimensionless points in time (D* = 3.217, We = 0.44, Re = 342, Fr = 0.48, T = 100 °C).
4.2. Spherical Surface Temperature’s Effect on Spreading Coefficient
Figure 9 illustrates the effect of spherical surface temperature on droplet spreading behavior. When the surface temperature increases from 25 °C to 100 °C, the maximum spreading coefficient of the droplet rises from 1.203 to 1.235, representing an increase of 2.66%. This increase is quite significant; as the temperature increases further, the maximum spread coefficient rises to 1.247, representing an increase of approximately 0.9%. The growth rate is not significant. The experimental results indicate that increasing the temperature of the spherical surface slightly enhances the maximum spread coefficient, likely due to reduced surface tension and viscosity at the interface. They notably slow down the initial spreading rate, delaying the time to reach peak spread. At 210 °C, liquid droplets on a heated surface exhibit the Leidenfrost phenomenon: intense vaporization forms a vapor film. Droplets bounce instead of retracting into a cap shape, detaching with a witzero spread coefficient due to vapor pressure exceeding holding forces.
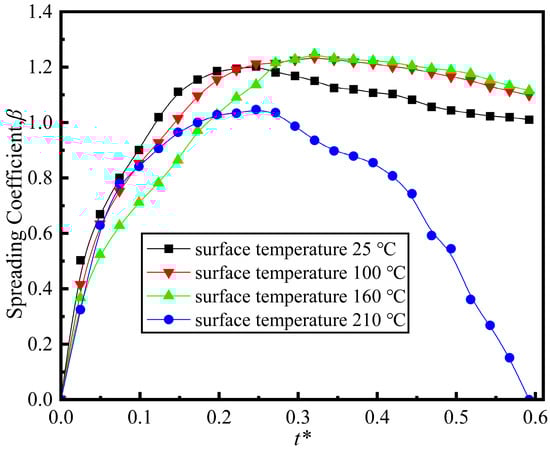
Figure 9.
Effect of different spherical temperatures on droplet spread coefficient β (D* = 3.217, We = 0.44, Re = 342, Fr = 0.48).
Figure 10 illustrates the flow dynamics of droplets on a spherical surface at low Weber numbers. The pressure contour map reveals that droplet impact generates high pressure at the sphere’s top. Upon initial contact, flow is impeded, kinetic energy converts to potential energy, and droplets accumulate at the top with limited lateral dispersion. At this stage, flow velocity is low while pressure rises; pressure on the droplet’s sides then gradually decreases. This decrease occurs because side fluid can flow outward and spread along the spherical surface, increasing velocity progressively. As flow develops, interactions between the droplet, spherical surface, and surrounding fluid weaken. The pressure gradient drives fluid toward the sides, further reducing side pressure. During spreading, the spherical shape restricts bottom fluid flow, but peripheral fluid still tends to move, creating velocity differences and shear forces. As seen in Figure 10a, peripheral fluid flows faster than bottom fluid, forming a velocity gradient. This difference, coupled with droplet viscosity, induces fluid rotation and vortex generation. Additionally, uneven temperature distribution within the droplet, caused by heating, contributes to internal vortex formation. Over time, droplet flow velocity increases, and the resulting kinetic energy drives vortex development. Throughout spreading, the pressure distribution adjusts continuously, with the pressure gradient sustaining vortex motion. These factors collectively lead to the gradual expansion of internal droplet vortices.
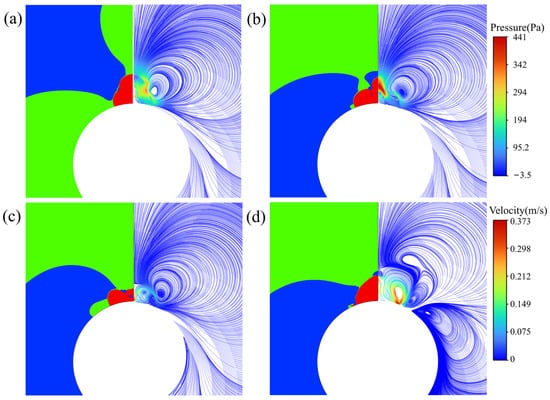
Figure 10.
A pressure contour (left) and velocity streamline diagram (right) of a water droplet spreading on a spherical surface. The dimensionless time from (a–d) is 0.1374, 0.1963, 0.2209, and 0.3389 (D* = 3.217, We = 0.44, Re = 342, Fr = 0.48, T = 100 °C).
4.3. Diameter Ratio and Froude Number Effect on Spreading Coefficient
Figure 11 shows the results at a spherical surface temperature of 100 °C and under different Froude numbers. The maximum spread coefficient of droplets varies with the diameter ratio . As shown in the figure, when the particle size ratio varies within the range of 2 to 8, the maximum spread coefficient remains virtually unchanged with increasing particle size ratio. This apparent insensitivity to the substrate curvature () may stem from the fact that the maximum diffusion range in this inertial regime (Re = 342) is primarily governed by the equilibrium between the initial kinetic energy (scaled by We and Fr) and the energy dissipated through viscous forces (scaled by Re), or alternatively, the energy stored as surface potential during the initial rapid diffusion phase. Whilst the substrate curvature does influence local flow patterns, within the scope of this study, its impact on the overall maximum diffusion range appears less pronounced compared to the dominant initial impact dynamics. Since the particle size ratio does not alter these fluid properties, this likely explains why the maximum spread coefficient remained unchanged. Additionally, the particle size ratio altered the curvature of the spheres. However, within the range of parameters studied, spherical curvature has no significant effect on the maximum diffusion coefficient. This observed insensitivity to substrate curvature () during the maximum spread phase corroborates the recent energy analysis by Fan et al. [16]. They established that during the inertial spreading regime (), the flow is driven primarily by the conversion of vertical kinetic energy into radial momentum. This energy conversion occurs on a timescale significantly shorter than the time required for the bulk flow to ‘sense’ the global curvature of the particle. Thus, the maximum spread is dominated by the impact Weber number rather than the geometric ratio , which only begins to govern the retraction dynamics. The study employed three groups of Froude numbers: 0.48, 10.8, and 20.9. It is evident that as the Froude number increases, the maximum spread coefficient of the droplets also increases. The larger the value of , the greater the initial kinetic energy of the droplet and the greater the inertial force. During droplet flow, the initial kinetic energy dominates the maximum spread state. Kinetic energy is primarily utilized to increase the contact area between the droplet and the surface, thereby converting into surface energy. The inhibitory effects of surface tension and viscous forces are relatively diminished.
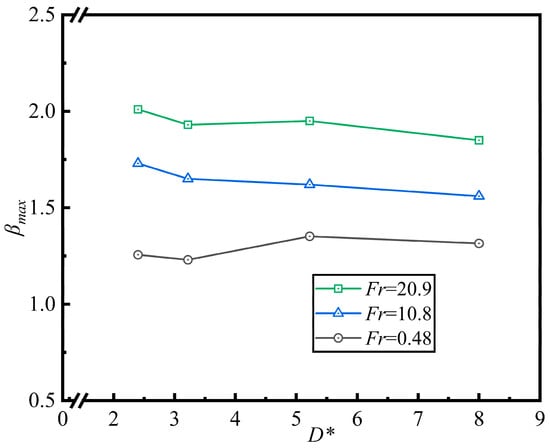
Figure 11.
Effect of different particle size ratios on maximum spread coefficient βmax of droplets (We = 0.44, Re = 342, T = 100 °C).
The diameter also significantly affects heat transfer in droplets. Figure 12 shows the relationship between total heat flux and dimensionless time at different particle size ratios. Total heat flux quantifies the efficiency and intensity of heat transfer during the heat transfer process. The diameter ratio influences the total heat flux by altering the contact area and flow regime. At smaller diameter ratios, the contact area between droplets and the wall increases, resulting in a positive correlation between the total heat flux and the contact area. As clearly shown in the figure, the total heat flux increases as the diameter ratio decreases. The variation in total heat flux over time is closely related to the morphological evolution of the droplets. When the droplet reaches its maximum spread coefficient, its total heat flux also peaks. As the droplet begins to rebound, the total heat flux gradually decreases. As the droplet begins to rebound, the wetted contact area decreases, causing the total heat flux to gradually decrease from its peak value, which was achieved at the point of maximum spread.
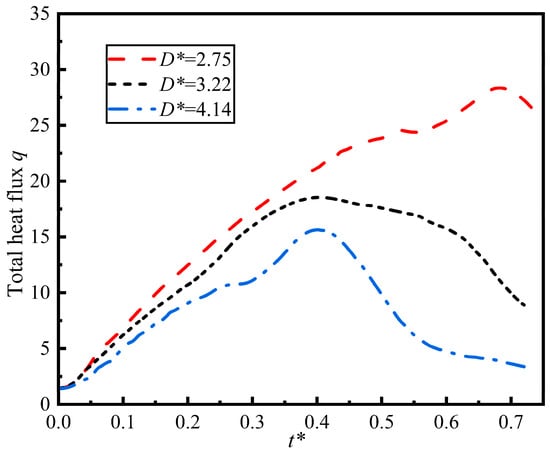
Figure 12.
Total heat flux as a function of dimensionless time for different particle size ratios (We = 0.44, Re = 342, Fr = 0.48, T = 100 °C).
4.4. Weber Number Effect on Spreading Coefficient and Heat Flux
As shown in Figure 13, at a higher Weber number We = 8.35 (lower surface tension), the droplet attains a larger maximum spread coefficient. However, our observations reveal that droplets at a lower Weber number We = 3.36 (higher surface tension) reach their maximum spread more swiftly. This might happen because the stronger restoring force from higher surface tension causes a more rapid deceleration of the spreading motion. Conversely, at a high Weber number, the weaker restoring force permits a greater spreading extent but leads to slower deceleration, thereby increasing the time it takes to reach the maximum spreading coefficient. For all three Weber numbers, the spreading coefficient shows a trend of increasing with the dimensionless time at the initial stage and then approaching a stable value. And as the Weber number increases, the final stable value of the spreading coefficient also increases.
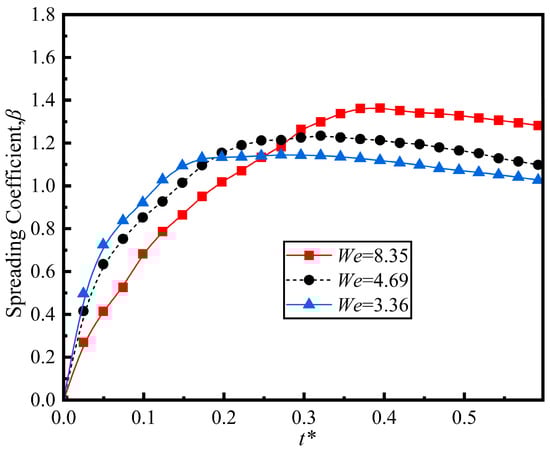
Figure 13.
Spreading coefficient as function of dimensionless time for different Weber numbers (D* = 3.217, Re = 342, Fr = 0.48, T = 100 °C).
Figure 14 shows the total heat flux as a function of dimensionless time for different We numbers. The total heat flux increases more rapidly during the initial spread phase for higher Weber numbers and also reaches a higher peak value. This enhancement is mechanistically explained by the transient boundary layer dynamics described by Xu and Shen [21]. They showed that during the inertial impact phase, the rapid radial expansion of the lamella compresses the thermal boundary layer to its minimum thickness. Comparing the intermediate case We = 4.69 to the lowest case We = 3.36, the peak total heat flux for the intermediate case We = 4.69 is noticeably higher than that for the lowest case We = 3.36. This enhancement is primarily driven by the larger wetted contact area achieved at a higher We, which facilitates greater convective heat transfer from the heated sphere to the droplet, even though the maximum spread is reached slightly later in dimensionless time.
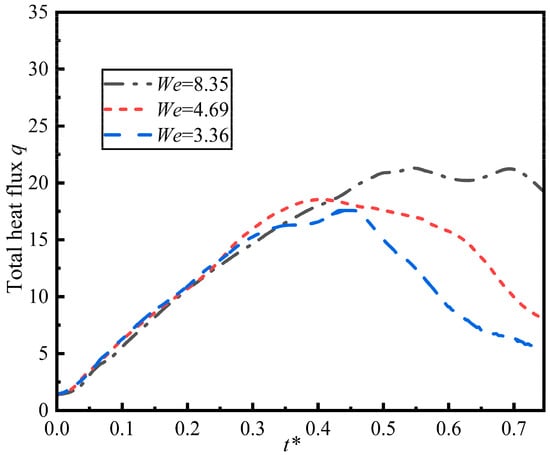
Figure 14.
Total heat flux as a function of dimensionless time for different We numbers (D* = 3.217, Re = 342, Fr = 0.48, T = 100 °C).
4.5. Limitations and Future Perspectives
While this study elucidates the fundamental coupling between surface curvature and droplet spreading, it is important to acknowledge the constraints inherent to the single-droplet Newtonian framework. Industrial applications such as thermal spray coating typically involve multiple-droplet trains impinging on the substrate. In such scenarios, the hydrodynamics shift from contact-line friction to liquid film shearing, which significantly reduces energy dissipation and alters the splashing threshold. Furthermore, the transient thermal wake created by preceding droplets introduces a history-dependent boundary condition that the current isothermal model does not capture.
Additionally, the use of water limits the applicability of the derived correlations to Newtonian fluids. Many functional coatings exhibit non-Newtonian behaviors, such as shear thinning or viscoelasticity. Research suggests that shear-thinning fluids may exhibit enhanced spreading due to viscosity reduction at the high-shear contact line, while viscoelasticity can suppress droplet rebound through elastic energy dissipation. These rheological complexities would likely introduce additional dimensionless parameters into the spreading correlations derived herein.
Building on the baseline established here, future investigations should extend into high-pressure and high-temperature environments relevant to advanced propulsion and cooling systems. High ambient pressure significantly increases gas density, which enhances aerodynamic drag and the air-cushioning effect, potentially delaying liquid–solid contact. Thermodynamic pressure effects also elevate the fluid’s saturation temperature, which could be exploited to suppress the Leidenfrost effect observed in this study.
5. Conclusions
This study investigated the impact dynamics of droplets on heated spherical particles, specifically addressing the scientific gap regarding the heat transfer–flow coupling mechanism in the low-Weber-number regime. By integrating volume-of-fluid (VoF) simulations with high-speed imaging, we resolved how surface curvature and thermal gradients interact to govern the spreading and retraction phases. The principal conclusions derived from this mechanistic analysis are as follows:
- (1)
- Unlike planar surfaces, the heat transfer rate on spherical substrates is non-monotonic and strongly coupled to the geometric wrapping of the liquid film. The peak total heat flux coincides exactly with the maximum spreading diameter, governed by the synchronous expansion of the wetted area and the thinning of the thermal boundary layer due to film stretching over the sphere’s curvature.
- (2)
- For the low-Weber-number regime investigated (), the maximum dimensionless spreading coefficient exhibits a notable insensitivity to the sphere-to-droplet diameter ratio (). This indicates that within the inertial–capillary regime, the initial kinetic energy and surface tension dominate the spreading extent, while substrate curvature primarily influences the retraction dynamics and liquid film thickness distribution rather than the maximum footprint.
- (3)
- Elevated surface temperatures () induce a minor but measurable increase in maximum spreading (). This is attributed to the thermal reduction of liquid viscosity at the contact line, which reduces viscous dissipation during the spreading phase. This creates a positive feedback loop where heat transfer alters the flow properties, which in turn enhances spreading and drives further heat transfer.
Overall, these findings not only enrich the theoretical understanding of droplet flow and heat transfer on spherical surfaces but also provide a basis for industrial processes such as coating, cooling, and reaction by quantifying key parameters to investigate underlying patterns.
Author Contributions
Conceptualization, M.W.; methodology, M.W.; software, F.Y. and H.C.; validation, Y.W. and F.Y.; formal analysis, A.T.; investigation, Y.W.; resources, H.C.; data curation, F.Y.; writing—original draft preparation, Y.W. and F.Y.; writing—review and editing, M.W.; visualization, M.W.; supervision, M.W.; project administration, M.W.; funding acquisition, M.W. All authors have read and agreed to the published version of the manuscript.
Funding
This research was funded by the National Natural Science Foundation of China (No. 22168014) and the Guangxi Natural Science Foundation (No. 2023GXNSFAA026480).
Data Availability Statement
The data presented in this study may be obtained from the corresponding author upon request.
Conflicts of Interest
The authors declare no conflicts of interest.
Nomenclature
| Wetted heat transfer area [] | |
| Specific heat capacity at constant pressure [] | |
| Diameter of the initial droplet [] | |
| Droplet contacts a sphere with a diameter [] | |
| Surface tension between the interfaces of two immiscible fluids [] | |
| Height difference between the droplet release point and the spherical surface at the moment of release [] | |
| Average heat transfer coefficient around the surface of spherical particles [] | |
| Thermal conductivity of the liquid [] | |
| Arc length of the wetted spherical surface of the droplet [] | |
| Acceleration due to gravity [] | |
| Spherical surface temperature [] | |
| Initial droplet temperature [] | |
| Velocity of the droplet upon contact with the spherical surface [] | |
| Reference scales | |
| Reference length [] | |
| Reference velocity [] | |
| Reference time [] | |
| Dimensionless quantity | |
| Nondimensional spreading coefficient [] | |
| Nusselt number [] | |
| Weber number [] | |
| Reynolds number [] | |
| Peclet number [] | |
| Froude number [] | |
| Particle size ratio between spherical particles and droplets [] | |
| Dimensionless time [] | |
| Greek letters | |
| Density of the liquid [] | |
| Thermal diffusivity of the liquid [] | |
| Volume fraction [-] | |
| Surface tension of the fluid [] | |
| Dynamic viscosity of the liquid [] | |
References
- Roisman, I.V.; Breitenbach, J.; Tropea, C. Thermal Atomisation of a Liquid Drop after Impact onto a Hot Substrate. J. Fluid Mech. 2018, 842, 87–101. [Google Scholar] [CrossRef]
- Kazemi, S.; Tashakori-Asfestani, F.; Kheirabadi, S.; Zarghami, R.; Mostoufi, N. CFD-DEM Investigation of Fine Charged Particle Coating in Fluidized Beds. Chem. Eng. Res. Des. 2025, 216, 160–173. [Google Scholar] [CrossRef]
- Wu, C.Y.; Michrafy, A.; Mendyk, A.; Watano, S. Pharmaceutical Particle Technology. Powder Technol. 2015, 285. [Google Scholar] [CrossRef]
- Amblard, B.; Singh, R.; Gbordzoe, E.; Raynal, L. CFD Modeling of the Coke Combustion in an Industrial FCC Regenerator. Chem. Eng. Sci. 2017, 170, 731–742. [Google Scholar] [CrossRef]
- Moon, B.-U.; Hakimi, N.; Hwang, D.K.; Tsai, S.S.H. Microfluidic Conformal Coating of Non-Spherical Magnetic Particles. Biomicrofluidics 2014, 8, 52103. [Google Scholar] [CrossRef] [PubMed]
- Ma, X. Numerical Simulation of Thermocapillary Drop Motion with Internal Circulation. Numeri. Heat Transf. A Appl. 1999, 35, 291–309. [Google Scholar] [CrossRef]
- Rioboo, R.; Marengo, M.; Tropea, C. Time Evolution of Liquid Drop Impact onto Solid, Dry Surfaces. Exp. Fluids 2002, 33, 112–124. [Google Scholar] [CrossRef]
- Zhou, J.; Shi, X.; Liu, J.; Jing, D. Regulation of Droplet Dynamic Behavior after Droplet Impact on Superhydrophobic Surfaces. Colloids Surf. A Physicochem. Eng. Asp. 2024, 685, 133211. [Google Scholar] [CrossRef]
- Roux, D.C.D.; Cooper-White, J.J. Dynamics of Water Spreading on a Glass Surface. J. Colloid Interface Sci. 2004, 277, 424–436. [Google Scholar] [CrossRef] [PubMed]
- Šikalo, Š.; Tropea, C.; Ganić, E.N. Impact of Droplets onto Inclined Surfaces. J. Colloid Interface Sci. 2005, 286, 661–669. [Google Scholar] [CrossRef]
- Khurana, G.; Sahoo, N.; Dhar, P. Post-Collision Hydrodynamics of Droplets on Cylindrical Bodies of Variant Convexity and Wettability. Phys. Fluids 2019, 31, 22008. [Google Scholar] [CrossRef]
- Guo, F.; Zhang, S.; Hu, W.; Zhou, Y.; Du, C.; Wang, F.; Yang, B. A Numerical Study of the Droplet Impact Dynamics on a Two-Dimensional Random Rough Surface. Phys. Fluids 2022, 34, 123607. [Google Scholar] [CrossRef]
- Li, Y.; Wu, X.; Lin, Y.; Hu, Z. Dynamics and Maximum Spreading of Droplet Impact on a Stationary Droplet on the Surface. Int. J. Mech. Sci. 2024, 274, 109272. [Google Scholar] [CrossRef]
- Goswami, A.; Hardalupas, Y.; Goswami, A. Non-Simultaneous Impact of Droplet Pairs on Solid Surfaces. Phys. Fluids 2024, 36, 092010. [Google Scholar] [CrossRef]
- Li, J.; Zhao, C.; Wang, C. Experimental Study on the Dynamics of Droplet Impacting on Solid Surface. Microfluid. Nanofluid. 2023, 27, 69. [Google Scholar] [CrossRef]
- Fan, Z.; Liu, D.; Shen, X.; Liu, N.; Ma, J.; Chen, X. Comparison of Newtonian and Glycerol-Water Solution-Based SiO2 Nanofluid Droplets Impacting on Heated Spherical Surfaces. Int. J. Heat Mass Transf. 2024, 228, 125662. [Google Scholar] [CrossRef]
- Cai, J.; Ma, J.; Chen, X.; Liu, D.; Liang, C.; Fan, Z.; Pan, S. Dynamic Behaviors of Shear-Thinning Droplet Impacting on a Spherical Particle Surface. Int. J. Multiph. Flow 2024, 179, 104929. [Google Scholar] [CrossRef]
- Guggilla, G.; Pattamatta, A.; Narayanaswamy, R. Numerical Investigation into the Evaporation Dynamics of Drop-on-Drop Collisions over Heated Wetting Surfaces. Int. J. Heat Mass Transf. 2018, 123, 1050–1067. [Google Scholar] [CrossRef]
- Liu, Y.; Wang, T.; Song, Z.; Chen, M. Spreading and Freezing of Supercooled Water Droplets Impacting an Ice Surface. Appl. Surf. Sci. 2022, 583, 152374. [Google Scholar] [CrossRef]
- Gurrala, P.; Balusamy, S.; Banerjee, S.; Sahu, K.C. Evaporation of Pure and Binary Droplets on Curved Substrates. Int. J. Heat Mass Transf. 2022, 196, 123212. [Google Scholar] [CrossRef]
- Xu, D.; Shen, Y. Numerical Assessment of the Drag Force and Nusselt Number during Droplet Impingement onto a Particle. Phys. Fluids 2024, 36, 63308. [Google Scholar] [CrossRef]
- Luo, J.; Wu, S.-Y.; Xiao, L.; Zhou, S.-Y.; Chen, L.; Chen, Z.-L. Experiment on Local Convective Heat Transfer for Successive Droplets Impacting on Heated Cylindrical Surface. Exp. Therm. Fluid Sci. 2023, 143, 110849. [Google Scholar] [CrossRef]
- Durubal, M.; Munck, M.; Buist, K.; Kuipers, J.A.M.; Baltussen, M. Experimental Investigation of Spreading Dynamics of Glycerol Droplets on a Heated Surface. Can. J. Chem. Eng. 2025, 103, 3971–3982. [Google Scholar] [CrossRef]
- Liu, L.; Liu, Z.; Meng, F.; Wang, T.; Wang, T.; Dong, X. Experimental Study on Impact Dynamics of Droplet on Heated Copper Surfaces and Liquid Gallium Surfaces. Eur. J. Mech. B/Fluids 2025, 114, 204346. [Google Scholar] [CrossRef]
- Liang, G.; Guo, Y.; Yang, Y.; Zhen, N.; Shen, S. Spreading and Splashing during a Single Drop Impact on an Inclined Wetted Surface. Acta Mech. 2013, 224, 2993–3004. [Google Scholar] [CrossRef]
- Yanli, Z.; Mingjun, X.; Xiaoliang, Z.; Shengli, K. Dynamic Process of Single Water, Water with Additives and Ethanol Droplet Impinging on High-Temperature Quartz Glass Surface. Exp. Therm. Fluid Sci. 2023, 141, 110784. [Google Scholar] [CrossRef]
- Zhuo, X.; Ji, Y.; Ren, Y.; Wang, X.; Qi, H. Investigation of Droplet Impact on Hot Surfaces Based on Thermal Lattice Boltzmann Method. Front. Heat Mass Transf. 2025, 23, 1701–1720. [Google Scholar] [CrossRef]
- Mahato, L.K.; Bracher, R.; Mclauchlan, J.; Harniman, R.L.; Walker, J.S. The Impact Dynamics of Picolitre Aerosol Droplets Depositing on Surfaces: Effect of Wettability, Inertia and Viscosity. Aerosol Sci. Technol. 2025, 59, 845–856. [Google Scholar] [CrossRef]
- Deshpande, S.S.; Anumolu, L.; Trujillo, M.F. Evaluating the Performance of the Two-Phase Flow Solver InterFoam. Comput. Sci. Discov. 2012, 5, 014016. [Google Scholar] [CrossRef]
- Yan, S.L.; Zhang, X.B.; Luo, Z.H. Adaptive Mesh Refinement for VOF Modeling Gas-Liquid Two-Phase Flow: A Summary of Some Algorithms and Applications. Chem. Eng. Sci. 2025, 306, 121291. [Google Scholar]
- Liu, X.; Zhang, X.; Min, J. Maximum Spreading of Droplets Impacting Spherical Surfaces. Phys. Fluids 2019, 31, 92102. [Google Scholar] [CrossRef]
- Brackbill, J.U.; Kothe, D.B.; Zemach, C. A Continuum Method for Modeling Surface Tension. J. Comput. Phys. 1992, 100, 335–354. [Google Scholar] [CrossRef]
- Viswanathan, H. Breakup and Coalescence of Drops during Transition from Dripping to Jetting in a Newtonian Fluid. Int. J. Multiph. Flow 2019, 112, 269–285. [Google Scholar] [CrossRef]
- Bordbar, A.; Taassob, A.; Khojasteh, D.; Marengo, M.; Kamali, R. Maximum Spreading and Rebound of a Droplet Impacting onto a Spherical Surface at Low Weber Numbers. Langmuir 2018, 34, 5149–5158. [Google Scholar] [CrossRef] [PubMed]
- Yan-Peng, L.; Huan-Ran, W. Three-Dimensional Direct Simulation of a Droplet Impacting onto a Solid Sphere with Low-Impact Energy. Can. J. Chem. Eng. 2011, 89, 83–91. [Google Scholar] [CrossRef]


Disclaimer/Publisher’s Note: The statements, opinions and data contained in all publications are solely those of the individual author(s) and contributor(s) and not of MDPI and/or the editor(s). MDPI and/or the editor(s) disclaim responsibility for any injury to people or property resulting from any ideas, methods, instructions or products referred to in the content. |
© 2026 by the authors. Licensee MDPI, Basel, Switzerland. This article is an open access article distributed under the terms and conditions of the Creative Commons Attribution (CC BY) license.