Abstract
The abnormal pore pressure is possibly generated through a comprehensive process including geological, physical, geochemical, or hydrodynamic factors. Generally, all mechanisms are abstracted as four typical categories, namely skeleton deformation, pore fluid mass increase, temperature change, and other mechanisms. Traditional methods for evaluating reservoir overpressure often only consider the influence of a single factor and lack mathematical methods for a comprehensive explanation of reservoir overpressure. Therefore, this article is dedicated to proposing a comprehensive mathematical model, incorporating effective mean stress, shear stress, temperature, pore collapse-induced plastic deformation, time-dependent skeleton deformation, and pore fluid mass increase, to account for pore pressure generation in sedimentary basins. The effects of various factors on pore pressure generation are analyzed, and case studies are conducted. Main conclusions are drawn that both the compressibility of sediments and the porosity at the surface control the pore pressure generation rate and vertical gradient. The pore pressure generation rate and vertical gradient in deep formation are larger than those in shallow formation. The higher compressibility and lower porosity at the surface lead to a greater pore pressure generation rate and vertical gradient during the skeleton deformation. The lower compressibility and a lower porosity at the surface can cause a higher pore pressure change rate and vertical gradient during the pore pressure mass increase and temperature change. By comparison, mechanical loading plays a more important role in pore pressure generation rate and vertical gradient than aquathermal pressuring.
1. Introduction
There are pore fluids saturated in the pore space of sedimentary rocks, such as water, oil, and natural gas, subjected to certain pore pressures. However, the pore pressure sometimes exhibits a higher or a lower value than the hydrostatic pressure at the same depth, which is called abnormally high or low pore pressure, respectively [1].
The generation mechanisms and distribution characteristics of abnormally high or low pore pressures are of importance to understand the geological processes as well as the evolution of hydrocarbon reservoirs. An abnormal pore pressure may be generated through a comprehensive process including geological, physical, geochemical, and hydrodynamic factors. When an abnormal pore pressure exists, there is a certain key factor accompanied by other factors [2,3,4]. In general, the origin and preservation of abnormal pressure result from the following factors such as mechanical loading during overloading or tectonic compression, aquathermal pressuring by thermal expansion or contraction of fluids reacting to temperature changes, the chemical action of pore waters trapped in a sealed formation like dehydration of clay phases, epeirogenic movements with associated erosion and/or deposition, carbonization of organic matter in sediments, buoyancy due to the hydrocarbon column of a reservoir, etc. [5,6]. These direct genetic mechanisms operate within complex macro-geological settings, as documented for the Bohai Bay Basin’s Shahejie Formation, where volcanic activity, paleoclimatic fluctuations, and heterogeneous laminae facilitate the coupling of aforementioned pressure-generating factors [7,8].
These mechanisms can be divided into three categories: (1) increase in compressive stress caused by disequilibrium compaction and tectonic compression; (2) fluid volume change caused by temperature increase, diagenesis, hydrocarbon generation, and cracking to gas; and (3) fluid movement and processes related to density differences between fluids and gases caused by the hydraulic head, osmosis, and buoyancy [9,10]. Among the above-mentioned factors, mechanical loading, aquathermal pressuring, and dehydration of clay phases are extensively recognized as vital factors [11,12,13,14]. In this paper, four categories are divided for all factors affecting pore pressure generation: (1) Mechanism I is skeleton deformation (elastic, plastic, or time-dependent), including undercompaction, tectonism, pore collapse, cementation, and creep; (2) Mechanism II is pore fluid mass increase, including clay dehydration, hydrocarbon generation, injection, and dialysis; (3) Mechanism III is temperature change that can cause aquathermal expansion; and (4) Mechanism IV incorporates other mechanisms, such as paleopressure, and lateral pressure level.
Generally, an abnormal pressure formation often exhibits poor pore connectivity as well as low permeability [15]. A necessary condition for all mechanisms is that the formation must possess poor pore connectivity, low permeability, and insufficient time for seepage. For instance, the undercompaction-induced abnormal high pore pressure often develops in thick shale layers with low permeability and rapid deposition. Theoretically, the pore pressure in an unconnected pore can be used to quantitatively study the effects of the stress, temperature, and pore fluid mass increases on the pore pressure. In laboratory experiments, the pore pressure response in the unconnected pores at various mechanical, thermal, or chemical conditions can be observed through a test in undrained conditions.
The possible mechanisms of abnormal pore pressure have been mostly investigated through theoretical or mathematical approaches [16,17]. For the theoretical aspects, many physical models are used to account for the generation of abnormal pore pressure. It is worth noting that the root cause of abnormal pore pressure is the incongruity of fluid volume and pore volume changes. For instance, the abnormally high pore pressure originates from this type of mechanism, leading to the active increase in pore fluids’ volume, such as mineral dehydration, hydrothermal pressurization, generation of hydrocarbons, artificial injection, dialysis, etc. [18]. Correspondingly, the abnormally high pore pressure can also be possibly induced by this kind of mechanism that causes the active decrease in pore space volume, such as undercompaction, tectonism, cementation, etc. In theory, the abnormal pore pressure is time-dependent. In other words, it relies on the pore fluid dissipation capability, including the communication degree of pores, the permeability of the matrix, the mobility of pore fluids, etc. For the mathematical models, many studies focus on the compaction model, diagenesis model, and multi-factor model [19,20,21,22,23,24,25,26].
In this article, a comprehensive mathematical model is proposed to account for pore pressure generation in sedimentary basins. Firstly, the basic equations are established to incorporate the changes in temperature, effective mean stress, and shear stress temperature. Pore collapse-induced plastic deformation, time-dependent skeleton deformation (induced by cementation and creep), and the pore fluid mass increase are also considered. Secondly, the effects of various factors on abnormal pore pressure are analyzed, such as skeleton deformation, pore fluid mass increase, and temperature change. Lastly, the model validation and case study are conducted. The model integrates the effects of multiple influencing factors on overpressure, which can better explain the abnormal pore pressure of the reservoir and provide ideas for subsequent research.
2. Basic Equations
2.1. Modified Elastic Model
An important characteristic of a porous medium is how the pore pressure responds to a change in the mean stress under undrained conditions. Skempton described this problem only considering elastic deformation [27] as follows:
where Δp is the pore pressure change, is the change in the total mean stress, and B is the Skempton B-coefficient. The coefficient B can be expressed as [28]
where Kf is the bulk modulus of the pore fluid, is the porosity, Kfr is the bulk modulus of the skeleton, and Ks is the bulk modulus of the solid particle.
Using the effective stress theory [29], the change in total mean stress in Equation (1) can be written as
where is the change in the effective mean stress; αb is Biot’s coefficient, which is expressed as
When using the effective mean stress, Equation (1) can also be expressed as
It is noted that the porosity and the bulk modulus of the skeleton will considerably evolve with the effective stress change. Therefore, both αb and B are not constant when the effective stress changes. The porosity will decrease with the increase in effective stress, which is written as [24]
where is the effective mean stress; is the porosity at the surface; b is a material parameter.
Considering Equation (6), the compressibility of porosity can be expressed as
where is the porosity compressibility, which can be related to the bulk compressibility of the skeleton by
or
where Cfr = 1/Kfr is the bulk compressibility of the skeleton. According to Equations (1)–(9), the pore pressure generated by the change in total mean stress can be calculated.
2.2. Modified Thermo-Elasto-Plastic Model
Agar et al. further studied the pore pressure that responds to both the elastoplastic deformation and temperature increase [30]. The pore pressure generation, considering thermal expansion and shear dilation, is expressed as
where γw is the thermal expansion coefficient of water; γs is the thermal expansion coefficient of the solid grains; ΔT is the temperature change; Cs is the compressibility of the solid grains; Cw is the compressibility of water; Δp is the pore pressure change; γdr = (ΔV/V)dr/ΔT is the drained coefficient of thermal expansion; Cc is the drained isotropic compressibility; Sd is used here to account for dilatant volume changes during undrained heating of a sample under anisotropic stresses; τ = σ1 − σ3 is the shear stress; σ1 and σ3 are the maximum and minimum principal stresses, respectively.
According to Equation (10), the pore pressure generation corresponding to the changes in temperature, effective mean stress, and shear stress is
Considering Equation (3), Equation (11) can also be expressed as
where
In Equation (11), let ΔT = 0 and Δτ = 0, and compare Equation (11) with Equation (5). The parameter Cc can be expressed as
In general, Ks/Kfr >> 1, so 1/(Ks − Kfr) ≈ 1/Ks. In reality, in Agar’s model, Cc can be viewed as the inverse of the bulk modulus of a weak skeleton.
2.3. Comprehensive Model in Undrained Conditions
In this paper, the pore collapse-induced plastic deformation, time-dependent skeleton deformation (induced by cementation and creep), and the pore fluid mass increase by Mechanism II are further considered, which can be displayed as
where is a parameter that describes the relative pore fluid’s volume increase corresponding to the mass increase induced by clay dehydration, hydrocarbon generation, injection, and dialysis per unit time; Δt is the time change; is a critical mean effective stress where the pore collapse starts taking place; is a parameter that depicts the relative skeleton’s volume increase corresponding to the cementation and creep processes; Cpc is the unrecoverable skeleton’s compressibility due to the pore collapse; is a function that determines whether the pore collapse occurs, which is defined as
In this regard, the pore pressure response under the above-mentioned factors can be predicted by
Equation (18) is a more comprehensive engineering method than Skempton’s and Agar’s models. However, Equation (18) cannot solve the pore pressure generation in partially drained or drained conditions, and this method is only suitable for the local pore pressure prediction in a fixed position.
2.4. Comprehensive Model in Drained Conditions
For a more physical explanation, Shi and Wang proposed a basic differential equation for porous flow under the effects of some factors such as external loading and aquathermal pressuring [24].
In this paper, all factors, including Mechanisms I~IV, are considered, and the basic equation for porous flow can be written as
where p is the pore pressure; t is the time; ρw is the water density; k is the absolute permeability; ηw is the water viscosity; g is the gravitational potential; pt = (σ1 + σ2 + σ3)/3 is the mean total stress due to overloading or tectonic compression (positive in compression); σ1, σ2, and σ3 are the maximum, intermediate and minimum principal stresses, respectively; τ = σ1 − σ3 is the shear stress; γb is the bulk thermal expansion coefficient; T is the temperature; h is the source or sink of water, which mathematically represents Mechanism II (pore fluid mass increase), due to dehydration of clays and other causes.
Equation (19) consists of a left-hand side (LHS) and six right-hand side (RHS) terms, each corresponding to specific physical processes:
LHS: Dynamic evolution term of pore pressure, dominated by porosity compressibility, solid grain compressibility, and fluid compressibility.
RHS Term 1: Pore pressure dissipation process.
RHS Term 2: Deformation induced by total mean stress change.
RHS Term 3: Deformation caused by shear dilatancy.
RHS Term 4: Volumetric change driven by temperature variation.
RHS Term 5: Effects of porosity change (from solid skeleton creep, cementation, or chemical processes).
RHS Term 6: Effects of fluid mass increase (e.g., clay dehydration, hydrocarbon generation, liquid injection).
D()/Dt is the material differential in the deforming coordinates. In the fixed coordinates, it can be written as
where vs is the velocity of the solid matrix concerning the fixed coordinates.
According to Biot’s theory, αb can be expressed as
Substituting Equations (20) and (21) into Equation (19), there is
This model is a comprehensive mathematical model for evaluating abnormal pore pressure induced by various factors. It is noted that Equation (22) can be reduced to Equation (16) when Cfr/Cs >> 1, , and k ≈ 0. Therefore, Equation (16) can be reduced to Skempton’s and Agar’s models.
2.5. Model Comparison Analysis
The comprehensive mathematical model developed in this study constitutes a systematic extension of three foundational frameworks: the Skempton elastic model, Agar’s thermo-elasto-plastic model, and the multi-factor model of Shi & Wang. By integrating and enhancing these approaches, the proposed model achieves a more robust representation of multi-mechanism coupling, thereby improving its applicability to complex geological conditions. Specifically, it is suitable for evaluating abnormal pore pressure caused by macro-dominant mechanisms such as skeleton deformation, pore fluid mass increase, and temperature change in sedimentary basins. A targeted comparative analysis, centered on the limitations of these classical models, is presented below.
The Skempton model is inherently limited to simulating pore-pressure response under pure elastic deformation, which is primarily applicable to shallow formations. To overcome this, our model introduces pore collapse-induced plastic deformation (governed by the unrecoverable compressibility Cpc and the collapse judgment function in Equation (17)) and time-dependent skeleton deformation due to cementation and creep (parameter ). These additions enable the accurate characterization of the nonlinear pressure response in deep formations under high effective stress, addressing a key omission in the classical theory.
While Agar’s model incorporates thermal and mechanical coupling, it focuses on short-term loading and lacks mechanisms for pore fluid mass change. Our model addresses this by explicitly coupling pore-fluid mass increase processes—such as clay dehydration, hydrocarbon generation, and injection—into a unified governing framework. This integration allows for the synergistic simulation of composite effects from mechanical loading, aquathermal pressuring, and chemical pressuring, offering a more realistic match to the multi-factor nature of actual geological systems.
Compared to the integrative but less explicitly coupled approach of Shi & Wang, our model provides clearer mathematical formulations and coupling logic for all four categorized mechanisms (I–IV). A significant enhancement is the inclusion of shear stress-induced dilation/compaction effects, which are often neglected. This refinement overcomes the classical model’s limitations of weak inter-factor coupling and omission of shear influence, thereby strengthening the model’s theoretical integrity and predictive potential.
The proposed model is established based on classical frameworks, when Cpc = 0, = 0 (no time effect or pore fluid mass increase), Equation (18) can be simplified to Agar et al.’s thermo-elasto-plastic model (Equation (11)); by further neglecting the temperature effect (ΔT = 0) and shear stress action ( = 0), it can be simplified to Skempton’s (1961) elastic model (Equation (5)). This demonstrates that the proposed framework inherits the soundness of established theories while systematically extending them to a broader and more geologically realistic set of conditions. In terms of practical applications, the model can be divided into two scenarios based on fluid flow treatment: undrained local analysis, where permeability is extremely low (k → 0) with negligible fluid flow and the model degenerates into its undrained form (Equation (18)), applies to estimating instantaneous pore-pressure change or maximum pressure potential in sealed geological units to support wellbore risk assessment at specific locations, while basin-scale simulation, where fluid flow is considered (k > 0) and the complete governing equation (Equation (22)) is used, suits simulating overpressure generation, migration, and dissipation during long-term geological processes at the sedimentary basin scale to support regional pressure field prediction.
3. Effects of Key Factors on Pore Pressures
The abnormal pore pressure is always generated when the permeability is less than 10 μD [31]. In this regard, the pore fluids cannot be drained, so the first term on the right in Equation (22) can be reasonably neglected.
3.1. Time-Related Model
For a chosen position x, the change rate of pore pressure due to the change rates of these factors are discussed in terms of (1) total mean stress, (2) temperature, (3) shear stress, (4) time induced-porosity, and (5) fluid increase in the unconnected pores caused by dehydration of clays, hydrocarbon generation, or liquid injection.
(1) The change rate of pore pressure due to the mechanical elastic loading (excluding the shear dilation) is
The total mean stress can be written as
Substituting Equation (24) into Equation (23), the pore pressure change rate due to the change rate of the effective mean stress can be expressed as
where
(2) The change rate of pore pressure due to the change in temperature is
The temperature change can be further written as
where c is the bulk specific heat; ρ is the bulk density; cw is the specific heat of water; ρw is the density of water; vw is the velocity of water for the solid matrix; K is the bulk thermal conductivity; Q is the heat source per unit volume.
The bulk specific heat, density, and thermal conductivity can be respectively expressed as (Lewis and Rose, 1970; Smith, 1973; Shi and Wang, 1986) [24,32,33]
where cs is the specific heat of solid; ρs is the density of solid; Ks and Kw are the thermal conductivities of solid and water, respectively.
(3) The change rate of pore pressure due to the shear dilation or shear compaction is
where depicts the shear dilation or compaction, which can be measured by the triaxial compression tests. The relation between the porosity and the volumetric strain εv is (Tortike et al., 1993) [34]
Therefore, can be written as
(4) The change rate of pore pressure due to the porosity change (creep or cementation) is
where shows porosity decrease rate induced by the creep or cementation. In a creep test, the volumetric strain evolution with time can be measured. In this regard, the time-dependent porosity change rate can be written as
In the process of cementation, the time-dependent porosity change is dependent on the growth rate of the cement, which can be described as
where Vp0 is the initial pore volume; Vce is the current volume occupied by growing cement; Vs is the initial volume of solid.
(5) The change rate of pore pressure due to dehydration of clays, hydrocarbon generation, and liquid injection is
where h is the pore fluid mass increase per unit volume and per unit time, or the density increase per unit time.
In the process of clay dehydration, hydrocarbon generation, or liquid injection, h can be depicted by
where Iw is the mass increase per unit time in an initial pore volume of Vp0.
3.2. Depth-Related Model
For a chosen moment t, the gradient of pore pressure due to the spatial changes in these factors is discussed in terms of (1) total mean stress, (2) temperature, and (3) shear stress. In this paper, it is supposed that the pore pressure is only dependent on the vertical depth with ongoing sedimentation. It is common sense that the overburden pressure and temperature will increase with the increase in depth.
(1) The pore pressure generation caused by the overburden is
where is the vertical gradient of the total stress, which can be written as
Using effective stress, Equation (40) can also be expressed as
where is the vertical gradient of the effective stress.
(2) The pore pressure generation caused by the shear stress is
where is the vertical gradient of the shear stress.
(3) The pore pressure generation induced by the temperature is
where is the vertical gradient of formation temperature.
For a formation with extreme permeability, the fluids in the “closed-off” pores can be viewed as the undrained condition. In this regard, the generated pore pressures induced by various factors can be theoretically evaluated by the equations above.
4. Case Studies
It should be noted that the key to the generation of abnormally high pore pressure lies in the balance between the source term and the diffusion term. For instance, if the source term is dominant, pore pressure will increase. When low-permeability layers such as clays or shales are present, the diffusion term becomes very small, and the source terms will dominate; high pore pressures then build up [24].
From Equations (23)–(39), the pore pressure at a certain depth will change when the stress state, temperature, porosity, and mass of pore fluids change with time. Similarly, the pore pressure at a certain time will also change when the stress state and temperature change with depth. To better contextualize the subsequent case studies, we first clarify the distinct physical essences of Mechanisms I~III, as their contributions to pore pressure are inherently linked to the aforementioned factors: Mechanism I (skeleton deformation) essentially involves the conversion of mechanical work into fluid pressure when the mechanical compression rate of pore volume exceeds fluid drainage capacity; Mechanism II (pore fluid mass increase) represents an ‘endogenous’ pressurization caused by in situ fluid generation or injection within a closed pore system; Mechanism III (temperature change) characterizes the thermodynamic response of pore fluids to geothermal gradients, embodying the process of converting thermal energy into pressure through thermal expansion. Building on this physical foundation, we present selected typical cases as follows.
4.1. Mechanism I: Skeleton Deformation
(1) Time-related mean effective stress
In this part, the pore pressure generation at a fixed position caused by the change in the mean effective stress with geologic time is discussed. Bredehoeft and Hanshaw stated that high pore pressure can be generated if the permeability is no more than 10 μD (or 10−17 m2) for a sedimentation rate of 5 × 10⁻⁴ m/year [31]. A critical time tc used to describe this period is (Shi and Wang, 1986) [24]
where L is the thickness of the impermeable layer. If k = 1 μD, the critical time tc can be calculated as about ten thousand years.
Therefore, the change rate of the effective mean stress can be assessed by
If Cs = 10−11 Pa−1, Cw = 4 × 10⁻¹⁰ Pa−1, pe = 10 or 50 MPa, = 0.1~1, b = 10−9~10−6 Pa−1, k = 1 μD, L = 200 m, and ηw = 1 mPa·s, the pore pressure induced by the mean effective stress change with geologic time can be calculated. For instance, when pe = 10 MPa, = 0.5, and b = 10−8 Pa−1, = 10−3 MPa/year. Similarly, if another pe is used, a new tc can be recalculated. For different formations, the porosity changes with the effective stress can be characterized by different and b. In this regard, the change rate of pore pressure generation can be expressed as a function of the effective stress (10 and 50 MPa), (0.1~1), and b (10−9~10−7), just as shown in Figure 1 and Figure 2. In general, for clays and shales, n0 ranges from 0.5 to 0.8, and b ranges from 10−8~10−7 Pa−1 [35]; for sandstone, n0 ranges from 0.3~0.5, and b ranges from 5 × 10⁻⁹~5 × 10⁻⁸ Pa−1 [36].
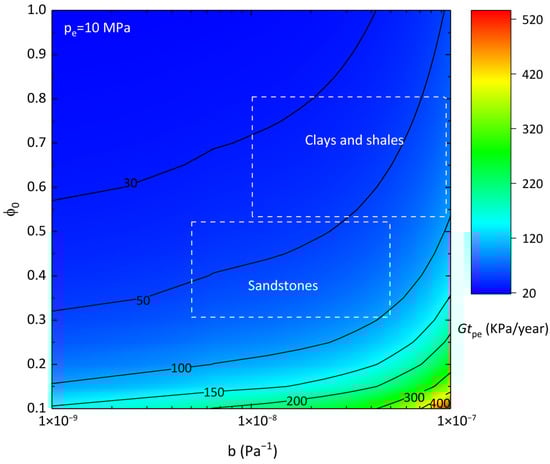
Figure 1.
Pore pressure change rate induced by time-related effective stress (pe = 10 MPa).
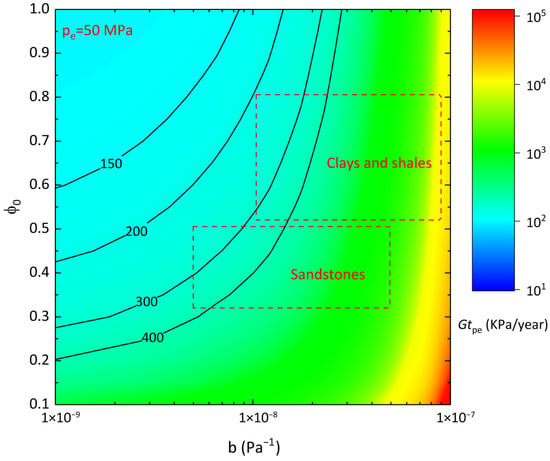
Figure 2.
Pore pressure change rate induced by time-related effective stress (pe = 50 MPa).
As shown in Figure 1, the compressibility of sediments has a significant impact on the pore pressure generation rate Gtpe when pe = 10 MPa. With the smaller value of b (or smaller compressibility), the pore pressure generation rate is reduced. For instance, for the sandstone with = 0.3, the Gtpe increases from 62 kPa/year to 108 kPa/year with b from 5 × 10⁻⁹ to 5 × 10⁻⁸. For the sandstone with b = 5 × 10⁻⁹ Pa−1, the Gtpe declines from 62 kPa/year to 37 kPa/year with from 0.3 to 0.5. A comparison of sandstones and shales shows that the sandstone has a slightly greater Gtpe (ranging from 37 to 108 kPa/year for sandstones, and from 27 to 96 kPa/year for shales).
Figure 2 shows the pore pressure generation rates at different and b when the effective stress is as high as 50 MPa. Both the compressibility and the porosity at the surface control the pore pressure generation rate when the effective stress is high. The pore pressure generation rate ranges from 240 to 4000 kPa/year for sandstones, and from 200 to 18,820 kPa/year for shales. The Gtpa in a deep formation with a high pe = 50 MPa is much larger than the Gtpa in a shallow formation with a low pe = 10 MPa.
(2) Depth-related mean total stress
In this part, the pore pressure generation at a fixed time caused by the change in the mean effective stress with depth is discussed. If ρs = 2700 kg/m3, ρw = 1000 kg/m3, and g = 9.8 m/s2, the vertical gradient of pore pressure generation can be expressed as a function of the effective stress (10 and 50 MPa), (0.1~1), and b (10−9~10−7), just as shown in Figure 3 and Figure 4.
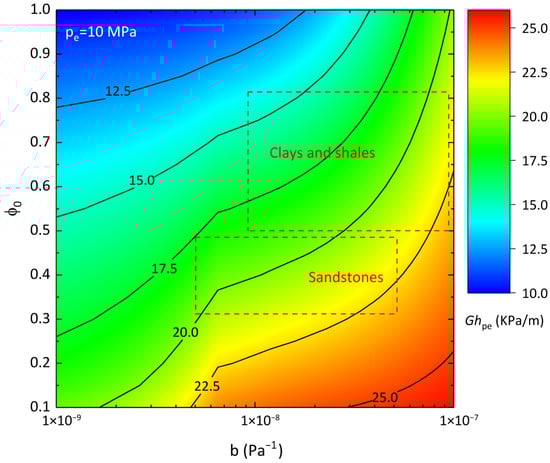
Figure 3.
Pore pressure vertical gradient induced by depth-related stress (pe = 10 MPa).
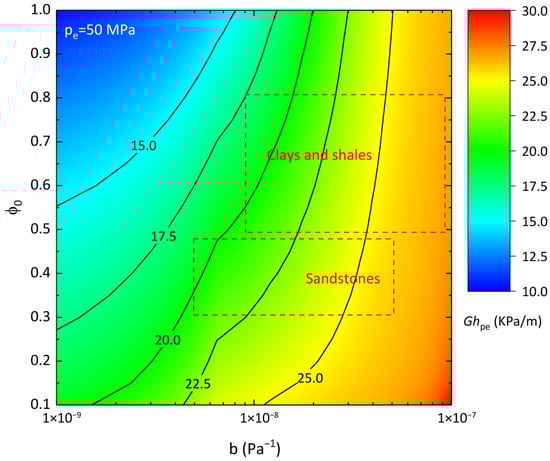
Figure 4.
Pore pressure vertical gradient induced by depth-related stress (pe = 50 MPa).
From Figure 3, it can be seen that both the compressibility and the porosity at the surface are considerably controlled factors. The higher compressibility (b) and a lower porosity at the surface () lead to a greater pore pressure vertical gradient Ghpe when pe = 10 MPa. For instance, for the shales with = 0.5, the pore pressure vertical gradient changes from 18.4 kPa/m to 23.2 kPa/m with b from 10−8 to 10−7 Pa−1. For the shales with b = 10−8 Pa−1, the pore pressure vertical gradient drops from 18.4 kPa/m to 14 kPa/m with from 0.5 to 0.8. A comparison of sandstones and shales shows that the sandstone has a slightly greater pore pressure vertical gradient (ranging from 17.5 to 23.4 kPa/m for sandstones, and from 14 to 23.2 kPa/m for shales).
Figure 4 shows the pore pressure vertical gradients at different and b values when the effective stress is as high as 50 MPa. Both the compressibility and the porosity at the surface control the pore pressure vertical gradient. The pore pressure vertical gradient ranges from 18.7 to 26.1 kPa/m for sandstones, and from 17.5 to 26.9 kPa/m for shales. The Ghpe in deep formation with a high pe = 50 MPa is slightly larger than the Ghpe in shallow formation with a low pe = 10 MPa.
4.2. Mechanism II: Pore Fluid Mass Increase
In this part, the pore pressure generation at a fixed position caused by the change in the pore fluid mass induced by artificial liquid injection is discussed. Assuming that water is injected through a horizontal well in a thick reservoir, the parameter h can be evaluated by
where minj is the total mass of the injected water; Qinj is the total volume of the injected water, r is the effective radius defined in Gao et al. (2019), Lw is the well length, and tinj is the injection time [37].
If r = 6 m, Qinj = 225 m3, Lw = 500 m, and tinj = 4000 min, the change rate of pressure generation can be expressed as a function of the effective stress (10 and 50 MPa), (0.1~1), and b (10−9~10−7), just as shown in Figure 5 and Figure 6.
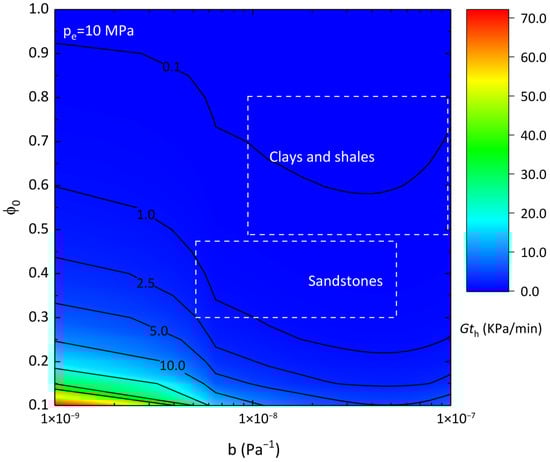
Figure 5.
Pore pressure change rate induced by water injection (pe = 10 MPa).
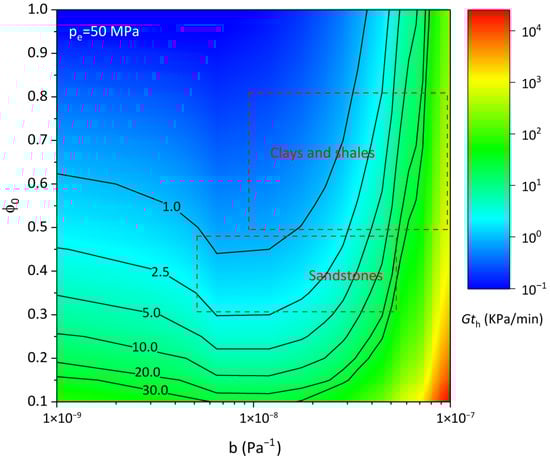
Figure 6.
Pore pressure change rate induced by water injection (pe = 50 MPa).
Figure 5 shows that the lower compressibility (b) and a lower porosity at the surface () can cause a higher pore pressure change rate Gth when pe = 10 MPa. For instance, for the sandstone with = 0.3, the pore pressure change rate drops from 2.5 kPa/min to 0.5 kPa/min with b from 5 × 10⁻⁹ to 5 × 10⁻⁸. For the sandstone with b = 5 × 10⁻⁹ Pa−1, the pore pressure change rate declines from 2.5 kPa/min to 0.8 kPa/min with from 0.3 to 0.5. A comparison of sandstones and shales shows that the sandstone has a greater pore pressure change rate (ranging from 0.2 to 2.5 kPa/min for sandstones, and from 0.08 to 0.3 kPa/min for shales).
Figure 6 shows the injection-induced pore pressure change rates at different and b values when the effective stress is as high as 50 MPa. Both the compressibility and the porosity at the surface control the pore pressure change rate in these circumstances. The pore pressure change rate ranges from 0.8 to 50 kPa/min for sandstones, and from 0.2 to 802 kPa/min for shales.
4.3. Mechanism III: Temperature Change
(1) Temperature change with time
In this part, the pore pressure generation at a fixed position caused by the change in temperature with time is discussed. Using the critical time tc, the change rate of temperature can be assessed by
If the depth is 1000 m, γw = 4 × 10⁻⁴ °C−1, and = 0.03 °C/m, the change rate of pore pressure generation can be expressed as a function of the effective stress (10 and 50 MPa), (0.1~1), and b (10−9~10−7), just as shown in Figure 7 and Figure 8.
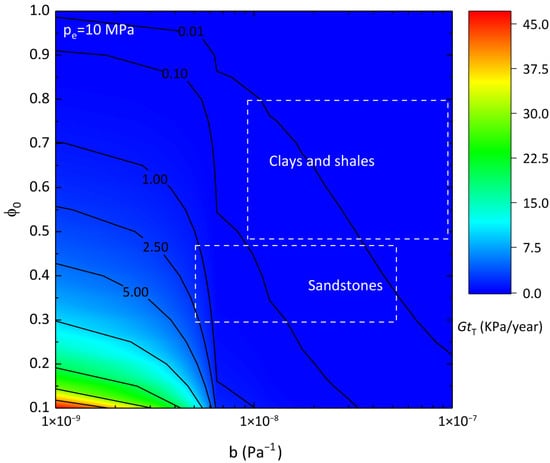
Figure 7.
Pore pressure generation rate induced by time-related temperature (pe = 10 MPa).
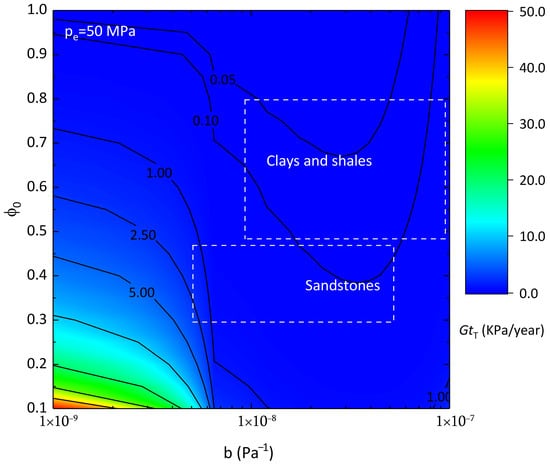
Figure 8.
Pore pressure generation rate induced by time-related temperature (pe = 50 MPa).
Figure 7, the lower compressibility (b) and a lower porosity at the surface () are beneficial to a higher pore pressure generation rate GtT when pe = 10 MPa. With smaller values of b and , the pore pressure generation rate is enhanced. For instance, for the sandstone with = 0.3, the pore pressure generation rate decreases from 3 kPa/year to 0.01 kPa/year with b from 5 × 10⁻⁹ to 5 × 10⁻⁸. For the sandstone with b = 5 × 10⁻⁹ Pa−1, the pore pressure generation rate declines from 3 kPa/year to 1.2 kPa/year with from 0.3 to 0.5. A comparison of sandstones and shales shows that the sandstone has a higher pore pressure generation rate (ranging from 0.01 to 3 kPa/year for sandstones, and from 0.01 to 0.1 kPa/year for shales).
Figure 8 shows that the pore pressure generation rate ranges from 0.08 to 3.5 kPa/year for sandstones, and from 0.04 to 0.2 kPa/year for shales when pe = 50 MPa. The GtT in deep formation with pe = 50 MPa is larger than that in shallow formation with pe = 10 MPa. Comparing Figure 1 and Figure 2 with Figure 7 and Figure 8, mechanical loading plays a key role in pore pressure generation rate.
This analysis of temperature-driven pore pressure changes is consistent with recent understanding from thermos–hydro–mechanical (THM) coupling studies. For instance, the integrated model of Khalaf (2026) demonstrates that thermal stimulation and stress-dependent deformation are key coupled processes governing pore pressure evolution in low-permeability systems [38].
(2) Temperature change with depth
Affected by the heat inside the earth, the formation temperature increases with the increase in burial depth. In this part, the pore pressure generation at a fixed time caused by the change in temperature with depth is discussed. The vertical gradient of pore pressure is expressed as a function of the effective stress (10 and 50 MPa), (0.1~1), and b (10−9~10−7), just as shown in Figure 9 and Figure 10.
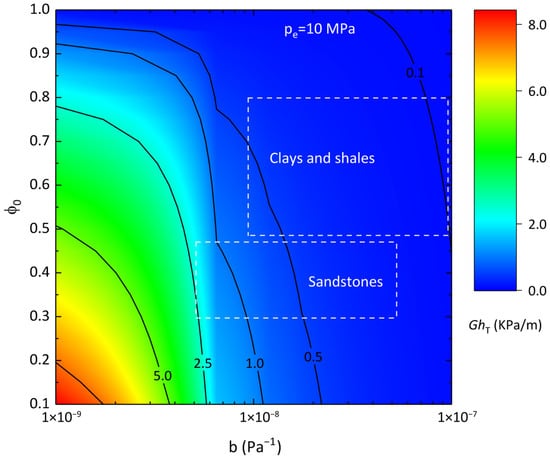
Figure 9.
Pore pressure vertical gradient induced by depth-related temperature (pe = 10 MPa).
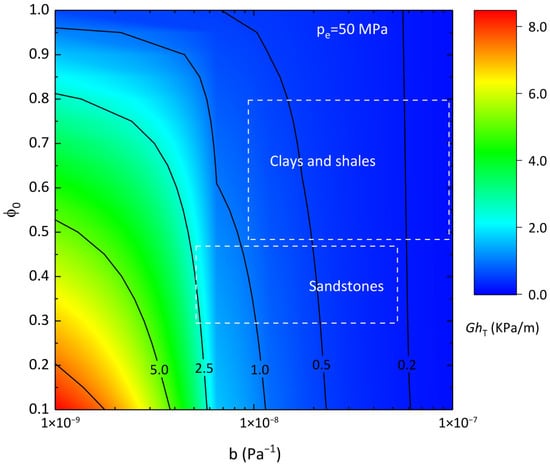
Figure 10.
Pore pressure vertical gradient induced by depth-related temperature (pe = 50 MPa).
From Figure 9, it can be seen that the lower compressibility (b) and a lower porosity at the surface () can induce a greater pore pressure vertical gradient GhT when pe = 10 MPa. For instance, for the sandstone with = 0.3, the pore pressure vertical gradient decreases from 2.5 kPa/m to 0.2 kPa/m with b from 5 × 10⁻⁹ to 5 × 10⁻⁸. For the sandstone with b = 5 × 10⁻⁹ Pa−1, the pore pressure vertical gradient declines from 2.5 kPa/m to 2 kPa/m with from 0.3 to 0.5. A comparison of sandstones and shales shows that the sandstone has a greater pore pressure vertical gradient (ranging from 0.17 to 2.5 kPa/m for sandstones, and from 0.1 to 0.7 kPa/m for shales).
Figure 10 shows the pore pressure vertical gradient ranges from 0.22 to 2.7 kPa/m for sandstones, and from 0.13 to 0.93 kPa/m for shales when pe = 50 MPa. The GhT in deep formation with a high pe = 50 MPa is larger than the GhT in shallow formation with a low pe = 10 MPa. Comparing Figure 3 and Figure 4 with Figure 9 and Figure 10, it is clear that mechanical loading plays a key role in the pore pressure vertical gradient.
5. Conclusions
This article is dedicated to proposing a comprehensive mathematical model, incorporating effective mean stress, shear stress, temperature, pore collapse-induced plastic deformation, time-dependent skeleton deformation induced by cementation and creep, and pore fluid mass increase, to account for pore pressure generation in sedimentary basins. The effect of various factors on pore pressure generation is analyzed, and case studies are conducted. Several main conclusions are drawn as follows:
(1) The mechanisms for pore pressure generation are divided into four categories: Mechanism I is skeleton deformation (elastic, plastic, or time-dependent), including undercompaction, tectonism, pore collapse, cementation, and creep; Mechanism II is pore fluid mass increase, including clay dehydration, hydrocarbon generation, injection, and dialysis; Mechanism III is temperature change that can cause aquathermal expansion; and Mechanism IV incorporates other mechanisms, such as paleopressure, and lateral pressure level.
(2) For Mechanism I, both the compressibility of sediments and the porosity at the surface control the pore pressure generation rate and vertical gradient, and the compressibility is more dominant under lower effective stress. The higher compressibility and lower porosity at the surface lead to a greater pore pressure generation rate and vertical gradient. The sandstone has a slightly greater pore pressure generation rate and vertical gradient. In addition, the deep formation is more beneficial for the pore pressure generation rate and vertical gradient than the shallow formation.
(3) For Mechanism II, both the compressibility and the porosity at the surface control the pore pressure change rate. The lower compressibility and a lower porosity at the surface can cause a higher pore pressure change rate in shallow formation, while this evolution trend is complex in deep formation. The sandstone has a greater pore pressure change rate.
(4) For Mechanism III, the lower compressibility and a lower porosity at the surface are beneficial to a higher pore pressure generation rate and vertical gradient. The sandstone has a higher pore pressure generation rate and vertical gradient. The pore pressure generation rate and vertical gradient in deep formation are larger than those in shallow formation. By comparison, mechanical loading plays a more important role in pore pressure generation rate and vertical gradient than aquathermal pressuring.
In summary, this model provides a unified framework for understanding and predicting overpressure in sedimentary basins, with direct implications for basin modeling, reservoir evaluation, and drilling safety.
Author Contributions
Conceptualization, L.Z. and L.D.; Methodology, L.Z., L.D. and C.M.; Validation, F.Q., W.K. and C.G.; Formal Analysis, L.Z., S.Q. and F.Q.; Investigation, F.Q., W.K., C.G., C.Z., B.M. and K.Z.; Resources, L.D. and C.M.; Data Curation, L.Z. and F.Q.; Writing—Original Draft Preparation, L.Z.; Writing—Review and Editing, L.D., C.M., S.Q. and F.Q.; Visualization, W.K. and K.Z.; Supervision, L.D.; Project Administration, L.D. and L.Z.; Funding Acquisition, L.D. All authors have read and agreed to the published version of the manuscript.
Funding
This research was funded by the National Natural Science Foundation of China (Grant No. 52074224), the project of Theory of Hydrocarbon Enrichment under Multi-Spheric Interactions of the Earth (THEMSIE) (Grant No. THEMSIE04010107), and the Shaanxi Provincial Key Research and Development Program (Grant No. 2024GX-YBXM-503) titled “Research on Real-time Quantitative Inversion Mechanism and Prediction Method for Formation CO2 Content during Drilling”.
Data Availability Statement
The original contributions presented in this study are included in the article. Further inquiries can be directed to the corresponding authors.
Conflicts of Interest
Author Shanshan Quan was employed by the company Changqing Oilfield Third Gas Production Plant. The remaining authors declare that the research was conducted in the absence of any commercial or financial relationships that could be construed as a potential conflict of interest.
References
- Gao, Y.; Chen, M.; Jiang, H. Influence of unconnected pores on effective stress in porous geomaterials: Theory and case study in unconventional oil and gas reservoirs. J. Nat. Gas Sci. Eng. 2021, 88, 103787. [Google Scholar] [CrossRef]
- Dutta, J.; Kumar, A.; Bhardwaj, N.; Sinha, N. Fault-Related overpressure in the krishna-godavari basin, India. Interpretation 2020, 8, T183–T193. [Google Scholar]
- Liu, J.D.; Zhang, C.J.; Jiang, Y.L.; Bai, G.S. Overpressure and gas charging in tight sandstone: Xujiahe Formation, northeastern Sichuan Basin. Pet. Sci. 2022, 19, 2583–2600. [Google Scholar] [CrossRef]
- Liu, C.; Yang, T.; Li, P.; Feng, D.; Huo, H. Origin mechanism of overpressure in saline lacustrine formation of the Paleogene and Neogene in the Western Qaidam Basin, NW China. Carbonates Evaporites 2024, 39, 2. [Google Scholar] [CrossRef]
- Li, C.; Zhan, L.; Lu, H. Mechanisms for Overpressure Development in Marine Sediments. J. Mar. Sci. Eng. 2022, 10, 490. [Google Scholar] [CrossRef]
- Xu, Y.; Yang, J.; Hu, Z.; Zhao, Q.; Li, L.; Yin, Q. Causes of Multi-Mechanism Abnormal Formation Pressure in Offshore Oil and Gas Wells. Appl. Sci. 2024, 14, 10149. [Google Scholar] [CrossRef]
- Liu, Q.; Shi, J.; Shen, Y.; Liang, X.; Jin, Z.; Li, P.; Zhang, X.; Zhu, D.; Meng, Q.; Xu, H.; et al. Volcanics-driven episodic events enhancing organic carbon accumulation in black shale during the Middle Eocene. Geochim. Cosmochim. Acta 2026, 413, 233–240. [Google Scholar] [CrossRef]
- Shi, J.; Jin, Z.; Liu, Q.; Zhang, T.; Fan, T.; Gao, Z. Laminar Characteristics of Lacustrine Organic-Rich Shales and Their Significance for Shale Reservoir Formation: A Case Study of the Paleogene Shales in the Dongying Sag, Bohai Bay Basin, China. J. Asian Earth Sci. 2022, 223, 104976. [Google Scholar] [CrossRef]
- Hua, Y.; Guo, X.; Tao, Z.; He, S.; Dong, T.; Han, Y.; Yang, R. Mechanisms for overpressure generation in the bonan sag of Zhanhua depression, Bohai Bay Basin, China. Mar. Pet. Geol. 2021, 128, 105032. [Google Scholar] [CrossRef]
- Radwan, A.E. A multi-proxy approach to detect the pore pressure and the origin of overpressure in sedimentary basins: An example from the Gulf of Suez rift basin. Front. Earth Sci. 2022, 10, 967201. [Google Scholar] [CrossRef]
- Zhang, J.; Zheng, H.; Wang, G.; Liu, Z.; Qi, Y.; Huang, Z.; Fan, X. In-situ stresses, abnormal pore pressures and their impacts on the Triassic Xujiahe reservoirs in tectonically active western Sichuan basin. Mar. Pet. Geol. 2020, 122, 104708. [Google Scholar] [CrossRef]
- Li, J.; Zhao, J.; Hou, Z.; Zhang, S.; Chen, M. Origins of overpressure in the central Xihu depression of the East China Sea shelf basin. AAPG Bull. 2021, 105, 1627–1659. [Google Scholar] [CrossRef]
- Xiong, T.; Cheng, L.; Guo, D.; Guan, L.; Jiang, Q.; Zhangming, H.; Yin, S.; Chen, G. Overpressure characteristics and geological origin of the paleogene in Baiyun Sag, Pearl River Mouth Basin. Front. Earth Sci. 2023, 11, 1118443. [Google Scholar] [CrossRef]
- Hu, L.; Luo, W.; Ma, B. Diagenetic Impact on High-Pressure High-Temperature Reservoirs in Deep-Water Submarine Fan Sandstone of Qiongdongnan Basin, South China Sea. Minerals 2024, 14, 361. [Google Scholar] [CrossRef]
- Zhang, Y.; Lv, D.; Wang, Y.; Liu, H.; Song, G.; Gao, J. Geological characteristics and abnormal pore pressure prediction in shale oil formations of the Dongying depression, China. Energy Sci. Eng. 2020, 8, 1962–1979. [Google Scholar] [CrossRef]
- Li, J.; Zhao, J.; Wei, X.; Chen, M.; Song, P.; Han, Z.; Wu, W. Origin of abnormal pressure in the Upper Paleozoic shale of the Ordos Basin, China. Mar. Pet. Geol. 2019, 110, 162–177. [Google Scholar] [CrossRef]
- Wang, Q.; Chen, D.; Wang, F.; Gao, X.; Zou, Y.; Tian, Z.; Li, S.; Chang, S.; Yao, D. Origin and distribution of an under-pressured tight sandstone reservoir: The Shaximiao Formation, Central Sichuan Basin. Mar. Pet. Geol. 2021, 132, 105208. [Google Scholar] [CrossRef]
- Tremosa, J.; Gaucher, E.C.; Gailhanou, H. Overpressure generation by smectite dehydration in sedimentary basins constrained by salinity dilution and stable isotopes. Appl. Geochem. 2021, 131, 105035. [Google Scholar] [CrossRef]
- Zhang, J.; Zong, Z.; Luo, K. Estimation of pore pressure considering hydrocarbon generation pressurization using Bayesian inversion. Interpretation 2023, 11, T393–T405. [Google Scholar] [CrossRef]
- Shi, L.; Jin, Z.; Zhu, X.E.; Lin, M.; Guan, B. Generation mechanism of overpressures caused by disequilibrium compaction in the northwestern Bozhong subbasin, China. J. Pet. Explor. Prod. Technol. 2024, 14, 1843–1857. [Google Scholar] [CrossRef]
- Zhao, Z.; Zhao, J.; Zhao, H.; Wang, J.; Er, C.; Wang, S.; Li, Z. Re-evaluation of the genetic mechanism of overpressure: Western slope zone of the Xihu Depression, East China Sea Shelf Basin. Mar. Pet. Geol. 2024, 160, 106599. [Google Scholar] [CrossRef]
- Obradors-Prats, J.; Rouainia, M.; Aplin, A.C.; Crook, A.J.L. A diagenesis model for geomechanical simulations: Formulation and implications for pore pressure and development of geological structures. J. Geophys. Res. Solid. Earth 2019, 124, 4452–4472. [Google Scholar] [CrossRef]
- Tremosa, J.; Gailhanou, H.; Chiaberge, C.; Castilla, R.; Gaucher, E.C.; Lassin, A.; Gout, C.; Fialips, C.; Claret, F. Effects of smectite dehydration and illitisation on overpressures in sedimentary basins: A coupled chemical and thermo-hydro-mechanical modelling approach. Mar. Pet. Geol. 2020, 111, 166–178. [Google Scholar] [CrossRef]
- Shi, Y.; Wang, C. Pore pressure generation in sedimentary basins: Overloading versus aquathermal. J. Geophys. Res. Solid Earth 1986, 91, 2153–2162. [Google Scholar] [CrossRef]
- Silva, D.A.V.; Ordaz, M.G.; Carrillo, Z.H.C. Assessment of causes of overpressure different from sub-compaction: Application in unconventional reservoir. CTF-Cienc. Tecnol. Futuro 2019, 9, 5–14. [Google Scholar] [CrossRef]
- Xu, Z.; Liu, Z.; Zhao, J.; He, Y.; Ma, X.; Li, J.; Zhao, Z. Introducing Novel Correction Methods to Calculate Sedimentary Basin Overpressure and Its Application in Predicting Pressure Value and Origin. Energies 2023, 16, 5416. [Google Scholar] [CrossRef]
- Skempton, A.W. Effective stress in soils, concrete and rocks. In Selected Papers on Soil Mechanics, Proceedings of Pore Pressure and Suction in Soils, London, UK, 30–31 March 1960; Emerald Publishing Limited: Bingley, UK, 1961. [Google Scholar] [CrossRef]
- Fjaer, E.; Holt, R.M.; Horsrud, P.; Raaen, A.M.; Risnes, R. Petroleum Related Rock Mechanics, 2nd ed.; Elsevier: Amsterdam, The Netherlands, 2008; 35p. [Google Scholar]
- Biot, M.A. General theory of three-dimensional consolidation. J. Appl. Phys. 1941, 12, 155–164. [Google Scholar] [CrossRef]
- Agar, J.G.; Morgenstern, N.R.; Scott, J.D. Thermal expansion and pore pressure generation in oil sands. Can. Geotech. J. 1986, 23, 327–333. [Google Scholar] [CrossRef]
- Bredehoeft, J.D.; Hanshaw, B.B. On the maintenance of anomalous fluid pressures: I. Thick sedimentary sequences. Geol. Soc. Am. Bull. 1968, 79, 1097–1106. [Google Scholar] [CrossRef]
- Lewis, C.R.; Rose, S.C. Atheory relating high temperatures and overpressures. J. Pet. Technol. 1970, 22, 11–16. [Google Scholar] [CrossRef]
- Smith, J.E. Shale compaction. Soc. Pet. Eng. J. 1973, 13, 12–22. [Google Scholar] [CrossRef]
- Tortike, W.S.; Farouq Ali, S.M. Reservoir simulation integrated with geomechanics. J. Can. Pet. Technol. 1993, 32, 28–37. [Google Scholar] [CrossRef]
- Dickinson, G. Geological aspects of abnormal reservoir pressures in Gulf Coast Louisiana. AAPG Bull. 1953, 37, 410–432. [Google Scholar] [CrossRef]
- Hoholick, J.D.; Metarko, T.; Potter, P.E. Regional variations of porosity and cement: St. Peter and Mount Simon sandstones in Illinois Basin. AAPG Bull. 1984, 68, 753–764. [Google Scholar] [CrossRef]
- Gao, Y.; Chen, M.; Lin, B.; Jin, Y. An analytical model of hydraulic dilation area for Karamay oil sand reservoir under water injection in SAGD wells. J. Pet. Sci. Eng. 2019, 179, 1090–1101. [Google Scholar] [CrossRef]
- Khalaf, M.S. A comprehensive thermo-hydro-mechanical framework for enhanced geothermal systems: Thermal stimulation, energy recovery, and natural fracture activation. Unconv. Resour. 2026, 9, 100281. [Google Scholar] [CrossRef]
Disclaimer/Publisher’s Note: The statements, opinions and data contained in all publications are solely those of the individual author(s) and contributor(s) and not of MDPI and/or the editor(s). MDPI and/or the editor(s) disclaim responsibility for any injury to people or property resulting from any ideas, methods, instructions or products referred to in the content. |
© 2026 by the authors. Licensee MDPI, Basel, Switzerland. This article is an open access article distributed under the terms and conditions of the Creative Commons Attribution (CC BY) license.