Abstract
Bottom-water coning is a core challenge in the development of high-temperature, high-pressure, high-permeability, and fractured bottom water reservoirs. Taking the Carboniferous reservoir in Xinjiang as the research object, this work uses numerical simulation to optimize key parameters of artificial barriers, water drainage, and nitrogen injection technologies. The results show that an artificial barrier with a 30-m radius and intervention at 60% water cut placed at the reservoir top reduces water coning height by over 40%; water drainage starting after the third production year delays water cut rise by more than 2000 days; and nitrogen injection in the eighth production year at 65 MPa cuts water coning height by 30% to 40%. This work proposes a full-life-cycle phased synergy strategy, integrating early artificial barrier water blocking, mid-term intelligent water drainage pressure reduction, and late nitrogen injection oil stabilization. This work provides a direct and feasible technical paradigm for the efficient development of similar high-temperature, high-pressure, and fractured bottom water reservoirs worldwide.
1. Introduction
In the development of bottom-water reservoirs, bottom-water coning is a critical issue that leads to a sharp increase in water cut and a significant reduction in ultimate oil recovery [1,2]. This challenge is particularly prominent in the Carboniferous reservoirs of the Junggar Basin, Xinjiang, which are characterized by high temperatures, high pressure, and complex geological features, including developed high-angle structural fractures and high vertical permeability (0.41–4.56 mD) [3,4]. As noted by Shi, reservoir analysis indicates that bottom water invades rapidly along these high-permeability fractures, causing an annual water cut increase of 5–8% and resulting in oil recovery rates that are 10–15% lower than expected [5]. Therefore, effectively suppressing coning to extend the stable production period has become a global challenge for such tight reservoirs. Lee P et al. found that, in bottom-water reservoirs, the oil–water density difference and seepage heterogeneity act synergistically [6,7,8,9,10]. This easily forms preferential channels for bottom-water coning and intensifies development contradictions. How to effectively suppress bottom-water coning and extend the stable production period of oil wells has become a common challenge. This challenge exists in the development of tight reservoirs worldwide.
To address this problem, various single-technology solutions have been proposed. Tan et al. utilized artificial barrier technology, injecting high-strength gel to construct a physical barrier at the bottom of the oil reservoir to block rising water [11,12]. Kai Wang et al. proposed a mathematical method [13,14,15]. This method establishes a microtubule model and a physical model of threshold pressure. They found that different water cut stages, fluidity, depth of oil–water interface (DOWI), and liquid production intensity have obvious effects on water coning behavior. Mjaavatten et al. [16,17] constructed a fracture network model. They quantified the influence of parameters such as permeability ratio and interlayer position on coning rate. Zhang et al. [13,18,19] used numerical simulation and physical experiments. They deeply analyzed the coning mechanism and proposed a quantitative model. This model can describe the relationship between critical production rate and water coning formation. In field applications, one limitation of channel blockage is the short effective time. Liu et al. confirmed through experiments that gas injection coning control technology easily causes gas channeling in low-viscosity reservoirs [20,21]. Zheng et al. emphasized that numerical simulation can predict water coning dynamics [22,23,24,25].
First proposed by Wojtanowicz et al., this method uses a dual-completion setup: one interval above the oil–water contact (OWC) for oil production and another below for water drainage [26]. It achieves hydrodynamic pressure balance and suppresses water coning accordingly. Subsequent studies confirmed that DWS could significantly enhance oil recovery compared to conventional completions by reversing the coning tendency [27]. Recent advancements have focused on optimizing DWS designs; for instance, Zeynolabedini and Assareh utilized genetic algorithms to optimize drainage rates and completion lengths, thereby maximizing Net Present Value (NPV) [28]. Furthermore, the integration of gas injection with DWS, known as Gas-Downhole Water Sink-Assisted Gravity Drainage (GDWS-AGD), has been proven to improve sweep efficiency and reduce water cresting in heterogeneous reservoirs with strong aquifers [1,29].
Despite these advancements, a significant knowledge gap remains. Existing studies typically focus on optimizing a single technology—either barriers, DWS, or gas injection—in isolation. However, numerical simulations and field data suggest that a single water control technology cannot meet the changing needs of a reservoir’s full life cycle. For instance, barriers may fail in late stages due to bypass, while early drainage may be energy inefficient. There is a lack of systematic research on how to synergistically combine these methods. To fill this gap, this study proposes a phased synergy strategy for Carboniferous reservoirs. Unlike previous works, we integrate early-stage artificial barriers, mid-term intelligent water drainage, and late-stage nitrogen injection into a cohesive life-cycle control plan. This study quantifies the synergistic effects of these methods, providing a robust technical paradigm for high-temperature, high-pressure fractured reservoirs.
2. Model Development and Methodology
2.1. Geological Overview
The Carboniferous reservoir in the central Junggar Basin is characterized by high heterogeneity and complex structural features that directly influence fluid flow. A group of NW–SE trending faults have developed in the area, with high-angle structural fractures being prevalent; notably, the fracture density is significantly higher in zones adjacent to faults compared to the matrix regions. This extensive fracture network creates a strong permeability contrast, resulting in a high vertical permeability ranging from 0.41 to 4.56 mD, which facilitates bottom water coning. Additionally, the vertical thickness of the oil-bearing layers varies from 6 to 105 m, with an average thickness of 23.1 m.
2.2. Fundamentals of the Model
To clearly illustrate the research methodology, the simulation workflow is summarized in Figure 1. The process begins with preprocessing and model construction, where the geological model is defined based on Carboniferous strata characteristics, and key parameters (porosity, permeability) are initialized. The IMPES algorithm is then employed to solve the coupled pressure–saturation equations. Subsequently, the study simulates three distinct development frameworks: artificial flow barriers, water drainage, and nitrogen injection. Finally, the results are analyzed and compared to determine the optimal water coning control strategy.
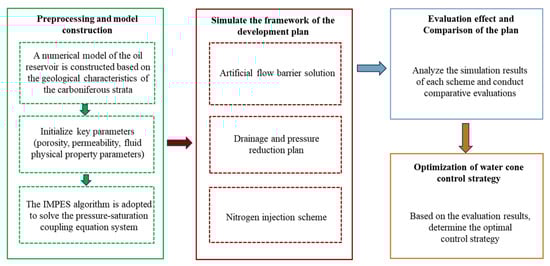
Figure 1.
Workflow of the numerical simulation and optimization process.
The core feature of the model is the reduction of computational complexity by simplifying fluid-phase relationships while preserving engineering accuracy. The evolution of the phase field is described by a set of coupled partial differential equations (PDEs), typically derived from fundamental principles of fluid mechanics. These equations primarily consist of mass conservation equations for the oil and water phases, coupled with Darcy’s law to characterize multiphase flow behavior. The governing equations are expressed as follows.
① Darcy’s law is as follows:
where k represents the absolute permeability, krα represents the relative permeability, is the gradient operator, μα represents the fluid viscosity, ρα represents the fluid density, pα represents the phase pressure, g is the acceleration due to gravity, and z is the depth. The forms of Darcy’s law for the gas phase and the water phase are similar; only the corresponding parameters need to be replaced. Equation (1) describes the flow velocity of a fluid in a porous medium driven by a pressure gradient; this governing equation mathematically describes the dynamic flow behavior of oil and water within the porous rock, serving as the core foundation for the numerical simulation.
② The mass conservation equation is below:
Equation (2) is the mass conservation equation for oil and water, respectively, where Φ presents porosity and S represents the saturation of each phase.
③ The boundary condition control equations are the following:
where pcow represents the oil–water capillary pressure.
The Chaperon equation was employed to calculate the critical production rate of vertical wells for assessing water coning risk.
where γω denotes the specific gravity of water and γο denotes the specific gravity of oil; h represents the thickness of the oil layer; z denotes the thickness of the perforated interval; Re stands for the drainage radius; and Rω denotes the wellbore radius. The numerical solution is obtained using the Implicit Pressure Explicit Saturation (IMPES) algorithm. For pressure–velocity coupling, the Pimple algorithm is employed. The capillary pressure curve is characterized by Leverett’s J-function, which quantifies gravitational segregation and viscosity effects. This equation helps determine the ‘critical production rate’: the maximum safe speed at which oil can be extracted without drawing up bottom water. It serves as a key benchmark for judging the risk of water coning.
2.3. Geological Model Construction
Figure 2 shows the construction of the 3D numerical model. The simulation domain was discretized using an 80 × 80 × 50 grid system. A horizontal grid spacing of 6 m × 6 m was adopted to adequately capture inter-well interference and planar fluid-flow patterns, while the vertical grid thickness was set to 0.9 m, yielding a total reservoir thickness of 45 m. Layer subdivision enhanced the model’s capability to resolve reservoir heterogeneity and more accurately characterize the development of bottom-water coning. Ten types of grids were constructed, and the simulation results based on the type of grid were analyzed. An error analysis is presented in Figure 2c. The selected grid configuration ensured that the simulation errors in saturation were less than 3%. The calculation time step was one month.
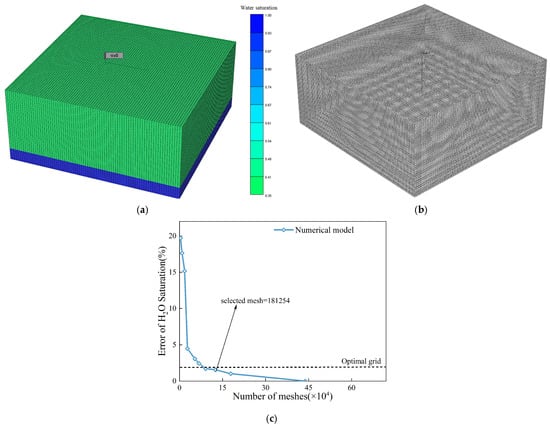
Figure 2.
Establishment of a 3D model. (a) Geometric model, (b) Mesh generation, (c) Grid independence verification.
2.4. Boundary Conditions and Simulation Parameters
Artificial barrier technology forms a seepage barrier around the wellbore to regulate reservoir pressure distribution and control the direction of fluid flow, with the main objective of suppressing bottom-water coning. In this study, numerical simulation was applied to evaluate the influence of artificial barriers on water coning shape, streamline distribution, and water cut during single-well production. To ensure the simulation accurately reflected the actual reservoir characteristics, the key physical parameters were initialized based on actual field production data and geological reports from the Carboniferous reservoir in the Xinjiang Oilfield, consistent with the geological features described in the literature [1,5]. These parameters represent the typical high-temperature and high-pressure conditions of the target block. The reservoir conditions were set as follows: crude oil viscosity of 50 MPa·s, crude oil density at surface conditions of 0.93 g/cm3, and a vertical-to-horizontal permeability ratio of 0.2. The aquifer multiple was set to 5, and the oil production rate was maintained at 200 m3/d. The perforation interval corresponded to oil layers 1–6, with an opening degree of 50%. An artificial barrier with a radius of 20 m was constructed at the 8th layer near the bottom of the well. The development performances with and without the artificial barrier were compared under the condition when the water cut reaches 90% (Table 1).

Table 1.
Parameters of horizontal well model.
3. Results and Discussion
Before analyzing the specific results, the simulation workflow is briefly outlined as follows: First, we evaluate the individual performance of the artificial flow barrier technology. Second, we assess the effectiveness of water drainage and nitrogen injection techniques. Finally, based on these findings, we propose and verify a comprehensive phased synergy strategy to achieve optimal water coning control throughout the reservoir’s life cycle.
3.1. Technology of Artificial Flow Barriers
Figure 3 illustrates the suppression mechanism where the artificial barrier physically obstructs vertical bottom water migration. Comparisons of the oil–water distribution (Figure 3a vs. Figure 3b) show that the barrier significantly flattened the water cone. As indicated by the streamlines (Figure 3c,d), the barrier diverted flow away from the high-permeability zone, which directly delayed the water breakthrough time as shown in Figure 3e.
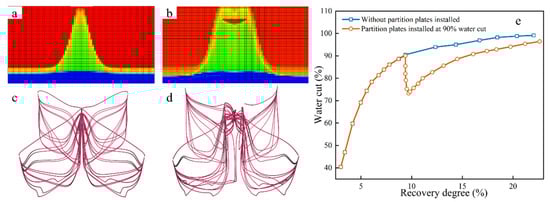
Figure 3.
Comparison of the effect of partition plate operation on water coning formation during reservoir development, (a) Oil–water distribution in reservoir without partition plate (red represents the oil phase, and blue represents the water phase), (b) Oil–water distribution in reservoir with partition plate, (c) Fluid streamline distribution in reservoir without partition plate, (d) Fluid streamline distribution in reservoir with partition plate, (e) Water cut comparison curve under different reservoir development degrees.
The simulation results in Figure 3a,b show that the artificial barrier effectively suppressed bottom-water coning. Without the barrier, bottom water moved quickly along high-permeability zones and broke through at the well bottom early. After the barrier was installed, the water cone height was reduced, the water flow became more uniform, and the water cut rose more slowly. As a result, the cumulative oil production increased. The streamline results in Figure 3c,d further confirm this effect. The barrier diverted water flow away from high-permeability areas and increased the sweep in low-permeability zones. This verifies the suppression mechanism from the flow–field perspective. In addition, Figure 3e shows the importance of installation timing. When the water cut reached 90%, adding the barrier still slowed down the water cut increase. This helped control the formation and further development of water coning and provides guidance for field application.
The placement depth of the barrier significantly influenced development performance, as shown in Figure 4 and Figure 5. Simulation results indicate that a barrier placed at the oil–water interface (0 m) effectively covered the coning tip, whereas a deeper placement (e.g., 60 m) allowed water to bypass the barrier. Consequently, the 0 m placement yielded the optimal control effect, maximizing cumulative oil production and extending the stable production period, while deeper placements failed to suppress coning effectively.
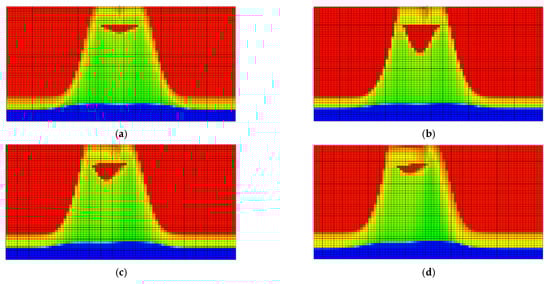
Figure 4.
Water cone morphology at different interlayer sizes (red colors represent the oil phase, and blue colors represent the water phase). (a) 0 m, (b) 20 m, (c) 40 m, (d) 60 m.
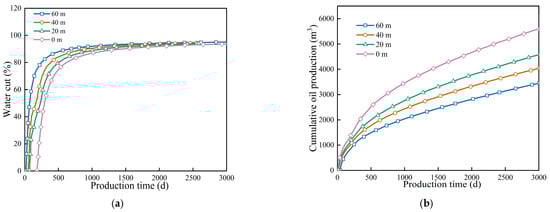
Figure 5.
Diagram of the influence of different separator positions on moisture content and cumulative oil production. (a) Water cut, (b) Cumulative oil production.
Analysis of the water-cut profiles and cumulative oil production in Figure 4 shows that the barrier placement depth had a significant impact on reservoir flow and production. Barriers positioned at the reservoir top effectively suppressed bottom-water coning. They also delayed the water-cut increase by 2.8 years compared to the baseline. In contrast, barriers at lower depths, such as 60 m, had weaker coning control. This resulted in faster water-cut rise (>0.3%/d) and a 23% reduction in ultimate oil recovery.
Figure 5 shows the influence of different barrier positions on water cut and cumulative oil production. Cumulative production was highest when the barrier is placed at 0 m. This was especially true in the late stage of a long production cycle, where the curve rose more steeply. This indicates that a 0 m barrier regulated the fluid seepage field more effectively. It expanded the production area of remaining oil and improved sweep efficiency in low-permeability zones. At the same time, it reduced preferential flow in high-permeability channels, enhancing overall oil displacement efficiency. When the barrier was placed at 60 m, it did not effectively cover the top of the water cone. Bottom water quickly bypassed the bottom-hole pressure constraints in high-permeability zones. As a result, cumulative oil production was much lower than in the 0 m scenario. The analysis of water control at different layers showed that higher barrier placement improved the suppression of bottom-water coning. It blocked upward water flow, slowed the rise of water cut, extended the high-production period, and increased oil recovery. Lowering the barrier to 20 or 40 m reduced water control effectiveness. At 60 m, bottom-water control failed, water cut rose rapidly, and oil production was seriously affected. Therefore, the placement depth of the barrier directly determines both the water control effect and the final oil recovery.
Regarding intervention timing, Figure 6 and Figure 7 compare the effects of installing the barrier at water cuts of 60%, 80%, and 85%. The curves show that early intervention (60%) stabilized the water cut rise immediately, whereas late intervention (85%) occurred after the formation of substantial water channels. Therefore, the optimal timing is at the medium water cut stage (60%); delayed intervention significantly diminished the barrier’s effectiveness, as the bottom-water energy had already broken through. Figure 6 clearly shows that the intervention timing of artificial barriers is critical. Its importance lies in suppressing bottom-water coning. Simulation results indicate that applying the barrier at 60% water cut produced the best effect. At this timing, the barrier effectively altered the oil–water flow at the bottom hole. It also blocked preferential seepage channels and delayed the increase of water cut. When intervention was delayed to 80% or 85% water cut, the water control effect decreased significantly. At 85% water cut, the barrier had little impact on development.
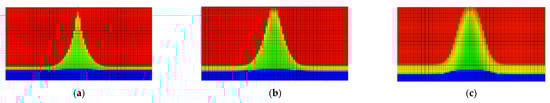
Figure 6.
Water cone situation at different moisture content (red colors represent the oil phase, and blue colors represent the water phase). (a) Water cut of 60%, (b) Water cut of 80%, (c) Water cut of 85%.
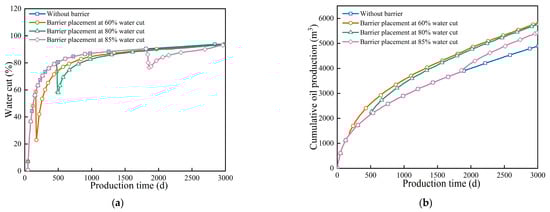
Figure 7.
Comparison curves of moisture content and recovery degree at different timing of separators. (a) Water cut, (b) Cumulative oil production.
Figure 7 compares water cut and recovery for different intervention timings. When applied at 60% water cut, low water cut production was maintained for a longer period. The cumulative oil production was significantly higher than for other timings. Intervention at 80% water cut still provided some control, but the oil increase was limited. At 85% water cut, the barrier was almost ineffective because bottom water had already achieved large-scale breakthrough. Cumulative oil production was then close to the case without a barrier. These results show that barrier timing directly affects reservoir recovery. The optimal timing is around 60% water cut. At this stage, the barrier blocks early water-coning development and maximizes oil displacement efficiency. Delayed intervention allows water to reach the bottom-hole area, reducing the barrier’s effectiveness and limiting its impact on reservoir development.
Figure 8 presents the sensitivity analysis of the barrier radius (15–30 m). The water cut curves demonstrate that the suppression capacity increased with the barrier radius. Specifically, a larger radius (30 m) provided a broader shielding area that promoted uniform water advancement, resulting in the lowest water cut rise rate and the highest ultimate oil recovery. In contrast, a 15 m radius barrier provided weak water control. Water cut rose rapidly, and production performance was much lower. A larger-radius barrier not only achieves higher ultimate oil recovery, but also maintains a more stable production rate in the late development stage. From a seepage perspective, a larger barrier radius increases the area of bottom water control. It promotes uniform water advancement and inhibits preferential flow channels. Essentially, it disperses fluid pressure more evenly, avoiding localized bottom water breakthroughs. A smaller-radius barrier has limited coverage. It cannot effectively restrict bottom-water coning, leading to rapid breakthroughs in high-permeability zones. This causes early well water flooding and reduces the recovery of remaining oil. Experimental data indicated that the 30 m radius barrier performed best. It prolonged the low water cut production period and improved final oil recovery. Therefore, using a larger barrier radius is an effective strategy when engineering conditions allow. It enhances both water control and oil recovery in bottom-water reservoirs.
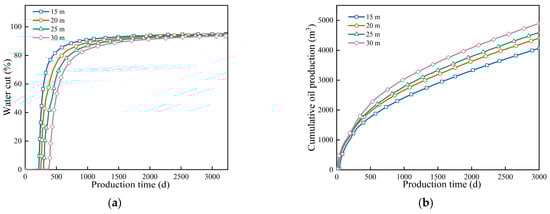
Figure 8.
Comparison curve of different partition radii, water content, and cumulative oil production changes. (a) Water cut, (b) Cumulative oil production.
3.2. Technology of Water Drainage and Nitrogen Injection
3.2.1. Water Drainage
Figure 9 illustrates the evolution of water coning morphology during water drainage oil recovery. Before water drainage, the water cone exhibited an inverted trumpet shape. Once water drainage began, the water cone moved downward as a whole, and its shape gradually transformed into an inverted triangle. The sides of the water cone changed from curved surfaces to flatter surfaces. This suppressed the preferential flow of bottom water in high-permeability channels. After water drainage ended, the water cone disappeared completely. This improved the bottom-hole pressure distribution and enhanced oil displacement efficiency. The water drainage oil recovery technology promoted balanced production across the reservoir and extended the high-production period of wells.
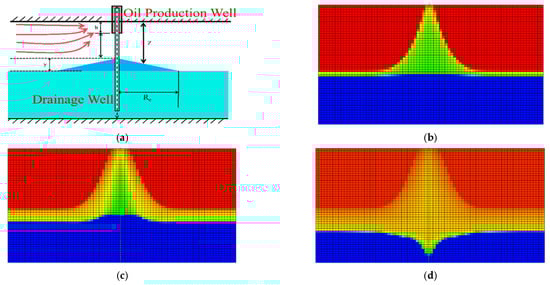
Figure 9.
Morphology of the water cone after drainage and oil recovery (red colors represent the oil phase, and blue colors represent the water phase). (a) Schematic diagram of drainage oil recovery. (b) Bottom water coning (without drainage). (c) Commencement of drainage. (d) After drainage.
Figure 10 investigates the impact of drainage timing. The results identified the third year as the optimal intervention point. From a reservoir behavior perspective, this timing represents the critical window between cone initiation and irreversible breakthrough. Before the third year (e.g., Year 1), the water cone was not fully formed, so drainage merely depleted aquifer energy without targeting the cone. Conversely, delaying intervention beyond this point would pose the risk of establishing high-conductivity water channels. Once massive water breakthrough occurs, the oil–water mobility ratio worsens, making the cone structure rigid and difficult to reverse even with active drainage. Therefore, initiating drainage at the third year effectively intercepted the cone at its peak manageable state, maximizing sweep efficiency before the formation of dominant water pathways. This finding aligns with previous field studies [12], which demonstrated the efficacy of drainage in reducing water cut. However, our simulation further refines the strategy by pinpointing the third year as the critical operational window, avoiding the limited benefits of premature intervention observed in earlier trials.
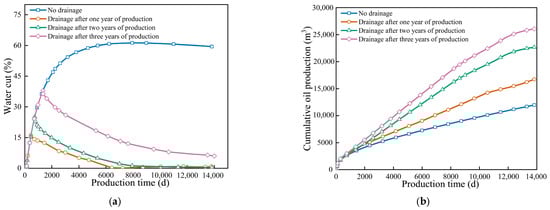
Figure 10.
Comparison curves of cumulative oil production and moisture content at different water production times. (a) Water cut, (b) Cumulative oil production.
3.2.2. Nitrogen Injection
As shown in Figure 11, the water cone morphology after gas injection improved significantly. The gas curtain barrier formed by nitrogen injection effectively suppressed bottom-water coning in high-permeability zones. Compared to the non-injection state, the water cone front advanced more slowly, and its shape became gentler. This improvement results from nitrogen’s physical property of low density and its low oil solubility. Nitrogen accumulates at the oil–water contact under buoyancy, forming a continuous gas curtain barrier. This reduces the upward force of bottom water and delays water cone development toward the bottom hole. From a seepage perspective, the gas curtain barrier changes the reservoir pressure distribution. When gas injection pressure and bottom water thrust reach dynamic balance, the water cone front expands stably. This prevents preferential bottom-water breakthroughs in high-permeability channels. Numerical simulations indicate that gas injection in high-permeability zones enhanced the barrier’s control over water cone morphology. It redistributed oil–water seepage paths, improved the development of low-permeability zones, and displaced the remaining oil in pores toward production wells. This increases overall oil recovery. The optimization of gas injection parameters shows that matching the injection rate, position, and pressure maximized the barrier’s effectiveness. At this point, the water cone front advanced uniformly, extending the well’s low water cut production period.
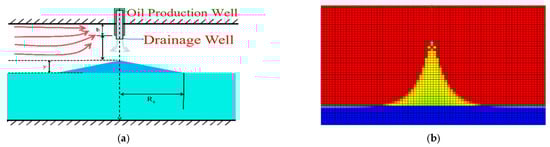
Figure 11.
The shape of the water cone after vapor injection (red colors represent the oil phase, and blue colors represent the water phase). (a) Schematic diagram of gas injection. (b) Bottom-water coning (without steam injection). (c) Start of gas injection. (d) After gas injection.
The oil production curve in Figure 12 shows that nitrogen injection timing significantly affected reservoir development effect. Cumulative oil production peaked when nitrogen was injected after 8 years of production. This is much higher than at other injection timings. The reason is that, at this stage, the water cone reached the optimal intervention point. Injected nitrogen forms a stable gas curtain barrier at the oil–water contact. This barrier reduces the impact of the water cone and improves production in low-permeability zones through displacement. Injecting nitrogen too early, such as at 4 years, cannot form an effective gas curtain barrier because the water cone had not fully developed. Consequently, water control was weak. Injection after 6 years performed better than after 4 years, but it was still less effective than the 8-year scheme. The water cut curve shows that the 8-year injection provided the best water control. Water cut rose gently with small fluctuations. Nitrogen injection reconstructed the reservoir pressure field and promoted the uniform advancement of the water cone front. In contrast, without gas injection, water cut rose sharply, seriously reducing development performance. Experimental data confirm that the 8th year of production is the optimal timing for nitrogen injection. At this time, the water cone and gas curtain formation were well matched. The barrier efficiently controlled water and displaced the remaining oil, achieving a synergistic optimization of water control and oil production. These results support the visualization experiments [24], confirming that a stable gas curtain can physically suppress bottom water. Furthermore, our identified optimal timing (8th year) effectively mitigated the risk of gas channeling in low-viscosity reservoirs previously, ensuring the barrier remained stable under high pressure [25].
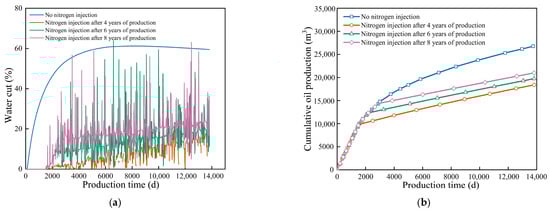
Figure 12.
Comparison curves of cumulative oil production and moisture content at different gas injection times. (a) Water cut, (b) Cumulative oil production.
3.3. Technology of Phased Synergy Strategy
Based on the optimization results of the individual technologies, we propose a comprehensive phased synergy strategy to manage the full life cycle of the reservoir. This strategy addresses specific challenges at different development stages through three distinct phases. In the first phase, or the early stage, an artificial barrier with a radius of 30 m is deployed when the water cut reaches 60% to physically block the initial upward migration of bottom water, thereby preventing early-stage water breakthrough. Subsequently, the second phase involves the implementation of water drainage after the third year of production to reduce bottom-hole pressure, which effectively suppresses the rising trend of the water cone. Finally, in the third phase during the late stage, nitrogen injection is applied at the eighth year to form a gas curtain, stabilizing the water front and maximizing the displacement of remaining oil under high-water cut conditions.
Figure 13 shows the dynamic evolution of water saturation during multi-well collaborative development. Water saturation changed over production time, ranging from 0.0310 in the early stage to 0.9999 in the ultra-high-water cut stage. From a reservoir engineering perspective, this curve reflects heterogeneous displacement characteristics typical of oil–water two-phase flow during water flooding. In the early stage (0.0310–0.2000), water saturation increased slowly. This indicates that edge and bottom water had not yet formed preferential flow channels and that the well group was in a high-efficiency oil production stage. In the middle stage (0.4000–0.6000), water saturation rose rapidly. This was caused by the continuous production pressure difference and inter-well interference. It indicates that water coning began to form and started to affect well performance. In the late stage (0.8000–0.9999), water saturation surged to nearly 1.0. The reservoir entered the ultra-high-water cut stage, during which water-phase preferential flow channels are fully developed, and oil wells face the risk of water channeling or even water flooding.
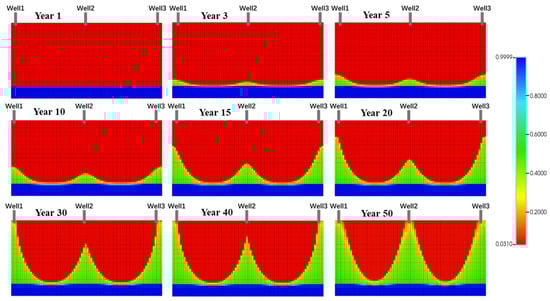
Figure 13.
Multi-well collaborative production of water cone morphology in different time periods.
As shown in Figure 14, a periodic regulation strategy was applied to Well 1 and Well 3. Shutdown was performed in the 15th year of development, followed by restart in the 40th year. This strategy achieved the multi-dimensional optimization of reservoir performance. Engineering monitoring indicated that shutdown increased regional formation pressure by 2.3 MPa. It also effectively reshaped the water flooding front. During the restart stage, when water saturation reached 0.9999, the response showed two phases. In the early phase, daily oil production briefly increased by 15% for about 60 days, demonstrating the recovery of trapped remaining oil. In the later phase, water cut rose sharply at an average rate of 1.2% per month, marking the reservoir’s transition to a high-water cut stage. At the microscopic scale, the periodic regulation changed pore-scale oil-water seepage paths. At the macroscopic scale, it reconstructed inter-well interference patterns. This approach extended the economic production cycle and improved final oil recovery by 3–5% through the activation of new seepage channels.
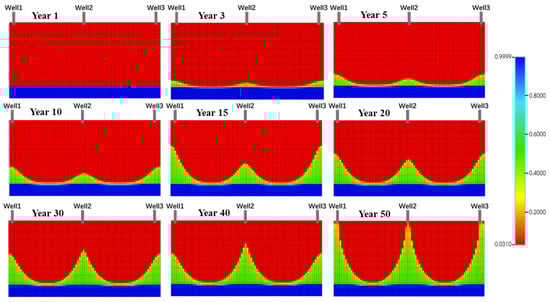
Figure 14.
After the regulation, multiple wells synergistically produced water cone shapes in different time periods.
4. Conclusions
To address the core challenges in bottom-water reservoir development—rapid water cut rise and reduced oil recovery caused by bottom-water coning—this study focused on Carboniferous reservoirs. Experimental simulations were conducted to evaluate artificial barrier, water drainage oil recovery, and nitrogen injection technologies. The effects of key parameters on coning control were analyzed, and a staged prevention and control plan was developed:
(1) The artificial barrier achieves the optimal coning suppression effect when placed at the top of the reservoir at 0 m depth with a large radius of 30 m and implemented when the water cut reaches 60%, which effectively blocks the vertical migration path and flattens the water cone.
(2) Water drainage oil recovery performs best when initiated after the third year of production, as this timing targets the critical window of cone development to intercept upward momentum, reduce bottom-hole pressure, and extend the stable production period.
(3) Nitrogen injection applied at the late stage in the eighth year effectively forms a stable gas curtain that counteracts bottom-water energy and enhances the displacement of remaining oil in low-permeability zones under high-water cut conditions.
(4) The proposed phased synergy strategy combining early physical blocking, mid-term pressure reduction via drainage, and late-stage gas curtain stabilization systematically decreases the water invasion velocity and improves ultimate oil recovery, providing a practical technical paradigm for similar reservoirs.
Author Contributions
Data curation & Formal analysis: Y.Z.; Funding acquisition: Y.Z.; Investigation: X.S.; Writing—review & editing: L.Y.; Conceptualization: N.X.; Methodology: J.Z.; Supervision; Validation: J.Z.; Resources: Y.Z.; Project administration: N.X.; Writing—original draft: L.Y. All authors have read and agreed to the published version of the manuscript.
Funding
This research received no external funding.
Data Availability Statement
The original contributions presented in this study are included in the article. Further inquiries can be directed to the corresponding author.
Conflicts of Interest
Authors Yuankai Zhang and Ning Xu were employed by the Research Institute of Exploration and Development, Xinjiang Oilfield Company, Petro China. Author Junke Zhang was employed by the Science and Technology Research Institute Co., Ltd. of Karamay & CUP & Joint Oil and Gas. The remaining authors declare that the research was conducted in the absence of any commercial or financial relationships that could be construed as a potential conflict of interest.
References
- Zhang, L.; Bai, Y.; Li, M.Y.; Wang, T.; Ma, Y.S.; Yang, Y.Z. Structural patterns and influencing factors of the upper wall of the nappe in the Karamay-Wuerhe fault zone, northwestern Junggar Basin. Geol. Bull. China 2024, 43, 802–811. [Google Scholar] [CrossRef]
- Dong, L.L.; Zhang, Y.L. Analysis and experimental study on resistance-increasing behavior of composite high efficiency autonomous inflow control device. Pet. Sci. 2024, 21, 1290–1304. [Google Scholar] [CrossRef]
- Chen, X.; Jin, X.; Zhu, X.; Zhong, N.; Zhang, Z. Origins of organic matter, paleoenvironment, and hydrocarbon potential of the Carboniferous source rocks from Shibei Sag, Junggar Basin, NW China. ACS Earth Space Chem. 2022, 7, 92–109. [Google Scholar] [CrossRef]
- Li, Z.; Tang, L.; Ding, W. Fault characteristic analysis for the hinterland of Junggar basin. Pet. Explor. Dev. 2002, 29, 40–43. [Google Scholar]
- Shi, Q.S. Evaluation of theoretical CO2 storage potential capacity in Tarim, Junggar and Turpan—Hagar basins of Xinjiang under carbon neutrality constraints. Environ. Sustain. Dev. 2021, 46, 99–105. [Google Scholar] [CrossRef]
- Lee, P.; Tang, H.; Yan, X.; Zhang, S.; Zhang, Z.; Liu, H. Laboratory Evaluation on the Water Flooding Characteristics in Bottom Water Reservoir Containing Interbeds. ACS Omega 2023, 8, 42409–42416. [Google Scholar] [CrossRef]
- Li, Y.; Tan, J.; Mou, S.; Liu, C.; Yang, D. Experimental study on waterflooding development of low-amplitude reservoir with big bottom water. J. Pet. Explor. Prod. Technol. 2021, 11, 4131–4146. [Google Scholar] [CrossRef]
- Wang, K.; Li, K.; Zhou, W.; Zhu, G.; Pan, Y.; Fan, H.; Gao, Y.; Tang, J.; Xu, L.; You, Q. Quantitative evaluation on the evolution of water cone behavior in a heavy oil reservoir with bottom Water. J. Energy Resour. Technol. 2020, 142, 063004. [Google Scholar] [CrossRef]
- Jia, X.; Sun, Z.; Lei, G.; Yao, C. Model for Predicting Horizontal Well Transient Productivity in the Bottom-Water Reservoir with Finite Water Bodies. Energies 2023, 16, 1952. [Google Scholar] [CrossRef]
- Wang, K.; Li, K.; Gao, Y.; Pan, Y.; Zhang, X.; You, Q. Research on water cone behavior in a heavy oil reservoir with bottom water considering the starting pressure gradient. ACS Omega 2020, 5, 16841–16847. [Google Scholar] [CrossRef]
- Tan, L.; Zhang, N.; Cao, B.B.; An, Y.S.; Xiong, C.C. Research progress on water control completion technology for horizontal wells in bottom water reservoirs in the eastern South China Sea. China Offshore Oil Gas 2024, 36, 137–143. (In Chinese) [Google Scholar] [CrossRef]
- Yu, X.W.; Zhu, M.C.; Li, X.; An, S.H. Study on pressure coning method for secondary bottom water reservoirs. Complex Hydrocarb. Reserv. 2024, 17, 335–341. (In Chinese) [Google Scholar] [CrossRef]
- Wang, K.; Tang, C.; Zhang, T.; Gao, Y.; Zou, J.; Jiang, Y.; Sun, K.; Chen, Y. Theoretical Research on the Movement Law of Water Cone Behavior in Heavy Oil Reservoirs with Bottom Water. Geofluids 2022, 2022, 2954973. [Google Scholar] [CrossRef]
- Zhao, G.; Dai, C.; Gu, C.; You, Q.; Sun, Y. Expandable graphite particles as a novel in-depth steam channeling control agent in heavy oil reservoirs. Chem. Eng. J. 2019, 368, 668–677. [Google Scholar] [CrossRef]
- You, Q.; Wen, Q.; Fang, J.; Guo, M.; Zhang, Q.; Dai, C. Experimental study on lateral flooding for enhanced oil recovery in bottom-water reservoir with high water cut. J. Pet. Sci. Eng. 2019, 174, 747–756. [Google Scholar] [CrossRef]
- Mjaavatten, A.; Aasheim, R.; Saelid, S.; Groenning, O. A model for gas coning and rate-dependent gas/oil ratio in an oil-rim reservoir. SPE Reserv. Eval. Eng. 2008, 11, 842–847. [Google Scholar] [CrossRef]
- Kamari, A.; Mohammadi, A.H.; Bahadori, A. On the determination of breakthrough time for water coning phenomenon in oil reservoirs. Pet. Sci. Technol. 2016, 34, 44–49. [Google Scholar] [CrossRef]
- Zhang, N.; An, Y.; Huo, R. Research on Production Performance Prediction Model of Horizontal Wells Completed with AICDs in Bottom Water Reservoirs. Energies 2023, 16, 2602. [Google Scholar] [CrossRef]
- Yuan, H.; Li, W.; Yuan, Y.; Luo, J.; Yan, W. Productivity evaluation of horizontal well in heterogeneous reservoir with composite water aquifer. J. Pet. Explor. Prod. Technol. 2021, 11, 1363–1373. [Google Scholar] [CrossRef]
- Wang, B.J.; Zhang, Y.B.; Wang, W.; Lv, J.L.; Bao, W.B.; Xia, H.; Li, Y.Y.; Wang, N. Application status and development prospect of polymer gel in oil fields. Contemp. Chem. Ind. 2020, 49, 2286–2289. (In Chinese) [Google Scholar] [CrossRef]
- Tang, Y.; Wang, R.; Li, Z.; Cui, M.; Lun, Z.; Lu, Y. Experimental study on spontaneous imbibition of CO2-rich brine in tight oil reservoirs. Energy Fuels 2019, 33, 7604–7613. [Google Scholar] [CrossRef]
- Zheng, W.; Feng, Y.; Tan, X.; Yang, R.; Liu, H.; Xie, H.; Wang, T. Feasibility investigation on the N2 injection process to control water coning in edge water heavy oil reservoirs. Front. Earth Sci. 2022, 9, 825253. [Google Scholar] [CrossRef]
- Dong, X.; Liu, H.; Chen, Z.; Wu, K.; Lu, N.; Zhang, Q. Enhanced oil recovery techniques for heavy oil and oilsands reservoirs after steam injection. Appl. Energy 2019, 239, 1190–1211. [Google Scholar] [CrossRef]
- Pang, Z.X.; Cheng, L.S.; Xu, J.F.; Feng, R.-Y. Application of material balance method to nitrogen anti-water-coning technology. Pet. Explor. Dev. 2008, 35, 234–238. [Google Scholar] [CrossRef]
- Wang, Y.; Liu, H.; Chen, Z.; Wu, Z.; Pang, Z.; Dong, X.; Chen, F. A visualized investigation on the mechanisms of anti-water coning process using nitrogen injection in horizontal wells. J. Pet. Sci. Eng. 2018, 166, 636–649. [Google Scholar] [CrossRef]
- Wojtanowicz, A.K.; Xu, H.; Bassiouni, Z. Oilwell Coning Control Using Dual Completion with Tailpipe Water Sink; Society of Petroleum Engineers: Oklahoma City, Oklahoma, 1991. [Google Scholar] [CrossRef]
- Wojtanowicz, A.K.; Shirman, E.I.; Kurban, H. Downhole Water Sink (DWS) Completion Enhance Oil Recovery in Reservoirs with Water Coning Problem; Society of Petroleum Engineers: Houston, TX, USA, 1999. [Google Scholar] [CrossRef]
- Zeynolabedini, M.; Assareh, M. Development of an effective design for a down-hole water sink to control water in oil production wells. Clean. Eng. Technol. 2021, 2, 100072. [Google Scholar] [CrossRef]
- Al-Mudhafar, W.J.; Wood, D.A. Development and simulation of the gas-downhole water sink-assisted gravity drainage (GDWS-AGD) process to reduce carbon footprint and improve clean oil production by injecting CO2 and petroleum-associated gas. J. Clean. Prod. 2024, 464, 142792. [Google Scholar] [CrossRef]


Disclaimer/Publisher’s Note: The statements, opinions and data contained in all publications are solely those of the individual author(s) and contributor(s) and not of MDPI and/or the editor(s). MDPI and/or the editor(s) disclaim responsibility for any injury to people or property resulting from any ideas, methods, instructions or products referred to in the content. |
© 2025 by the authors. Licensee MDPI, Basel, Switzerland. This article is an open access article distributed under the terms and conditions of the Creative Commons Attribution (CC BY) license.